1. Introduction
The definition of a river, commonly given as a natural long and narrow zone in which fresh water flows down due to gravity, is ambiguous from the hydrological point of view because flow rate variation is not considered.
Natural river terrain on alluvial lowland is generally composed of a waterway that overflows at an average recurrence interval of approximately one to three years (e.g., Refs. [
1,
2]) and a floodplain formed by the sediment discharged from the waterway during overflow events. The latter is regarded as a river area during large rain runoff events. The floodplain surface contains nutrient-rich fine sediment and thus has long been used for farming (especially paddy fields). Villages and main roads were traditionally located on relatively high land, such as natural levees in the floodplains and river terraces adjacent to the floodplains.
However, more recently, transportation routes and cities have been built on floodplains, increasing the potential for flood disaster. Therefore, modern flood control works define a river as an area somewhat wider than the waterway and try to restrict large rain runoff between the high embankments built at its outer edges. In other words, floodplains and rivers are now separated by man-fabricated levees. Japan’s River Law (1964) stipulates that the outer boundary of a river area is the line of the embankment slope toe at the floodplain side [
3]. Such river channel modifications have significantly changed hydrological processes, especially during large storm water runoff events. The speed of flood propagation and peak flow downstream have both increased, necessitating higher embankments.
In recent years, flood disasters caused by river runoff exceeding the capacity of the channel bounded by embankments (hereafter referred to as excess runoff) have occurred more frequently. In conventional modern river improvement works, embankments are built such that the maximum discharge that corresponds to the appropriate recurrence interval, calculated under the assumption that the occurrence of heavy rainfall follows a stationary stochastic process, can flow safely. However, this assumption might not hold under climate change. In other words, it is necessary to consider a flood control plan for floods that cannot be restricted to the river channel by embankments [
4,
5].
In this study, considering that floodplains were once part of river systems, we explore the use of floodplains as temporary channels to safely carry away excess rain runoff. Such a flood control strategy was generally adopted in pre-modern Japan (e.g., Refs. [
6,
7]), when large-scale embankment construction was not possible. The typical facility was a combination of a flood bypass and a retarding basin which effectively reduced the large flood impact. Based on the same strategy, Ishikawa [
8] and Ito et al. [
9] recently proposed a concept of running water-type retarding basin (RWRB), which is to use floodplains for mitigate an excess runoff in the upstream river system.
Since the width, shape, slope, and land use of floodplains vary depending on the surrounding topography, it is impossible to discuss the flood control strategy as a single entity. Therefore, in this study, we focus on rivers with relatively narrow floodplains, which are common in Japan. First, the characteristics of rivers in Japan and the problems related to current flood control policies, which are centered on continuous levees, are described. The concept of an RWRB is then explained. The causes of recent flood damage that occurred near the Kinu River, a nationally managed Rank A river, are considered and the effects of installing an RWRB in the river basin are examined using numerical flow simulations.
2. Characteristics of Rivers and Flood Control Planning in Japan
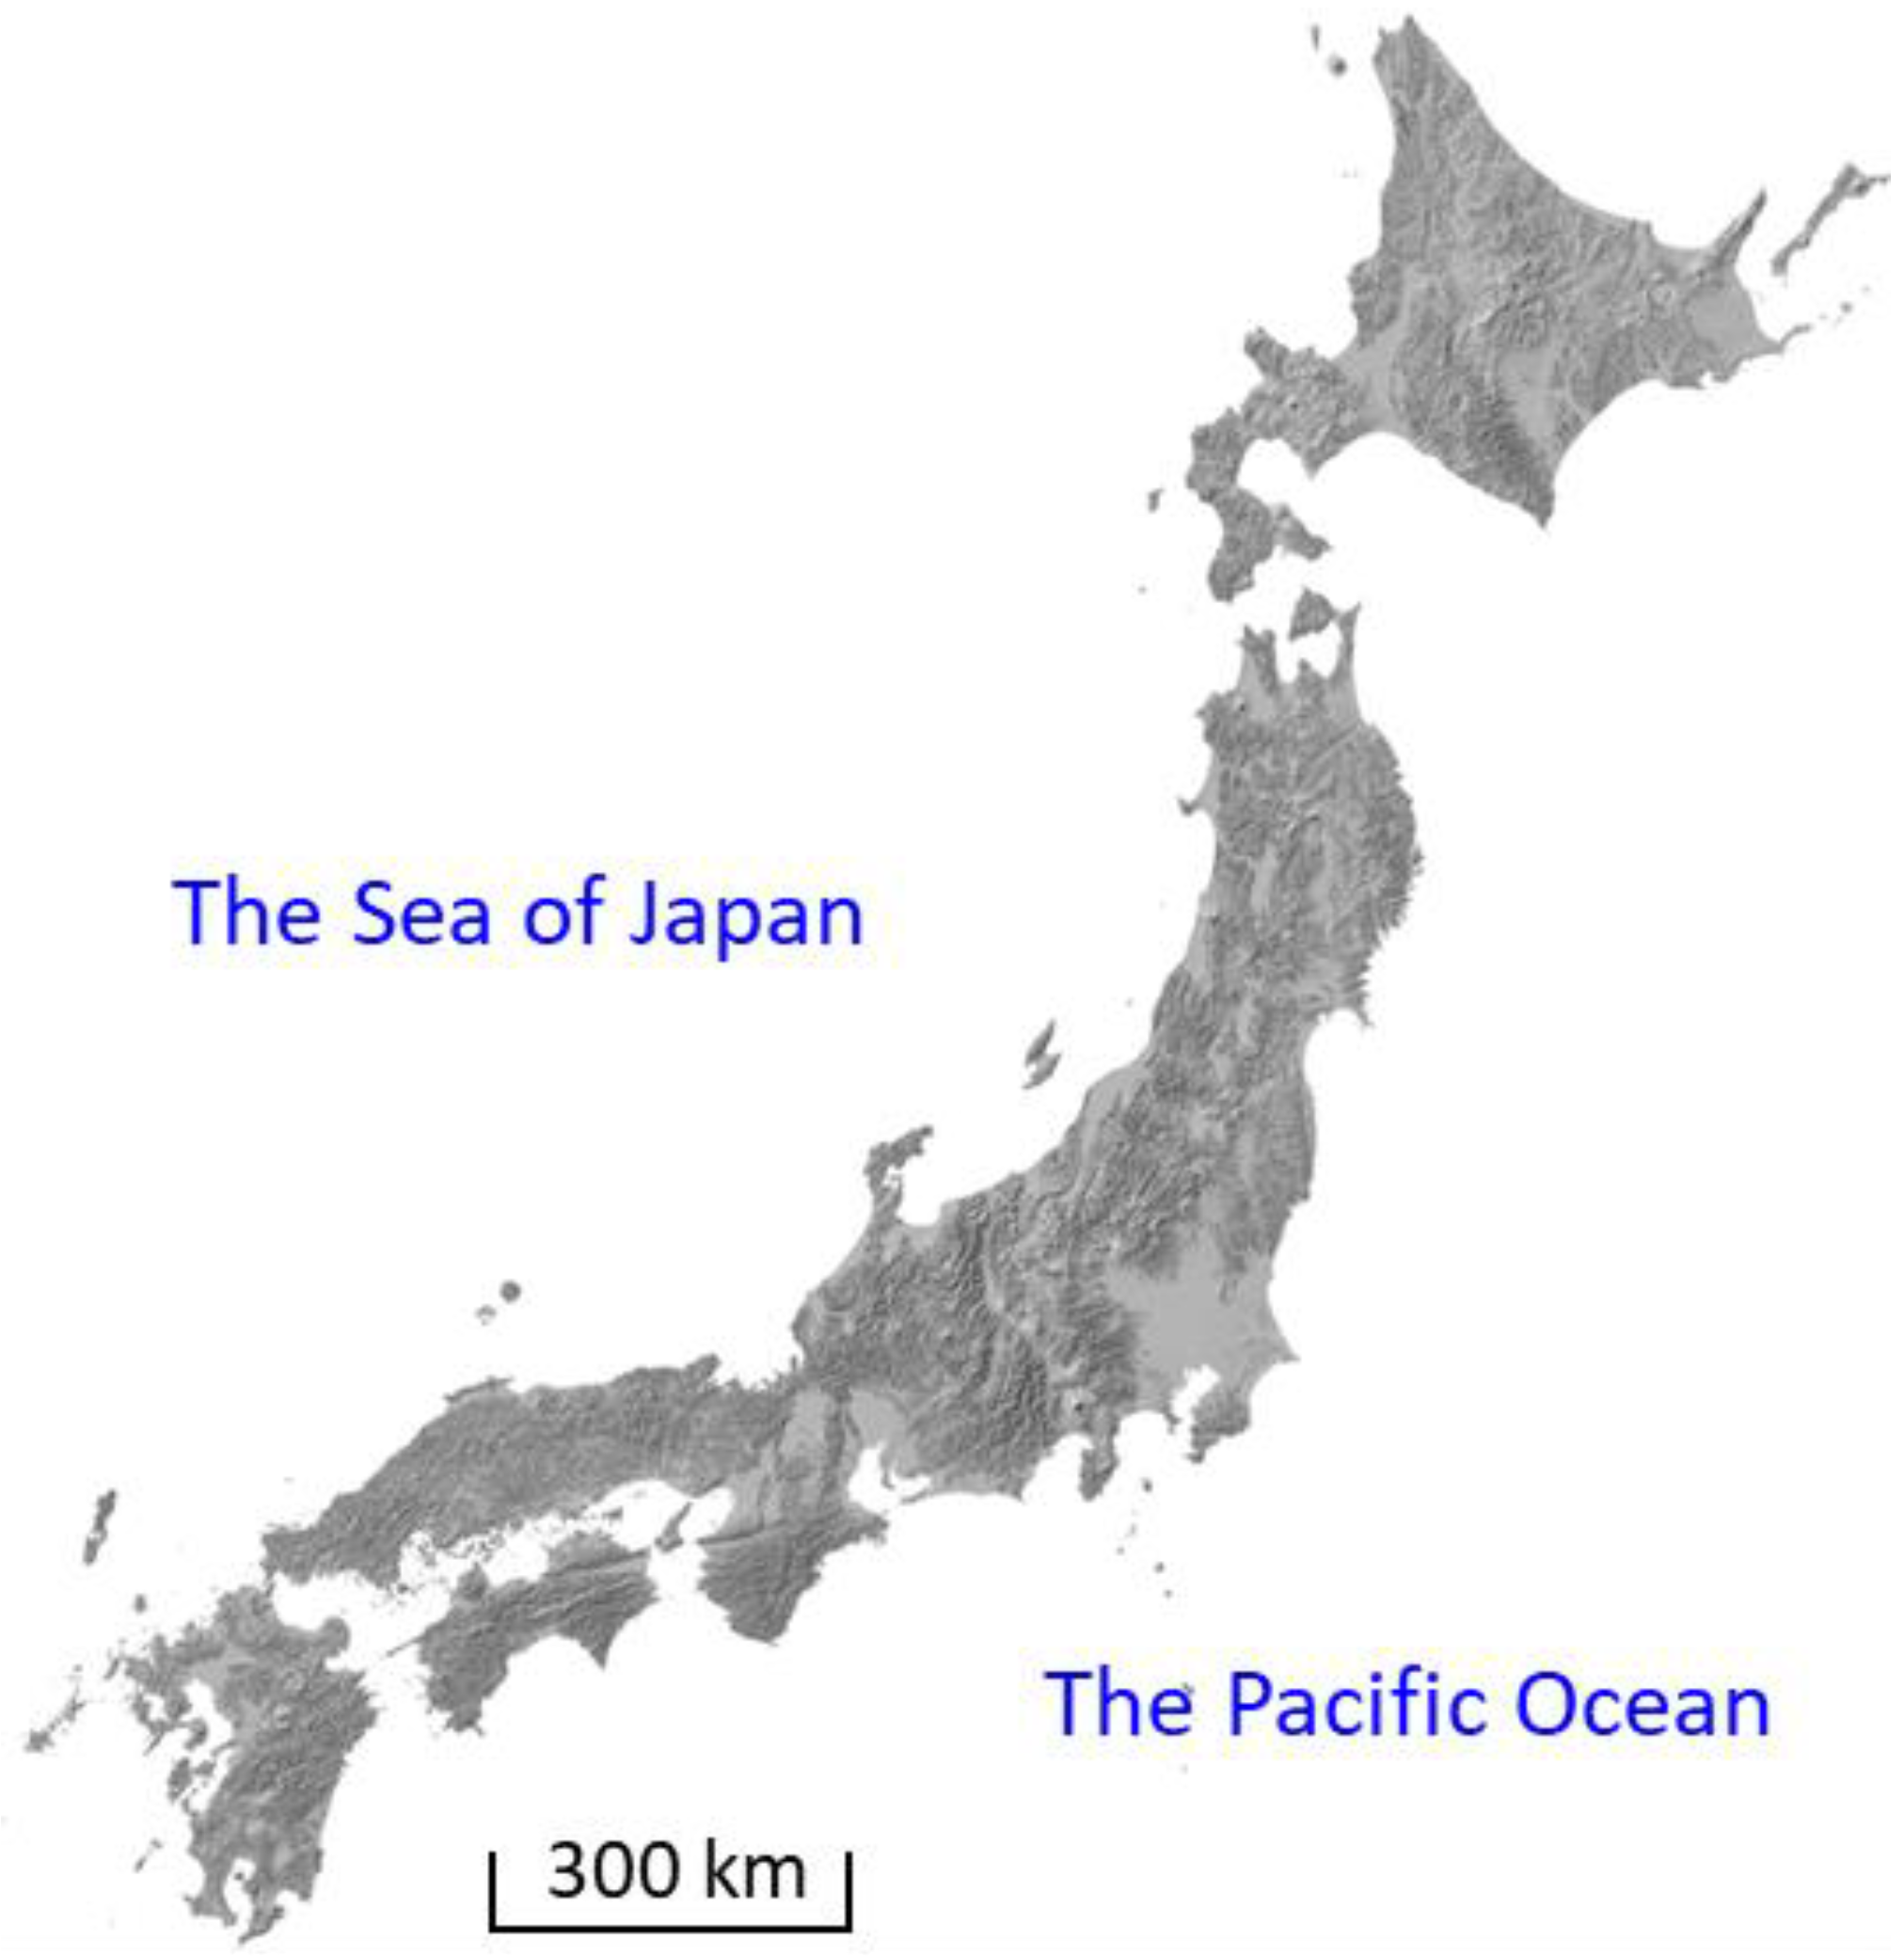
Figure 1 shows a shaded relief map of the main part of the Japanese archipelago [
10]. Considering Japan’s land area, 73% is uninhabitable mountains and hills, 10% is coastal alluvial lowlands, and 12% is classified as intermontane basins and high plateaus. However, the above classification is not strict. For example, on land classified as coastal alluvial lowlands, plateaus are distributed in patches, limiting the extent of the floodplain; in mountain basins and plateaus, belt-shaped floodplains exist along river channels.
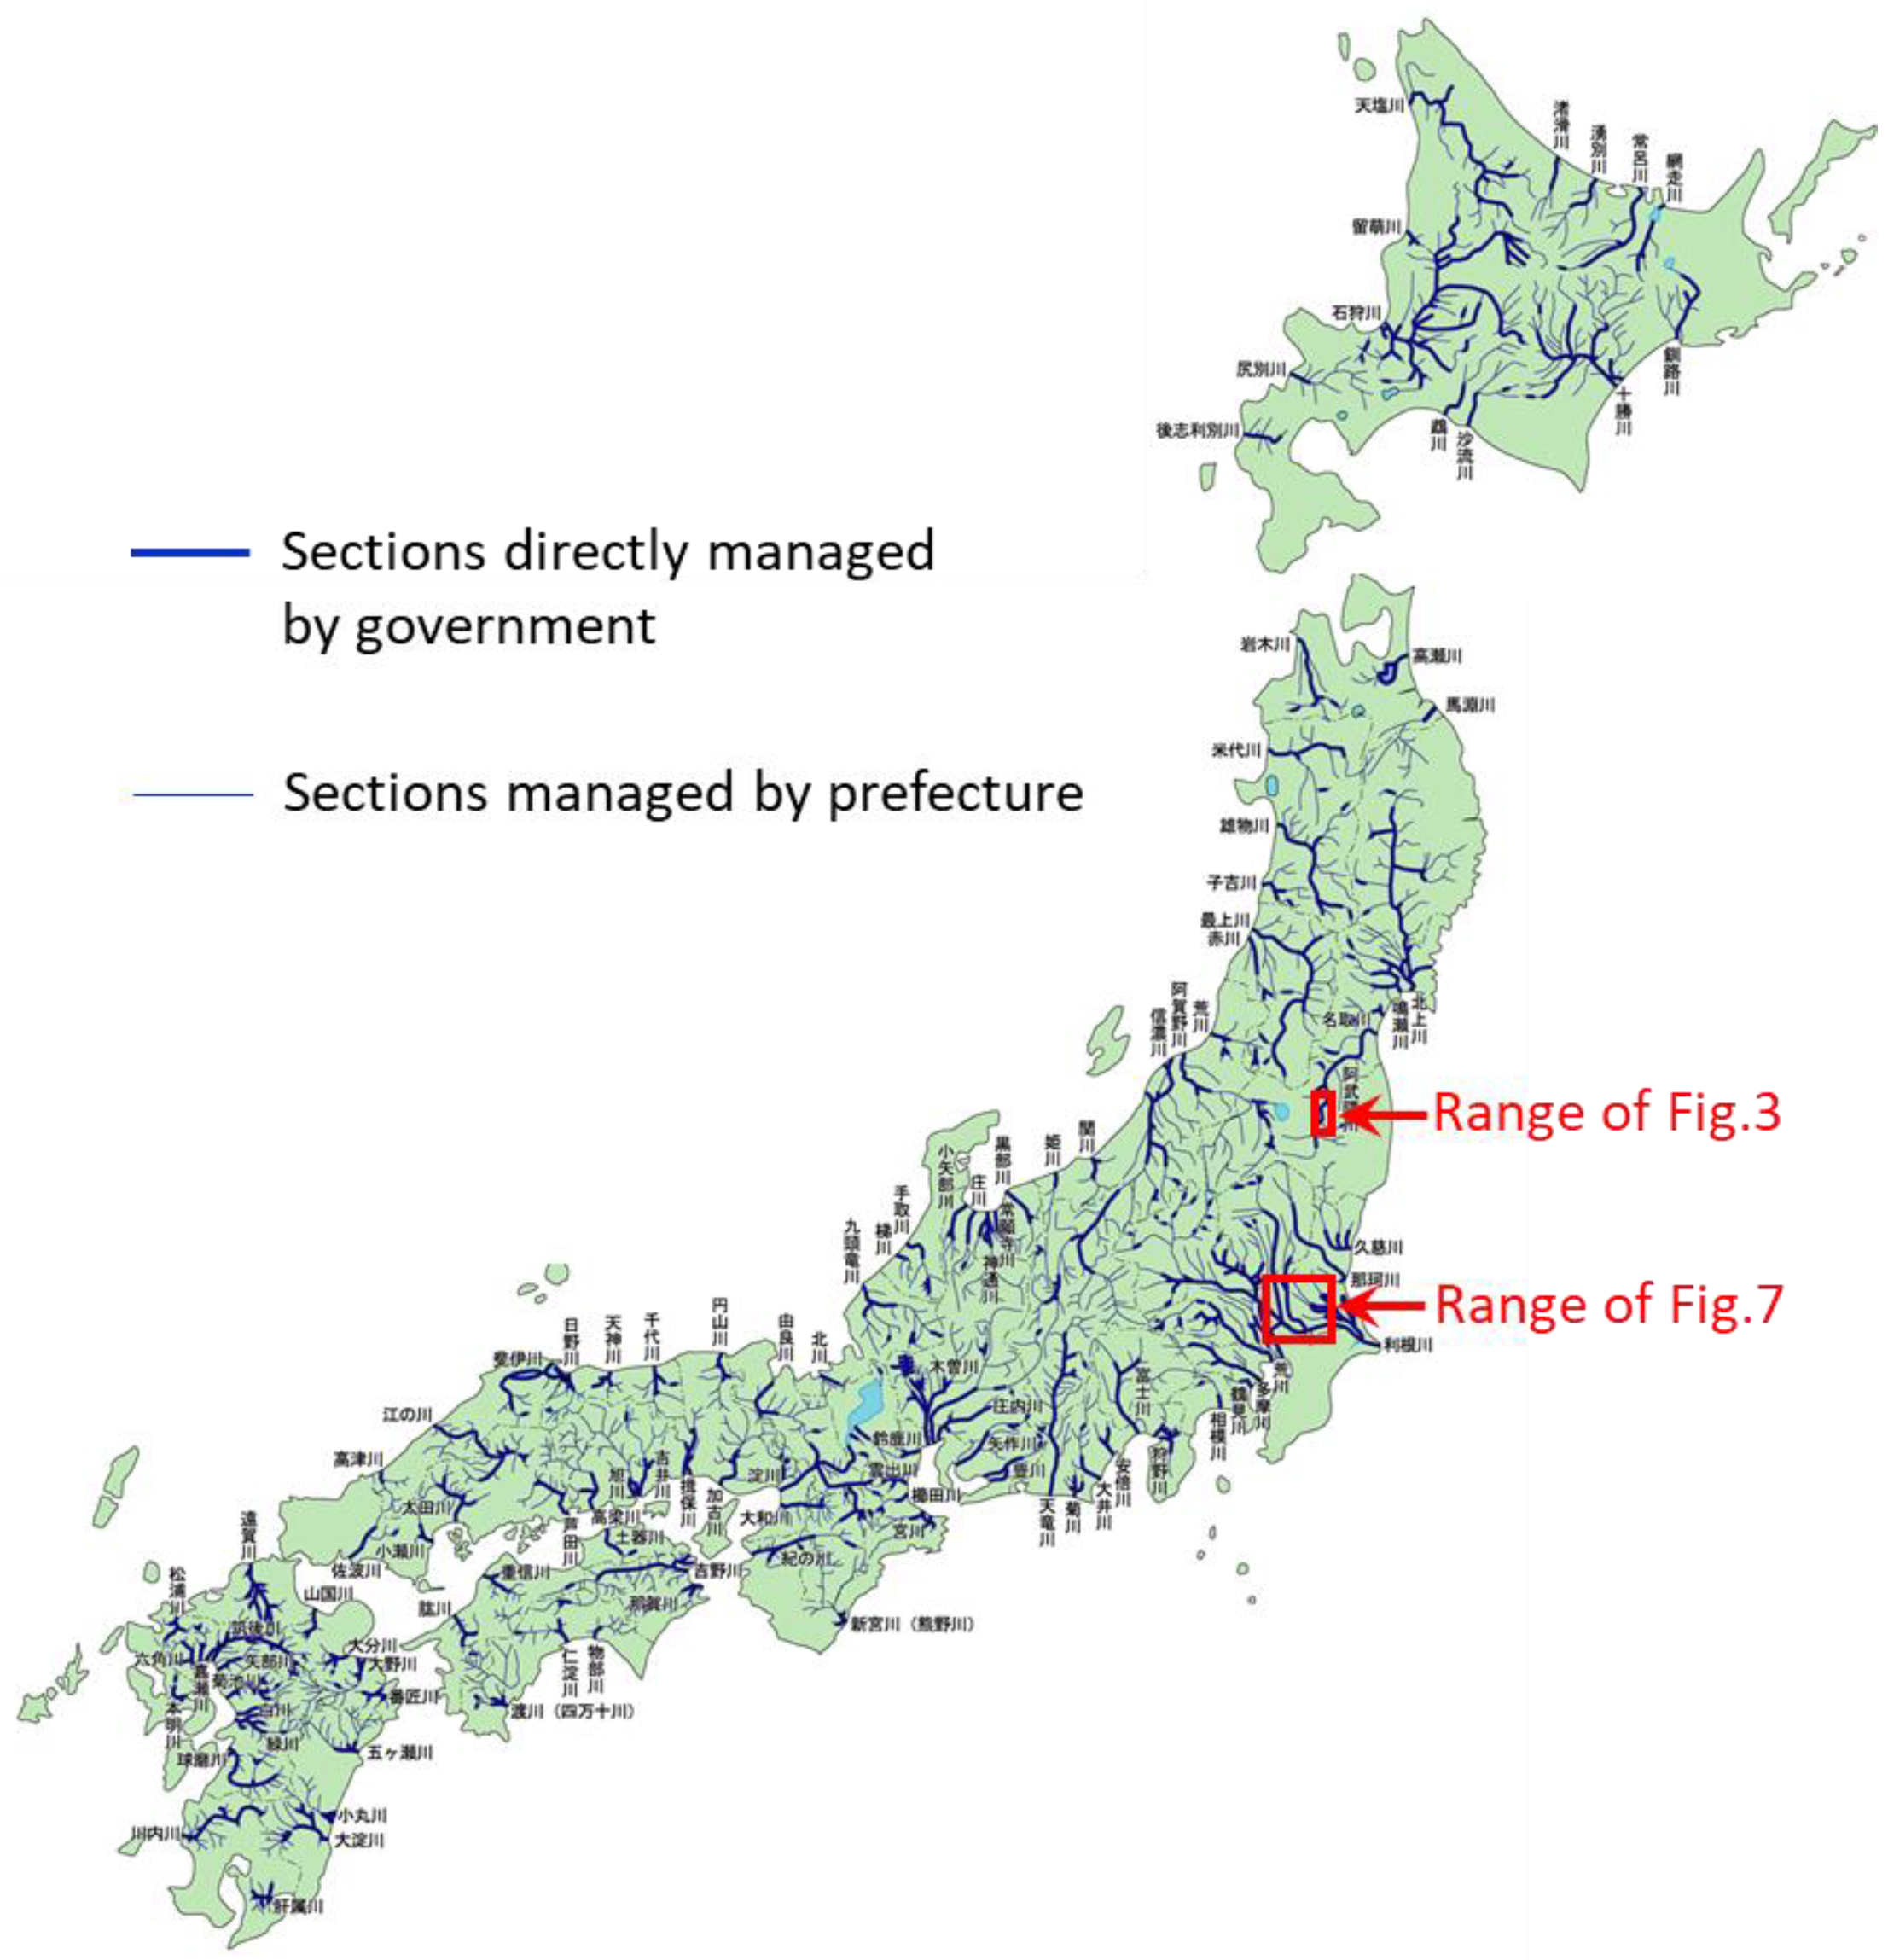
Figure 2 shows the river channels of the 109 first-class river systems designated by the government as especially important for national land conservation or the national economy [
11]. Their total catchment area covers 65% of the land in Japan. The target safety level in flood control plans for first-class river systems is an annual probability of flood occurrence of 1/100, 1/150, or 1/200 (Annual average occurrence probability of the relevant discharge obtained from statistical processing of rainfall data) depending on the importance of the water system. This probability is estimated from the existing rainfall and runoff data under the assumption of stochastic stationarity for flood occurrence. In
Figure 2, the thick lines indicate the river sections directly managed by the national government (Rank A river section) and the thin lines indicate upstream and tributary sections managed by prefectures (Rank B river section). A river system entirely managed by a prefecture is called a second-class river system, the river channels of which are classified as a Rank B river section. In Japan, the total length of Rank A river sections is 11,000 km and that of Rank B river sections is 153,000 km.
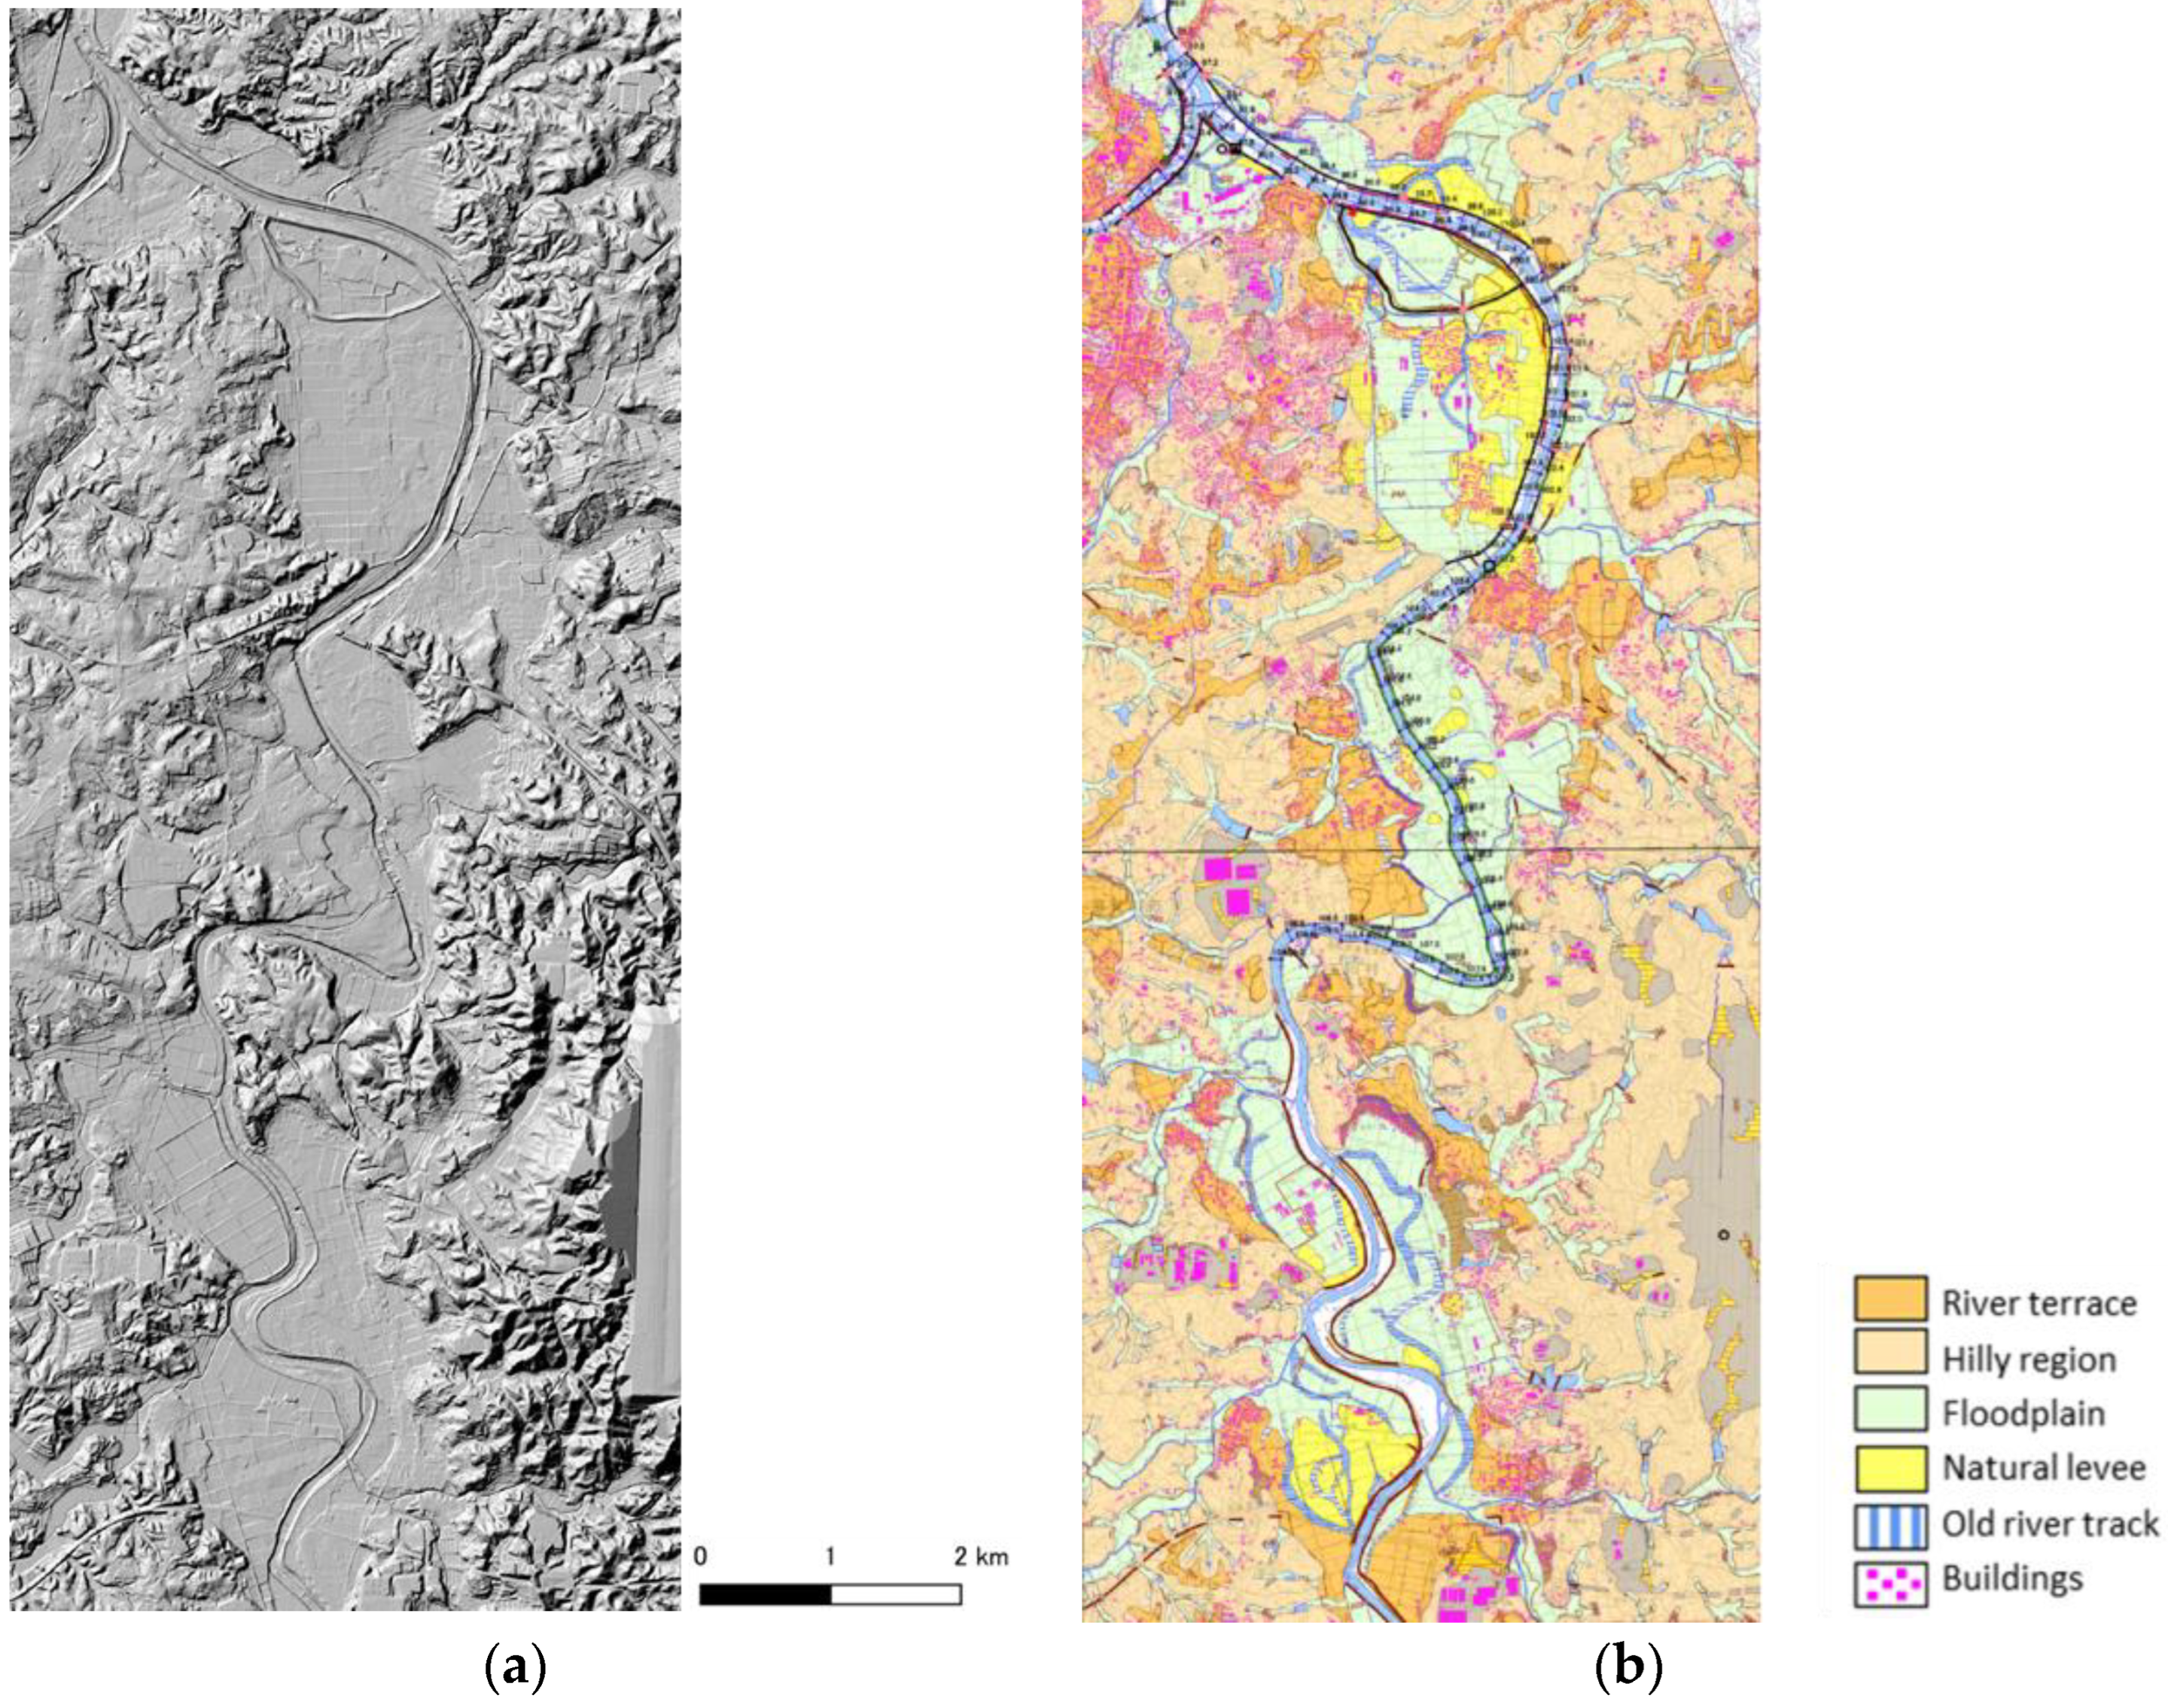
Figure 3 shows an example of the upstream section topography of a Rank A river named the Abukuma River, the location of which is marked with a red square in
Figure 2.
Figure 3a shows a shaded relief map and
Figure 3b shows a flood control landform classification map for the purpose of flood control planning [
10]. As shown, a river channel in a long and narrow lowland is bounded by mountains and river terraces, with embankments built on both sides of the channel. Houses are located on river terraces (brown) and natural embankments (yellow), and floodplains (light green) are mainly used as paddy fields. The land protected by the embankments is a narrow paddy area, suggesting poor cost–benefit performance for embankment building. This figure also shows a large number of closed floodplains surrounded by embankments and river terraces. If a levee breaks, a large inundation may continue because of the lack of an outlet for floodwater. This situation generally occurs in the middle and upper reaches of Rank A rivers.
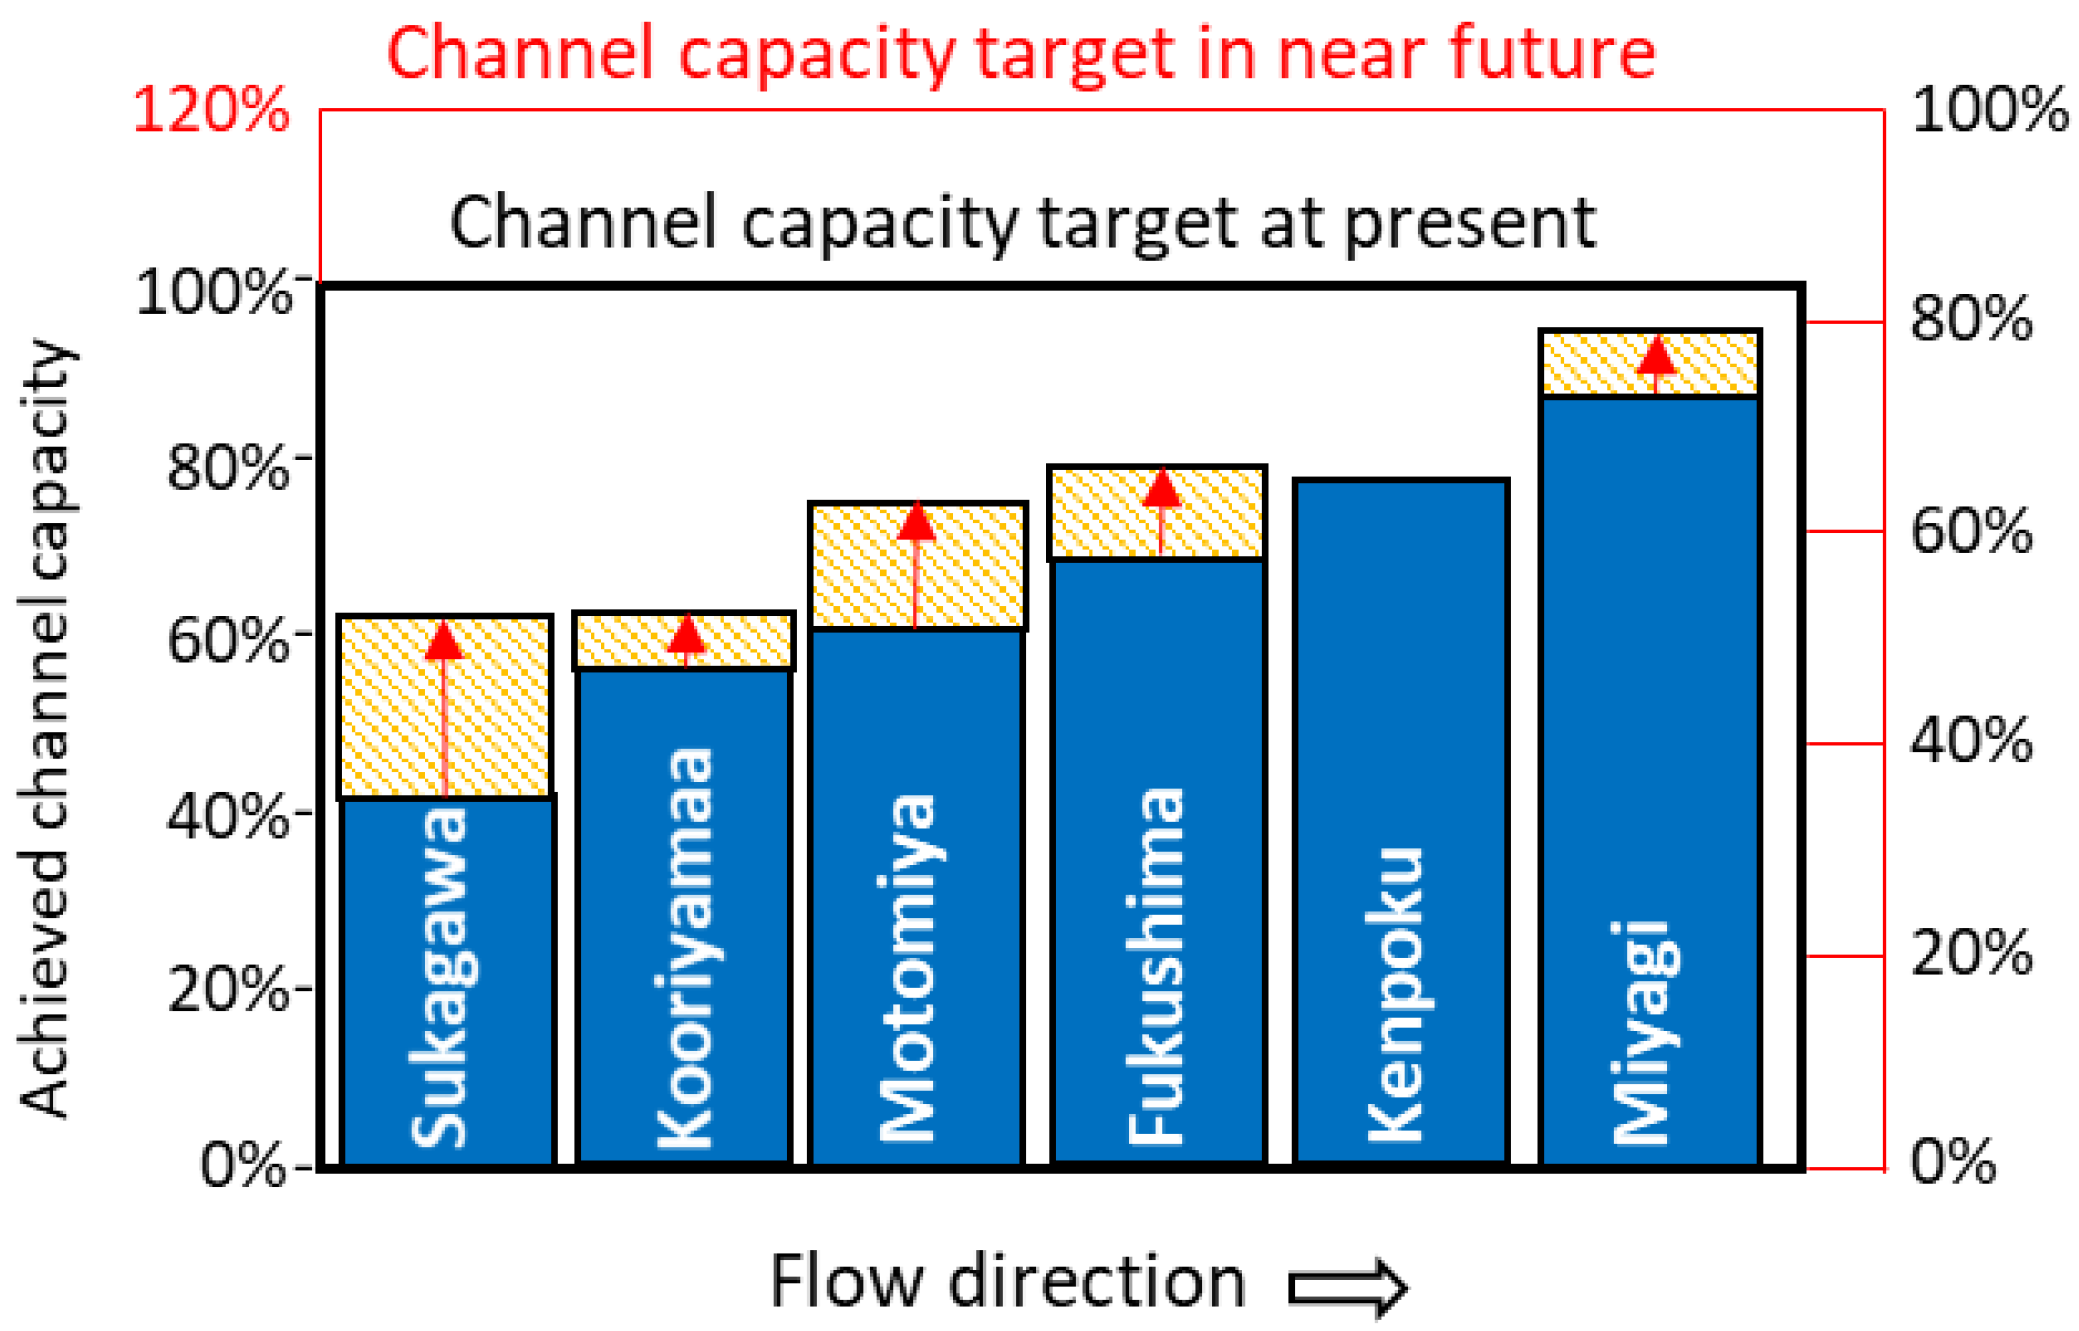
Figure 4 shows the longitudinal distribution of the river channel capacity improvement achieved by a first-stage project currently underway on the Abukuma River [
12]. On the vertical axis on the left-hand side, the target of the final plan is indicated by “100%”. The blue bars are the values at the start of the project (in 2005) and the orange bars with red arrows are the projected increases until the completion of the project (in 2035). The longitudinal average improved from 65% to 75%, but the amount of work remaining (from the top of a bar to the 100% level) is large. The river section shown in
Figure 3 corresponds to Sukagawa, the most upstream point in the graph, where the channel capacity improvement is much lower than that for the downstream section. From the perspective of fairness of public works, the target safety level for Rank A river reach of each first-class river system is generally constant. In practice, however, because the river improvement works are carried out from downstream to upstream, the completion rate of levees is generally lower in the mid-upstream farming land than in the downstream urban area.
The Japanese government is currently revising flood control targets in preparation for an increase in torrential rain disasters due to global warming. The required river channel flow capacity is expected to increase by about 20% [
13]. In
Figure 4, the target for this case is shown on the vertical axis on the right-hand side; it indicates that an even larger proportion of the river improvement works needs to be completed. Because the above-mentioned 20% increase is based on RCP 2.6, the most optimistic global warming scenario in the IPCC Fifth Assessment Report 2013, the required river channel capacity may further increase in the future. This suggests that the current flood control strategy of building embankments to hold back floodwater is not economically viable. Therefore, it is important to deal with rain runoff that exceeds the river channel capacity.
3. Concept of RWRB
3.1. Background
The necessity and effectiveness of connecting river channels and floodplains was recently discussed in terms of green infrastructure for the preservation of natural ecosystems as well as flood control (e.g., Refs. [
14,
15]). However, the proposed schemes target the fairly wide floodplains of continental rivers, where it would be possible to significantly move the position of the embankments to include the flood fringe area of less frequent inundation into the area between them.
In Japan, in contrast, most of the floodplains are narrow (see
Figure 3), and are intensively used for rice cultivation except for the coastal plains where major cities are located.
Table 1 shows a comparison of the per capita arable land and average farm management scale among Japan, the United States, the European Union, and Australia. These figures and the topographical conditions in Japan suggest that there is very limited potential for flood mitigation and nature preservation in narrow floodplains, which have a high density of small-scale farms.
On the other hand, results of many practical studies on on-site storage of rain in paddy fields (e.g., Refs. [
18,
19,
20,
21]) suggests that the paddy field can have a large flood detention capability if a part of flood is diverged from the river channel.
Lee and Huang [
22] proposed a flood mitigation strategy by lowering embankments adjacent to farmlands without widening the current river channels in Taiwan, where river conditions are similar to those in Japan. Their numerical simulation results showed that longitudinally continuous flood overflow into paddy fields reduces flood risk in downstream urban areas however, they did not mention any social procedure for intentional lowering embankments bordering agricultural land.
In Japan, when using riparian farmland for flood control, the river administrator used to purchase farmland and incorporate it into a river area to construct a retarding basin surrounded by embankments. In that case, the budget for land acquisition is required, but the more serious problem is that the farmers who must leave the land lose their livelihood, because the land suitable for paddy fields on floodplains is almost all occupied by other farmers and there is no alternative land for them.
Recently, therefore, the easement system was introduced to the construction of retarding basins in order to meet both flood mitigation and agricultural continuation (e.g., ref. [
23]). The easement in this case is a kind of private easement that guarantees the interests of the owner of the adjacent land, unlike the easement for nature protection of the floodplain. The river administrator first purchases the land for flood control structures (surrounding embankments and overflow dikes) and becomes the owner of the adjacent land, and acquires the right to use the farmland as a retarding basin. Then, farmers are paid about 30% of the land value of the farmland that will be used as a retarding basin.
From the farmer’s point of view, this payment is understood as an advance payment for compensation for the sometimes damage on the farmland caused by intentional flooding. Therefore, if the damage caused by the accumulation of sediment and driftwood carried by the flood becomes serious, there may be a dispute over compensation (e.g., Ref. [
24]).
The confusion about riparian retarding basins mentioned above originated from the basic concept of conventional flood control planning that the previously defined targeted storm water runoff is allocated to various gray infrastructures (reservoirs, retarding basis, river channels, and flood bypasses). Flood mitigation using riparian paddy field, which was a rather recent idea, can be considered also as an additional measure outside the formal flood control plan. The prediction of future increase in torrential rain due to climate change suggests the need of a rapid paradigm shift toward the flood control planning to deal with floods that exceed the planned scale (excessive floods) separately from the conventional flood control plan [
5]. In other words, a way of thinking similar to that for green infrastructure is necessary; that is, something additional from the conventional viewpoint might be essential from the near future viewpoint.
Based on the above considerations about the social condition in Japan and the topographic condition mentioned in
Section 2, a strategy to increase riparian flood mitigation can be summarized as follows:
- (1)
The river channel carries floodwater up to the target water level (referred as HWL hereafter) specified in the conventional plan (or the phased river improvement plan), but floodwater beyond this level is discharged to rice paddy fields along the riverbank, i.e., there is no difference in target safety level in a sense of river channel capacity. In order to avoid the impact on villages, the overtopping location, overtopping volume, and drainage method are carefully determined in consideration of the microstructure of the topographical conditions and land use of each target basin. In addition, since the proposed facility is for a rare flood event that exceeds the official flood control target, differently from the conventional retarding basin, the land use of the floodplain is basically not changed much.
- (2)
As shown in
Figure 3, the floodplains of Japanese rivers are often semi-closed spaces surrounded by terraces and embankments. Therefore, an efficient and inexpensive flood mitigation system that uses the surrounding terrain and existing embankments must be considered to meet the requirement of construction cost reduction which recently becomes important for public works.
- (3)
Each closed floodplain that serves as a retarding basin is small and the possible water storage depth of the paddy field is also small. In addition, there are villages on natural embankments scattered in the floodplain, so it is not suitable for storing a large amount of flood water. Therefore, the flood mitigation facilities should not be designed to store water, but to mitigate floods by spreading them thin and allowing them to flow slowly. Since there are many small, closed basins, even if the effect at one place is small, the total amount of flood mitigation over many closed basins distributed longitudinally along a river channel can be large enough.
3.2. Description of Proposed Concept
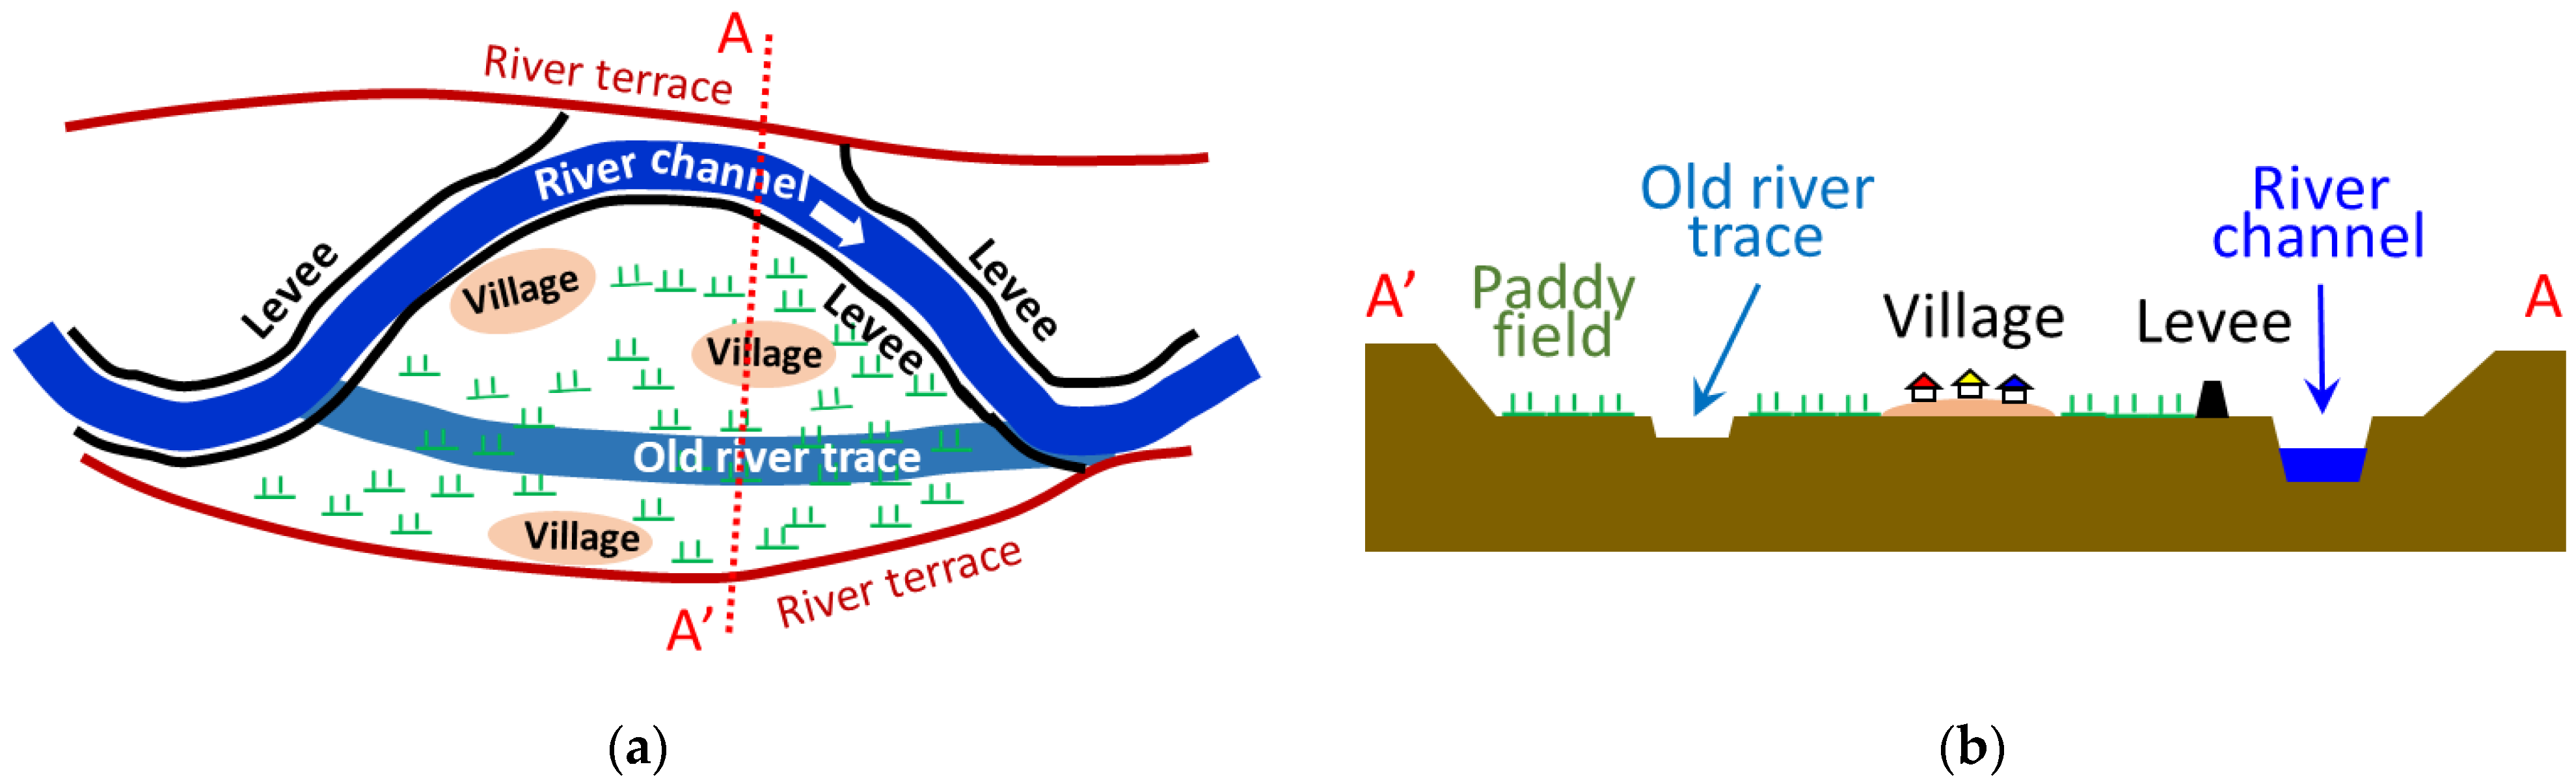
Upstream river channels have historically meandered on floodplains between river terraces, changing course (see
Figure 3). During heavy floods, the river water spreads over the floodplains. More recently, levees were built on both sides of a river channel to reduce the extent of flooding, thus dividing the floodplain into a series of closed areas. In a floodplain, traces of old rivers form a relatively low-lying belt and surrounding areas are used for rice cultivation. Villages sit on natural embankments slightly above the paddy fields.
Figure 5a,b show a schematic plan view of an upstream floodplain and a diagram of its cross section along the line A-A′, respectively.
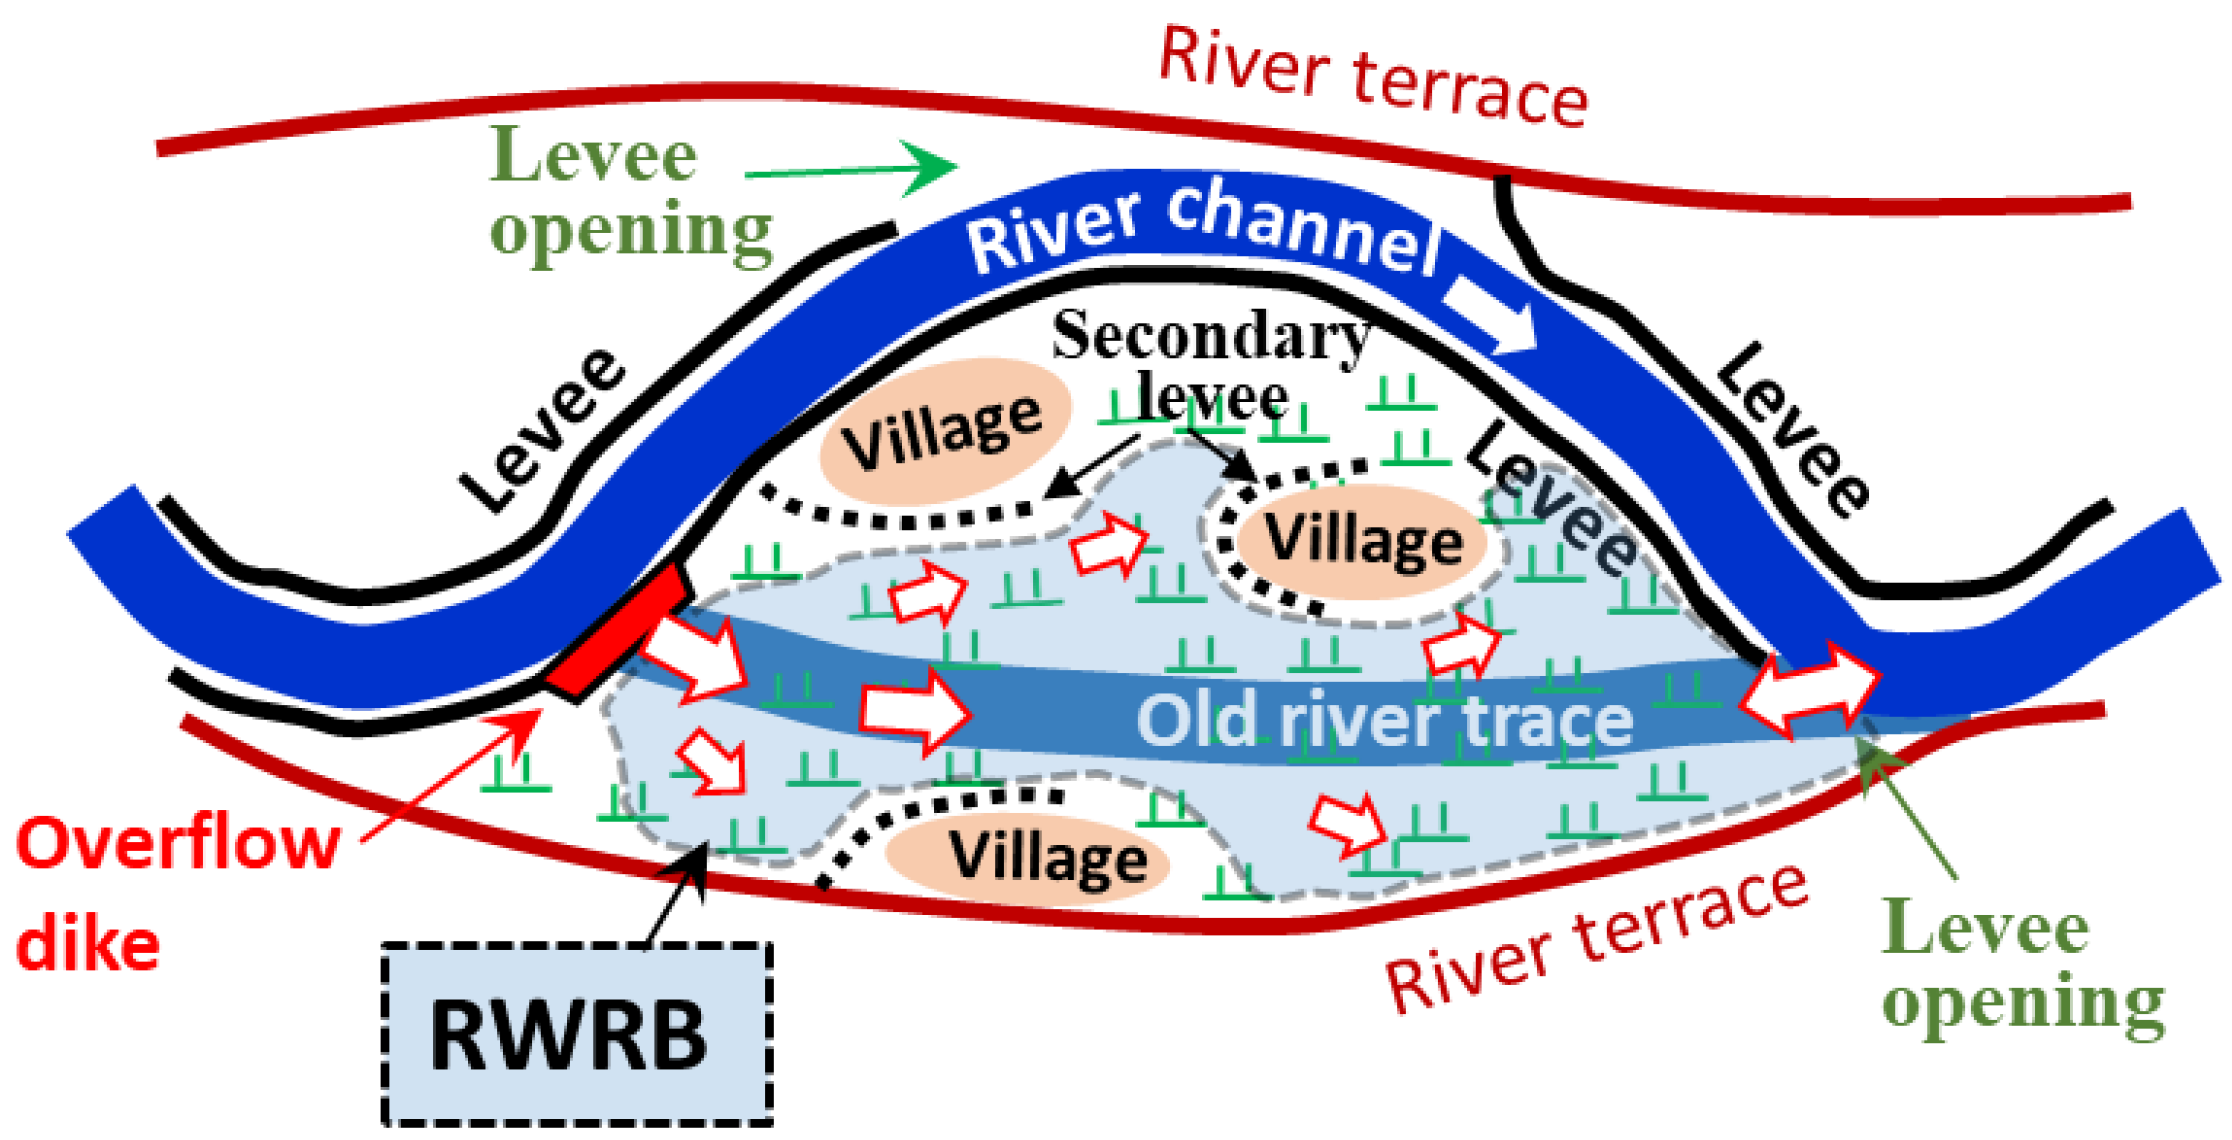
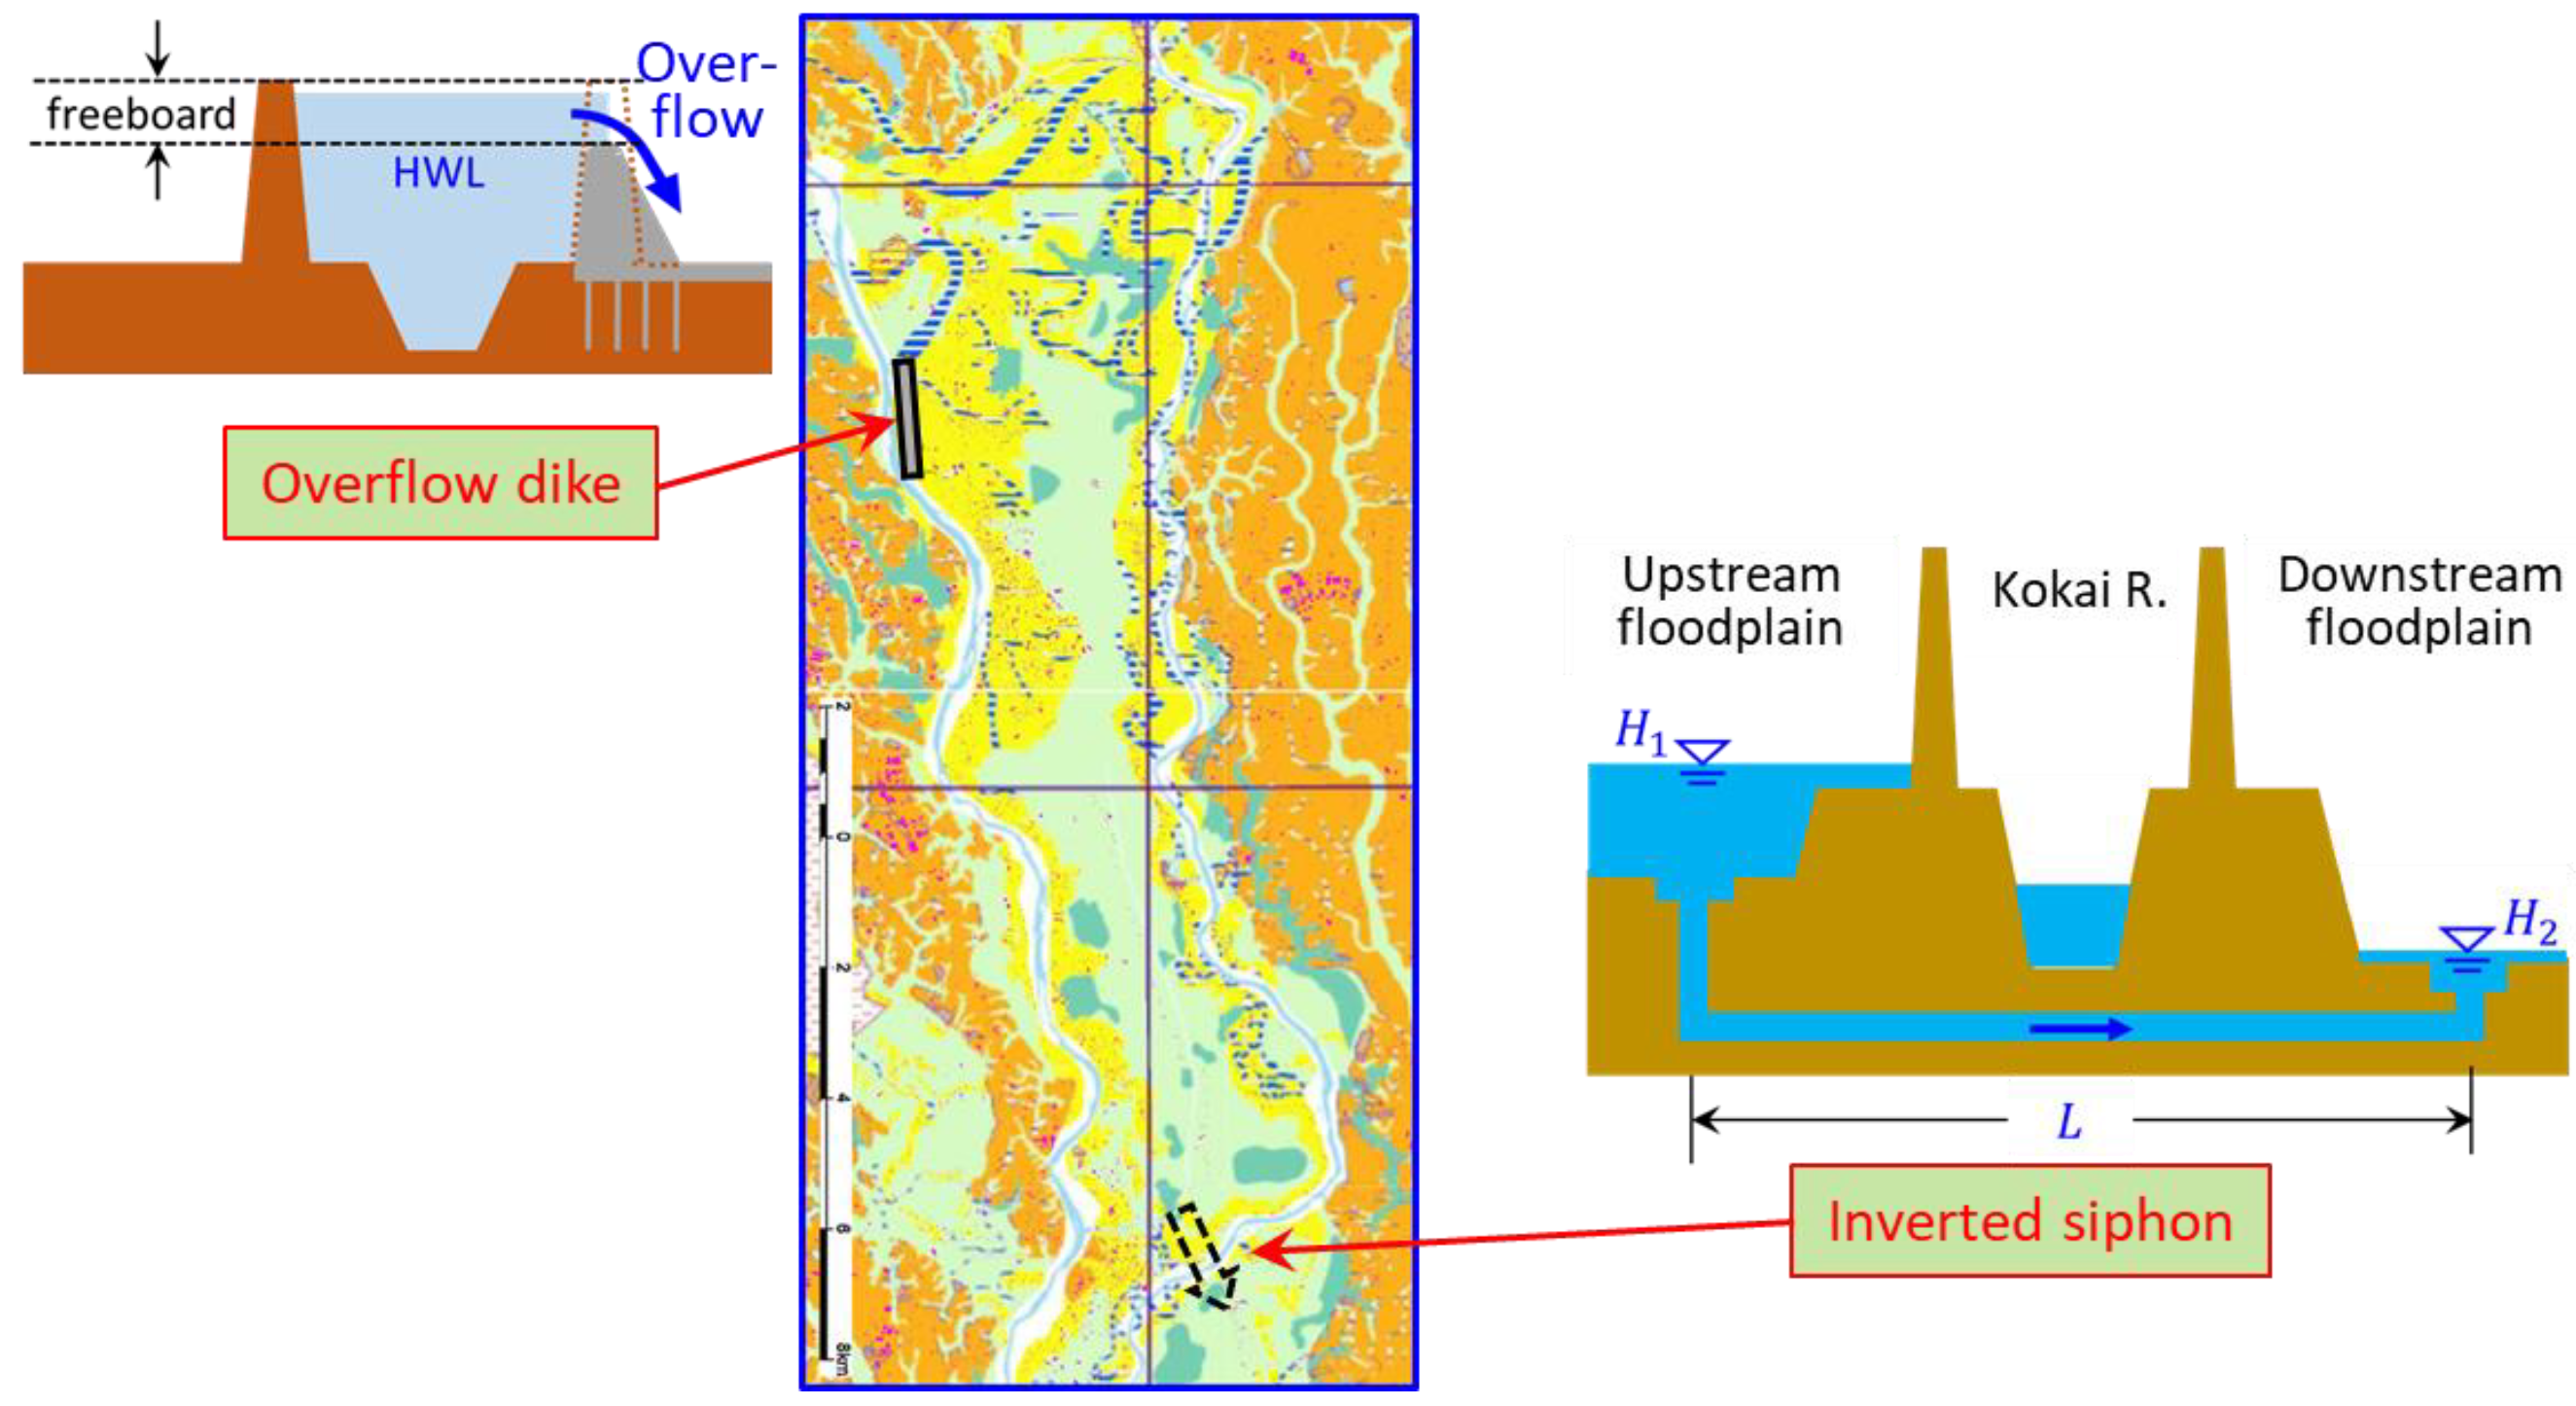
Ishikawa [
8] and Ito et al. [
9] investigated the possibility of restoring the retarding effect of upstream floodplains against excess rain runoff and proposed the concept of an RWRB, which is shown in
Figure 6. An overflow dike is installed near the upstream edge of a closed floodplain, the top of which is set at the design HWL of the levee so that a flood smaller than the channel design discharge does not flow into the floodplain. When the HWL is exceeded, excess water flows into the RWRB and spreads over the paddy fields as shown by white arrows with red lines. Since there is a freeboard of 1 to 1.5 m from the HWL to the crest of the levee, it will not be overtopped unless an extraordinary flood occurs. The levees on the downstream side of the floodplain are opened for the drainage of floodwater. In the flood rising phase, the river water runs up from the opening, but since the ground in the river upstream area is sloping, the range of run-up is small. The stored water also dissipates the energy of flow from the old river traces.
Based on the results of numerical simulations, Ito et al. [
9] concluded that a series of RWRBs are suitable flood control devices for the upper terrain of Japanese rivers. Senoo and Ishikawa [
25] conducted a numerical study on the performance of an RWRB installed in a series of three basins, shown in
Figure 3, and showed that the flood peak of excess runoff could be reduced by 15%.
RWRBs are different from conventional flood retarding basins in the following ways: (1) RWRBs are facilities for rare floods that exceed the target flood discharge of the flood control plan or the current embankment design discharge; (2) RWRBs take advantage of the natural retarding effect caused by the low flow velocity on floodplains; (3) since flooding into RWRBs is rare, the land use and the lives of residents are mostly unchanged.
4. Study Site Description
4.1. Old Kinu River Floodplain
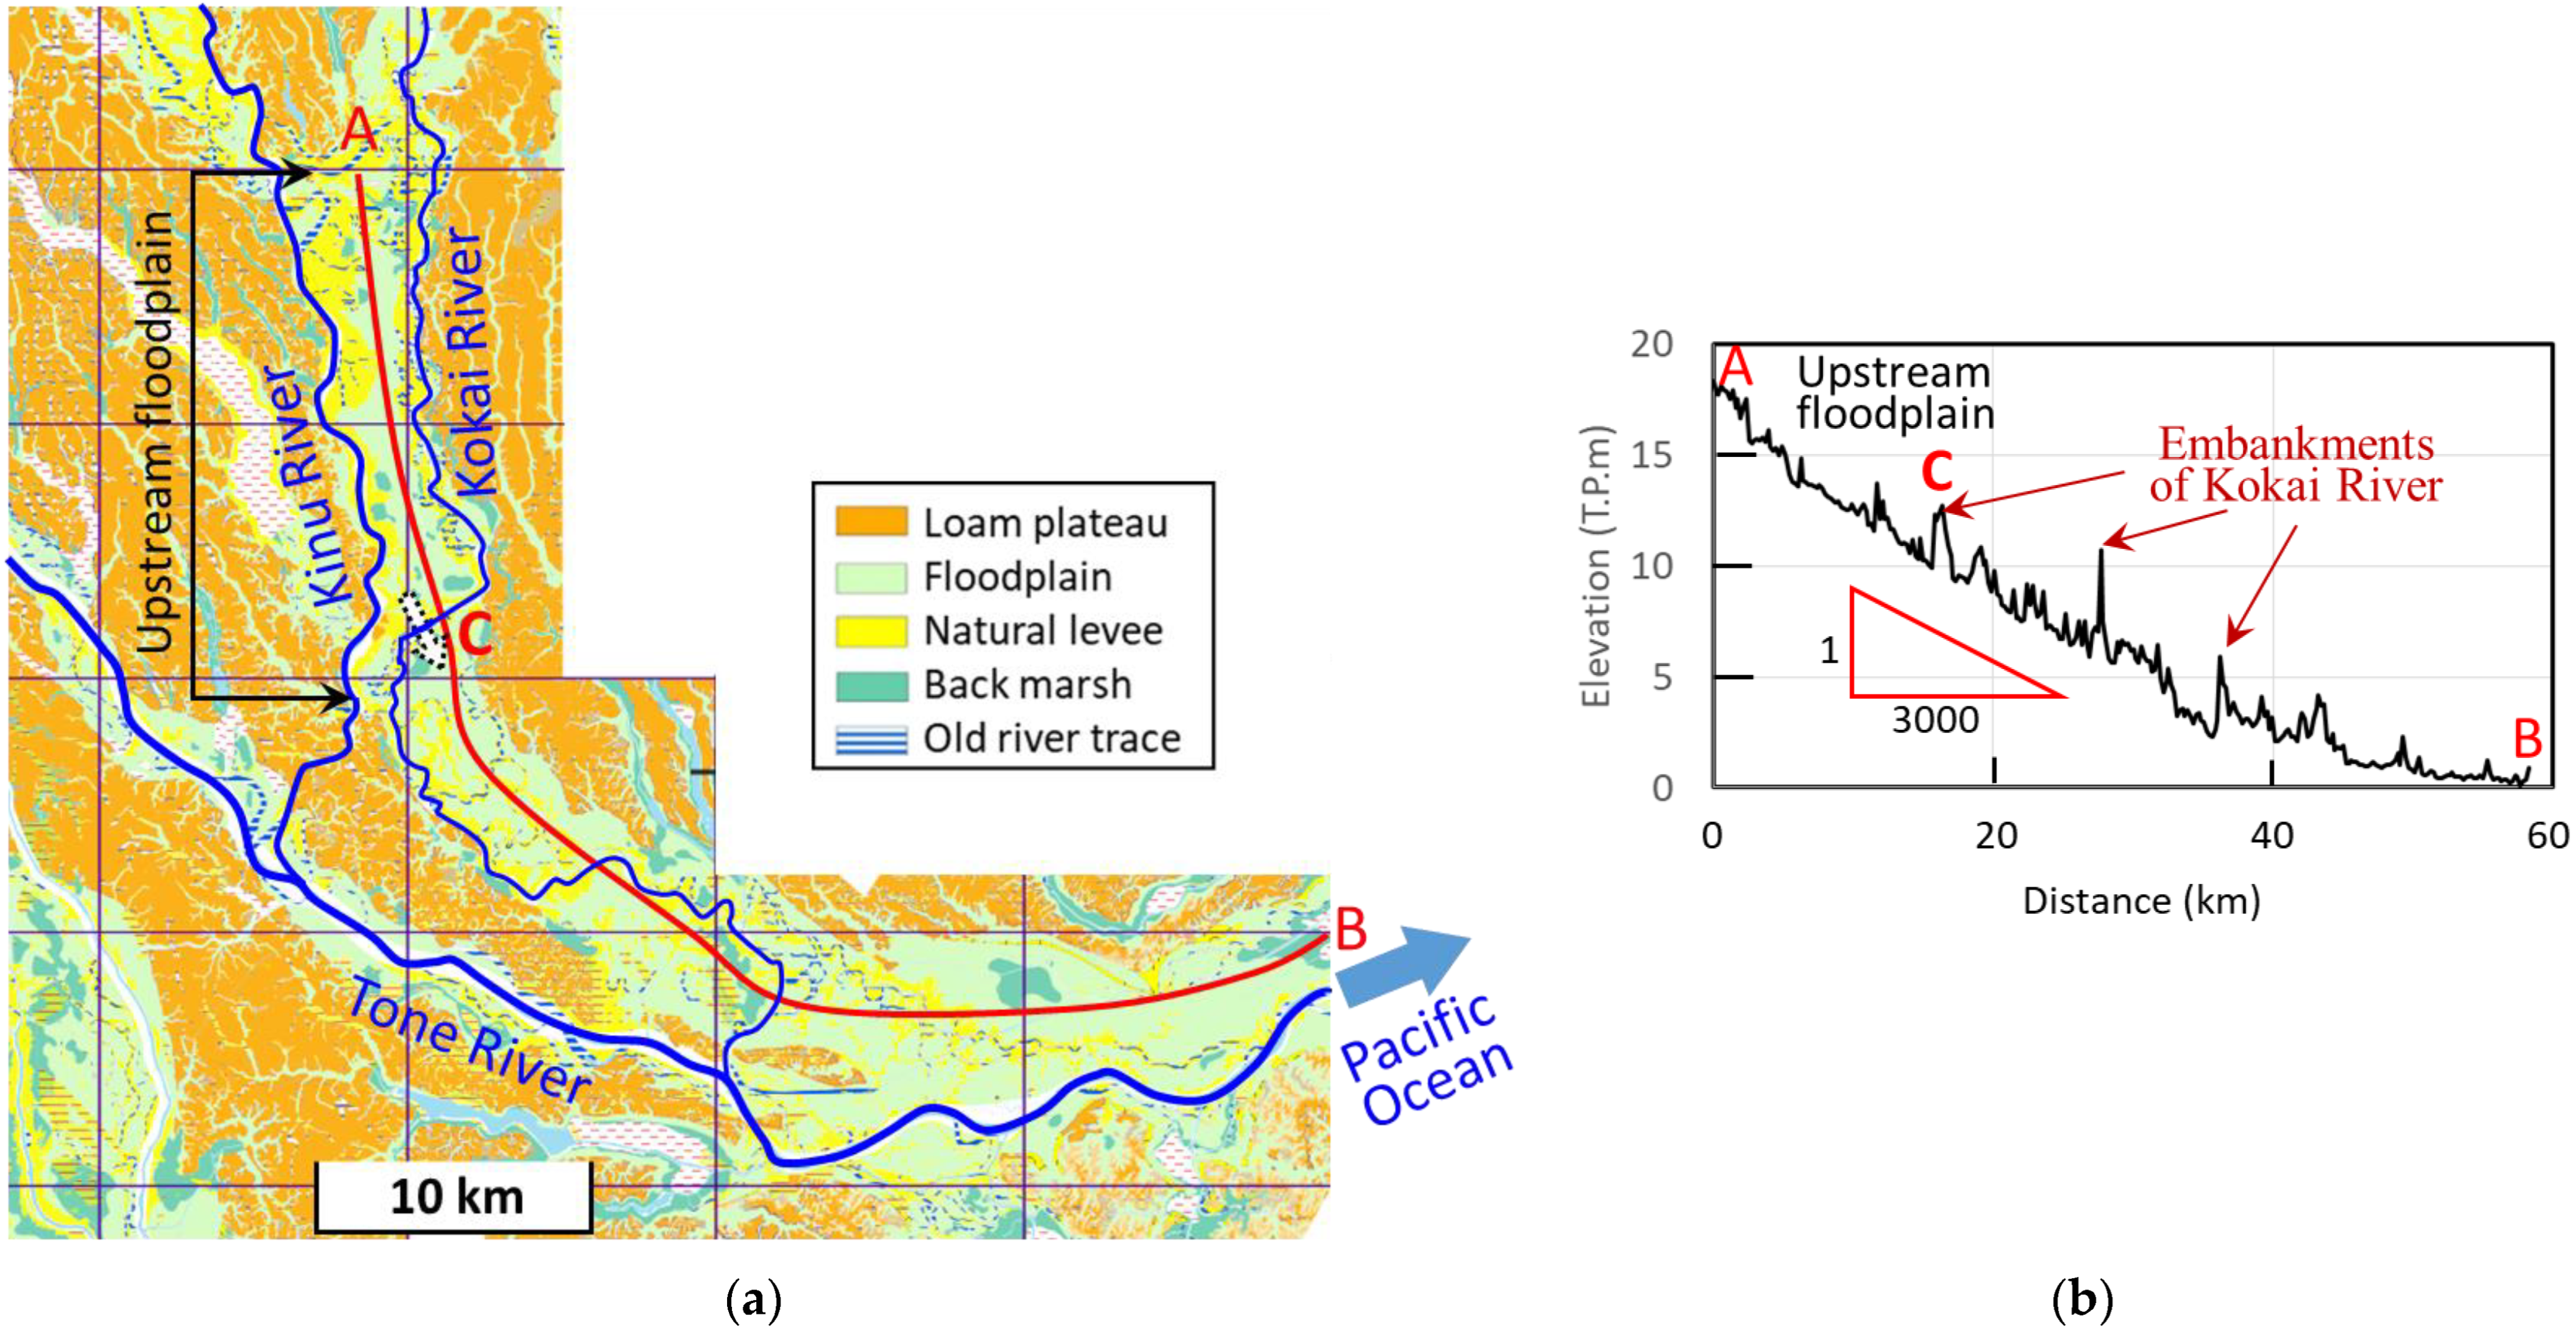
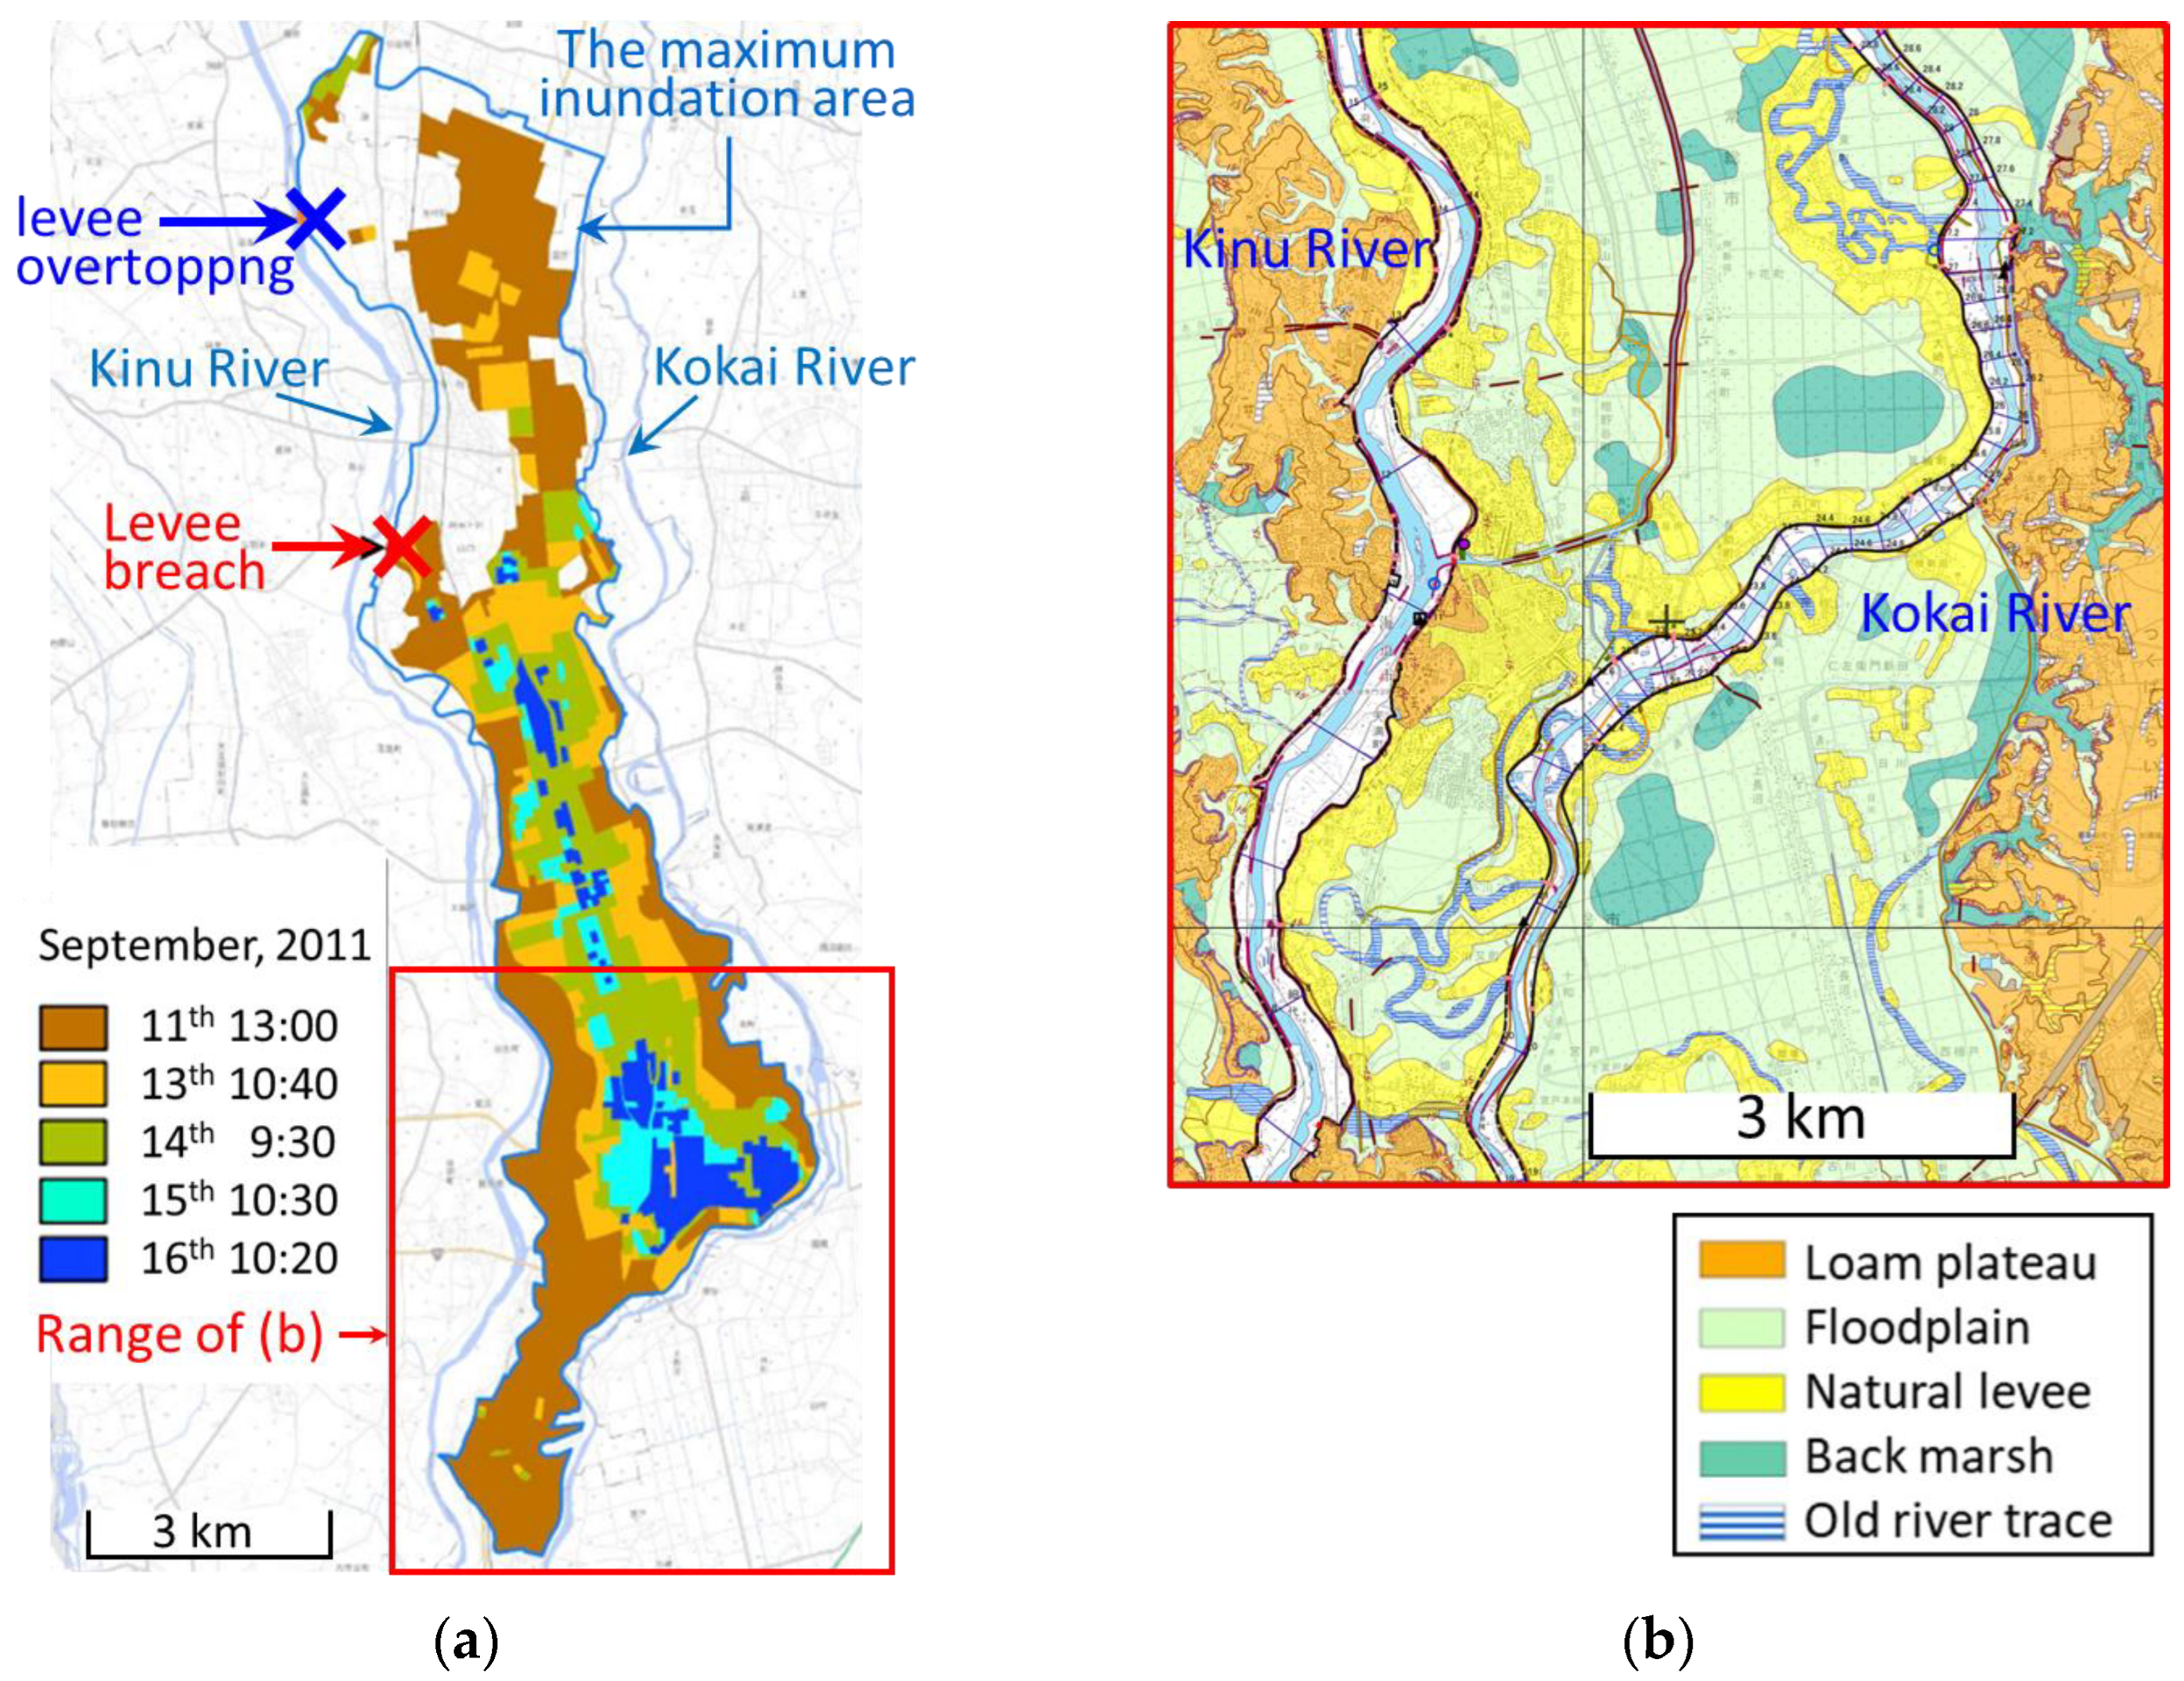
Figure 7a shows a flood control landform classification map for a wide area that includes a long floodplain formed by flooding from the Kinu River and the Kokai River. The two rivers composed one river system that flowed to the Pacific Ocean before the 17th century. The floodplain is called the Old Kinu River Floodplain herein.
Figure 7b shows a topographical cross section on the longitudinal line of the floodplain indicated by the red line A-B in
Figure 7a. The catchment area of the Kokai River upstream from the point marked C in
Figure 7a is about half that of the Kinu River.
After the waterway of the Tone River, the largest river in eastern Japan, was moved from the Tokyo Bay to the Pacific Coast in the 17th century, the Kinu River and the Kokai River became tributaries of the Tone River. At that time, a new channel for the Kinu River was excavated across a loam plateau, and the Kinu River was separated from the Kokai River. As a result, only the Kokai River currently flows through the Old Kinu River Floodplain. As shown in
Figure 7b, the Old Kinu River Floodplain has a constant gradient of about 1/3000. This was divided into several closed areas because the Kokai River was fixed by a recent reinforcement of the embankment.
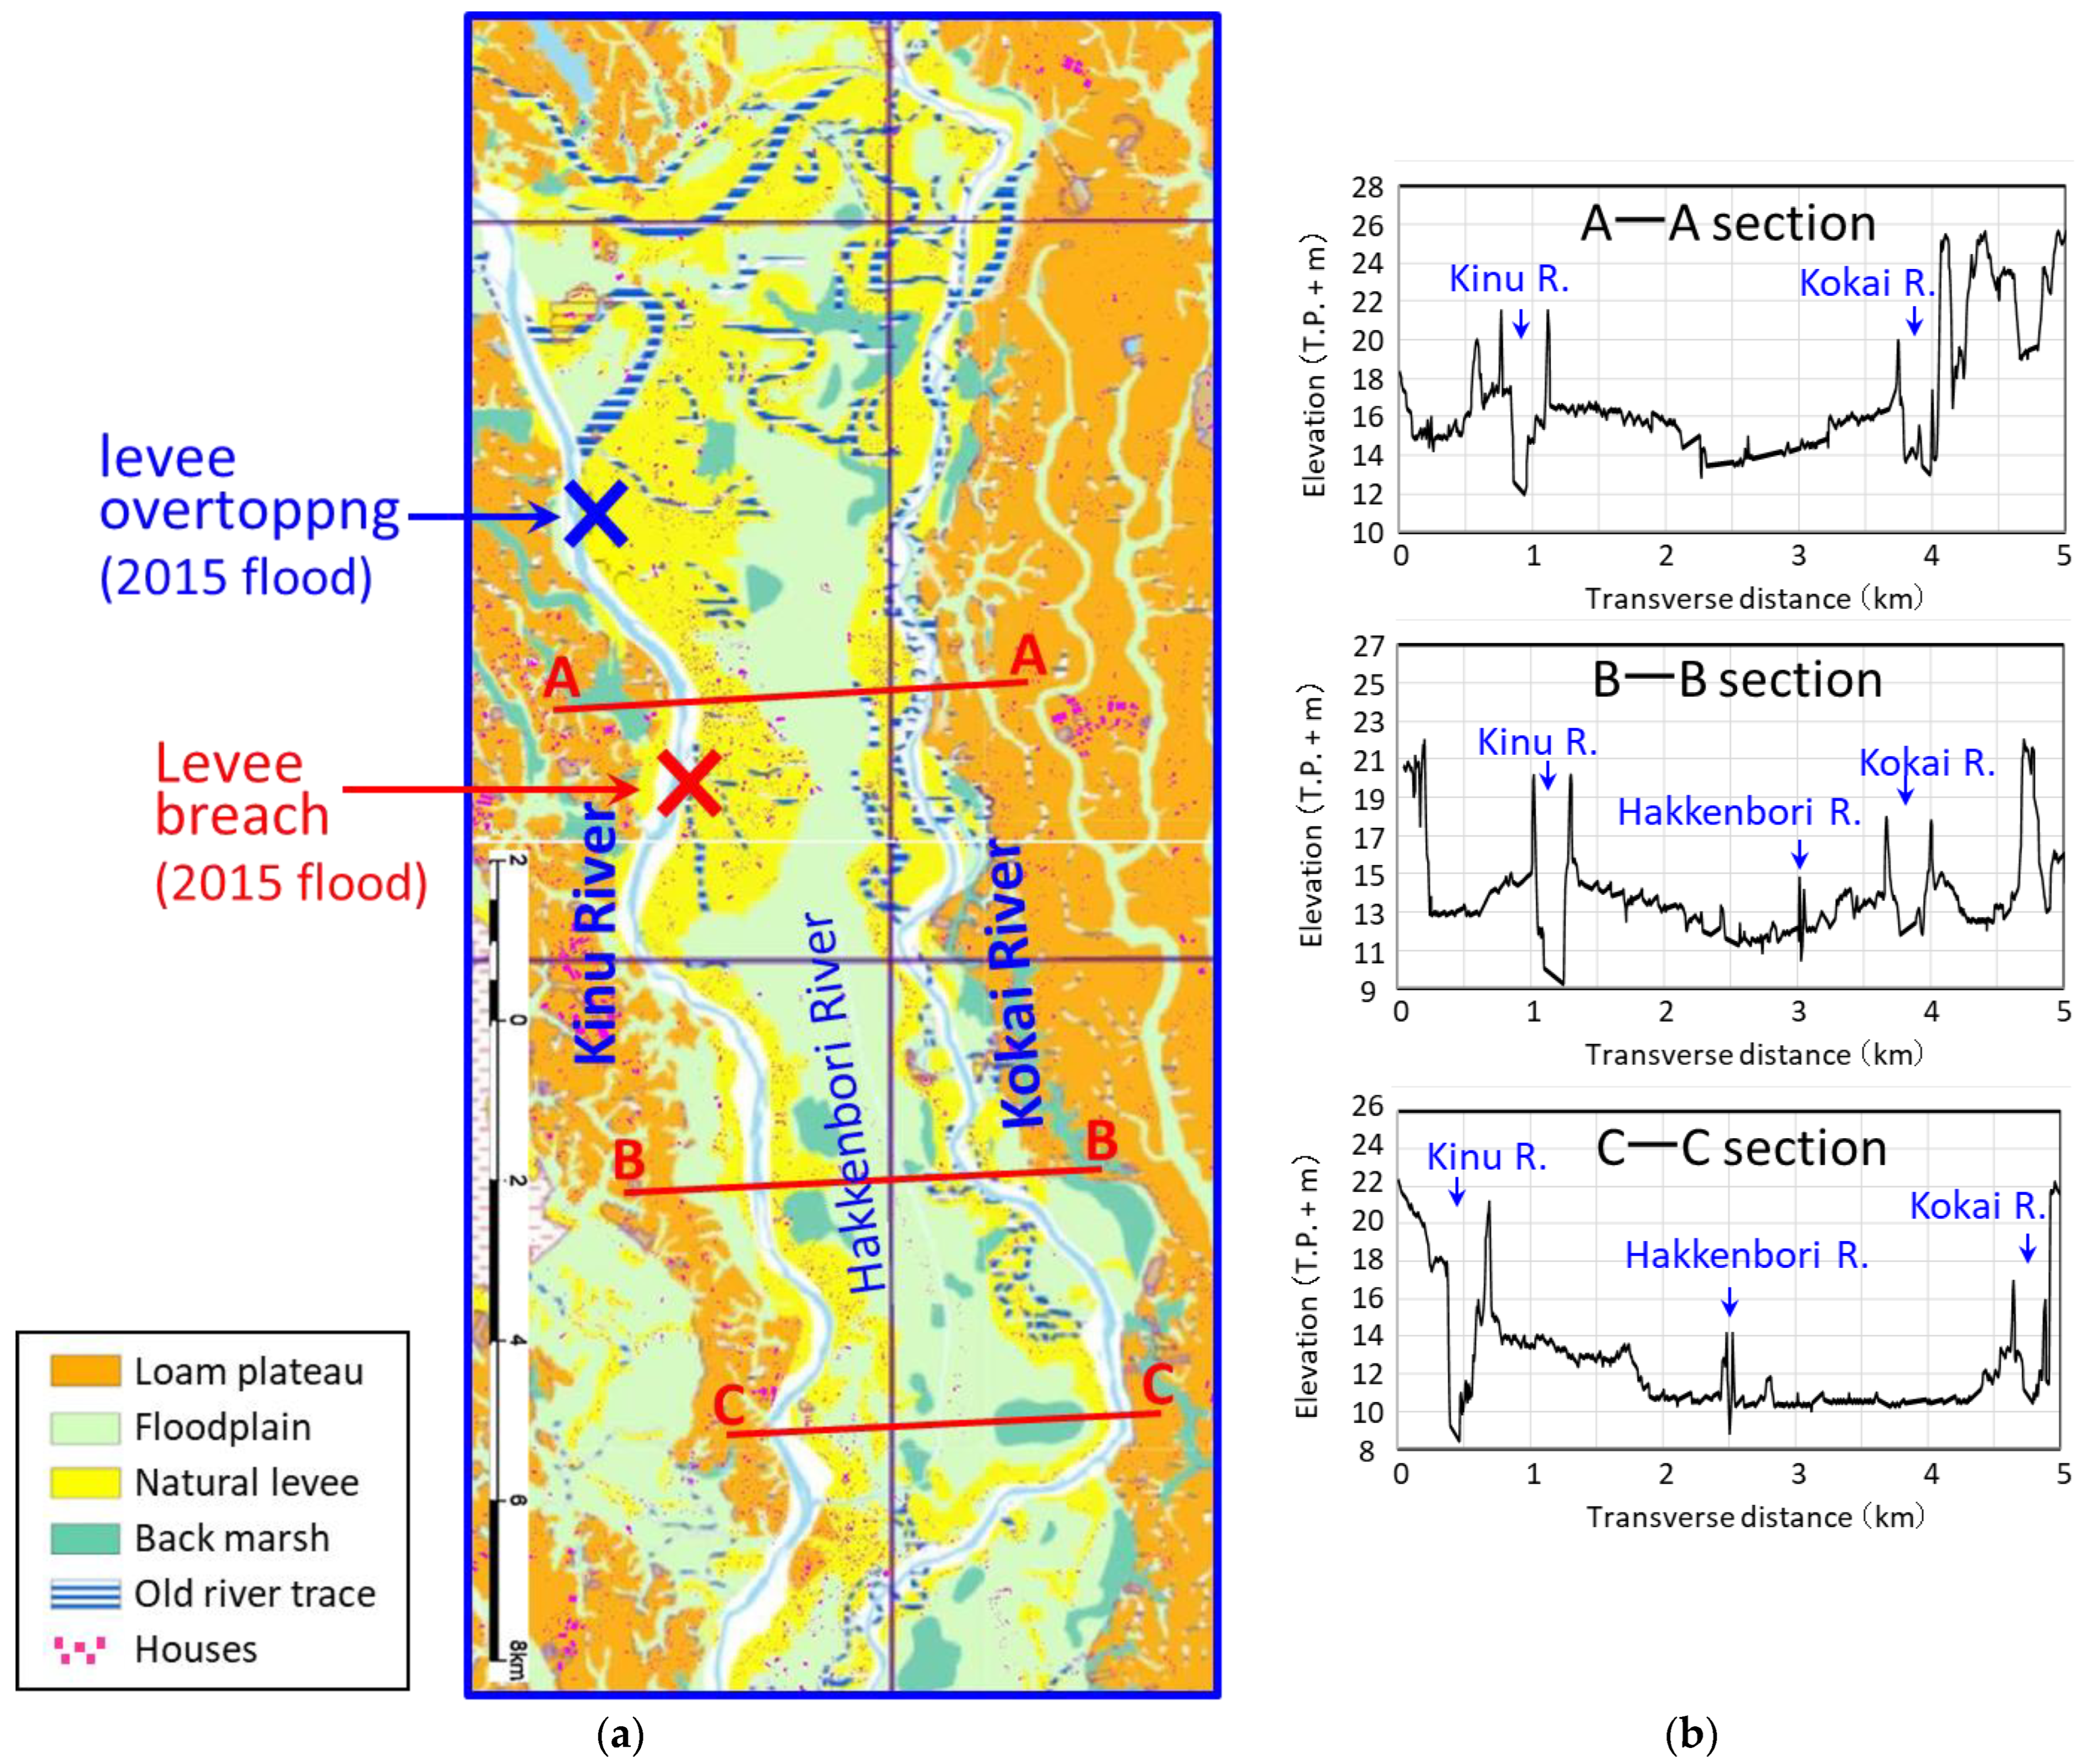
Figure 8a shows an enlarged view of the upstream floodplain indicated in
Figure 7 and
Figure 8b shows the cross sections seen from downstream of the three transverse lines plotted in
Figure 8a. The floodplain has a width of about 1 km and is bounded by the natural levees formed by the overflow of both rivers. Most of the floodplain is used for rice paddy fields. Due to recent farmland consolidation, the old river traces have disappeared except for those in the upstream part. The relative height difference between the floodplain and the natural embankment is about 2 m. An irrigation canal, called the Hakkenbori River, is located longitudinally in the center of the floodplain. The pink dots in
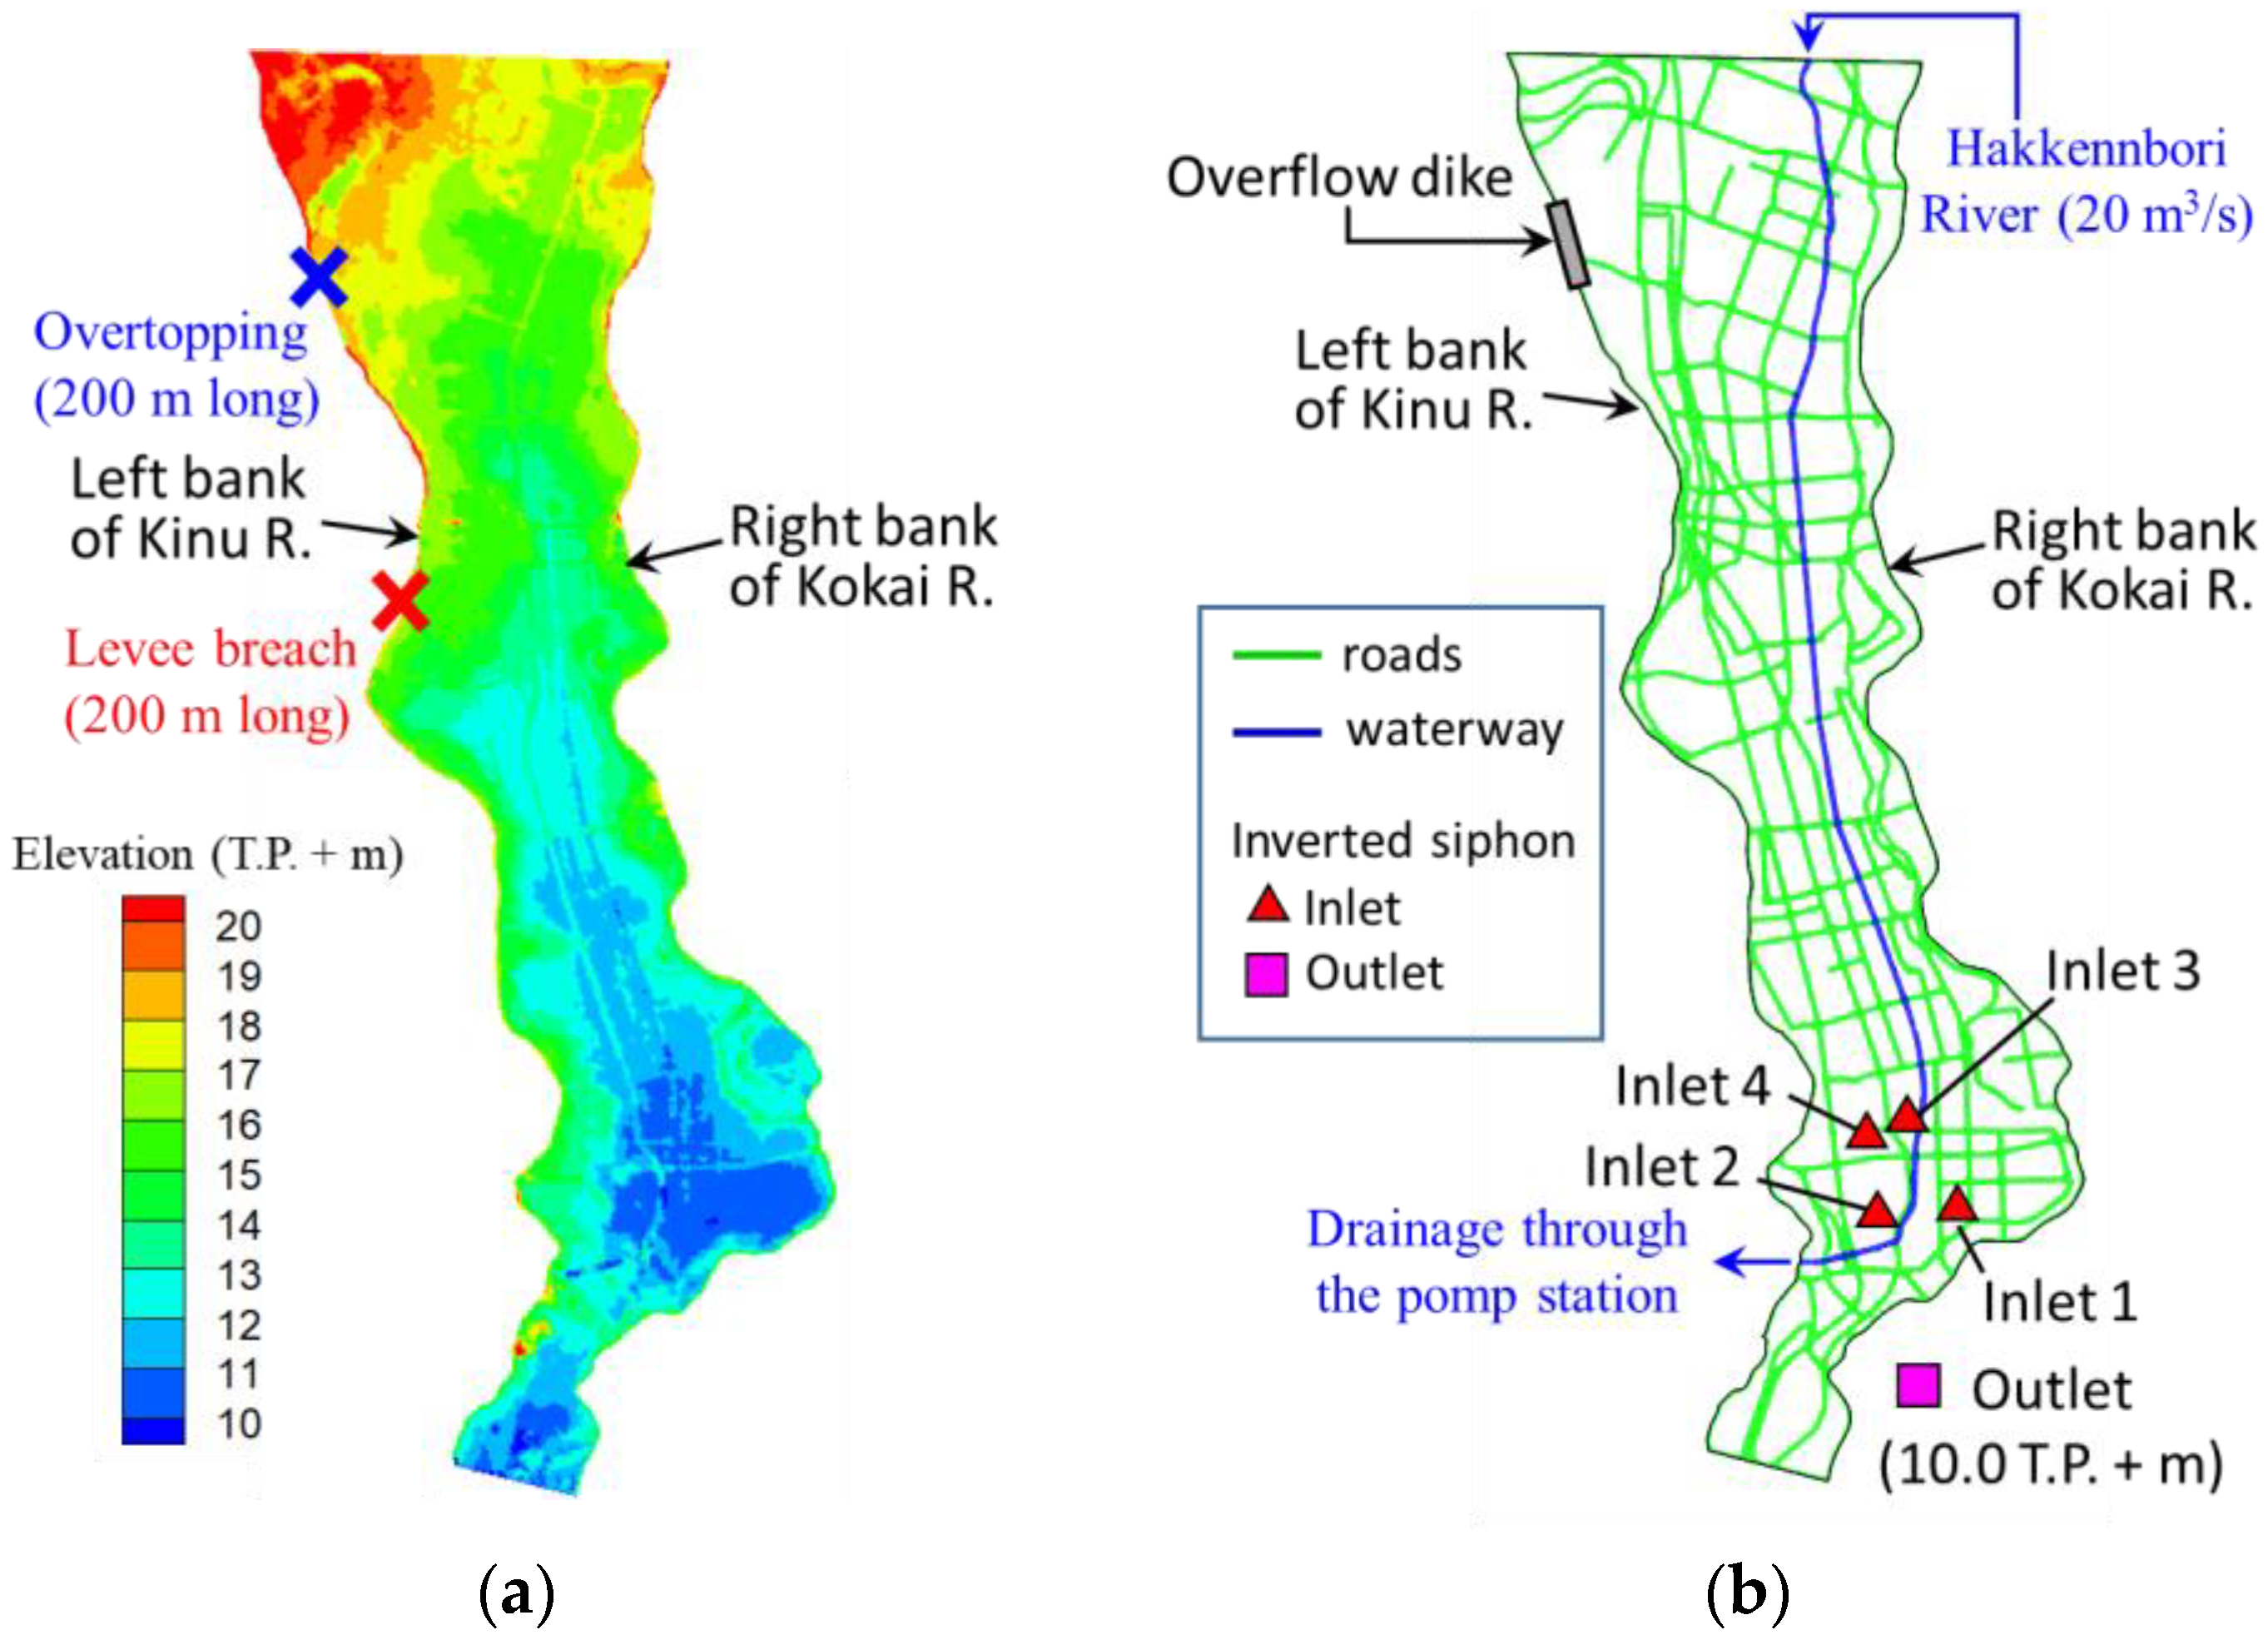
Figure 8a are houses, most of which are located on natural levees. Although not shown in this figure, there are main roads and railways on the natural embankments, which suggests that inundation of the floodplain has not reached the natural embankments for a rather long time. The blue cross and the red cross indicate the places of levee overtopping and levee breach, respectively, during the flood in 2015, which is described in detail in the next section.
4.2. The 2015 Flood Disaster
Due to the large rain runoff on 9 and 10 September 2015, levee overtopping started at the location indicated by the blue cross in
Figure 8. The embankment was breached at the location indicated by the red cross. The maximum discharge in this river section was estimated to be 4200 m
3/s [
26]. The target of the first stage of river improvement works underway is 4600 m
3/s [
27]. A total of 2955 houses were flooded above the floor level and 13,159 houses were flooded under the floor level (the height of the ground floor of a Japanese house is about 50 cm). Roads, approaches to houses, and underground lifeline facilities were submerged. Because the capacity of the pump facilities to drain water from the Hakkenbori River to the Kinu River was insufficient, the river administration office mobilized large pump trucks from all over eastern Japan and started draining the water. As a result, the inundation area gradually decreased, as shown in
Figure 9a.
There were two causes of the expansion of flood damage. This first cause is the complete breach of the embankment. River water continued to flow into the floodplain until the water level in the river channel completely dropped. The second cause is the downstream side of the floodplain being blocked by the embankment of the Kokai River, as shown in
Figure 9b. As a result, the water surface level rose remarkably, flooding the natural embankments where many houses were located.
4.3. Design of RWRB at Study Site
Based on the above facts, we considered the application of an RWRB to this closed floodplain, as shown in
Figure 10. A 1000 m long overflow dike fabricated of concrete was installed at the place where levee overtopping occurred in 2015 (the blue cross in
Figure 8). When the water level in the river channel exceeds the design HWL, river water overflows to the floodplain. In addition, because the Kinu River embankment has a sufficient freeboard of 1.5 m according to regulations, overtopping will not occur on embankments other than at the overflow dike. When the water level drops below the HWL, overflow stops, so the amount of floodwater will be much smaller than that in the case of a levee breach.
The discharge can be calculated using the formula for a broad crested weir [
28]:
where
is the length of the overflow bank (1000 m),
H is the specific energy head above the HWL, and
g is the gravitational acceleration.
Next, we discuss the drainage facility at the downstream end of the floodplain. The floodwater in the RWRB on the floodplain in the upstream river section, shown in
Figure 6, can be drained easily through the levee opening located at the downstream end section because the ground slope is large. However, since the ground slope of the Old Kinu River Floodplain is as small as 1/3000, this method is not available due to the backwater. Therefore, we considered the inverted siphon installation in the area indicated by the dotted arrow in
Figure 10. Inverted siphons have been used since Roman times for grade crossings of rivers and aqueducts.
The total head loss in the inverted siphon Δ
H is expressed as the sum of the outlet head loss Δ
H1 and the friction head loss Δ
H2.
where
A is the pipe cross-sectional area,
R is the hydraulic radius,
n is Manning’s roughness coefficient,
L is the pipe length, and
g is the gravitational acceleration. From the above, the flow rate
Q is calculated as:
5. Numerical Simulations of Flow on Floodplain
5.1. Numerical Model
A shallow water flow model discretized on an unstructured triangular grid system was used for the numerical flood simulations [
5]. The basic equations are as follows:
where
U and
V are the
x and
y components of the velocity, respectively,
h is the water depth,
H (=
h + ground level) is the water surface level,
ρ is the water density, and
g is the gravitational acceleration.
τ0 is the bed friction force represented by Manning’s equation:
where
Uf is the friction velocity and
n is Manning’s roughness coefficient.
τUU,
τUV, and
τVV are the horizontal shear stresses, which are expressed using the eddy viscosity as follows:
where
ε is the vertically averaged eddy viscosity,
k is the turbulent kinetic energy, and
κ (=0.41) is the von Karman constant. The expression for
k in the equation was proposed by Nezu and Nakagawa [
29].
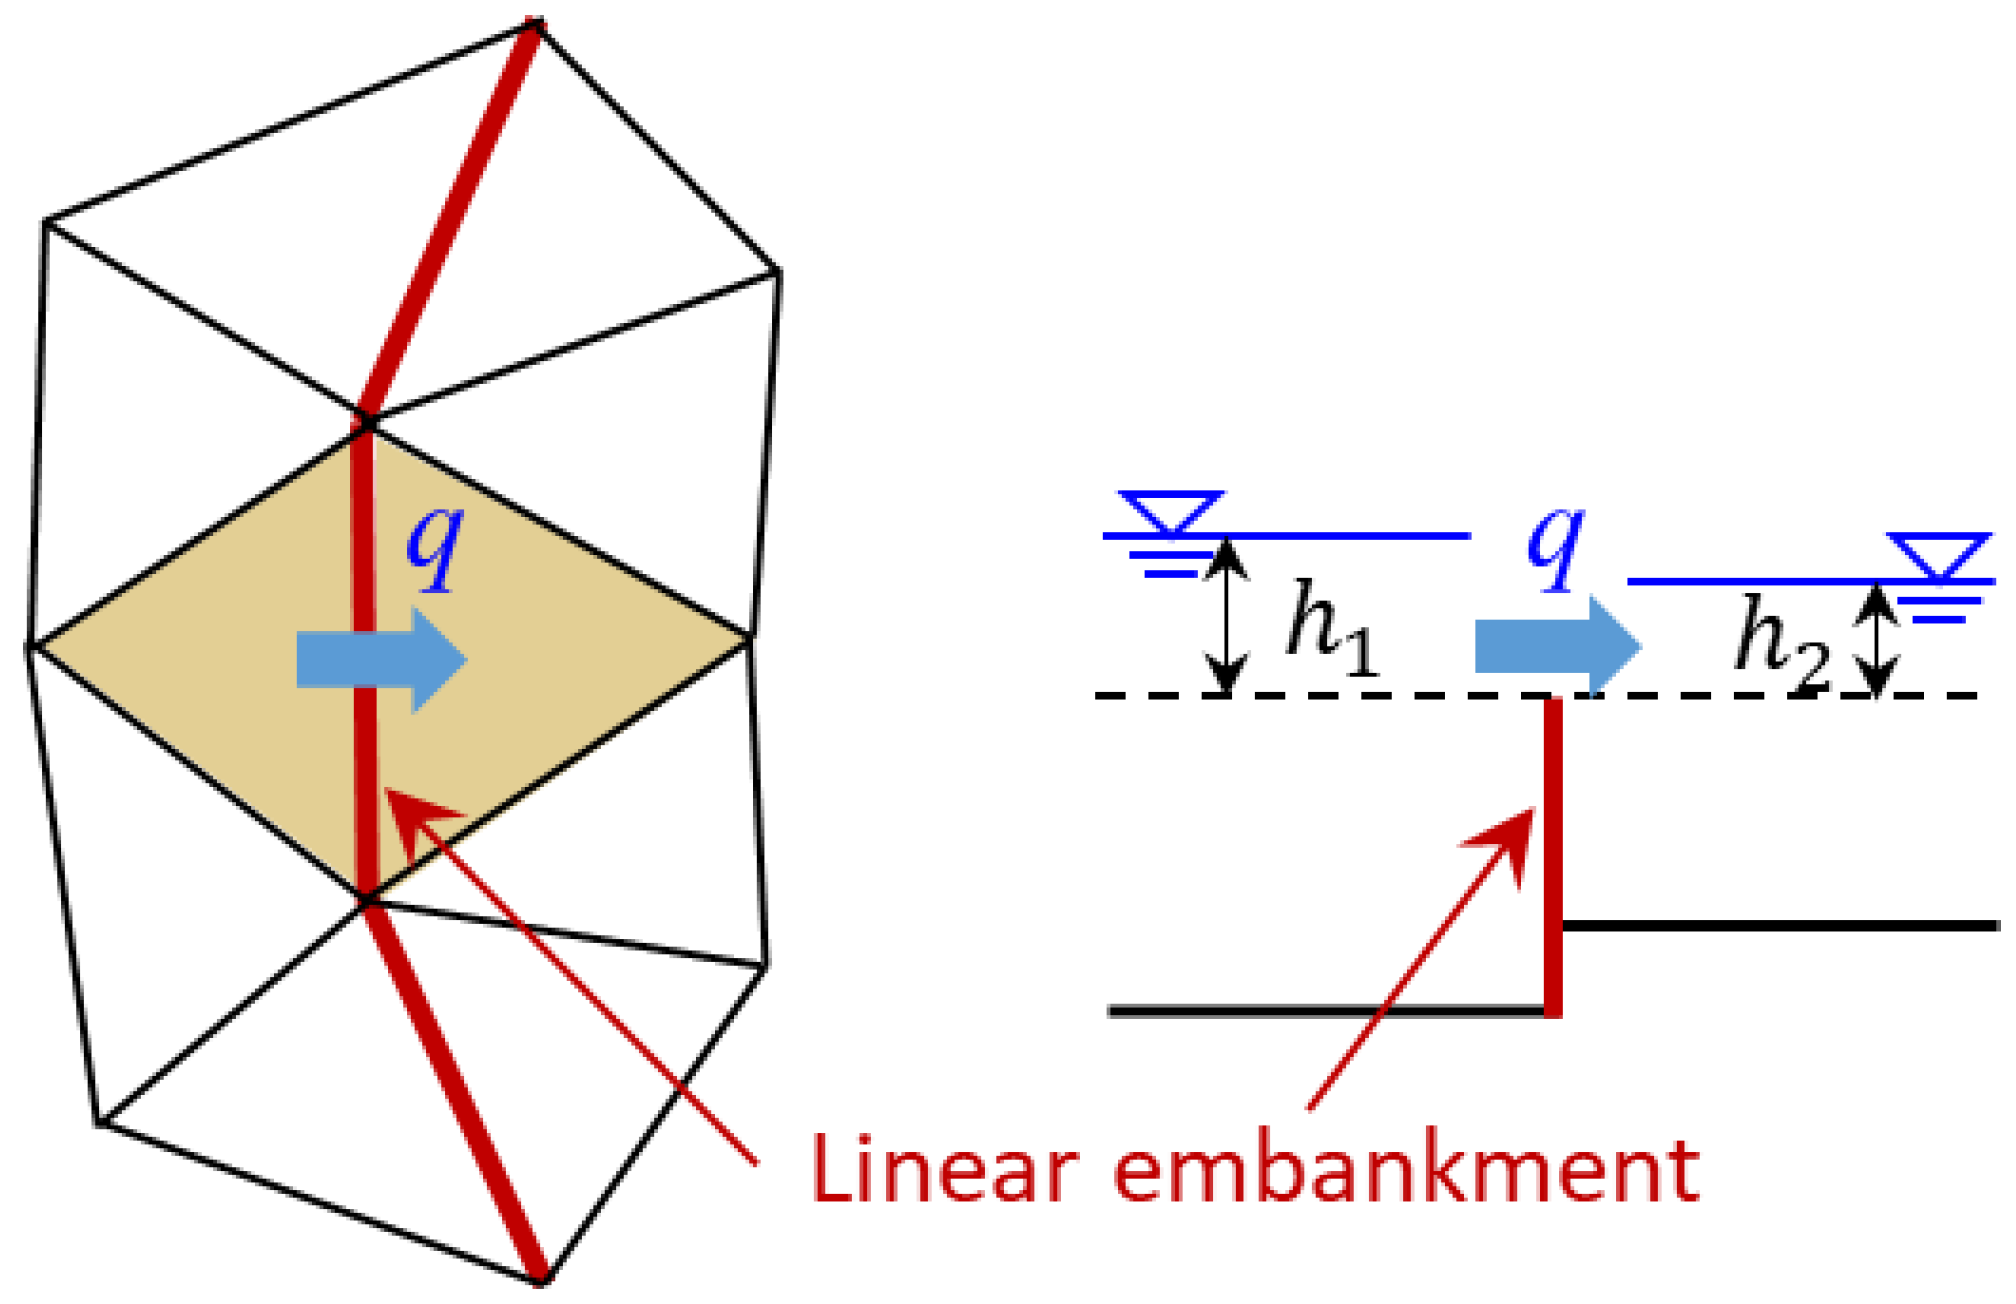
Embankments narrower than a triangular grid (levee or road) were treated as a linear element. The flow rate over such embankments was calculated using Honma’s equation [
30] using the water depth of the adjacent triangular element.
where
q is the flow rate per unit width over the levee and
h1 and
h2 are the water surface heights upstream and downstream, respectively, of the overflow from the levee crown (see
Figure 11).
5.2. Calculation Conditions
5.2.1. Model of Topography
Figure 12a shows the topography of the area used for the numerical flow simulations. The eastern edge of the calculation range is the right bank of the Kokai River, and the western edge is the left bank of the Kinu River. In the north–south direction, the range was determined based on the actual flooding map shown in
Figure 9a. Ground elevation was obtained from GIS elevation data for a 5 m mesh [
31]. Manning’s roughness coefficient (
n) was assumed to be 0.035 for paddy fields and 0.040 for settlement areas.
Figure 12b shows the arrangement of waterways (blue) and roads (green). The planned irrigation water volume of 20 m
3/s was applied to the upstream end of the canal and the pump discharge volume record shown in
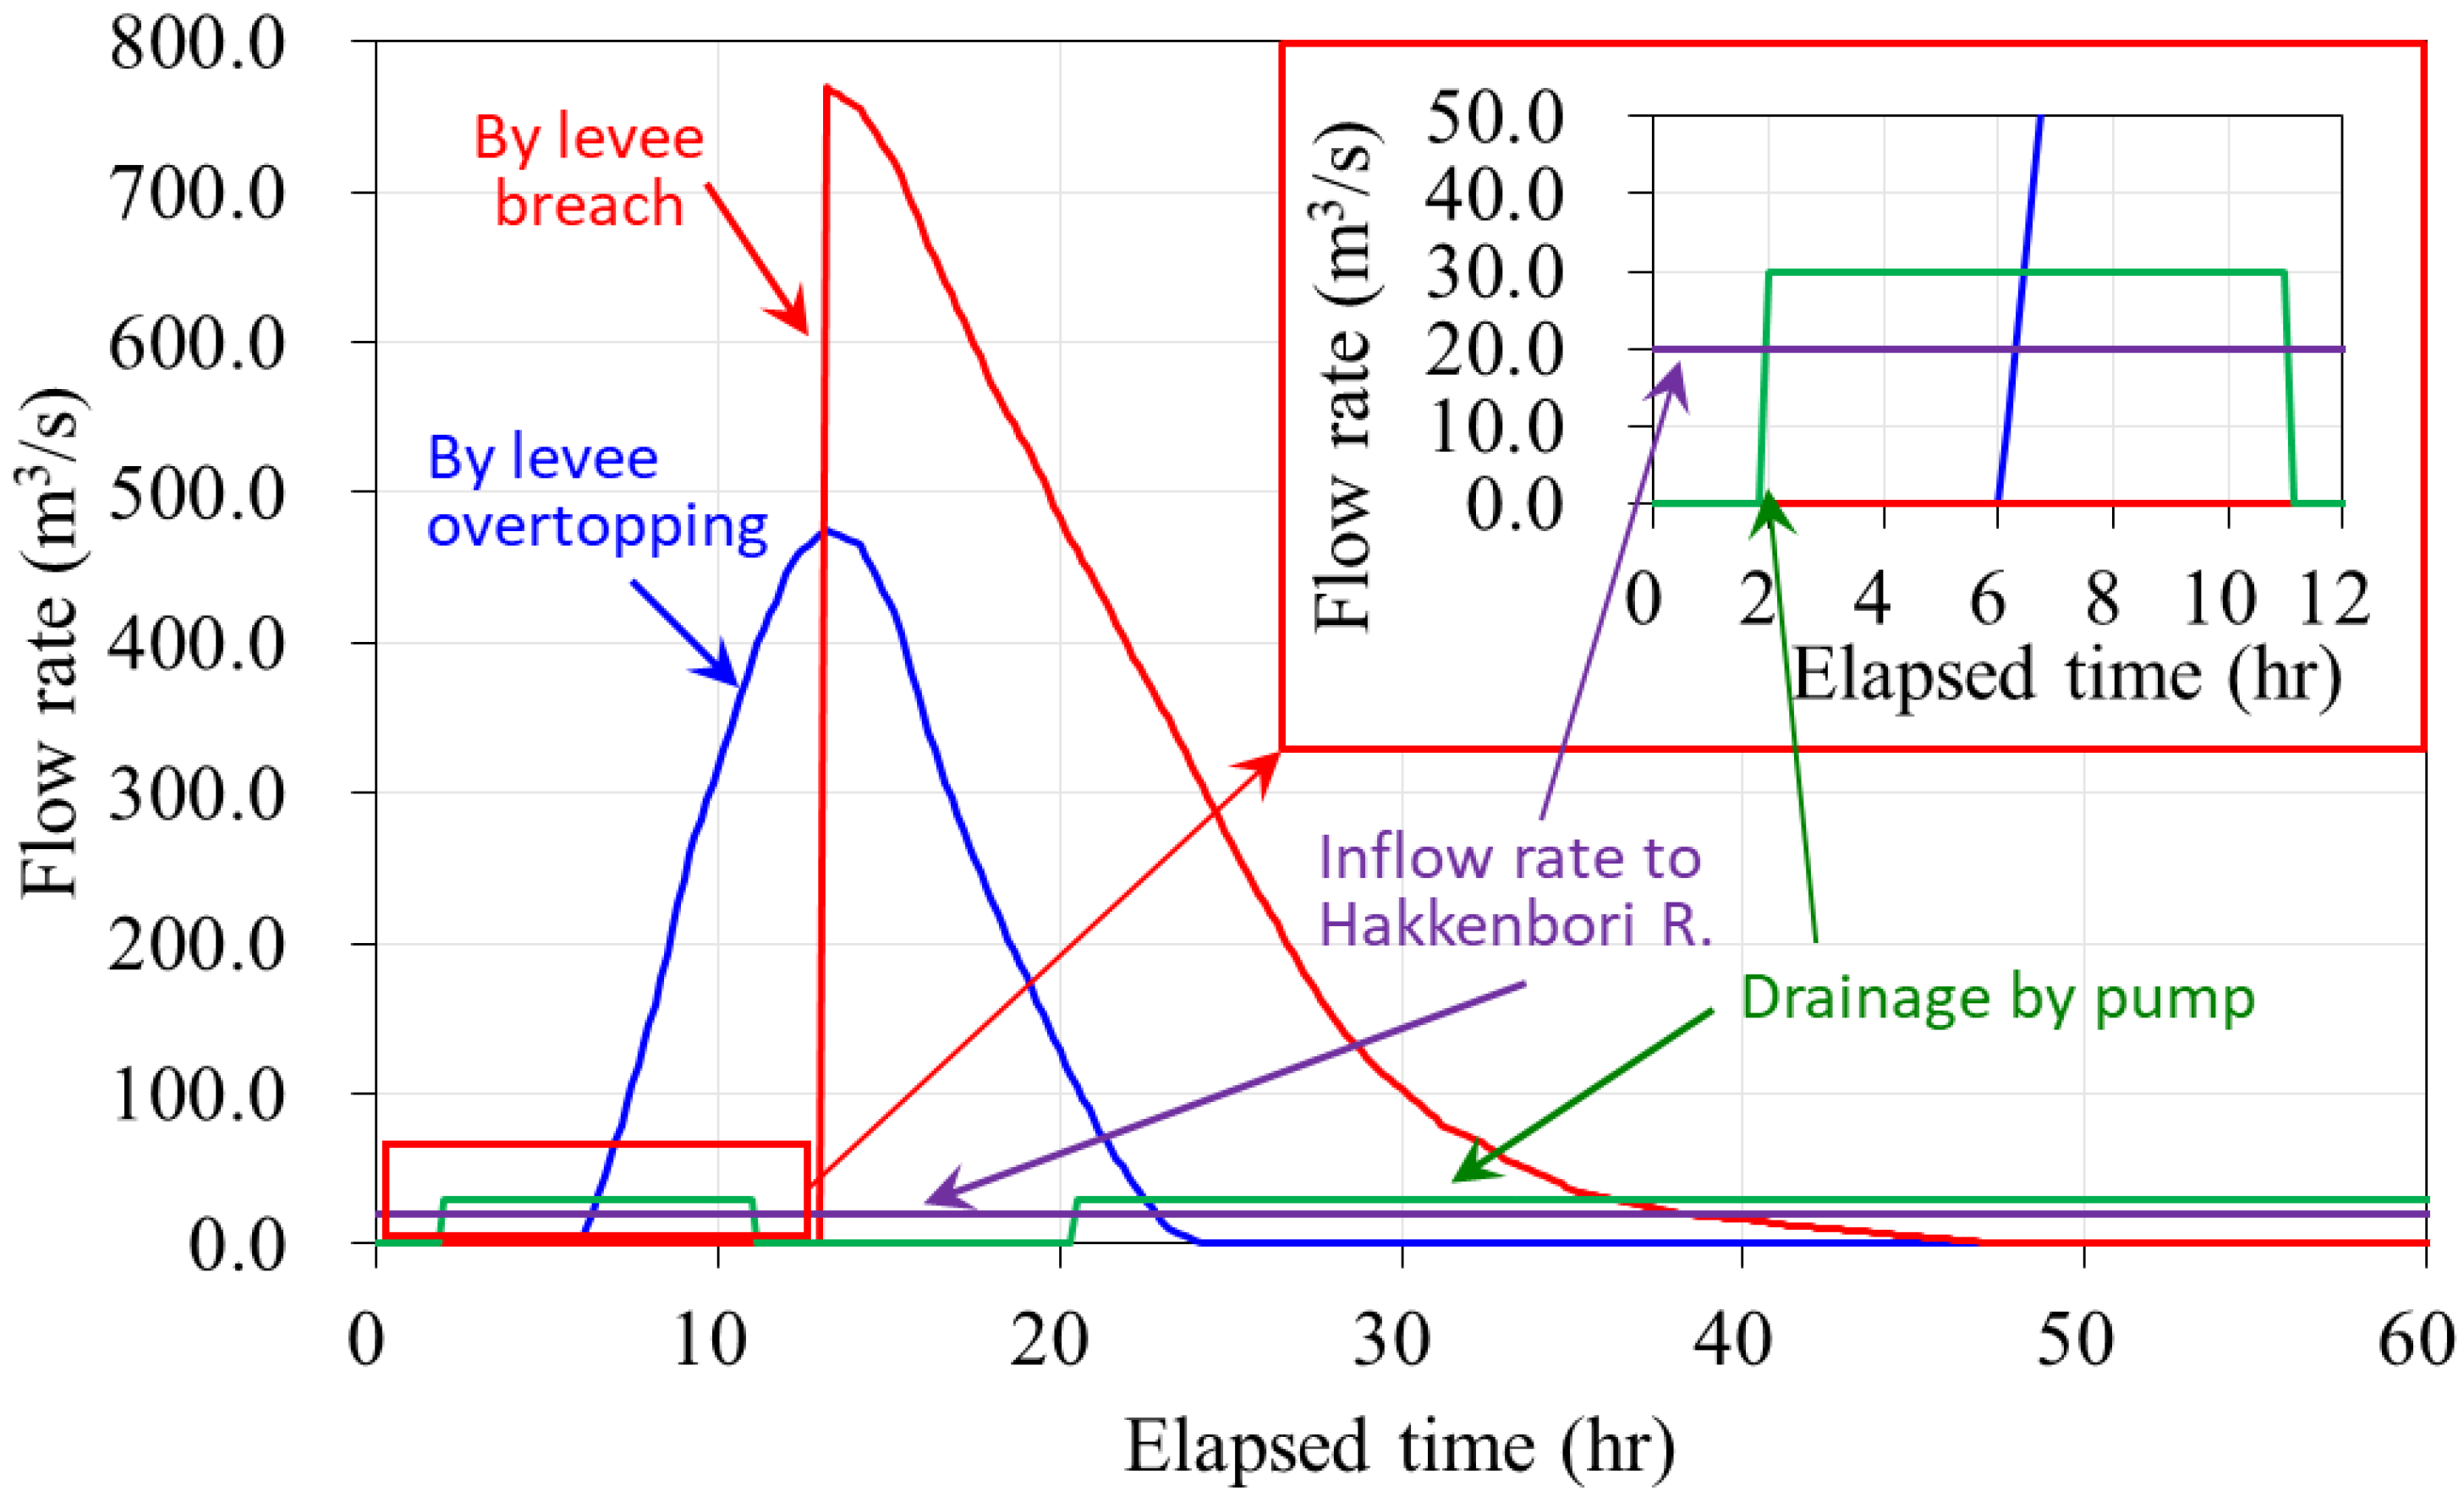
Figure 13 was applied to the downstream end. The height of the waterway levees was taken from the GIS elevation data. The relative height of the roads was assumed to be 0.5 m from the high-hand side of the adjacent triangular element ground. The figure also shows the facilities of the RWRB. Because the floodplain is finely divided by roads and channels, four inverted siphon inlets were prepared. It was assumed that there is one exit. The water surface elevation was assumed at approximate ground elevation of the area around the exit (Tokyo Peil + 10.0 m). The cross section of each pipe was assumed to be a square (5 m × 5 m) and Manning’s roughness coefficient was assumed to be 0.012.
Table 2 shows the length and the value of parameter γ in Equation (5) for each pipeline.
5.2.2. Calculation Cases
Numerical simulations were performed for the three cases shown in
Table 3. For Cases 1 and 2, the hydrograph of flooding from the Kinu River was applied to the locations indicated by the cross marks in
Figure 12a. For Case 1, the drainage at the pump station was taken into account. For Case 2, the drainage by the inverted siphon was also considered.
The blue line in
Figure 13 represents the flooding from the overtopping point and the red line represents that from the levee breach point. These were estimated by Ohtsuki et al. [
32] based on a field investigation of the disaster. Since the actual discharge of the Hakkenbori River on the day of the flood is unknown, it was assumed that the discharge was the planned irrigation discharge (20 m
3/s) indicated by the purple horizontal line in
Figure 14. It was also assumed that the floodwater was discharged at the maximum pump capacity (30 m
3/s), as shown by the green line, from the downstream end of the Hakkenbori River to the Kinu River. The pump operation was stopped from 11:00 to 20:00 due to the HWL in the Kinu River. Note that the inflow and outflow of the Hakkenbori River are negligible compared with the amount of floodwater from the Kinu River. In addition, for Case 1, the amount of drainage by large pump trucks mobilized by river administrators was not considered due to a lack of data.
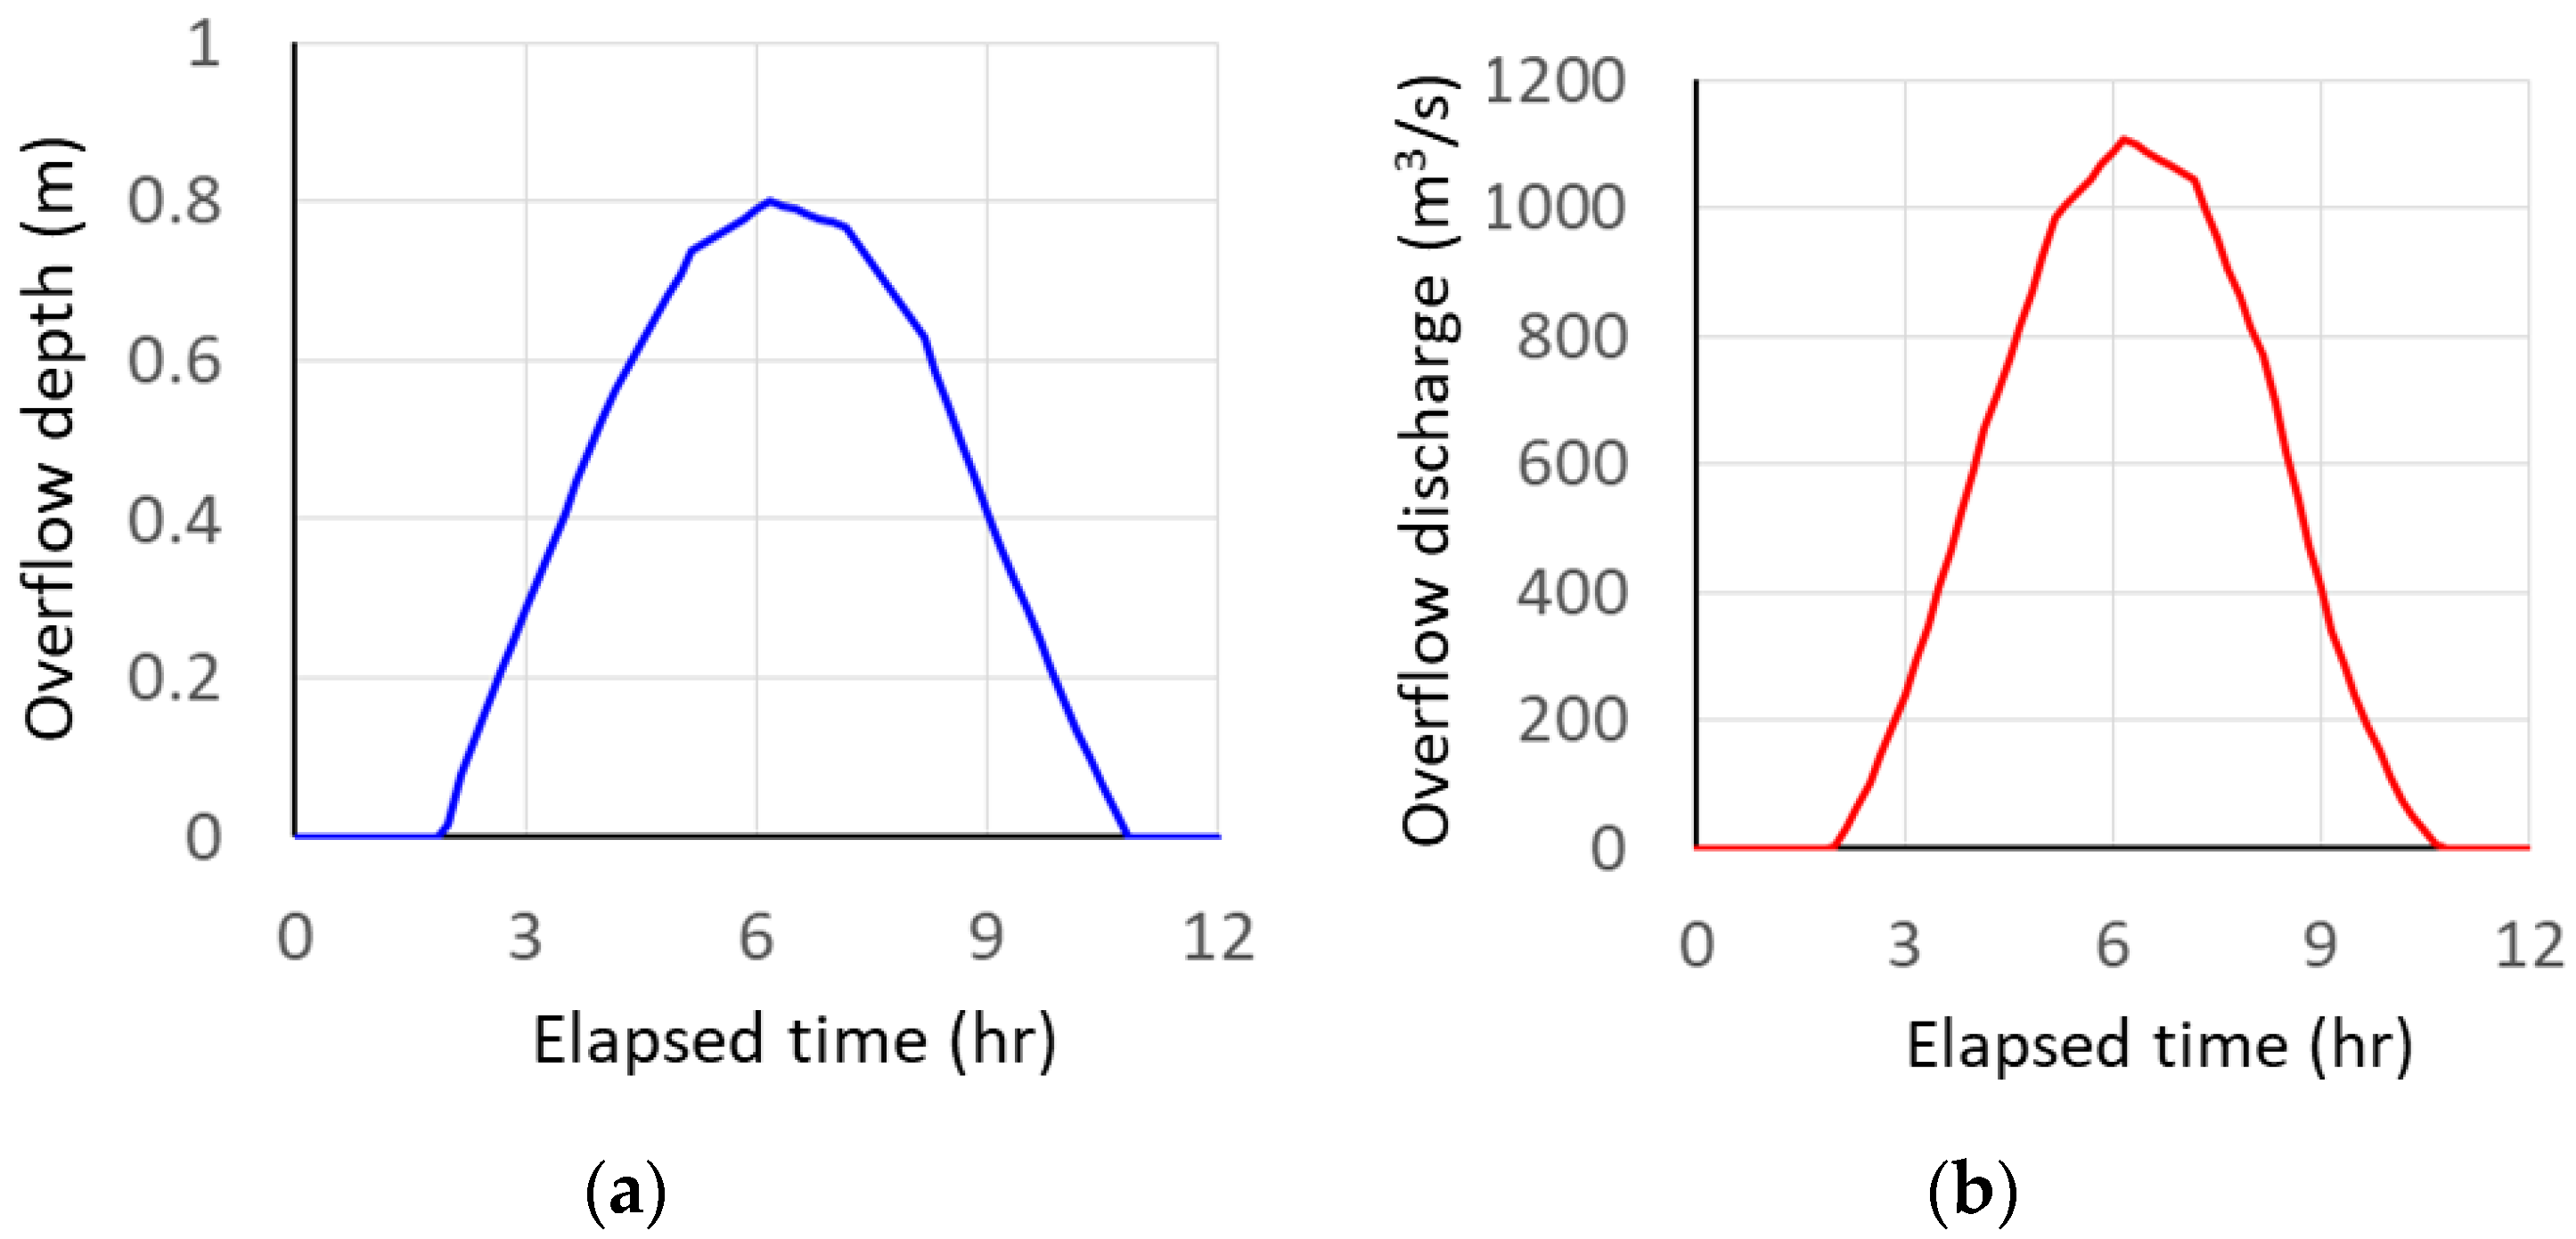
For Case 3, the performance of the RWRB for excess runoff was investigated. The overflow water depth of the overflow levee must be within 1.5 m, which is the freeboard of the Kinu River levee. Therefore, as shown in
Figure 14a, a case study was conducted under the assumption of an excess runoff with a maximum overflow depth of 0.8 m. From Equation (1), the corresponding overflow discharge was obtained as shown in
Figure 14b. The peak discharge is about 1150 m
3/s. On the other hand, the bankfull discharge observed in the 2015 flood was about 4200 m
3/s; therefore, if the crest of the overflow dike is set to 1.5 m below the levee crown, the peak discharge is reduced to 3100 m
3/s, leaving a clearance of 0.7 m.
5.3. Results and Discussion
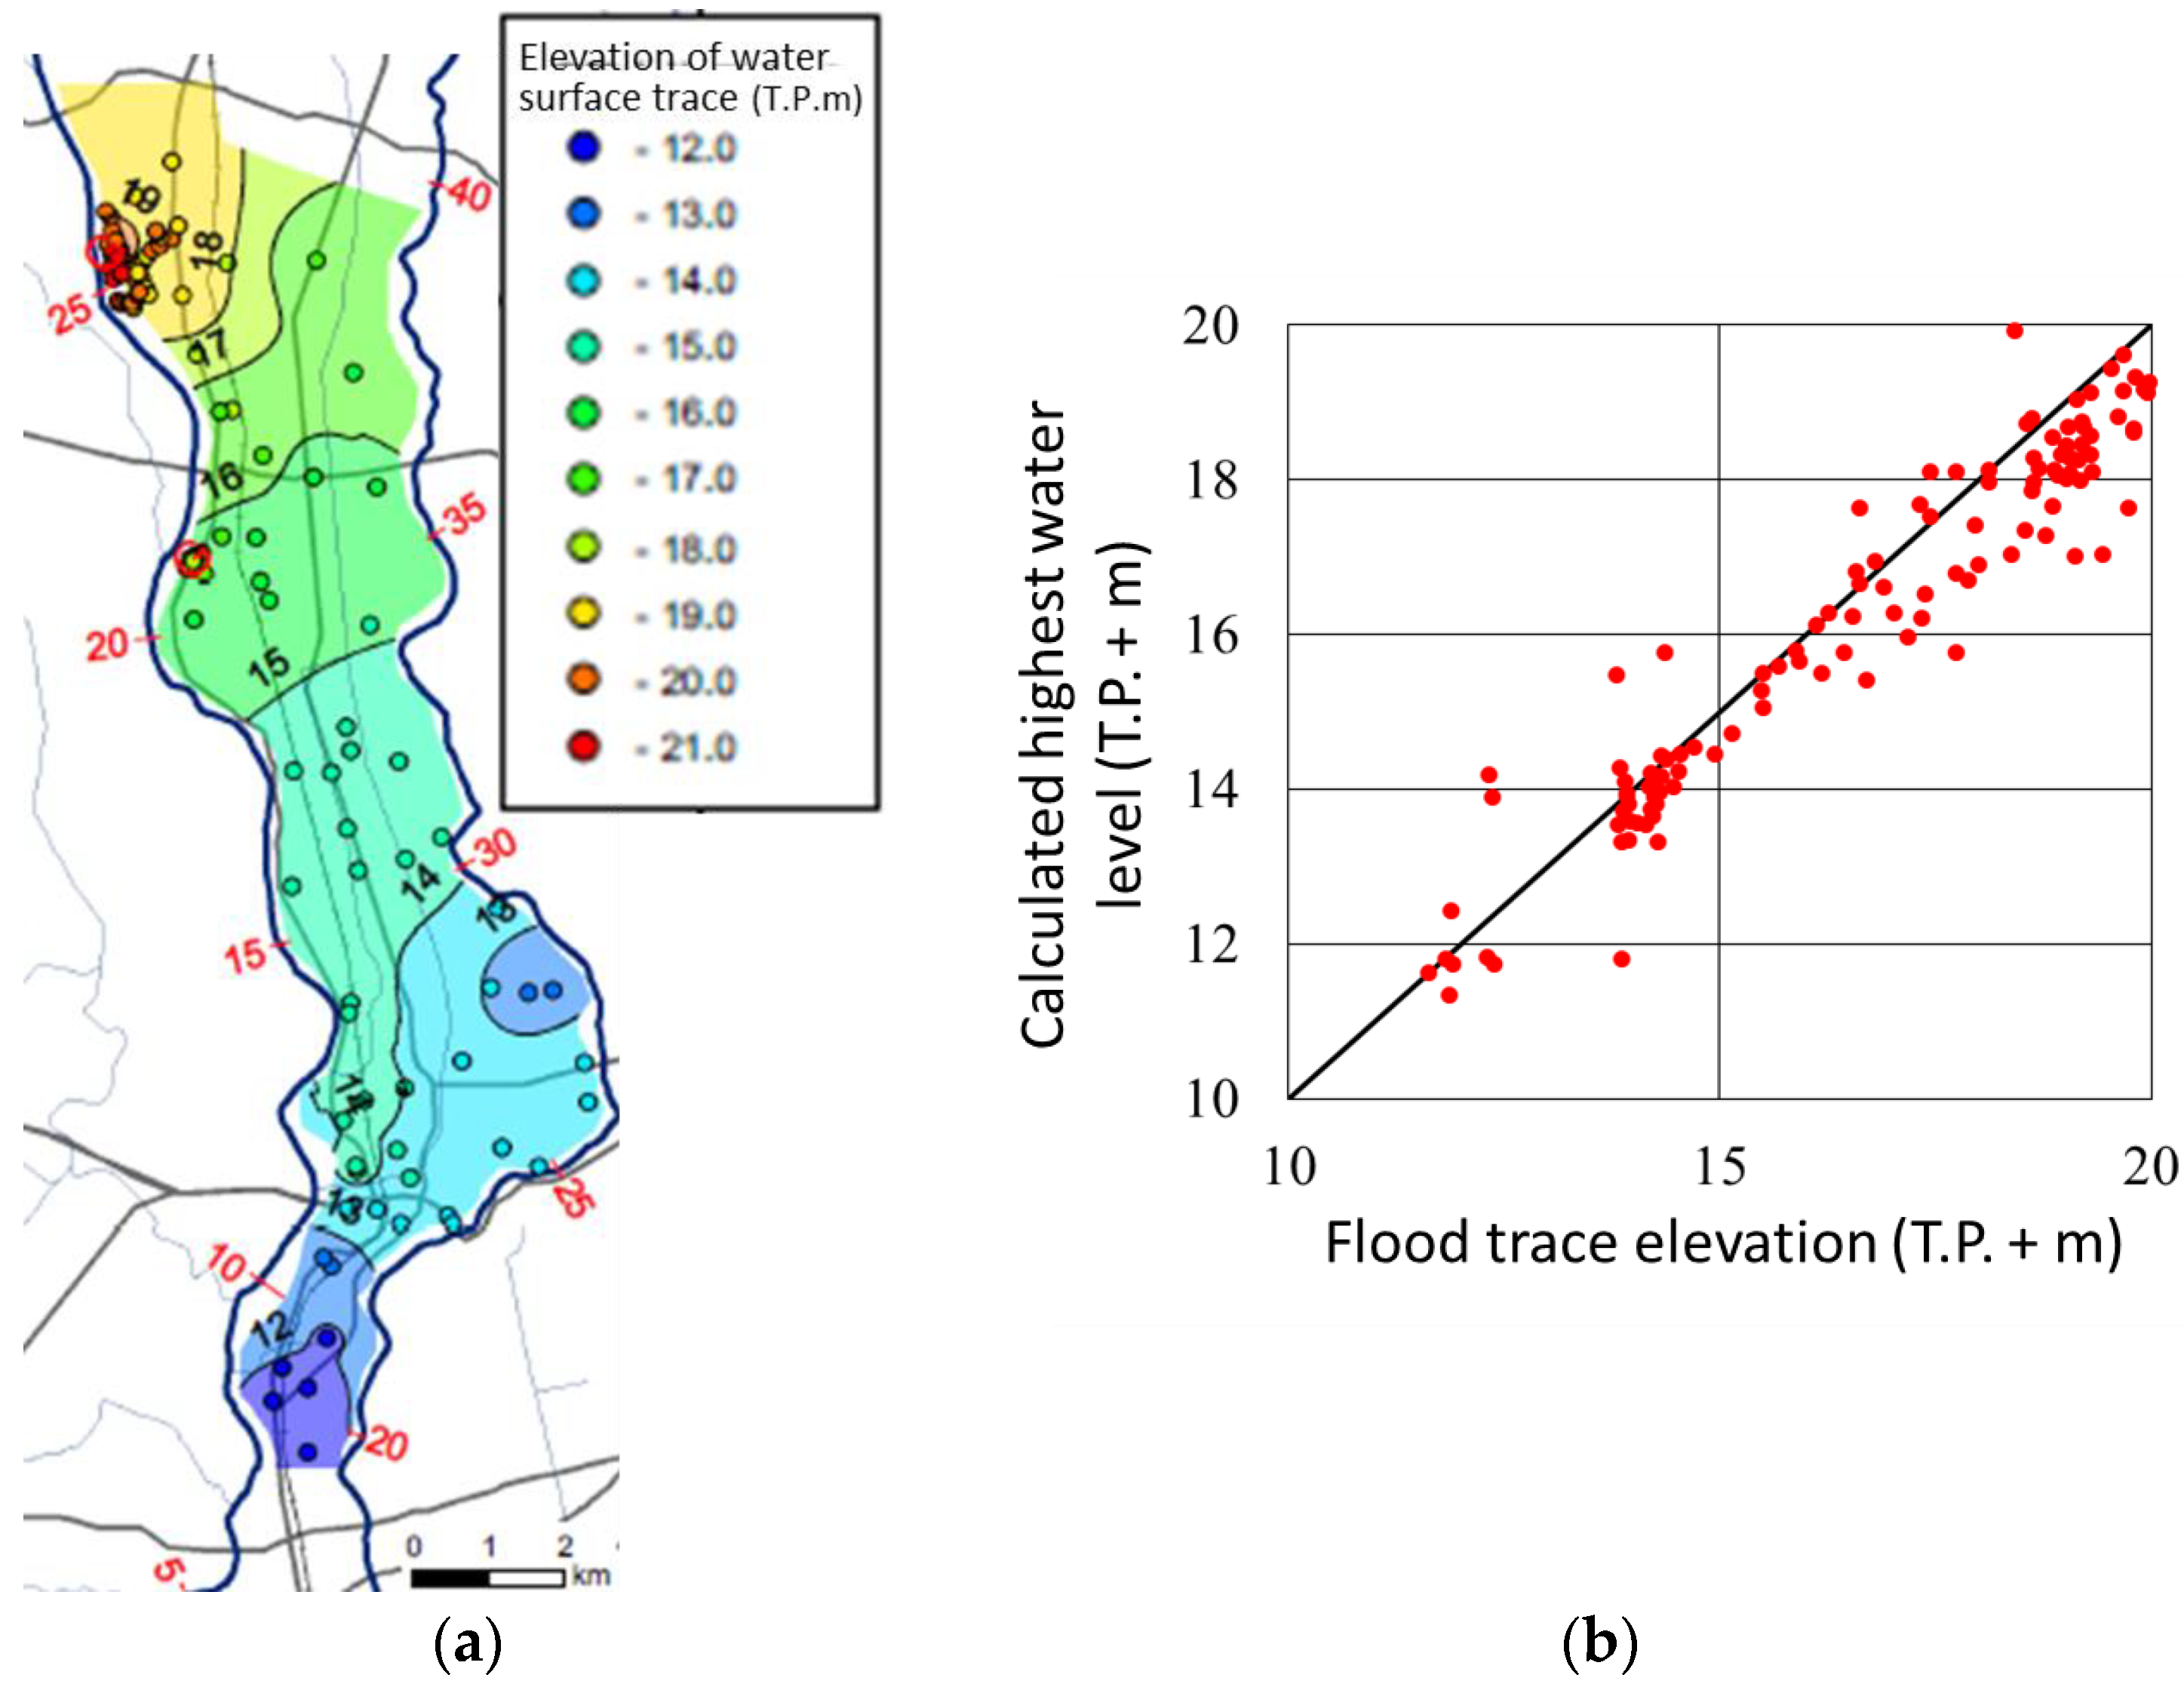
Figure 15a shows the results of a floodwater surface trace survey conducted by Ohtsuki et al. after the 2015 flood [
32].
Figure 15b shows the correlation between the survey results and the highest water level at each point obtained in the numerical simulations. The agreement is fairly good.
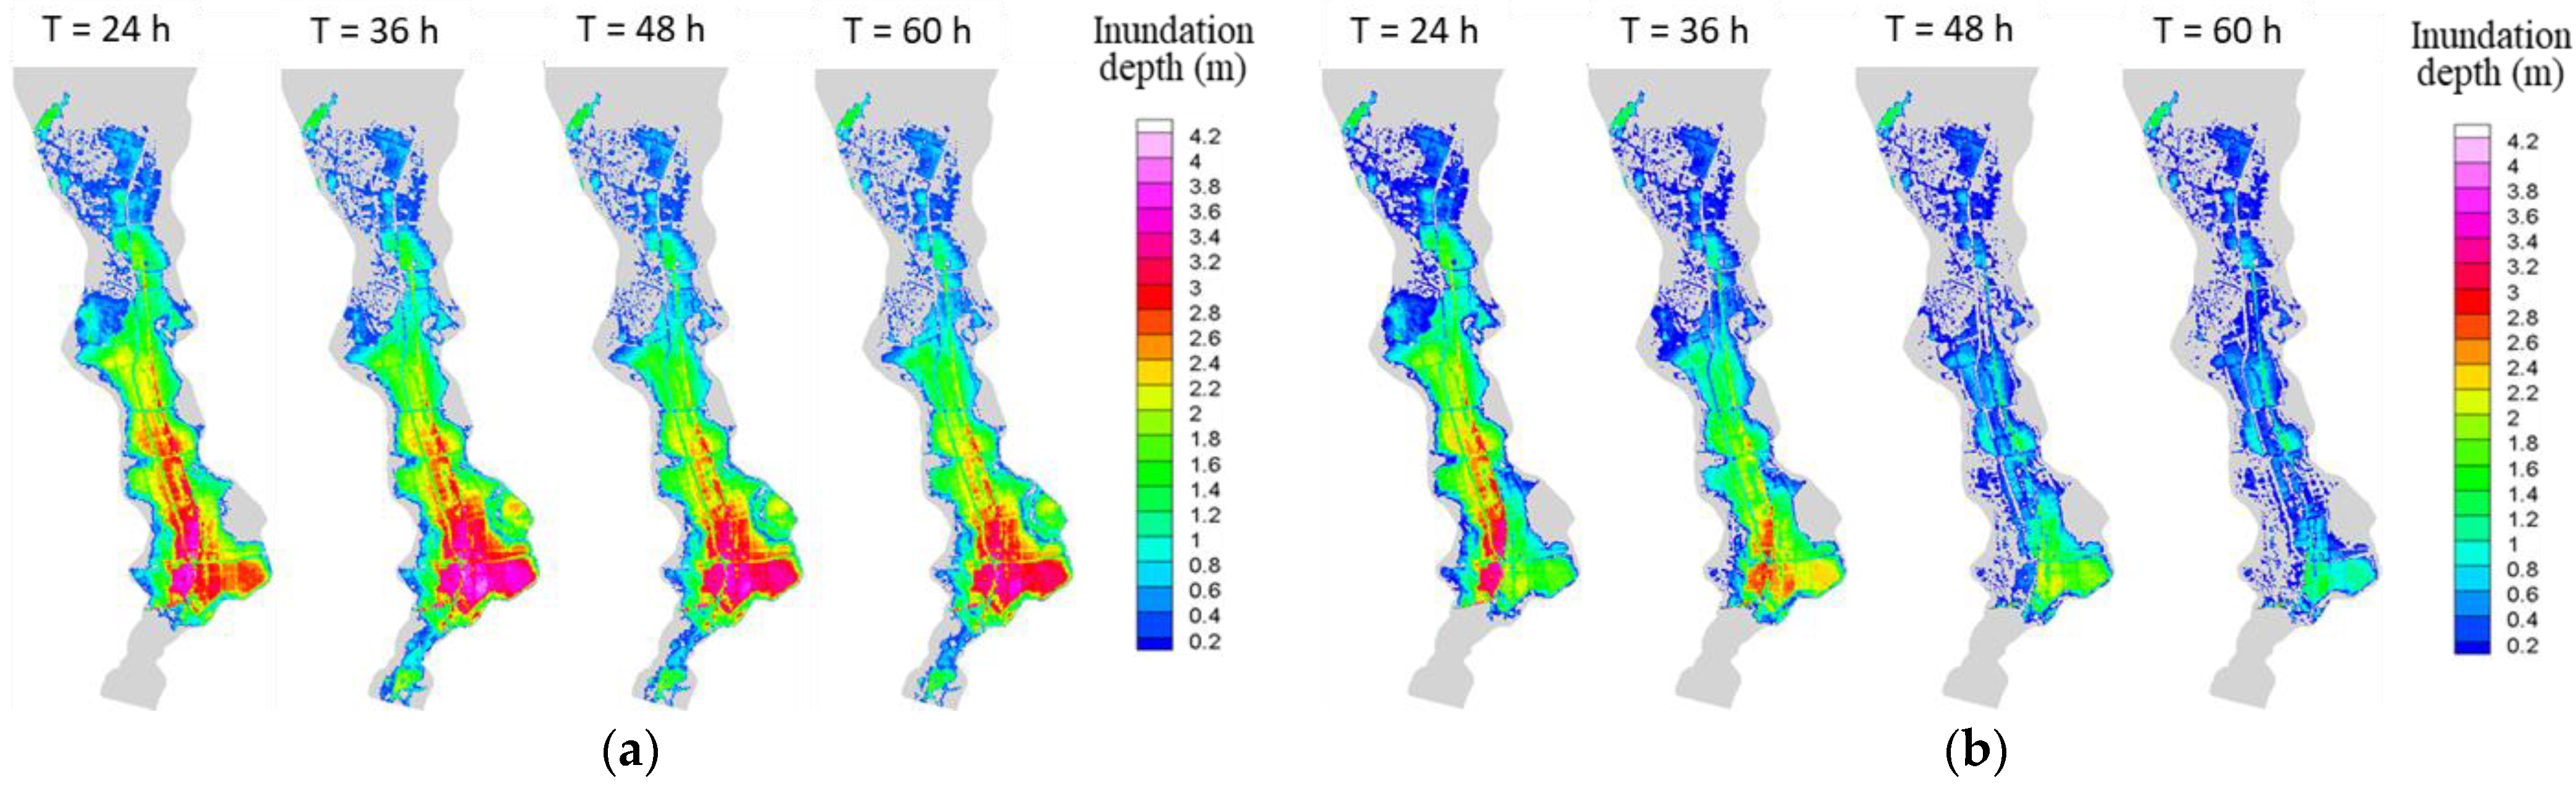
Figure 16a,b show the temporal change in the inundation depth distribution for Cases 1 and 2, respectively. The light gray area in the background of each figure indicates the computational domain shown in
Figure 12. Due to the limitation of the pump capacity (indicated by the green line in
Figure 13), the flooded area hardly decreased. A comparison with the landform classification map shown in
Figure 8 indicates that the houses on the natural embankments were flooded even at an elapsed time of 60 h. For Case 2, in contrast, the inundated area rapidly decreased. At 24 h after the start of inundation, the inundation depth was already smaller than that for Case 1. The natural embankment at the southern end of the calculation area was not inundated throughout the simulation. After 48 h, most of the natural levees on both sides had dried up.
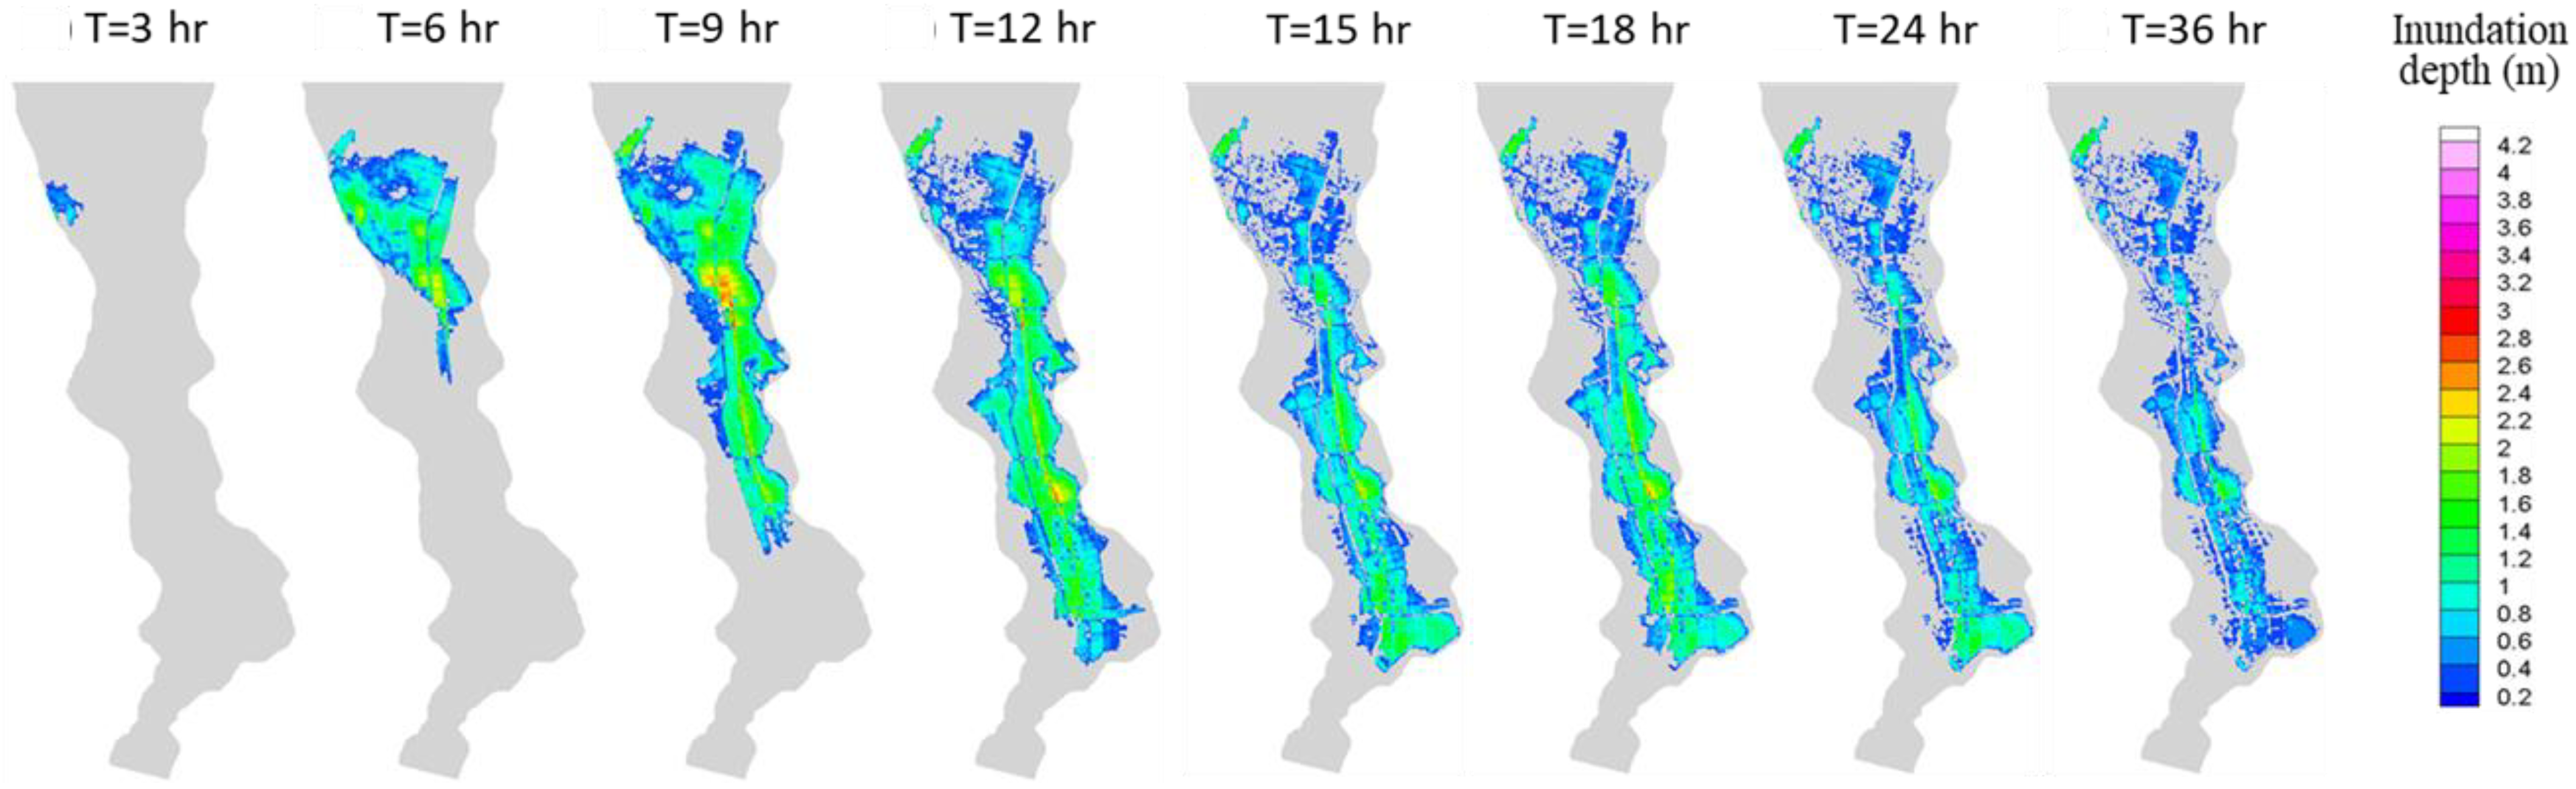
Figure 17 shows the simulation results for Case 3, in which the artificial inundation in the floodplain was caused by the overflow dike. Overflow started at an elapsed time of 2 h, peaked at 6 h, and ended at 10.5 h, as shown in
Figure 14b. After that, the inundation area gradually moved downstream while the water depth decreased. Compared with Case 1 with the levee breach shown in
Figure 16a, the inundation depth is smaller and the inundation time is shorter. The inundation depth was less than 0.5 m in most areas at an elapsed time of 36 h. Most importantly, the natural levees on which houses are located were not flooded at all. The reason for this is the difference in the total volume of floodwater. The flooding controlled by the overflow dike stops when the water level drops below the top of the dike, so the amount of floodwater is limited. For a levee breach, on the other hand, river overflow continues until the water level in the river channel falls below the ground level, resulting in a very large floodwater volume. This difference has a significant impact on flood damage in closed floodplains for which the downstream ends are interrupted by continuous embankments.
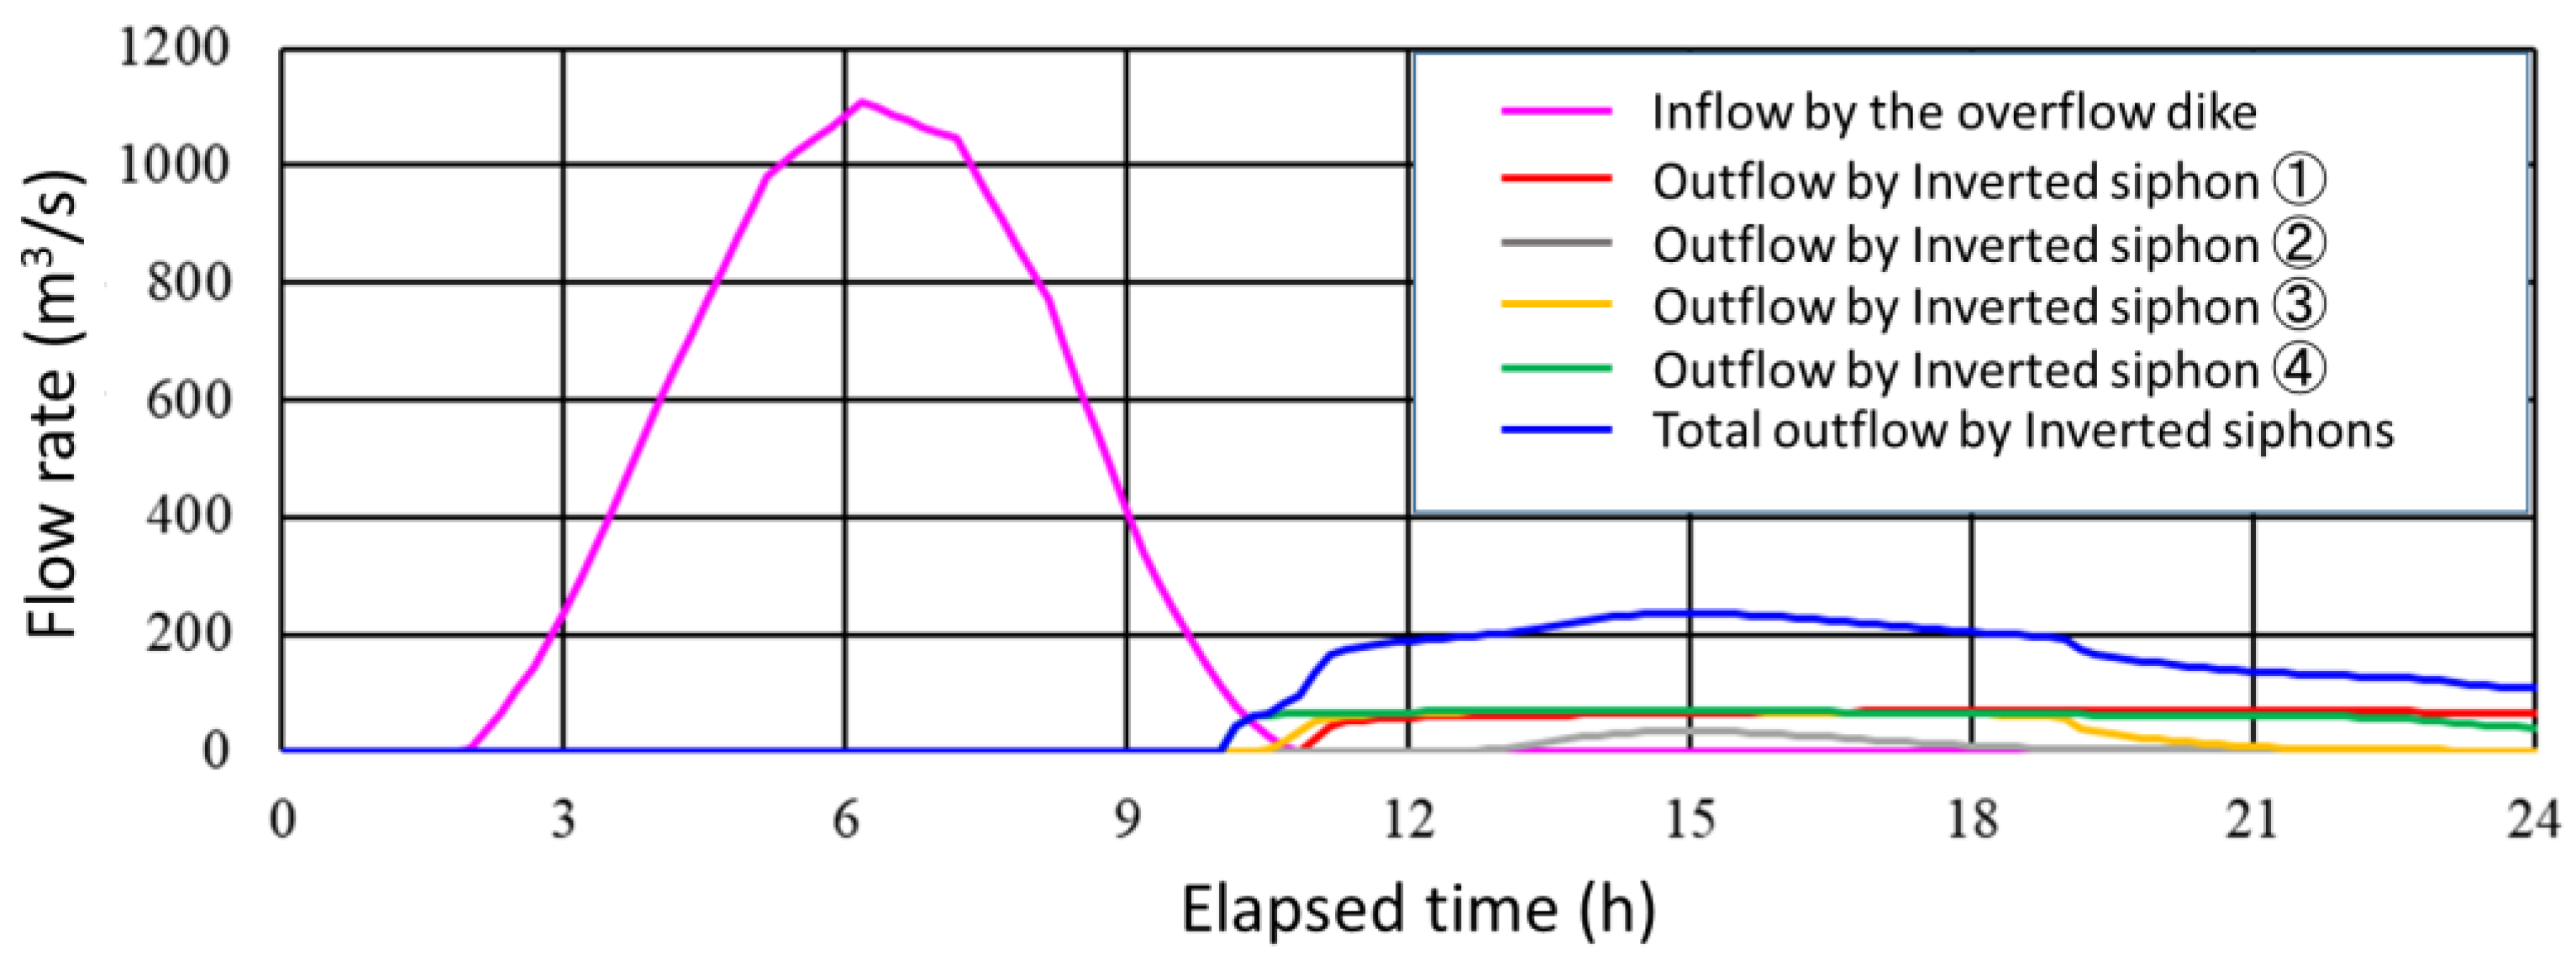
Figure 18 shows the time variation in outflow from the inverted siphon together with the inflow from the upstream overflow dike. The outflow peak is 240 m
3/s, which is much smaller than the inflow peak of 1150 m
3/s. This result shows that the RWRB has a large flood retarding effect. The remaining question is whether the discharge from the inverted siphon causes any serious problems in the downstream floodplain.
Using Manning’s equation for a shallow, wide channel shown below, the dimension of the drainage channel cross section required for flow at the above-mentioned discharge was approximated.
where
B is the channel depth,
Q is the flow rate (240 m
3/s),
h is the flow depth,
n is Manning’s roughness coefficient of the concrete channel (0.012), and
I is the slope (1/3000). Under the assumption that
h = 2 m, the obtained
B value was about 50 m.
Most of the Old Kinu River Floodplain is used for rice cultivation and thus the floodplain has many agricultural irrigation canals, which can be used to carry some of the discharge from the inverted siphon. However, the canals are divided into many narrow channels, so the water will overflow to the surrounding paddy fields while flowing in the channels. Therefore, the water storage capacity of paddy fields must be considered. The total volume of water discharged from the inverted siphon shown in
Figure 18 is approximately 10 million m
3 and the area of the Old Kinu River Floodplain is at least 40 km
2 (2 km × 20 km); therefore, even if all the floodwater from the inverted siphon is stored in the floodplain, the average water depth would be 25 cm, which is shallower than the standard ridge height (30 cm) of rice paddy fields in Japan.
The above arguments regarding the treatment of floodwater discharged from the inverse siphon must be verified by detailed numerical flow simulations combined with ongoing research on the development of paddy field dams, in which the on-site storage of rain in paddy fields is examined. However, it can be concluded that the Old Kinu River Floodplain has sufficient capacity for either allowing water to flow or storing it. Therefore, flood damage should be limited if some minor facilities are constructed for inundation water control.
6. Conclusions
In this study, the effectiveness of RWRB, which was proposed on the premise of the natural and social conditions of upper river basins in Japan, on flood mitigation in the middle basin of the Kinu River, one of the Rank A rivers through numerical flow simulation. The study site is a closed floodplain approximately 15 km long, 1.5 km wide, with a slope of 1/3000 and was severely flooded by a levee breach during an excess runoff in 2015.
In the numerical flow simulation, an overflow dike of 1000 m in length with the top elevation 1.5 m lower than the adjacent levee was installed at the upstream end of the floodplain. The downstream drainage facility has four inverted siphons, the total cross-sectional area of which was 100 m2. The results of numerical flood simulations using a shallow water flow model are summarized as follows:
- (1)
The flood peak discharge in the river channel was sufficiently reduced by the release of excess flood flow due to the overflow dike, and as a result, the risk of levee breach was greatly decreased;
- (2)
The inundation depth of the floodplain was much smaller than that of the 2015 flood due to the control of the flood volume by the overflow dike;
- (3)
Efficient drainage by an inverted siphon greatly shortened the inundation duration, and at the same time, the peak discharge from the siphon to the downstream floodplain was drastically reduced.
It is concluded that the RWRB is an effective measure against excess rain runoff even in the middle reaches of rivers where the ground slope is milder than that in the upstream reaches.
When introducing RWRB for mitigation of flood disaster caused by excess rain runoff, it is necessary to reach a regional consensus in advance on the new flood control policy, that is, to spread the inundation shallowly over a wide area in order to avoid levee breach. In addition, since the design and performance of the RWRB depends on the characteristics of the floodplain, it is important to compare the effects of RWRB alternatives through numerical simulations such as those conducted in this paper and apply the results to regional decision making.
Author Contributions
Conceptualization, T.I.; methodology, T.I. and R.A.; numerical simulation, R.A.; validation, T.I. and R.A.; investigation, T.I. and R.A.; writing—original draft preparation, T.I.; writing—review and editing, T.I. All authors have read and agreed to the published version of the manuscript.
Funding
This research received no external funding.
Data Availability Statement
Data are available on reasonable request.
Acknowledgments
We would like to thank Shiro Maeno of Okayama University for his valuable comments regarding this study.
Conflicts of Interest
The authors declare no conflict of interest.
References
- Wooyer, K.D. Bakfull frequency in rivers. J. Hydrol. 1968, 6, 114–142. [Google Scholar] [CrossRef]
- Edwards, P.J.; Watson, E.A.; Wood, F. Toward a better understanding of recurrence intervals, bankfull, and their importance. J. Contemp. Water Resour. Educ. 2019, 166, 35–45. [Google Scholar] [CrossRef]
- Ministry of Construction: The River Law with Commentary by Article. 1964. Available online: http://www.idi.or.jp/wp/wp-content/uploads/2018/05/RIVERE (accessed on 1 February 2023).
- Ministry of Land, Infrastructure, Transport and Tourism: River Basin Disaster Resilience and Sustainability by All. 2021. Available online: https://www.mlit.go.jp/river/kokusai/pdf/pdf21.pdf (accessed on 30 September 2022).
- Koike, K. Evolution of Japan’s flood control planning and policy in response to climate change risks and social changes. Water Policy 2021, 23, 77–84. [Google Scholar] [CrossRef]
- Ishikawa, T.; Akoh, R. Assessment of food risk management in lowland Tokyo areas in the seventeenth century by numerical flow simulations. Env. Fluid Mech. 2019, 19, 1295–1307. [Google Scholar] [CrossRef]
- Ishikawa, T.; Senoo, H. Hydraulic Evaluation of the Levee System Evolution on the Kurobe Alluvial Fan in the 18th and 19th Centuries. Energies 2021, 14, 4406. [Google Scholar] [CrossRef]
- Ishikawa, T. On intentional flooding in future flood control measures against floods exceeding river channel capacity. J. Jpn. Soc. Hydrol. Water Resour. 2020, 33, 263–270. (In Japanese) [Google Scholar]
- Ito, Y.; Ishikawa, T.; Akoh, R. Numerical Study on Flood Control Function of Running Water Type Retarding Basin Located along Valley Bottom Plain Rivers. Proc. JSCE B1 2020, 76, I_451–I_456. (In Japanese) [Google Scholar] [CrossRef] [PubMed]
- Geospatial Information Authority of Japan: GIS Maps. Available online: https://maps.gsi.go.jp (accessed on 24 December 2022).
- Ministry of Land, Infrastructure, Transport and Tourism: Status of Formulation of Basic River Maintenance Policy for First-Class River Systems. 2023. Available online: https://www.mlit.go.jp/river/basic_info/jigyo_keikaku/gaiyou/seibi (accessed on 1 February 2023). (In Japanese)
- Ministry of Land, Infrastructure, Transport and Tourism: River Improvement Plan for the Abukuma River System 2012. Available online: https://www.thr.mlit.go.jp/sendai/kasen_kaigan (accessed on 30 September 2022). (In Japanese)
- Ministry of Land, Infrastructure, Transport and Tourism: Report on Integrated Flood Management in River Basin based on Climate Change. Kasen 2020, 890, 10–14. (In Japanese)
- Opperman, J.J.; Luster, R.A.; McKenney, B.A.; Roberts, M.D.; Meadows, A.W. Ecologically functional floodplains, connectivity, flow regime, and scale. J. Am. Water Resour. Assoc. 2010, 46, 211–226. [Google Scholar] [CrossRef]
- Opperman, J.J. A Flood of Benefits: Using Green Infrastructure to Reduce Flood Risks, The Nature Conservancy, Arlington, Virginia. Available online: http://www.conservationgateway.org/ConservationPractices/Freshwater/HabitatProtectionandRestoration/Pages/floodofbenefits.aspx (accessed on 19 March 2023).
- The World Bank: Arable Land (Hectares PER Person). Available online: https://data.worldbank.org/indicator/AG.LND.ARBL.HA.PC (accessed on 19 March 2023).
- Ministry of Agriculture, Forestry and Fisheries: Domestic and Overseas Comparison of Farm Management Scale, Production Cost, etc. Available online: https://www.maff.go.jp/j/council/seisaku/syokuryo/210226/attach/pdf/index-15.pdf (accessed on 19 March 2023). (In Japanese)
- Yoshikawa, N.; Nagao, S.; Misawa, S. Evaluation of the flood mitigation effect of a Paddy Field Dam project. Agric. Water Manag. 2010, 97, 259–270. [Google Scholar] [CrossRef]
- Chai, Y.; Touge, Y.; Shi, K.; Kazama, S. Evaluatingpotential flood mitigation effect of paddy field dam for typhoon No.19 in 2019 in the Naruse River Basin. J. JSCE B1 2020, 76, 295–303. [Google Scholar] [CrossRef] [PubMed]
- Kobayashi, K.; Kono, Y.; Kimura, T.; Tanakamaru, H. Estimation of paddy field dam effect on flood mitigation focusing on Suse region of Hyogo, Japan. Hydrol. Res. Lett. 2021, 15, 64–70. [Google Scholar] [CrossRef]
- Wu, R.S.; Sue, W.R.; Chien, C.B.; Chen, C.H.; Cheng, J.S.; Lin, K.M. A simulation model for investigating the effects of rice paddy field on the runoff system. Math. Comput. Model. 2001, 33, 649–658. [Google Scholar] [CrossRef]
- Lee, K.T.; Huang, P.C. Assessment of flood mitigation through riparian detention in response to a changing climate—A case study. J. Earth Syst. Sci. 2018, 127, 83. [Google Scholar] [CrossRef]
- Shimodate River Office, Ministry of Land, Infrastructure, Transport and Tourism: Kokai River-Hakojima Retarding Basin. Available online: http://whrm-kamoto.com/assets/files/Kokai%20River-Hakojima%20retarding%20basin%201.pdf (accessed on 19 March 2023).
- Togashi, Y. Effects and Issues of the Kariyatagawa Retarding Basin in the 2011 Niigata-Fukushima Torrential Rain 2012, Ministry of Land, Infrastructure, Transport and Tourism National Land Technology Study Group Report. Available online: https://jglobal.jst.go.jp/detail?JGLOBAL_ID=202202214855989167 (accessed on 19 March 2023). (In Japanese)
- Senoo, H.; Ishikawa, T. Trial evaluation of the effect of distributed detention ponds for extraordinary flood in the upper Abukuma River. Adv. River Eng. JSCE 2022, 28, 439–444. (In Japanese) [Google Scholar]
- Ministry of Land, Infrastructure, Transport and Tourism: Damage by 2015 Kinu River Flood and Restoration Status. 2015. Available online: https://www.ktr.mlit.go.jp/ktr_content/content (accessed on 30 September 2022). (In Japanese)
- Ministry of Land, Infrastructure, Transport and Tourism: Tone River System Kinu River Improvement Plan. 2016. Available online: https://www.ktr.mlit.go.jp/ktr_content/content (accessed on 30 September 2022). (In Japanese)
- Chow, V.T. Open Channel Hydraulics; International Student Edition; McGraw-Hill Book Company, INC.: New York, NY, USA, 1959; p. 80. [Google Scholar]
- Nezu, I.; Nakagawa, H. Turbulence in Open-Channel Flows; IAHR-monograph: Amsterdam, The Netherlands; Balkema: Boca Raton, FL, USA, 1993. [Google Scholar]
- Honma, H. Coefficient of flow volume on low overflow weir. Proc. JSCE 1940, 26, 635–645. (In Japanese) [Google Scholar]
- Geographical Survey Institute: Fundamental Geospatial Data, Digital Elevation Model. Available online: https://fgd.gsi.go.jp/download (accessed on 30 September 2022).
- Ohtsuki, K.; Nihei, Y.; Niroshinie, M.A.C. Field survey and simulation for flood disaster in Joso City by the Kinu-gawa River flooding on September 2015. Adv. River Eng. JSCE 2016, 22, 315–320. (In Japanese) [Google Scholar]
Figure 1.
Shaded relief map of main part of Japanese archipelago.
Figure 1.
Shaded relief map of main part of Japanese archipelago.
Figure 2.
River channels of 109 first-class water systems in Japan.
Figure 2.
River channels of 109 first-class water systems in Japan.
Figure 3.
Example of topography of upper river basin (Abukuma River); (a) shaded relief map and (b) landform classification map for flood control.
Figure 3.
Example of topography of upper river basin (Abukuma River); (a) shaded relief map and (b) landform classification map for flood control.
Figure 4.
Expected achievement for first river improvement plan.
Figure 4.
Expected achievement for first river improvement plan.
Figure 5.
Schematic diagrams of upstream floodplain; (a) plan view and (b) cross section.
Figure 5.
Schematic diagrams of upstream floodplain; (a) plan view and (b) cross section.
Figure 6.
Schematic diagram of RWRB.
Figure 6.
Schematic diagram of RWRB.
Figure 7.
Study site (Old Kinu River Floodplain); (a) flood control landform classification map and (b) topographical cross section of survey line indicated by red line in (a) (T.P.: Tokyo Peil).
Figure 7.
Study site (Old Kinu River Floodplain); (a) flood control landform classification map and (b) topographical cross section of survey line indicated by red line in (a) (T.P.: Tokyo Peil).
Figure 8.
Closed floodplain damaged by flooding in 2015; (
a) enlarged view of upstream floodplain indicated in
Figure 7 and (
b) cross sections seen from downstream of three transverse lines in (
a).
Figure 8.
Closed floodplain damaged by flooding in 2015; (
a) enlarged view of upstream floodplain indicated in
Figure 7 and (
b) cross sections seen from downstream of three transverse lines in (
a).
Figure 9.
Flooding in closed floodplain; (a) time variation in inundation area and (b) south end topography of closed floodplain.
Figure 9.
Flooding in closed floodplain; (a) time variation in inundation area and (b) south end topography of closed floodplain.
Figure 10.
Application of RWRB to closed basin of Kinu River Floodplain.
Figure 10.
Application of RWRB to closed basin of Kinu River Floodplain.
Figure 11.
Model of narrow linear embankment.
Figure 11.
Model of narrow linear embankment.
Figure 12.
Model of topography; (a) ground elevation and (b) roads, irrigation channel, and inlet and outlet locations of inverted siphon.
Figure 12.
Model of topography; (a) ground elevation and (b) roads, irrigation channel, and inlet and outlet locations of inverted siphon.
Figure 13.
Rate of inflow and outflow for 2015 flood; inset shows magnified view.
Figure 13.
Rate of inflow and outflow for 2015 flood; inset shows magnified view.
Figure 14.
(a) Depth and (b) discharge for overflow dike.
Figure 14.
(a) Depth and (b) discharge for overflow dike.
Figure 15.
Reproducibility of highest water levels for 2015 flood; (a) highest water level obtained from flood trace and (b) correlation between observed and calculated water level.
Figure 15.
Reproducibility of highest water levels for 2015 flood; (a) highest water level obtained from flood trace and (b) correlation between observed and calculated water level.
Figure 16.
Variation in water depth distribution; (a) drainage by pump station (Case 1) and (b) drainage by inverted siphon (Case 2).
Figure 16.
Variation in water depth distribution; (a) drainage by pump station (Case 1) and (b) drainage by inverted siphon (Case 2).
Figure 17.
Water depth variation in RWRB (Case 3).
Figure 17.
Water depth variation in RWRB (Case 3).
Figure 18.
RWRB performance for excess flood mitigation.
Figure 18.
RWRB performance for excess flood mitigation.
Table 1.
Comparison of arable land and farm management scale in several regions.
Table 1.
Comparison of arable land and farm management scale in several regions.
| | Japan | United States | European Union | Australia |
|---|
| Arable land per capita (ha) [16] | 0.03 | 0.48 | 0.22 | 1.19 |
| Farm management scale (ha) [17] | 2.87 | 179.0 | 16.1 | 3124.5 |
Table 2.
Siphon parameters.
Table 2.
Siphon parameters.
| | Pipe Length (km) | |
|---|
| Siphon 1 | 2.5 | 0.40 |
| Siphon 2 | 2.5 | 0.40 |
| Siphon 3 | 3.4 | 0.35 |
| Siphon 4 | 3.3 | 0.355 |
Table 3.
Simulation cases.
Table 3.
Simulation cases.
| | Inflow Condition | Outflow Condition |
|---|
| Case 1 | 2015 flood | Drainage by pump |
| Case 2 | 2015 flood | Inverted siphon |
| Case 3 | Flow from overflow dike | Inverted siphon |
| Disclaimer/Publisher’s Note: The statements, opinions and data contained in all publications are solely those of the individual author(s) and contributor(s) and not of MDPI and/or the editor(s). MDPI and/or the editor(s) disclaim responsibility for any injury to people or property resulting from any ideas, methods, instructions or products referred to in the content. |
© 2023 by the authors. Licensee MDPI, Basel, Switzerland. This article is an open access article distributed under the terms and conditions of the Creative Commons Attribution (CC BY) license (https://creativecommons.org/licenses/by/4.0/).


