

Evaluation of Groundwater Quality Using the Water Quality Index (WQI) and Human Health Risk (HHR) Assessment in West Bank, Palestine


Abstract
:1. Introduction
2. Materials and Methods
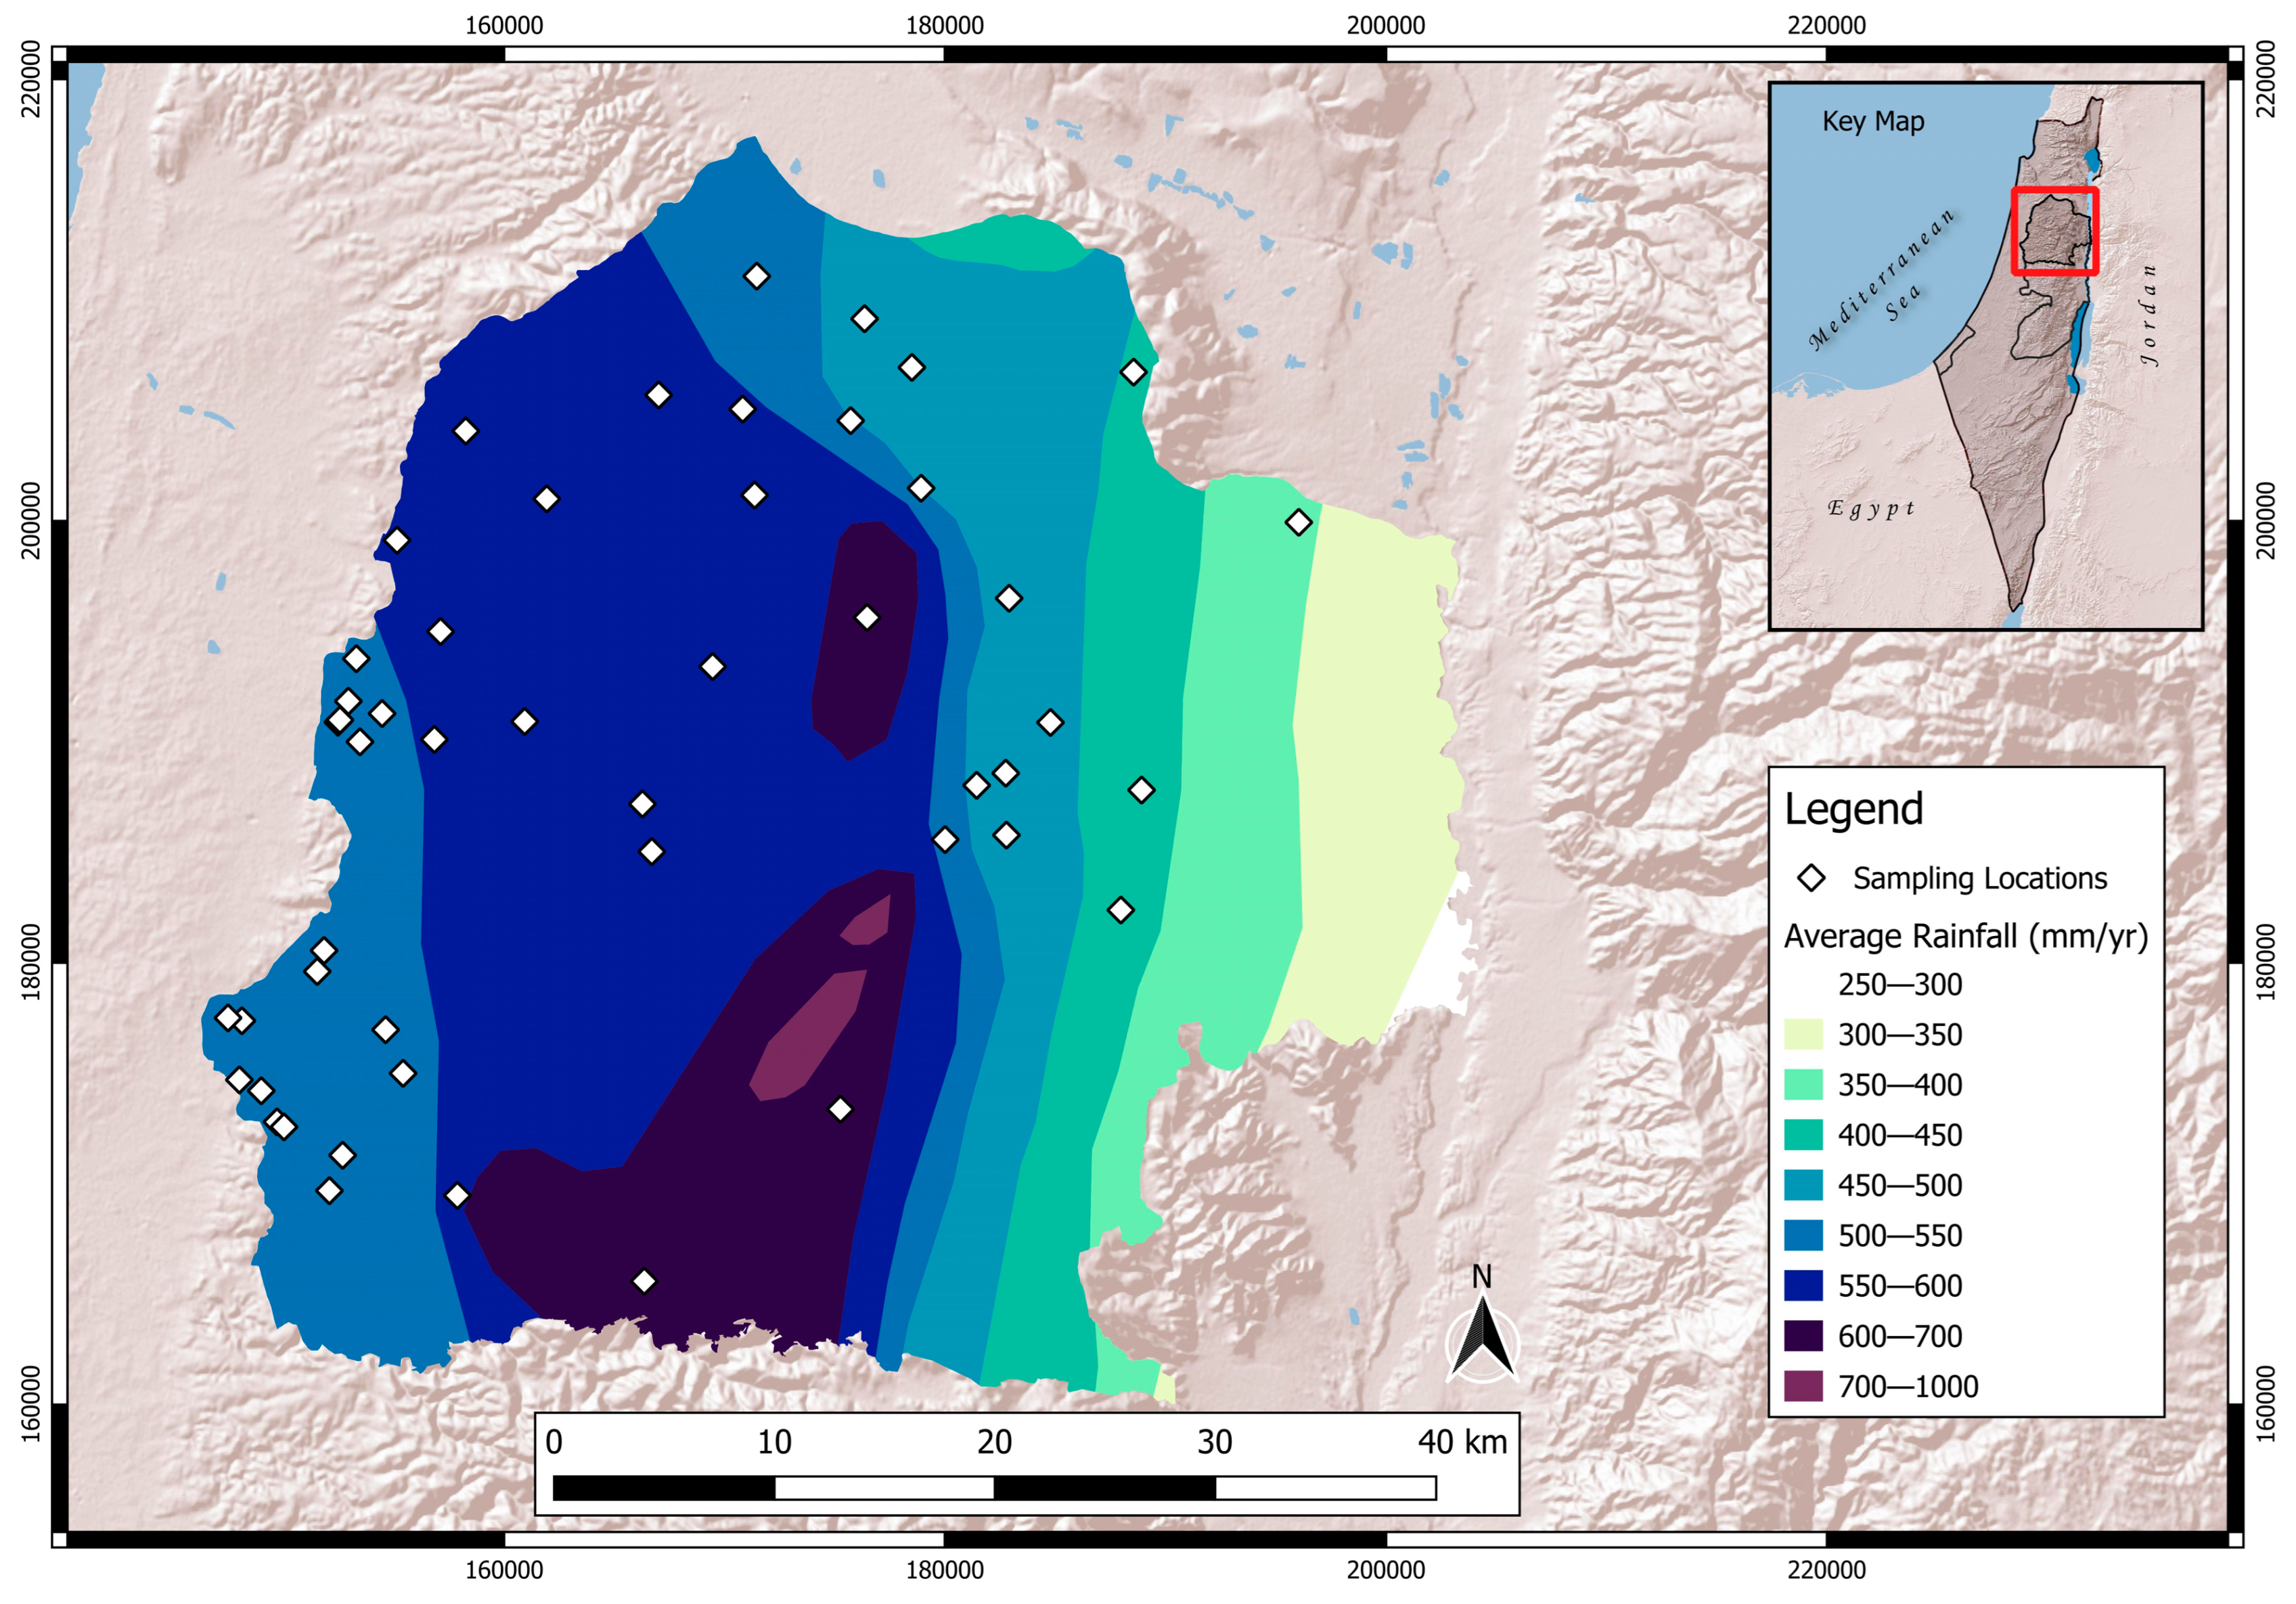
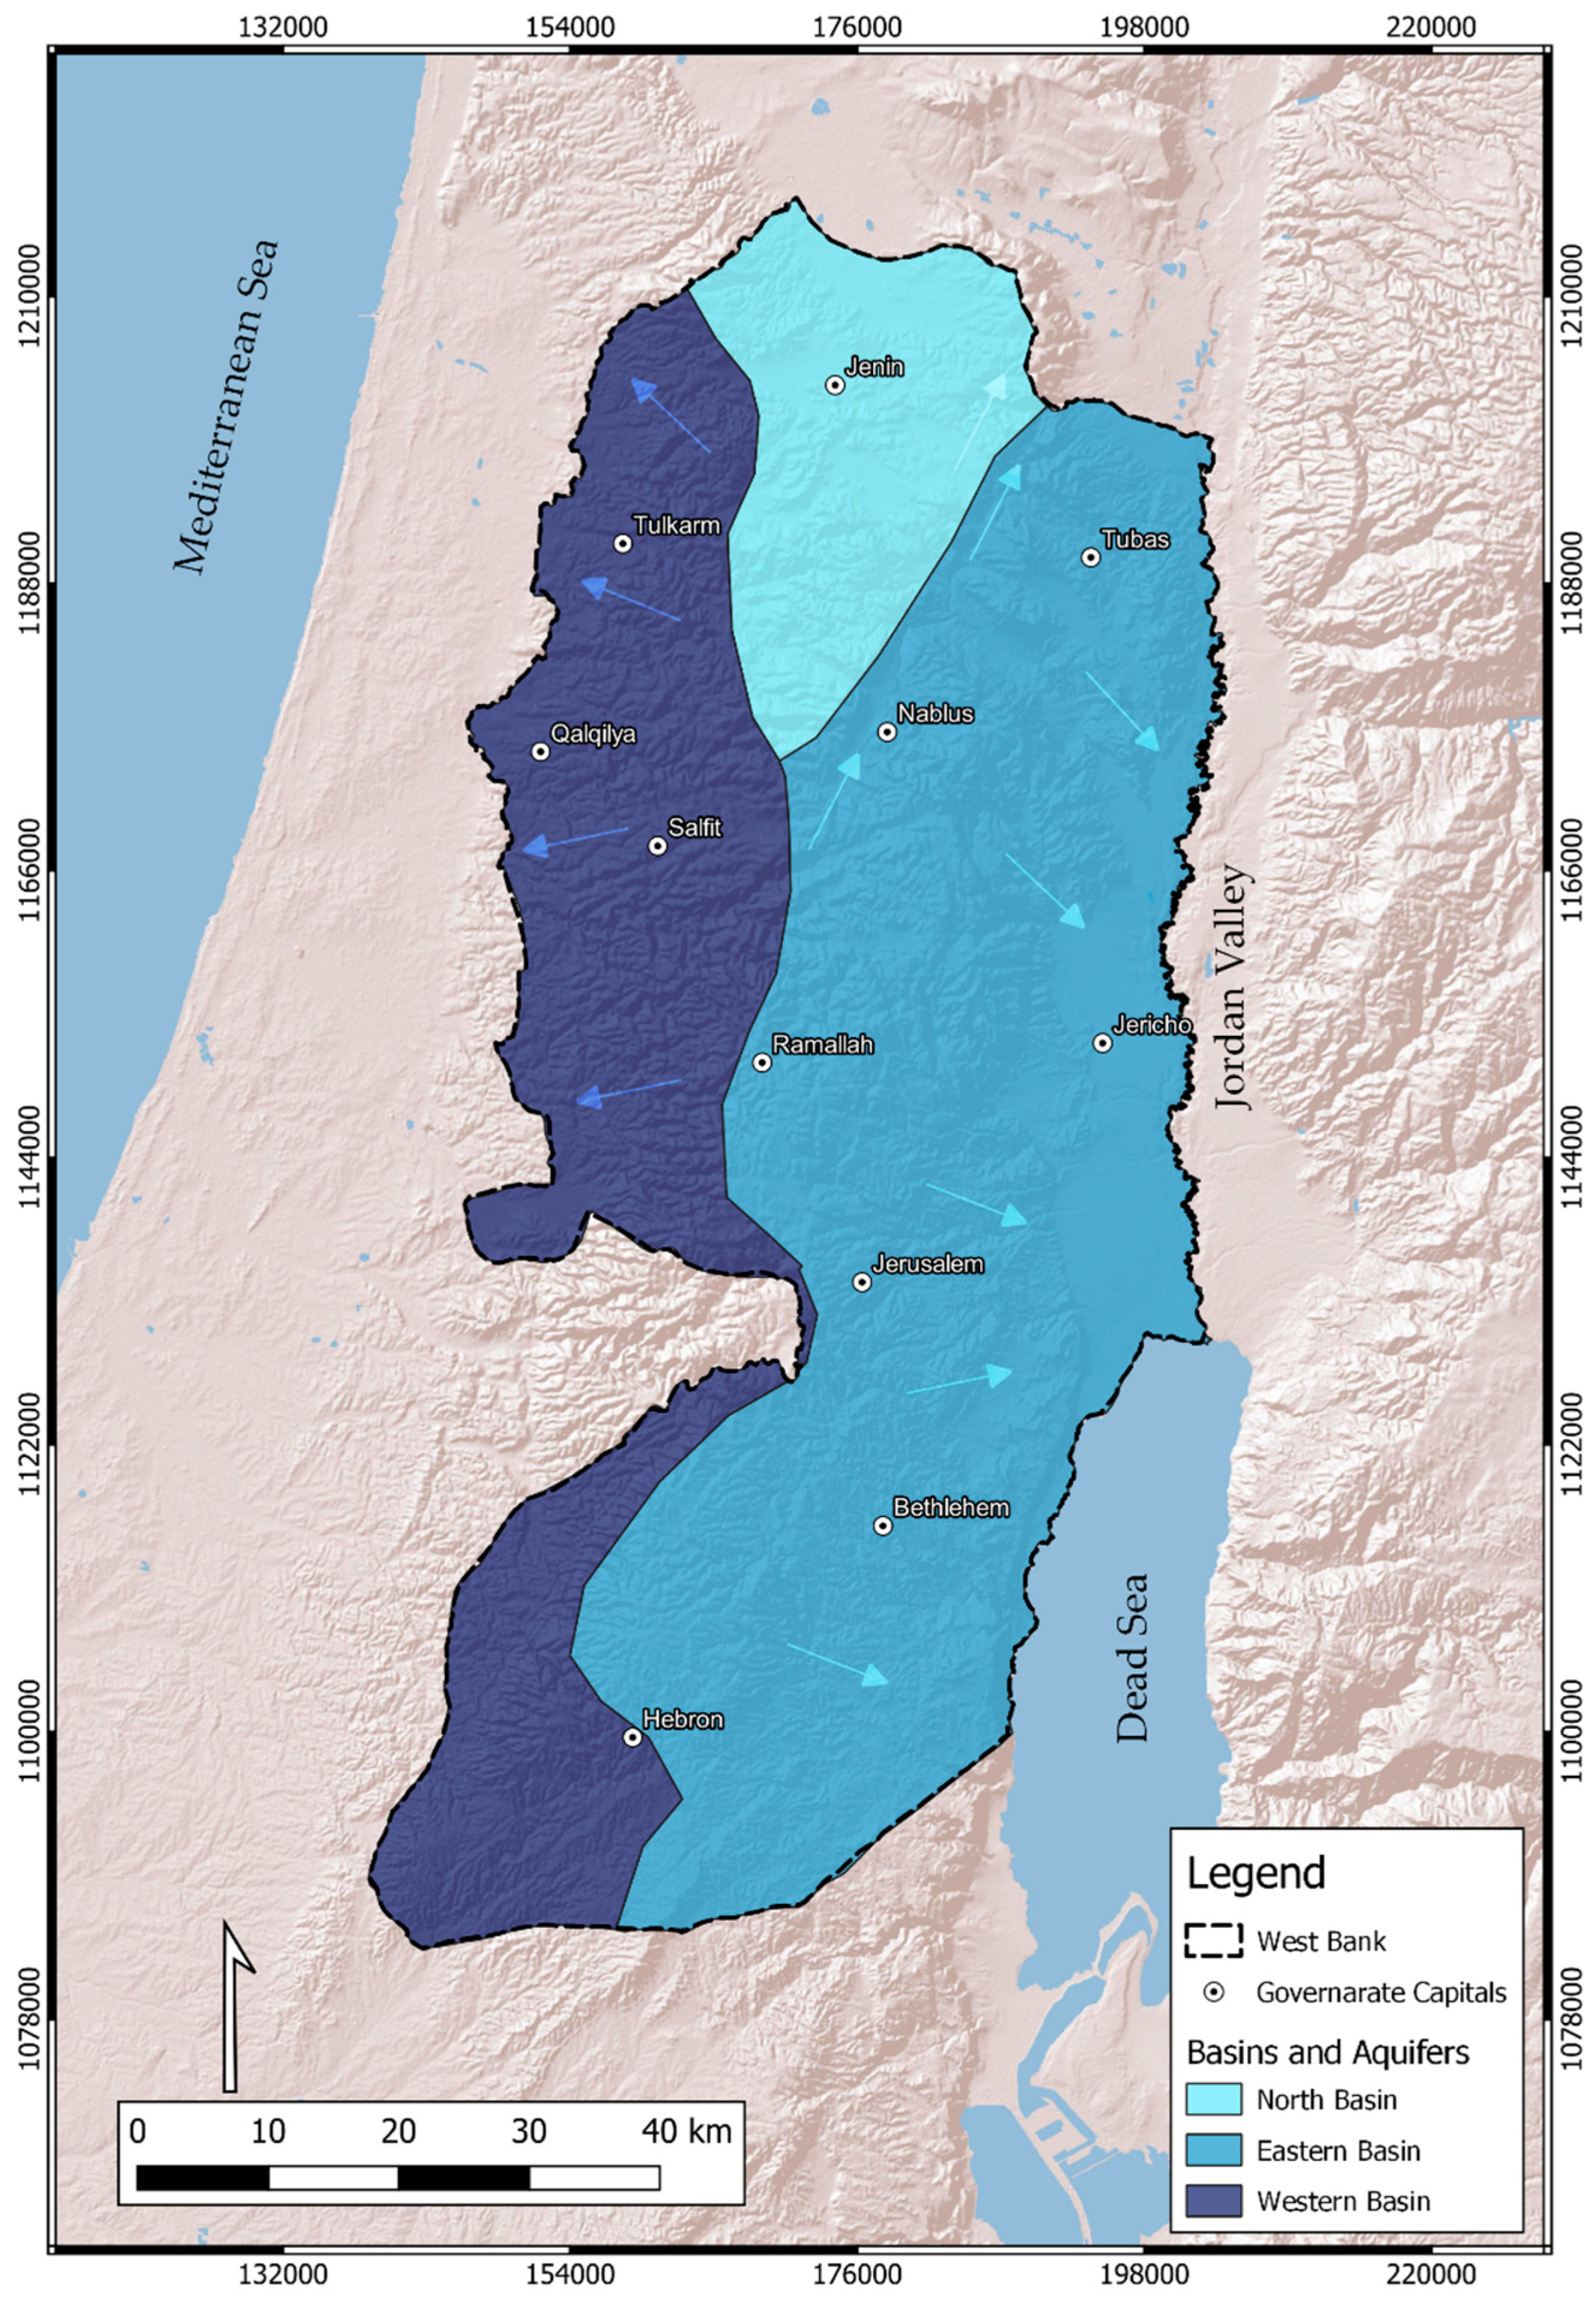
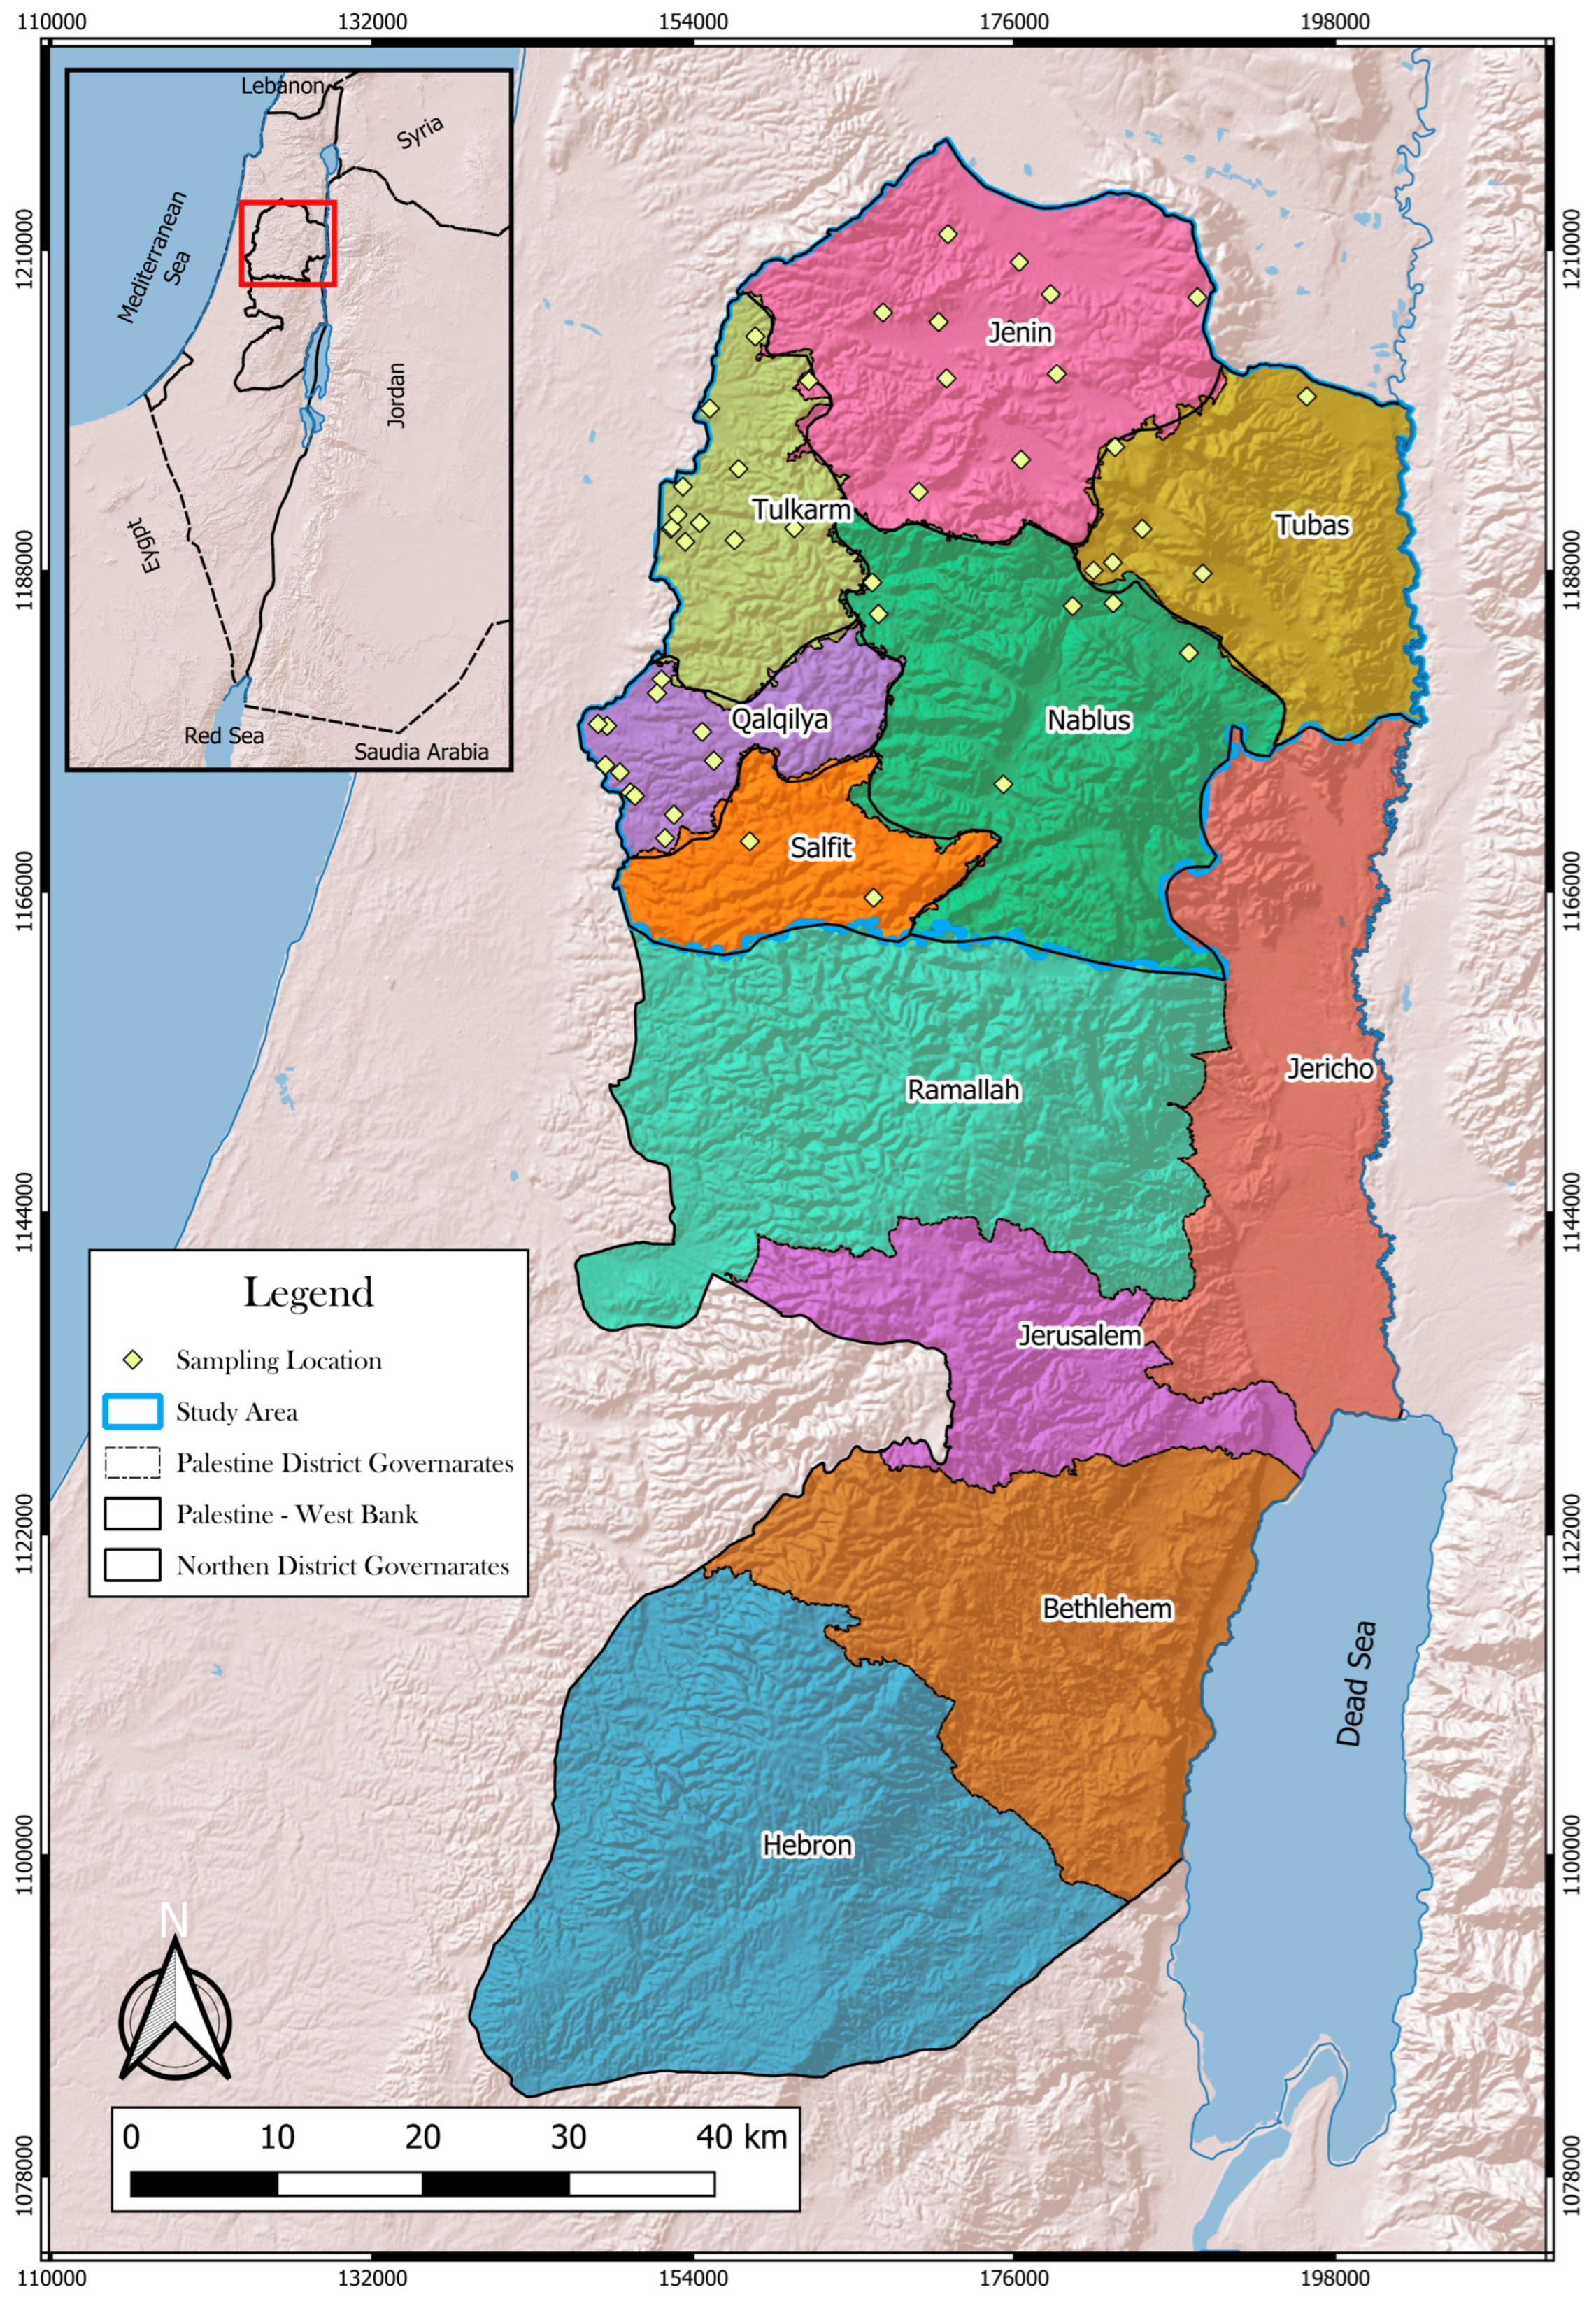
2.1. Study Area
2.2. Groundwater Sampling and Analysis
2.3. Methods
2.3.1. Water Quality Index (WQI)

| Chemical Parameter | Weight (wi) | Wi (wi/∑wi) | PSI |
|---|---|---|---|
| pH | 3 | 0.083 | 6.5–7.5 |
| TDS | 4 | 0.111 | 500 |
| TH | 2 | 0.056 | 500 |
| Ca2+ | 3 | 0.083 | 75 |
| Mg2+ | 2 | 0.056 | 50 |
| Na+ | 3 | 0.083 | 200 |
| K+ | 2 | 0.056 | 10 |
| Cl− | 3 | 0.083 | 250 |
| SO42− | 4 | 0.111 | 250 |
| NO3− | 5 | 0.139 | 50 |
| F− | 5 | 0.139 | 1.5 |
| Total | 36 | 1 |
2.3.2. Human Health Risk (HHR) Assessment
3. Results
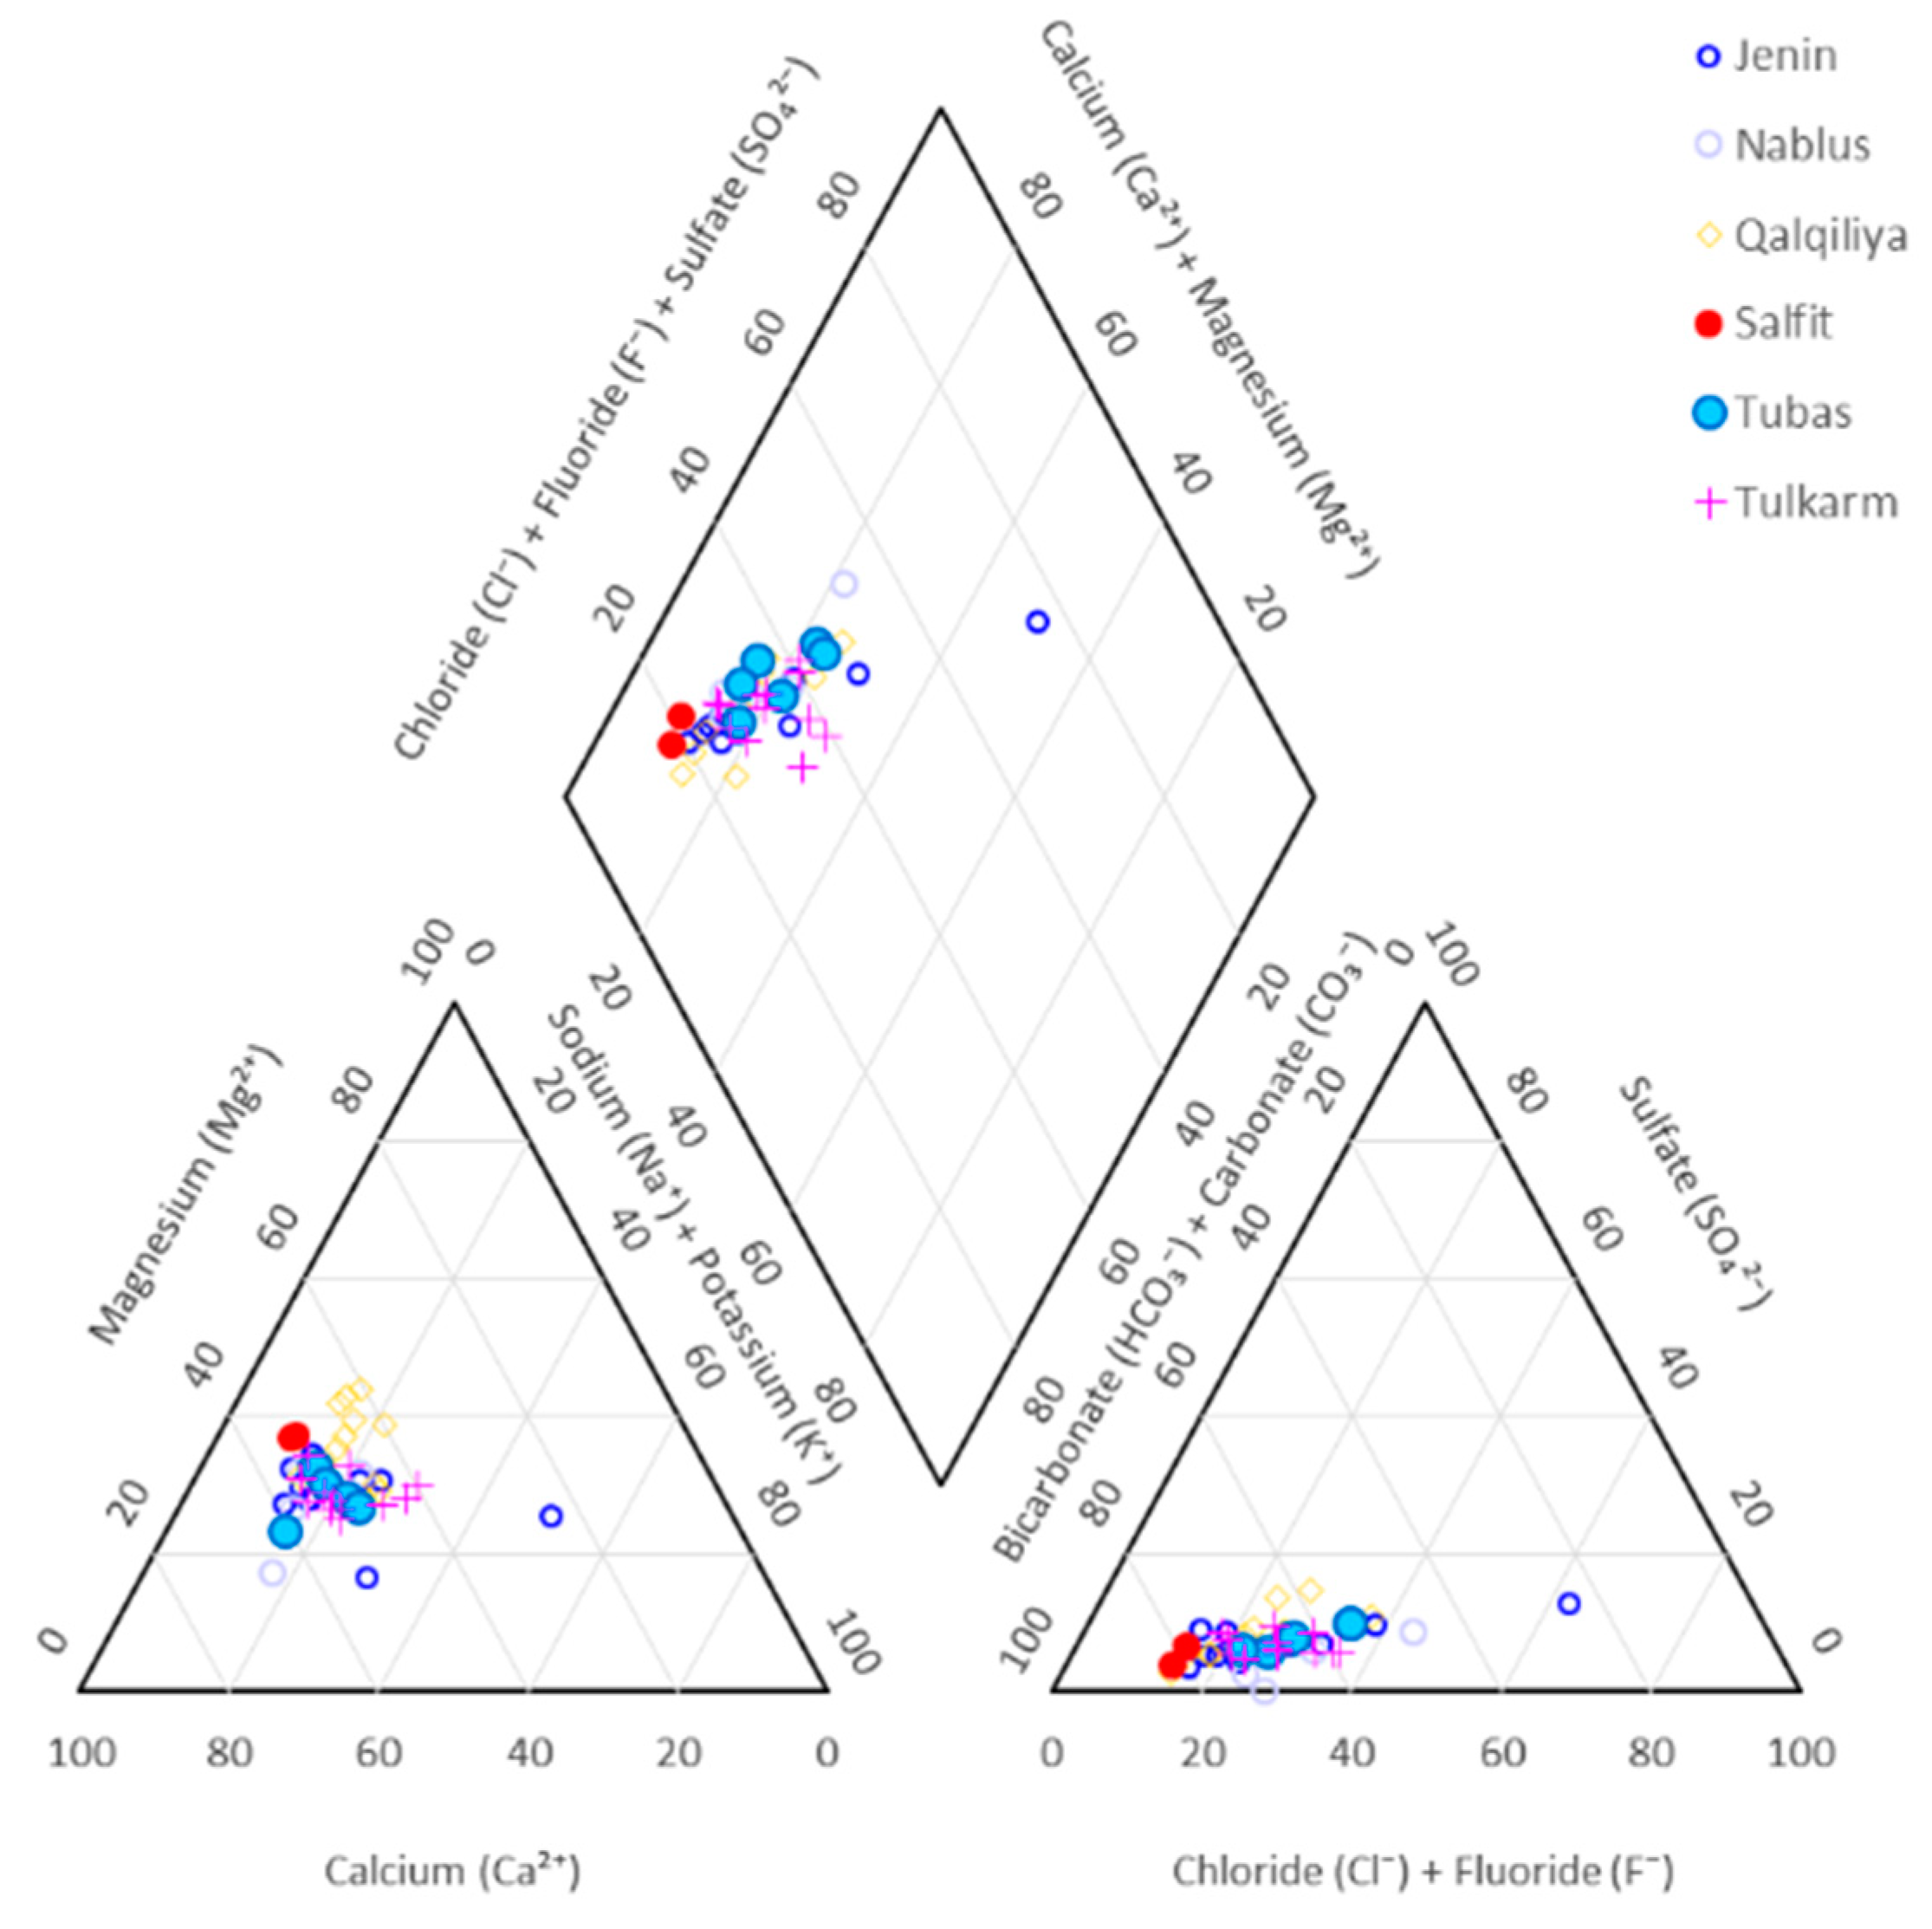
3.1. The Dominant Water Type
3.2. Water Quality Index in Groundwater
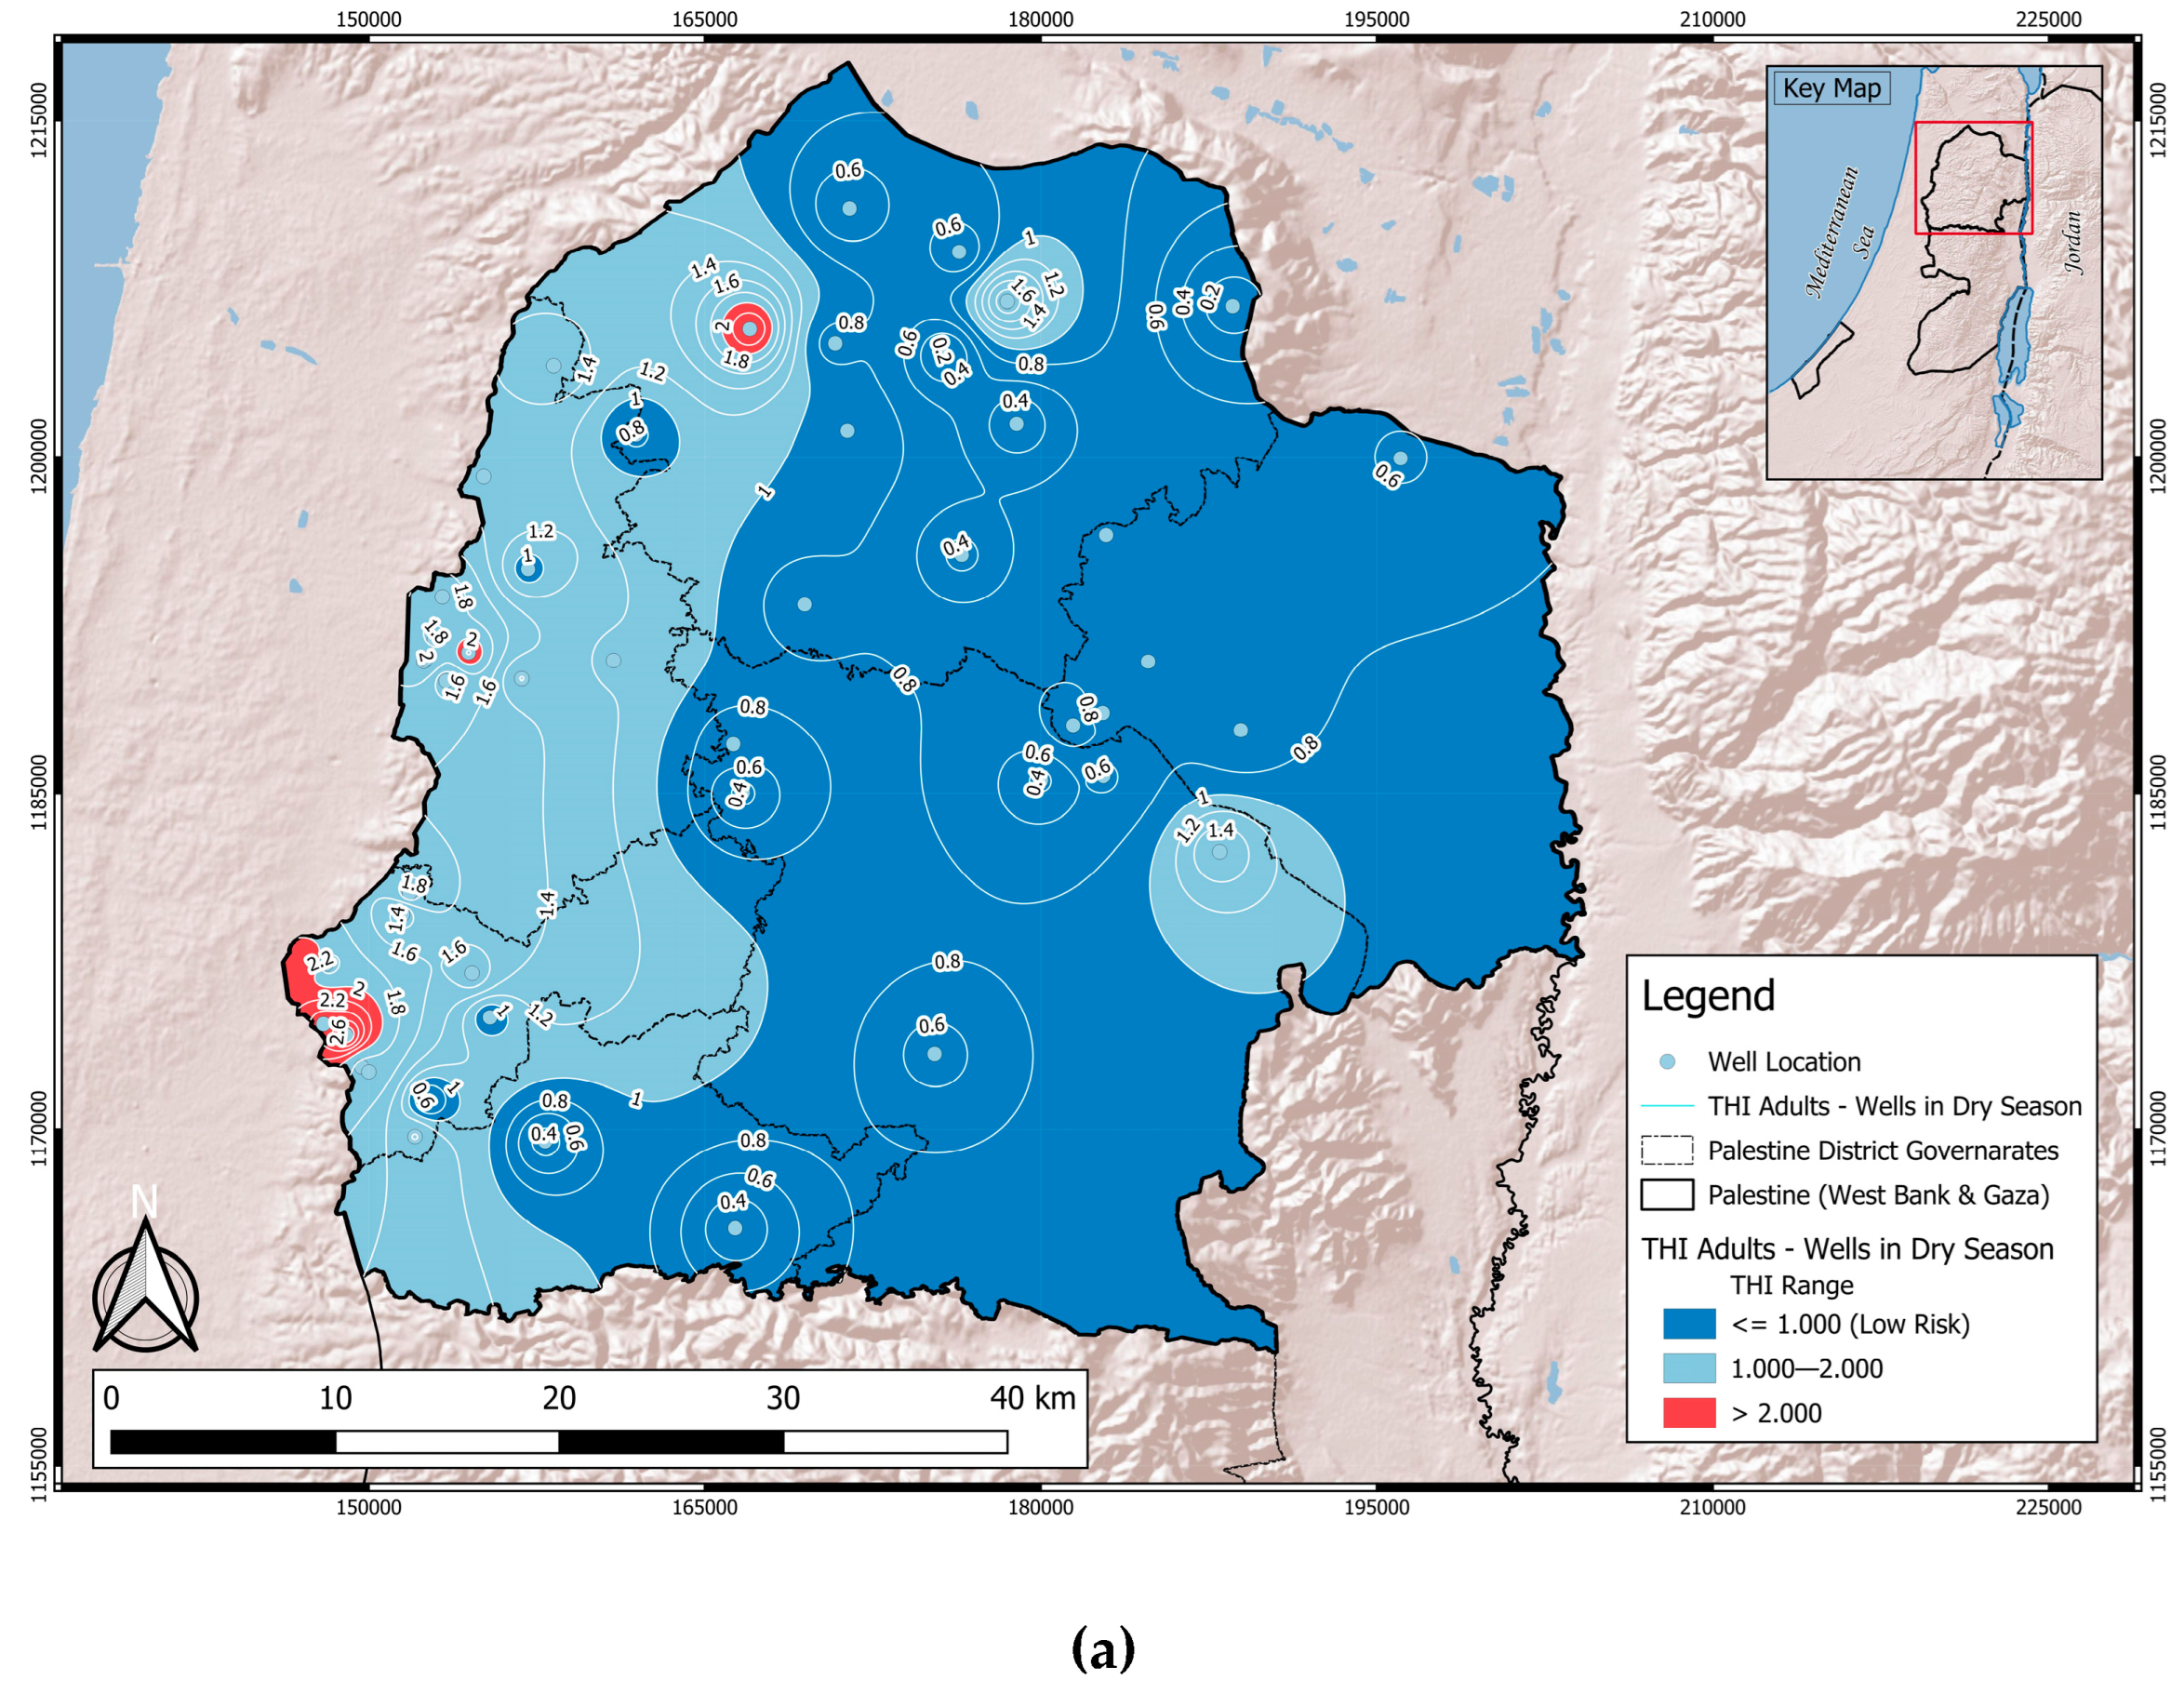
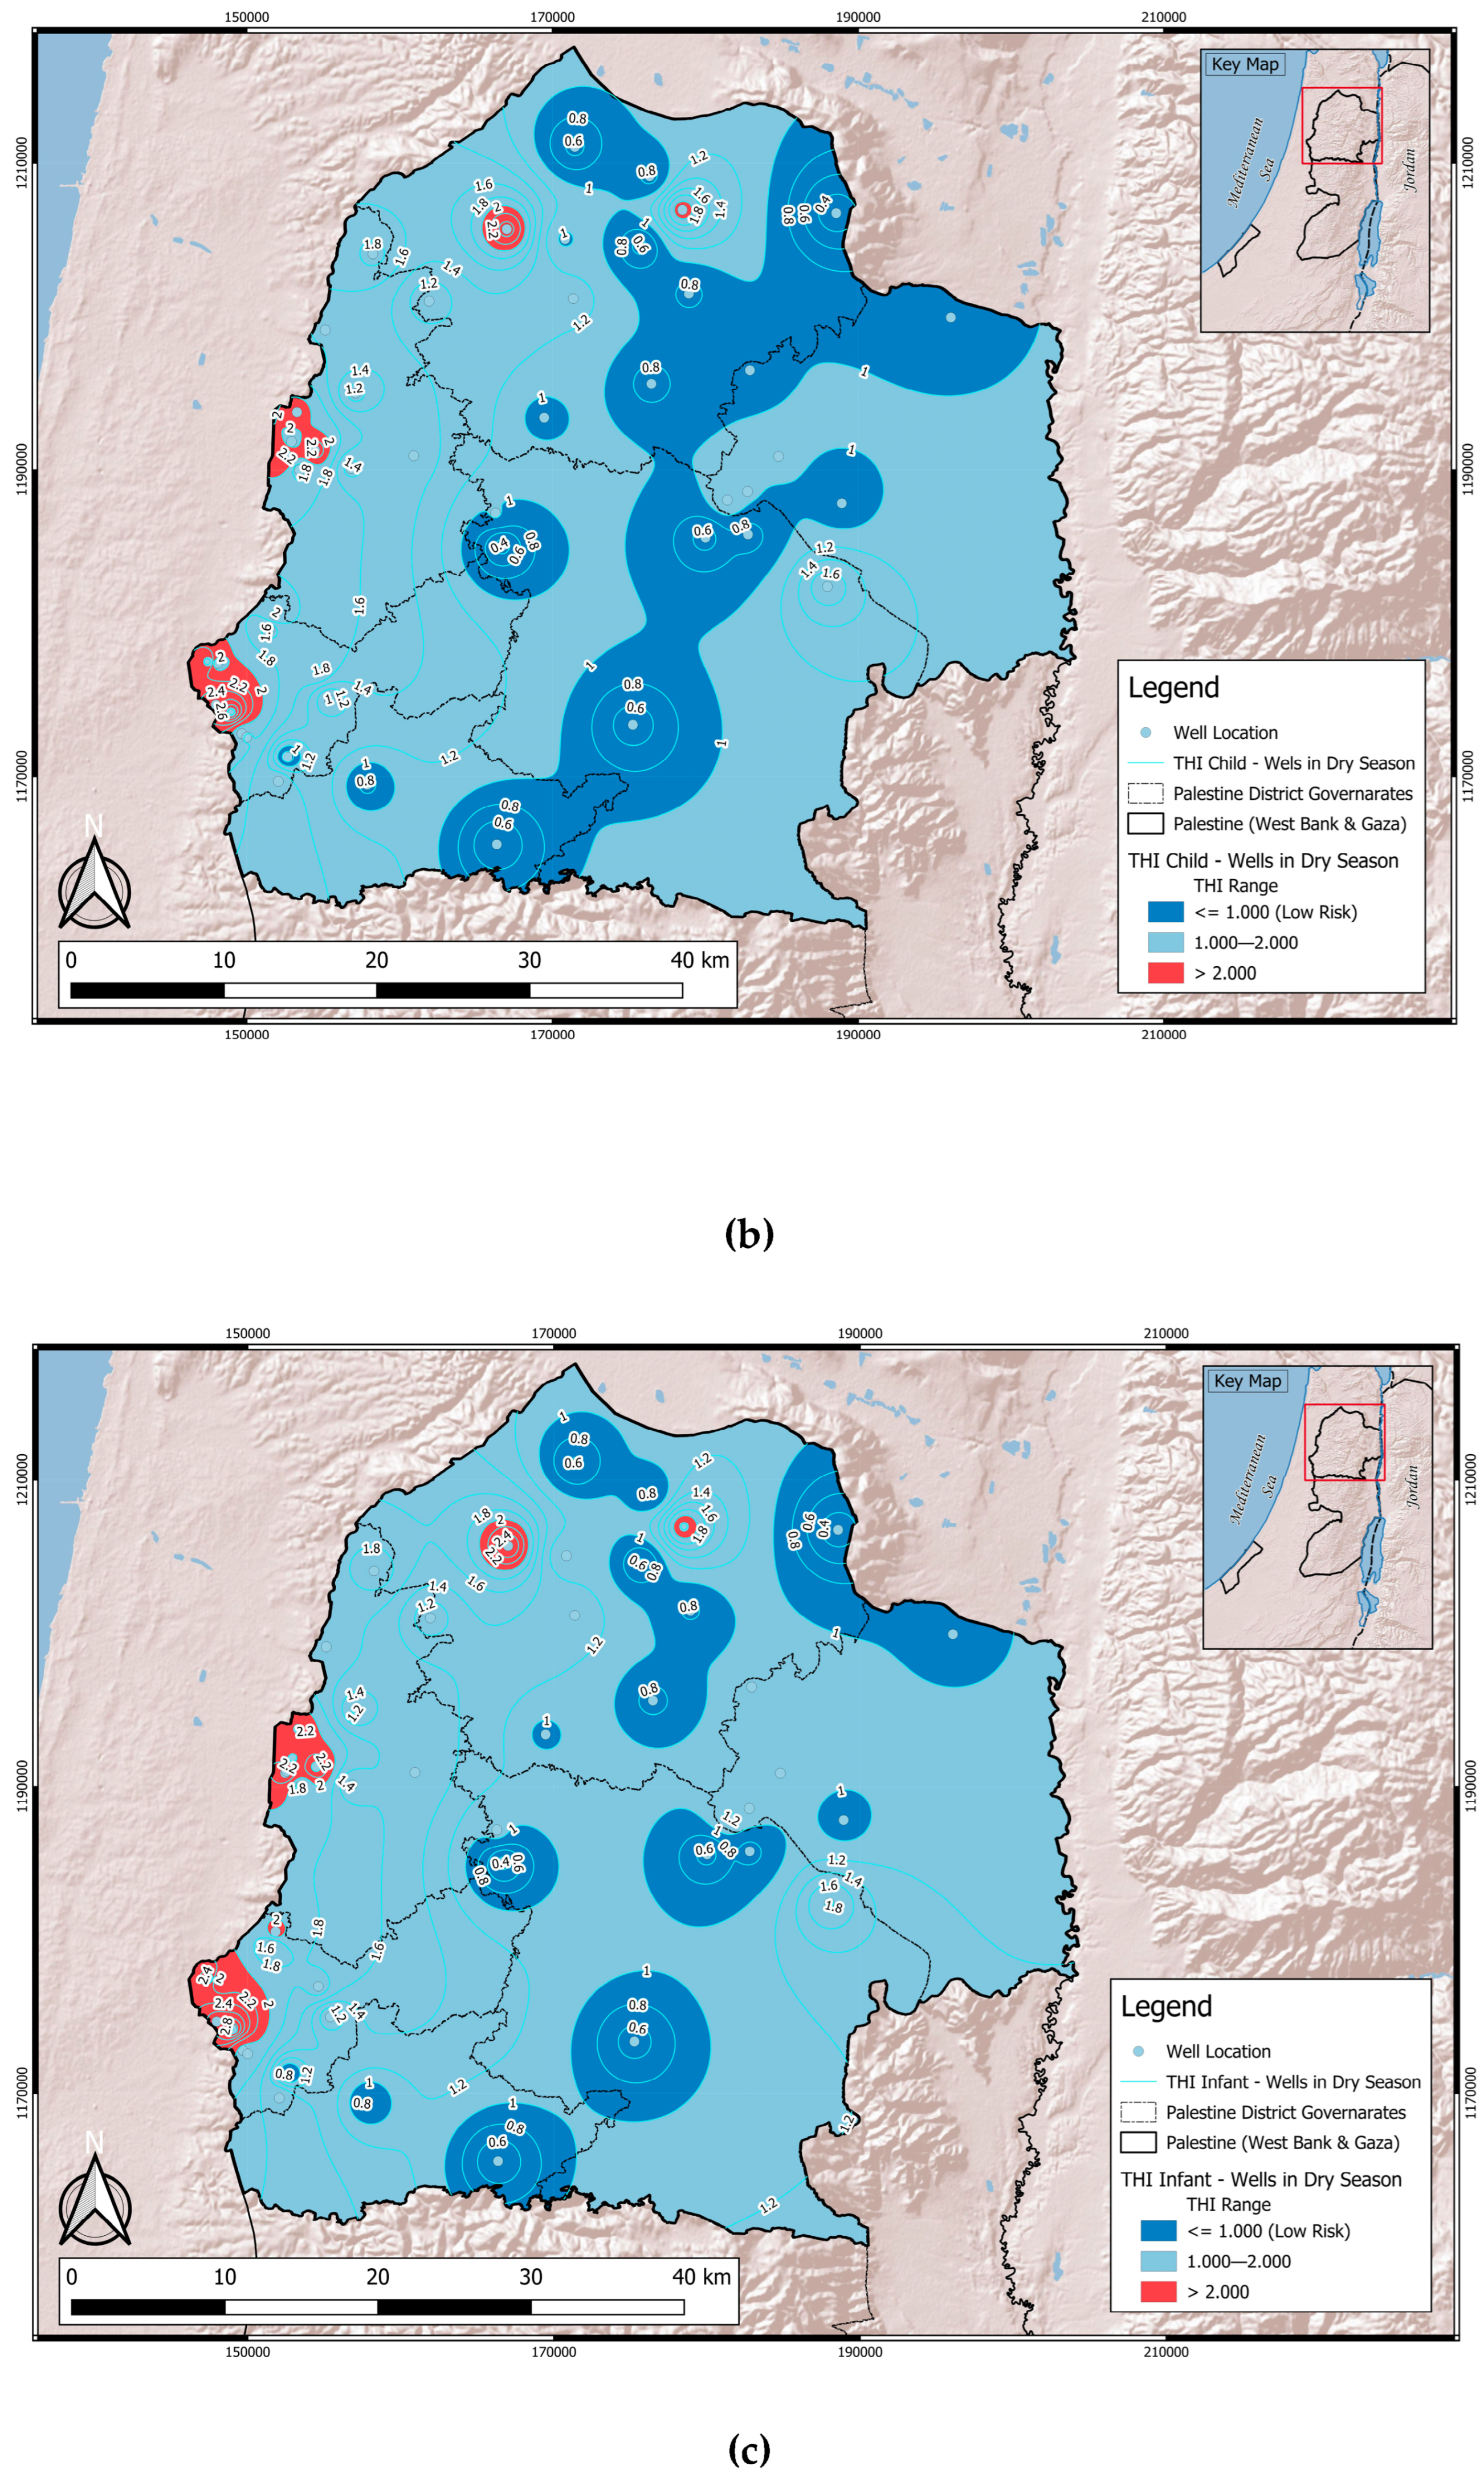
3.3. Human Health Risk Assessment
| Well_ID | Adults | Children | Infants | ||||||
|---|---|---|---|---|---|---|---|---|---|
| HQF | HQNO3 | THI | HQF | HQNO3 | THI | HQF | HQNO3 | THI | |
| 15–19/017 | 0.06 | 1.86 | 1.92 | 0.40 | 1.78 | 2.18 | 0.41 | 1.86 | 2.27 |
| 15–19/018 | 0.08 | 1.97 | 2.05 | 0.46 | 1.89 | 2.35 | 0.48 | 1.97 | 2.45 |
| 15–19/046 | 0.02 | 1.71 | 1.73 | 0.23 | 1.64 | 1.87 | 0.24 | 1.71 | 1.95 |
| 15–19/006 | 0.03 | 1.94 | 1.96 | 0.26 | 1.86 | 2.12 | 0.27 | 1.94 | 2.21 |
| 15–19/001A | 0.03 | 2.17 | 2.21 | 0.29 | 2.09 | 2.38 | 0.30 | 2.17 | 2.48 |
| 15–19/004A | 0.04 | 1.40 | 1.44 | 0.30 | 1.34 | 1.64 | 0.32 | 1.40 | 1.71 |
| 15–20/008 | 0.07 | 1.49 | 1.56 | 0.42 | 1.43 | 1.85 | 0.43 | 1.49 | 1.93 |
| 15–19/047A | 0.03 | 0.87 | 0.90 | 0.29 | 0.83 | 1.13 | 0.30 | 0.87 | 1.17 |
| 15–19/028 | 0.01 | 1.18 | 1.20 | 0.19 | 1.14 | 1.32 | 0.20 | 1.18 | 1.38 |
| 16–20/005 | 0.05 | 0.72 | 0.77 | 0.35 | 0.69 | 1.04 | 0.37 | 0.72 | 1.08 |
| 16–19/002 | 0.06 | 1.09 | 1.15 | 0.39 | 1.05 | 1.43 | 0.40 | 1.09 | 1.49 |
| 15–19/010 | 0.05 | 1.30 | 1.35 | 0.34 | 1.25 | 1.59 | 0.35 | 1.30 | 1.66 |
| 14–17/043 | 0.02 | 1.60 | 1.62 | 0.21 | 1.54 | 1.75 | 0.22 | 1.60 | 1.82 |
| 14–17/044 | 0.02 | 1.77 | 1.78 | 0.21 | 1.69 | 1.90 | 0.22 | 1.77 | 1.98 |
| 14–17/001 | 0.02 | 2.99 | 3.01 | 0.21 | 2.87 | 3.08 | 0.22 | 2.99 | 3.21 |
| 15–17/012 | 0.04 | 1.22 | 1.26 | 0.31 | 1.17 | 1.49 | 0.33 | 1.22 | 1.55 |
| 15–17/004 | 0.01 | 1.71 | 1.72 | 0.18 | 1.64 | 1.82 | 0.18 | 1.71 | 1.90 |
| 15–17/007 | 0.01 | 0.84 | 0.85 | 0.18 | 0.81 | 0.99 | 0.18 | 0.84 | 1.03 |
| 15–16/003 | 0.02 | 1.39 | 1.40 | 0.21 | 1.33 | 1.54 | 0.22 | 1.39 | 1.60 |
| 15–18/004 | 0.02 | 1.90 | 1.92 | 0.21 | 1.82 | 2.03 | 0.22 | 1.90 | 2.12 |
| 15–17/019 | 0.02 | 0.52 | 0.53 | 0.21 | 0.50 | 0.70 | 0.22 | 0.52 | 0.73 |
| 14–17/021 | 0.03 | 1.63 | 1.66 | 0.29 | 1.56 | 1.86 | 0.30 | 1.63 | 1.93 |
| 14–17/034 | 0.04 | 2.23 | 2.27 | 0.31 | 2.14 | 2.45 | 0.33 | 2.23 | 2.55 |
| 14–17/052 | 0.02 | 2.48 | 2.49 | 0.22 | 2.37 | 2.59 | 0.23 | 2.48 | 2.70 |
| 17–20/050Q | 0.21 | 0.01 | 0.23 | 0.73 | 0.01 | 0.74 | 0.76 | 0.01 | 0.77 |
| 17–19/009 | 0.08 | 0.27 | 0.35 | 0.44 | 0.26 | 0.70 | 0.46 | 0.27 | 0.73 |
| 17–20/052J | 0.09 | 0.08 | 0.17 | 0.47 | 0.08 | 0.55 | 0.49 | 0.08 | 0.57 |
| 17–20/033J | 0.04 | 1.88 | 1.92 | 0.33 | 1.80 | 2.13 | 0.35 | 1.88 | 2.22 |
| 17–20/051J | 0.06 | 0.38 | 0.44 | 0.39 | 0.36 | 0.75 | 0.40 | 0.38 | 0.78 |
| 17–20/053 | 0.04 | 0.68 | 0.72 | 0.32 | 0.65 | 0.98 | 0.34 | 0.68 | 1.02 |
| 17–21/035 | 0.01 | 0.39 | 0.41 | 0.18 | 0.38 | 0.56 | 0.18 | 0.39 | 0.58 |
| 18–20/008 | 0.02 | 0.07 | 0.09 | 0.22 | 0.07 | 0.29 | 0.23 | 0.07 | 0.30 |
| 16–19/012 | 0.05 | 0.57 | 0.62 | 0.36 | 0.55 | 0.91 | 0.38 | 0.57 | 0.95 |
| 16–20/006 | 0.02 | 2.36 | 2.38 | 0.21 | 2.27 | 2.48 | 0.22 | 2.36 | 2.58 |
| 17–20/051A | 0.08 | 0.87 | 0.95 | 0.44 | 0.83 | 1.27 | 0.46 | 0.87 | 1.33 |
| 18–18/066 | 0.03 | 0.92 | 0.96 | 0.29 | 0.88 | 1.18 | 0.30 | 0.92 | 1.23 |
| 18–19/006 | 0.04 | 0.71 | 0.75 | 0.33 | 0.68 | 1.01 | 0.35 | 0.71 | 1.06 |
| 18–18/083 | 0.04 | 0.58 | 0.62 | 0.32 | 0.55 | 0.88 | 0.34 | 0.58 | 0.91 |
| Tu_W_001 | 0.05 | 0.63 | 0.68 | 0.36 | 0.60 | 0.96 | 0.37 | 0.63 | 1.00 |
| Tu_W_002 | 0.05 | 0.53 | 0.58 | 0.36 | 0.51 | 0.87 | 0.38 | 0.53 | 0.91 |
| 18–18/068 | 0.04 | 0.71 | 0.75 | 0.32 | 0.68 | 1.01 | 0.34 | 0.71 | 1.05 |
| 18–18/039 | 0.03 | 1.54 | 1.56 | 0.26 | 1.47 | 1.73 | 0.27 | 1.54 | 1.81 |
| 17–17/003 | 0.00 | 0.53 | 0.53 | 0.00 | 0.50 | 0.50 | 0.00 | 0.53 | 0.53 |
| 18–18/038 | 0.01 | 0.55 | 0.56 | 0.18 | 0.52 | 0.70 | 0.18 | 0.55 | 0.73 |
| 18–18/037 | 0.01 | 0.35 | 0.36 | 0.17 | 0.33 | 0.50 | 0.17 | 0.35 | 0.52 |
| 16–18/003A | 0.00 | 0.35 | 0.35 | 0.00 | 0.34 | 0.34 | 0.00 | 0.35 | 0.35 |
| 16–18/004 | 0.07 | 0.62 | 0.69 | 0.42 | 0.59 | 1.01 | 0.43 | 0.62 | 1.05 |
| Sa_W_001 | 0.01 | 0.26 | 0.27 | 0.19 | 0.25 | 0.44 | 0.20 | 0.26 | 0.46 |
| Sa_W_002 | 0.13 | 0.19 | 0.32 | 0.57 | 0.18 | 0.76 | 0.60 | 0.19 | 0.79 |
4. Conclusions
- The pH values of the groundwater samples were found to vary from 7.1 to 8.3, showing properties that are almost neutral to slightly alkaline. Based on the classification of groundwater according to TDS, 67.3% of the samples fell into the desirable category, while 32.7% were categorised as permissible for drinking. The total hardness values of the groundwater samples ranged from 260 to 540 mg/L; 2% of the groundwater samples exceeded the permissible limit set by the WHO. Moreover, 87.7% were classified as very hard water. The levels of K+ in the groundwater varied from 0.1 to 27.7 mg/L; notably, 10.2% of the examined samples exceeded the permissible limit set by the WHO. The NO3− levels ranged from 0.5 to 110 mg/L, with a mean of 40.6. It is clear that 38.8% of the samples exceeded the permissible limit set by the WHO. However, the Cl− and Na+ concentrations were found to be within the permissible limit set by the WHO.
- The ionic dominance pattern of the groundwater showed the following order for anions: HCO3− > Cl− > NO3− > SO42− > F−. Moreover, it showed the following order for cations: Ca2+ > Na+ > Mg2+ > K+. The predominant water type in this region is fresh water (calcium–magnesium–bicarbonate), which is suitable for drinking. This type can mainly be attributed to the hydrogeological facies of groundwater, determined by natural processes, such as rock weathering, leaching, and evaporation. However, water types such as (Ca-Mg-Na-HCO3-Cl), (Ca-Na-HCO3-Cl), (Na-Ca-Mg-Cl-HCO3), and (Na-Ca-Cl-HCO3) may be influenced by anthropogenic factors, such as wastewater, cesspits, and agricultural fertilizers. Consequently, these water types may not be suitable for drinking.
- Based on the water quality index (WQI), 77.6% and 22.4% of samples fell into the ‘good’ and ‘excellent’ water classes, respectively, indicating that the groundwater is suitable for drinking.
- No health risk was found for fluoride (F−) in the analysed groundwater samples. The non-carcinogenic risk of NO3− ranged from 0.093 to 3.01 for adults, from 0.29 to 3.08 for children, and from 0.302 to 3.21 for infants. Our study indicates that the younger age group is more vulnerable to NO3− toxicity than the oldest age group. However, the health risk associated with NO3− was 46.9% for all ages. Therefore, more efforts are needed to reduce the nitrate NO3− levels in the groundwater of the study area. Moreover, the development of appropriate methods for the protection of groundwater catchments in the West Bank is crucial and could have beneficial implications for groundwater quality and sustainability.
Author Contributions
Funding
Data Availability Statement
Conflicts of Interest
References
- Zhang, Q.; Xu, P.; Qian, H. Groundwater Quality Assessment Using Improved Water Quality Index (WQI) and Human Health Risk (HHR) Evaluation in a Semi-arid Region of Northwest China. Expo. Health 2020, 12, 487–500. [Google Scholar] [CrossRef]
- Wu, J.; Wang, L.; Wang, S.; Tian, R.; Xue, C.; Feng, W.; Li, Y. Spatiotemporal variation of groundwater quality in an arid area experiencing long-term paper wastewater irrigation, northwest China. Environ. Earth Sci. 2017, 76, 460. [Google Scholar] [CrossRef]
- Zeidan, B.A. Groundwater Degradation and Remediation in the Nile Delta Aquifer; Springer: Berlin/Heidelberg, Germany, 2017; Volume 55, pp. 159–232. [Google Scholar] [CrossRef]
- Jonoski, A.; Ahmed, T.; Almasri, M.N.; Abu-Saadah, M. Decision Support System for Sustainable Exploitation of the Eocene Aquifer in the West Bank, Palestine. Water 2023, 15, 365. [Google Scholar] [CrossRef]
- El-Fadel, M.; Quba’a, R.; El-Hougeiri, N.; Hashisho, Z.; Jamali, D. The Israeli Palestinian Mountain Aquifer: A Case Study in Ground Water Conflict Resolution. J. Nat. Resour. Life Sci. Educ. 2001, 30, 50–61. [Google Scholar] [CrossRef]
- Jebreen, H.; Banning, A.; Wohnlich, S.; Niedermayr, A.; Ghanem, M.; Wisotzky, F. The influence of Karst Aquifer mineralogy and geochemistry on groundwater characteristics: West Bank, Palestine. Water 2018, 10, 1829. [Google Scholar] [CrossRef]
- SUSMAQ. A Brief Summary of the Hydrogeology of the West Bank Management. 2002. Available online: http://nora.nerc.ac.uk/id/eprint/504766/1/West_Bank_hg.pdf (accessed on 2 February 2022).
- Tal-Spiro, O. Israeli-Palestinian Cooperation on Water Issues; The Knesset the Research and Information Center, Jerusalem: Jerusalem, Israel, 2011; pp. 1–17. Available online: www.knesset.gov.il/mmm (accessed on 4 March 2022).
- Adimalla, N. Controlling factors and mechanism of groundwater quality variation in semiarid region of South India: An approach of water quality index (WQI) and health risk assessment (HRA). Environ. Geochem. Health 2020, 42, 1725–1752. [Google Scholar] [CrossRef] [PubMed]
- Kate, S.; Kumbhar, S.; Jamale, P. Water quality analysis of Urun-Islampur City, Maharashtra, India. Appl. Water Sci. 2020, 10, 1–8. [Google Scholar] [CrossRef]
- Hirata, R.; Cagnon, F.; Bernice, A.; Maldaner, C.H.; Galvão, P.; Marques, C.; Terada, R.; Varnier, C.; Ryan, M.C.; Bertolo, R. Nitrate contamination in brazilian urban aquifers: A tenacious problem. Water 2020, 12, 2709. [Google Scholar] [CrossRef]
- Karakuş, C.B. Evaluation of groundwater quality in Sivas province (Turkey) using water quality index and GIS-based analytic hierarchy process. Int. J. Environ. Health Res. 2019, 29, 500–519. [Google Scholar] [CrossRef]
- Wen, X.; Chen, F.; Lin, Y.; Zhu, H.; Yuan, F.; Kuang, D.; Jia, Z.; Yuan, Z. Microbial indicators and their use for monitoring drinkingwater quality-A review. Sustainability 2020, 12, 2249. [Google Scholar] [CrossRef]
- Rajankar, P.N.; Tambekar, D.H.; Wate, S.R. Groundwater quality and water quality index at Bhandara District. Environ. Monit. Assess. 2011, 179, 619–625. [Google Scholar] [CrossRef]
- Pei-Yue, L.; Hui, Q.; Jian-Hua, W. Groundwater quality assessment based on improved water quality index in Pengyang County, Ningxia, Northwest China. E-J. Chem. 2010, 7 (Suppl. S1), S209–S216. [Google Scholar] [CrossRef]
- Ketata, M.; Gueddari, M.; Bouhlila, R. Use of geographical information system and water quality index to assess groundwater quality in el khairat deep aquifer (Enfidha, Central East Tunisia). Arab. J. Geosci. 2012, 5, 1379–1390. [Google Scholar] [CrossRef]
- Herschy, R.W. Water quality for drinking: WHO guidelines. In Encyclopedia of Lakes and Reservoirs; WHO: Geneva, Switzerland, 2011; pp. 876–883. [Google Scholar] [CrossRef]
- Zohud, A.; Alam, L. A Review of Groundwater Contamination in West Bank, Palestine: Quality, Sources, Risks, and Management. Water 2022, 14, 3417. [Google Scholar] [CrossRef]
- WHO. Guidelines for Drinking-Water Quality; WHO: Geneva, Switzerland, 2017.
- Gikas, P.; Manali, A.; Manaroli, X.E.; Makaroglou, G.; Tsamoutsoglou, K. Sustainable Chemical and Environmental Engineering. In Proceedings of the 1st International Conference on Sustainable Chemical and Environmental Engineering, Crete, Greece, 31 August–4 September 2022. [Google Scholar]
- Jha, S.K.; Singh, R.K.; Damodaran, T.; Mishra, V.K.; Sharma, D.K.; Rai, D. Fluoride in groundwater: Toxicological exposure and remedies. J. Toxicol. Environ. Health Part B 2013, 16, 52–66. [Google Scholar] [CrossRef] [PubMed]
- Mahmoud, N.; Zayed, O.; Petrusevski, B. Groundwater Quality of Drinking Water Wells in the West Bank, Palestine. Water 2022, 14, 377. [Google Scholar] [CrossRef]
- Abu Jabal, M.S.; Abustan, I.; Rozaimy, M.R.; Al-Najar, H. Fluoride enrichment in groundwater of semi-arid urban area: Khan Younis City, southern Gaza Strip (Palestine). J. Afr. Earth Sci. 2014, 100, 259–266. [Google Scholar] [CrossRef]
- Adimalla, N. Groundwater Quality for Drinking and Irrigation Purposes and Potential Health Risks Assessment: A Case Study from Semi-Arid Region of South India. Expo. Health 2018, 11, 109–123. [Google Scholar] [CrossRef]
- Ghanem, M.; Ahmad, W.; Keilani, Y.; Sawaftah, F.; Schelter, L.; Schuettrumpf, H. Spring water quality in the central West Bank, Palestine. J. Asian Earth Sci. X 2021, 5, 100052. [Google Scholar] [CrossRef]
- Cotruvo, J.A. 2017 WHO guidelines for drinking water quality: First addendum to the fourth edition. J. Am. Water Work. Assoc. 2017, 109, 44–51. [Google Scholar] [CrossRef]
- Hejaz, B.; Al-Khatib, I.A.; Mahmoud, N. Nidal Domestic Groundwater Quality in the Northern Governorates of the West Bank, Palestine. J. Environ. Public Health 2020, 2020, 6894805. [Google Scholar] [CrossRef] [PubMed]
- Daghara, A.; Al-Khatib, I.A.; Al-Jabari, M. Quality of Drinking Water from Springs in Palestine: West Bank as a Case Study. J. Environ. Public Health 2019, 2019, 8631732. [Google Scholar] [CrossRef]
- Todd, D.K. Groundwater Hydrology, 2nd ed.; Wiley: Hoboken, NJ, USA, 1980. [Google Scholar]
- Arvin, H.S.E.; Bardow, A. Caries affected by calcium and fluoride in drinking water and family income. Water Health 2018, 16, 49–56. [Google Scholar] [CrossRef]
- World Health Organization (WHO). Potassium in Drinking Water. Background Document for Preparation of WHO Guidelines for Drinking-Water Quality, 4th ed.; World Health Organization: Geneva, Switzerland, 2009; pp. 1–5. Available online: https://apps.who.int/iris/bitstream/handle/10665/70171/WHO_HSE_WSH_09.01_7_eng.pdf?sequence=1&isAllowed=y (accessed on 8 February 2023).
- Abbasi, T.; Abbasi, S. Water Quality Indices; Elsevier: Amsterdam, The Netherlands, 2012. [Google Scholar] [CrossRef]
- Jayarajan, S.K.P.; Kuriachan, L. Exposure and health risk assessment of nitrate contamination in groundwater in Coimbatore and Tirupur districts in Tamil Nadu, South India. Environ. Sci. Pollut. Res. 2020, 28, 10248–10261. [Google Scholar] [CrossRef] [PubMed]
- PWA. Palestinian Water Authority Annual Status Report on Water Resources, Water Supply, and Wastewater in the Occupied State of Palestine; PWA: Al-Bireh, Palestine, 2012; pp. 1–94. [Google Scholar]
- PCBS. Palestinians at the End of 2020; PCBS: Washington, DC, USA, 2020; pp. 1–77. Available online: http://www.pcbs.gov.ps (accessed on 22 October 2022).
- PWA. Status Report of Water Resources in the Occupied State of Palestine-2012; PWA: Al-Bireh, Palestine, 2013; p. 22. Available online: http://www.pwa.ps/userfiles/file/1/WRSTATUSReport-finaldraft2014-04-01.pdf (accessed on 5 June 2023).
- Abed, A.; Wishahi, S. Geology of Palestine: The West Bank and Gaza Strip; Palestinian Hydrology Group: Jerusalem, Israel, 1999. [Google Scholar]
- Jebreen, H.; Wohnlich, S.; Banning, A.; Wisotzky, F.; Niedermayr, A.; Ghanem, M. Recharge, geochemical processes and water quality in karst aquifers: Central West Bank, Palestine. Environ. Earth Sci. 2018, 77, 261. [Google Scholar] [CrossRef]
- Sayato, Y. WHO Guidelines for Drinking-Water Quality. Eisei kagaku 1989, 35, 307–312. [Google Scholar] [CrossRef]
- WHO. Operational Guidance for Maintaining Essential Health Services During an Outbreak; WHO: Geneva, Switzerland, 2020; pp. 1–10. Available online: https://www.who.int/publications-detail/covid-19-operational-guidance-for-maintaining-essential-health-services-during-an-outbreak (accessed on 2 May 2023).
- Angela, A. Water Quality Monitoring Protocols for Streams and Rivers. N. Engl. J. Med. 2018, 372, 2499–2508. [Google Scholar]
- APHA (American Public Health Association); American Water Works Association; Water Environment Federation. Standard Methods for the Examination of Water and Wastewater; APHA: Washington, DC, USA, 1995; pp. 3–104. Available online: https://www.standardmethods.org/ (accessed on 5 August 2023).
- CFR. Guidelines Establishing Test Procedures for the Analysis of Pollutants; CFR: New York, NY, USA, 1996. [Google Scholar]
- APHA. Standard Methods for the Examination of Water and Wastewater, 19th ed.; APHA: New York, NY, USA, 1995. [Google Scholar]
- Ahamad, A.; Raju, N.J.; Madhav, S.; Gossel, W.; Wycisk, P. Impact of non-engineered Bhalswa landfill on groundwater from Quaternary alluvium in Yamuna flood plain and potential human health risk, New Delhi, India. Quat. Int. 2019, 507, 352–369. [Google Scholar] [CrossRef]
- Palestine Standards Institute (PSI). The Second Working Draft ofthe Amended Drinking Water Standard; PSI: Ramallah, Jerusalem, 2004.
- El Baba, F.D.S.M.; Kayastha, P.; Huysmans, M. Evaluation of the Groundwater Quality Using the Water Quality Index and Geostatistical Analysis in the Dier al-Balah Governorate, Gaza Strip, Palestine. Water 2020, 12, 262. [Google Scholar] [CrossRef]
- USEPA. Environmental Risk. Your Guide to Analysis and Reducing Risk Rush; USEPA: Washington, DC, USA, 1991.
- U.S. Environmental Protection Agency. Quick Guide to Drinking Water Sample Collection, 2nd ed.; U.S. Environmental Protection Agency: Washington, DC, USA, 2016; pp. 6–20.
- USEPA. Risk Assessment Guidance; USEPA: Washington, DC, USA, 2014.
- U.S. Environmental Protection Agency. Child-Specific Exposure Factors Handbook; U.S. Environmental Protection Agency: Washington, DC, USA; p. 448.
- USEPA. Risk Assessment Guidance for Superfund, Human Health Evaluation Manual; USEPA: Washington, DC, USA, 2009.
- Wegahita, N.K.; Ma, L.; Liu, J.; Huang, T.; Luo, Q.; Qian, J. Spatial assessment of groundwater quality and health risk of nitrogen pollution for shallow groundwater aquifer around fuyang city, china. Water 2020, 12, 3341. [Google Scholar] [CrossRef]
- Rao, N.S.; Rao, P.S.; Reddy, G.V.; Nagamani, M.; Vidyasagar, G.; Satyanarayana, N.L.V.V. Chemical characteristics of groundwater and assessment of groundwater quality in Varaha River Basin, Visakhapatnam District, Andhra Pradesh, India. Environ. Monit. Assess. 2011, 184, 5189–5214. [Google Scholar] [CrossRef] [PubMed]
- Ji, Y.; Wu, J.; Wang, Y.; Elumalai, V.; Subramani, T. Seasonal Variation of Drinking Water Quality and Human Health Risk Assessment in Hancheng City of Guanzhong Plain, China. Expo. Health 2020, 12, 469–485. [Google Scholar] [CrossRef]
- Judeh, T.; Bian, H.; Shahrour, I. GIS-based spatiotemporal mapping of groundwater potability and palatability indices in arid and semi-arid areas. Water 2021, 13, 1323. [Google Scholar] [CrossRef]
- Ameen, H.A. Spring water quality assessment using water quality index in villages of Barwari Bala, Duhok, Kurdistan Region, Iraq. Appl. Water Sci. 2019, 9, 176. [Google Scholar] [CrossRef]
- Prakash, K.L.; Somashekar, R.K. Groundwater quality—Assessment on Anekal Taluk, Bangalore Urban district, India. J. Environ. Biol. 2006, 27, 633–637. [Google Scholar] [PubMed]
- Singh, S.; Raju, N.J.; Ramakrishna, C. Evaluation of Groundwater Quality and Its Suitability for Domestic and Irrigation Use in Parts of the Chandauli-Varanasi Region, Uttar Pradesh, India. J. Water Resour. Prot. 2015, 7, 572–587. [Google Scholar] [CrossRef]
- Hem, J.D. Study and Interpretation of the Chemical Characteristics of Natural Water; USGS: Reston, VA, USA, 1985; Volume 2254.
- Saha, S.; Reza, A.H.M.S.; Roy, M.K. Hydrochemical evaluation of groundwater quality of the Tista floodplain, Rangpur, Bangladesh. Appl. Water Sci. 2019, 9, 198. [Google Scholar] [CrossRef]
- Smith, D.N.I.; Ortega-Camacho, D.; Acosta-González, G.; Leal-Bautista, R.M.; Fox, W.E.; Cejudo, E. A multi-approach assessment of land use effects on groundwater quality in a karstic aquifer. Heliyon 2020, 6, e03970. [Google Scholar] [CrossRef]
- Piper, A.M. A graphic procedure in the geochemical interpretation of water-analyses. Am. Geophys. Union 1944, 25, 914–928. [Google Scholar] [CrossRef]
- Agarwal, M.; Singh, M.; Hussain, J. Assessment of groundwater quality with special emphasis on nitrate contamination in parts of Gautam Budh Nagar district, Uttar Pradesh, India. Acta Geochim. 2019, 38, 703–717. [Google Scholar] [CrossRef]
- Menció, A.; Mas-Pla, J.; Otero, N.; Regàs, O.; Boy-Roura, M.; Puig, R.; Bach, J.; Domènech, C.; Zamorano, M.; Brusi, D.; et al. Nitrate pollution of groundwater; all right, but nothing else? Sci. Total Environ. 2016, 539, 241–251. [Google Scholar] [CrossRef]
- Langguth, H.R. Groundwater Characteristics in Bereiech Des Velberter Sattles; NRW: Duesseldorf, Germany, 1966; p. 127. [Google Scholar]
- Ravikumar, P.; Somashekar, R.; Prakash, K. A comparative study on usage of Durov and Piper diagrams to interpret hydrochemical processes in groundwater from SRLIS river basin, Karnataka, India. Earth Sci. 2015, 80, 31073–31077. [Google Scholar]
- Ibrahim, L.; Marei, A. Water Quality Index (WQI) for Water Resources in Jenin District. Master’s Thesis, Al-Quds University- Palestine, Abu Dis, Palestine, 2019; pp. 1–52. [Google Scholar]
- Li, P.; He, X.; Guo, W. Spatial groundwater quality and potential health risks due to nitrate ingestion through drinking water: A case study in Yan’an City on the Loess Plateau of northwest China. Hum. Ecol. Risk Assess. Int. J. 2019, 25, 11–31. [Google Scholar] [CrossRef]


| Symbol | Value for Adults | Value for Children | Value for Infants | References |
|---|---|---|---|---|
| IR | 2.5 L/day | 0.78 L/day | 0.3 L/day | USEPA 2014 [50] |
| ED | 64 years | 12 years | <1 year | WHO 2013 [40] |
| EF | 365 days/year | 365 days/year | 365 days/year | USEPA 2014 [50] |
| BW | 57.5 Kg | 18.5 Kg | 6.9 Kg | USEPA 2014 [50] |
| AT | 23,360 days | 4380 days | 365 days | USEPA 2014 [50] |
| Parameters/Unit | Mean | Std. Dev. | Min | Max | PSI | WHO |
|---|---|---|---|---|---|---|
| pH | 7.47 | 0.18 | 7.1 | 8.3 | 6.5–8.5 | 6.5–8.5 |
| EC μS/cm | 829.6 | 175.1 | 504 | 1261 | - | - |
| TDS mg/L | 477.4 | 100.2 | 292 | 731 | 1000 | 1000 |
| NO3− mg/L | 40.6 | 27 | 0.5 | 110 | 50 | 50 |
| F− mg/L | 0.28 | 0.12 | 0 | 0.7 | 1.5 | 1.5 |
| SO42− mg/L | 25.5 | 12.6 | 0 | 65 | 200 | 250 |
| Cl− mg/L | 71.2 | 39.9 | 26 | 249 | 250 | 250 |
| Ca2+ mg/L | 86.8 | 17.9 | 53 | 135 | 100 | 75 |
| Mg2+ mg/L | 32.6 | 6.6 | 14.6 | 54 | 100 | 30 |
| K+ mg/L | 4.2 | 5.6 | 0.1 | 27.7 | 10 | - |
| Na+ mg/L | 39.9 | 21.1 | 15.5 | 131 | 200 | 200 |
| TH mg/L | 358 | 61.8 | 260 | 540 | 500 | 500 |
| HCO3− mg/L | 312.5 | 46 | 165 | 420 | - | - |
| Sl. No. | Water Types | Number and Percentage of Groundwater Source |
|---|---|---|
| A | Normal earth alkaline water with prevailing bicarbonate | (31) 63.3% |
| B | Normal earth alkaline water with prevailing bicarbonate and sulphate or chloride | - |
| C | Normal earth alkaline water with prevailing sulphate or chloride | - |
| D | Earth alkaline water with increased portions of alkalis with prevailing bicarbonate | (17) 34.7% |
| E | Earth alkaline water with increased portions of alkalis with prevailing sulphate and chloride | - |
| F | Alkaline water with prevailing bicarbonate | - |
| G | Alkaline water with prevailing sulphate or chloride | (1) 2% |
| Well_ID | F | NO3 | pH | SO4 | TDS | TH | Cl | Ca | Mg | Na | K | WQI |
|---|---|---|---|---|---|---|---|---|---|---|---|---|
| 15–19/017 | 0.38 | 68.40 | 7.45 | 32.50 | 558.00 | 372.00 | 83.10 | 87.40 | 37.33 | 50.00 | 19.13 | 0.82 |
| 15–19/018 | 0.44 | 72.40 | 7.36 | 40.10 | 626.00 | 387.00 | 104.70 | 90.50 | 39.16 | 66.64 | 24.21 | 0.90 |
| 15–19/046 | 0.22 | 63.00 | 7.54 | 24.00 | 545.00 | 410.00 | 84.80 | 106.30 | 35.10 | 47.00 | 11.00 | 0.76 |
| 15–19/006 | 0.25 | 71.30 | 7.27 | 20.92 | 543.00 | 382.80 | 82.20 | 93.40 | 33.95 | 44.70 | 10.16 | 0.75 |
| 15–19/001A | 0.28 | 80.00 | 7.55 | 29.30 | 431.00 | 314.00 | 55.10 | 75.64 | 30.60 | 30.70 | 3.34 | 0.67 |
| 15–19/004A | 0.29 | 51.50 | 7.26 | 25.90 | 434.00 | 373.20 | 49.70 | 95.03 | 33.00 | 29.70 | 1.80 | 0.61 |
| 15–20/008 | 0.40 | 55.00 | 7.38 | 20.50 | 538.00 | 411.60 | 98.88 | 109.90 | 33.32 | 50.36 | 4.53 | 0.72 |
| 15–19/047A | 0.28 | 32.00 | 7.60 | 16.30 | 400.00 | 315.80 | 56.00 | 79.50 | 28.50 | 31.00 | 0.80 | 0.51 |
| 15–19/028 | 0.18 | 43.55 | 7.69 | 21.40 | 320.00 | 268.10 | 35.20 | 66.15 | 25.00 | 18.84 | 0.50 | 0.48 |
| 16–20/005 | 0.34 | 26.32 | 7.35 | 17.00 | 387.00 | 317.60 | 53.70 | 85.55 | 25.25 | 27.75 | 1.68 | 0.50 |
| 16–19/002 | 0.37 | 40.15 | 7.24 | 21.10 | 455.00 | 350.50 | 76.80 | 94.00 | 28.12 | 40.88 | 2.86 | 0.60 |
| 15–19/010 | 0.33 | 48.00 | 7.61 | 20.38 | 510.00 | 338.60 | 63.00 | 91.76 | 30.21 | 35.92 | 0.10 | 0.61 |
| 14–17/043 | 0.20 | 59.00 | 7.31 | 17.90 | 460.00 | 310.00 | 53.00 | 72.00 | 32.00 | 33.00 | 1.30 | 0.59 |
| 14–17/044 | 0.20 | 65.00 | 7.32 | 27.30 | 466.00 | 331.00 | 50.00 | 80.00 | 31.00 | 25.00 | 0.95 | 0.62 |
| 14–17/001 | 0.20 | 110.00 | 7.50 | 54.00 | 556.00 | 420.00 | 68.00 | 90.00 | 43.00 | 39.00 | 2.00 | 0.84 |
| 15–17/012 | 0.30 | 45.00 | 7.57 | 20.00 | 443.00 | 355.00 | 45.00 | 71.00 | 42.00 | 29.00 | 2.50 | 0.59 |
| 15–17/004 | 0.17 | 63.00 | 7.70 | 21.00 | 499.00 | 345.00 | 50.00 | 65.00 | 40.00 | 39.00 | 6.40 | 0.66 |
| 15–17/007 | 0.17 | 31.00 | 7.40 | 16.00 | 415.00 | 365.00 | 37.00 | 90.00 | 31.00 | 28.00 | 1.10 | 0.52 |
| 15–16/003 | 0.20 | 51.00 | 7.50 | 20.00 | 415.00 | 320.00 | 47.00 | 65.00 | 34.50 | 30.00 | 3.10 | 0.57 |
| 15–18/004 | 0.20 | 70.00 | 7.55 | 27.00 | 415.00 | 310.00 | 45.00 | 57.00 | 36.00 | 25.00 | 4.50 | 0.62 |
| 15–17/019 | 0.20 | 19.00 | 7.50 | 7.00 | 370.00 | 270.00 | 30.70 | 53.00 | 32.00 | 19.00 | 3.80 | 0.43 |
| 14–17/021 | 0.28 | 60.00 | 7.30 | 27.00 | 496.00 | 351.00 | 67.00 | 85.00 | 33.80 | 36.00 | 1.70 | 0.64 |
| 14–17/034 | 0.30 | 82.00 | 7.40 | 48.00 | 658.00 | 406.00 | 125.00 | 97.00 | 39.00 | 67.00 | 3.00 | 0.82 |
| 14–17/052 | 0.21 | 91.10 | 7.50 | 30.00 | 550.00 | 355.20 | 70.60 | 83.00 | 36.00 | 37.00 | 27.70 | 0.89 |
| 17–20/050Q | 0.70 | 0.50 | 7.55 | 35.00 | 496.00 | 670.00 | 89.00 | 81.00 | 35.00 | 60.00 | 2.50 | 0.58 |
| 17–19/009 | 0.42 | 10.00 | 7.60 | 30.00 | 385.00 | 335.00 | 39.00 | 75.00 | 31.50 | 25.00 | 1.90 | 0.47 |
| 17–20/052J | 0.45 | 3.00 | 7.30 | 35.00 | 478.00 | 398.00 | 59.90 | 95.00 | 35.00 | 40.00 | 3.00 | 0.53 |
| 17–20/033J | 0.32 | 69.00 | 7.40 | 52.00 | 715.00 | 480.00 | 160.00 | 135.00 | 28.00 | 100.00 | 6.00 | 0.87 |
| 17–20/051J | 0.37 | 14.00 | 7.41 | 34.00 | 645.00 | 499.00 | 125.00 | 120.00 | 46.10 | 69.00 | 3.50 | 0.68 |
| 17–20/053 | 0.31 | 25.00 | 7.30 | 19.00 | 472.00 | 395.00 | 54.00 | 99.00 | 30.00 | 38.00 | 3.00 | 0.56 |
| 17–21/035 | 0.17 | 14.50 | 7.10 | 13.00 | 495.00 | 449.00 | 54.00 | 105.00 | 39.00 | 30.00 | 1.50 | 0.53 |
| 18–20/008 | 0.21 | 2.70 | 8.20 | 65.00 | 690.00 | 295.00 | 249.00 | 55.00 | 25.40 | 131.00 | 7.00 | 0.62 |
| 16–19/012 | 0.35 | 21.00 | 7.50 | 17.00 | 406.00 | 349.00 | 43.00 | 90.10 | 25.00 | 24.00 | 1.20 | 0.49 |
| 16–20/006 | 0.20 | 87.00 | 7.20 | 17.00 | 587.00 | 481.00 | 75.00 | 121.00 | 38.00 | 41.00 | 9.00 | 0.83 |
| 17–20/051A | 0.42 | 32.00 | 7.15 | 23.00 | 470.00 | 399.00 | 55.00 | 100.00 | 32.70 | 35.00 | 2.20 | 0.59 |
| 18–18/066 | 0.28 | 33.90 | 7.41 | 23.40 | 432.00 | 362.40 | 59.60 | 104.20 | 24.83 | 32.56 | 1.83 | 0.56 |
| 18–19/006 | 0.32 | 26.06 | 7.45 | 39.50 | 503.00 | 379.00 | 98.00 | 97.60 | 32.90 | 52.50 | 1.68 | 0.60 |
| 18–18/083 | 0.31 | 21.22 | 7.41 | 19.70 | 415.00 | 345.60 | 64.10 | 85.55 | 32.04 | 30.55 | 2.02 | 0.51 |
| Tu_W_001 | 0.34 | 23.10 | 7.71 | 20.00 | 393.00 | 334.70 | 52.37 | 81.10 | 32.10 | 29.00 | 3.46 | 0.52 |
| Tu_W_002 | 0.35 | 19.44 | 7.42 | 25.70 | 425.00 | 333.50 | 67.73 | 82.42 | 31.02 | 39.79 | 2.40 | 0.52 |
| 18–18/068 | 0.31 | 26.20 | 7.47 | 37.90 | 502.00 | 381.20 | 97.52 | 98.34 | 33.00 | 52.71 | 1.77 | 0.60 |
| 18–18/039 | 0.25 | 56.50 | 7.62 | 45.00 | 731.00 | 540.00 | 169.00 | 121.00 | 54.00 | 71.00 | 2.50 | 0.85 |
| 17–17/003 | 0.00 | 19.36 | 7.60 | 16.20 | 361.00 | 264.00 | 48.00 | 67.00 | 24.30 | 23.50 | 1.70 | 0.42 |
| 18–18/038 | 0.17 | 20.13 | 7.50 | 21.00 | 492.00 | 324.00 | 84.00 | 80.00 | 30.10 | 40.50 | 1.80 | 0.51 |
| 18–18/037 | 0.16 | 12.75 | 7.60 | 15.00 | 411.00 | 280.00 | 55.00 | 88.00 | 14.60 | 30.70 | 1.70 | 0.43 |
| 16–18/003ِA | 0.00 | 12.87 | 7.60 | 0.00 | 348.00 | 260.00 | 45.00 | 64.00 | 24.30 | 20.20 | 1.60 | 0.38 |
| 16–18/004 | 0.40 | 22.74 | 7.70 | 8.00 | 374.00 | 268.00 | 52.00 | 72.00 | 21.40 | 23.40 | 2.10 | 0.47 |
| Sa_W_001 | 0.18 | 9.60 | 7.70 | 10.00 | 292.00 | 293.00 | 26.00 | 65.00 | 30.00 | 15.50 | 1.10 | 0.39 |
| Sa_W_002 | 0.55 | 7.00 | 7.30 | 22.00 | 382.00 | 350.00 | 35.50 | 87.00 | 38.00 | 19.00 | 1.60 | 0.49 |
Disclaimer/Publisher’s Note: The statements, opinions and data contained in all publications are solely those of the individual author(s) and contributor(s) and not of MDPI and/or the editor(s). MDPI and/or the editor(s) disclaim responsibility for any injury to people or property resulting from any ideas, methods, instructions or products referred to in the content. |
© 2023 by the authors. Licensee MDPI, Basel, Switzerland. This article is an open access article distributed under the terms and conditions of the Creative Commons Attribution (CC BY) license (https://creativecommons.org/licenses/by/4.0/).
Share and Cite
Zohud, A.; Alam, L.; Goh, C.T. Evaluation of Groundwater Quality Using the Water Quality Index (WQI) and Human Health Risk (HHR) Assessment in West Bank, Palestine. Hydrology 2023, 10, 198. https://doi.org/10.3390/hydrology10100198
Zohud A, Alam L, Goh CT. Evaluation of Groundwater Quality Using the Water Quality Index (WQI) and Human Health Risk (HHR) Assessment in West Bank, Palestine. Hydrology. 2023; 10(10):198. https://doi.org/10.3390/hydrology10100198
Chicago/Turabian StyleZohud, Ashraf, Lubna Alam, and Choo Ta Goh. 2023. "Evaluation of Groundwater Quality Using the Water Quality Index (WQI) and Human Health Risk (HHR) Assessment in West Bank, Palestine" Hydrology 10, no. 10: 198. https://doi.org/10.3390/hydrology10100198