

Toxicity Assessment of Mixed Exposure of Nine Perfluoroalkyl Substances at Concentrations Relevant to Daily Intake
 , , ,
, , ,
Abstract
:
1. Introduction
2. Materials and Methods
2.1. Materials
2.2. Animal Experiment
2.3. Tissue Histology
2.4. Liver Transcriptome Analysis
2.5. Real-Time Quantitative PCR
2.6. Metabolome Analysis of Liver
2.7. Molecular Docking
2.8. Biomarkers of Liver Injury
2.9. LCMS Measurement of PFAS
2.10. Data Analysis
3. Results
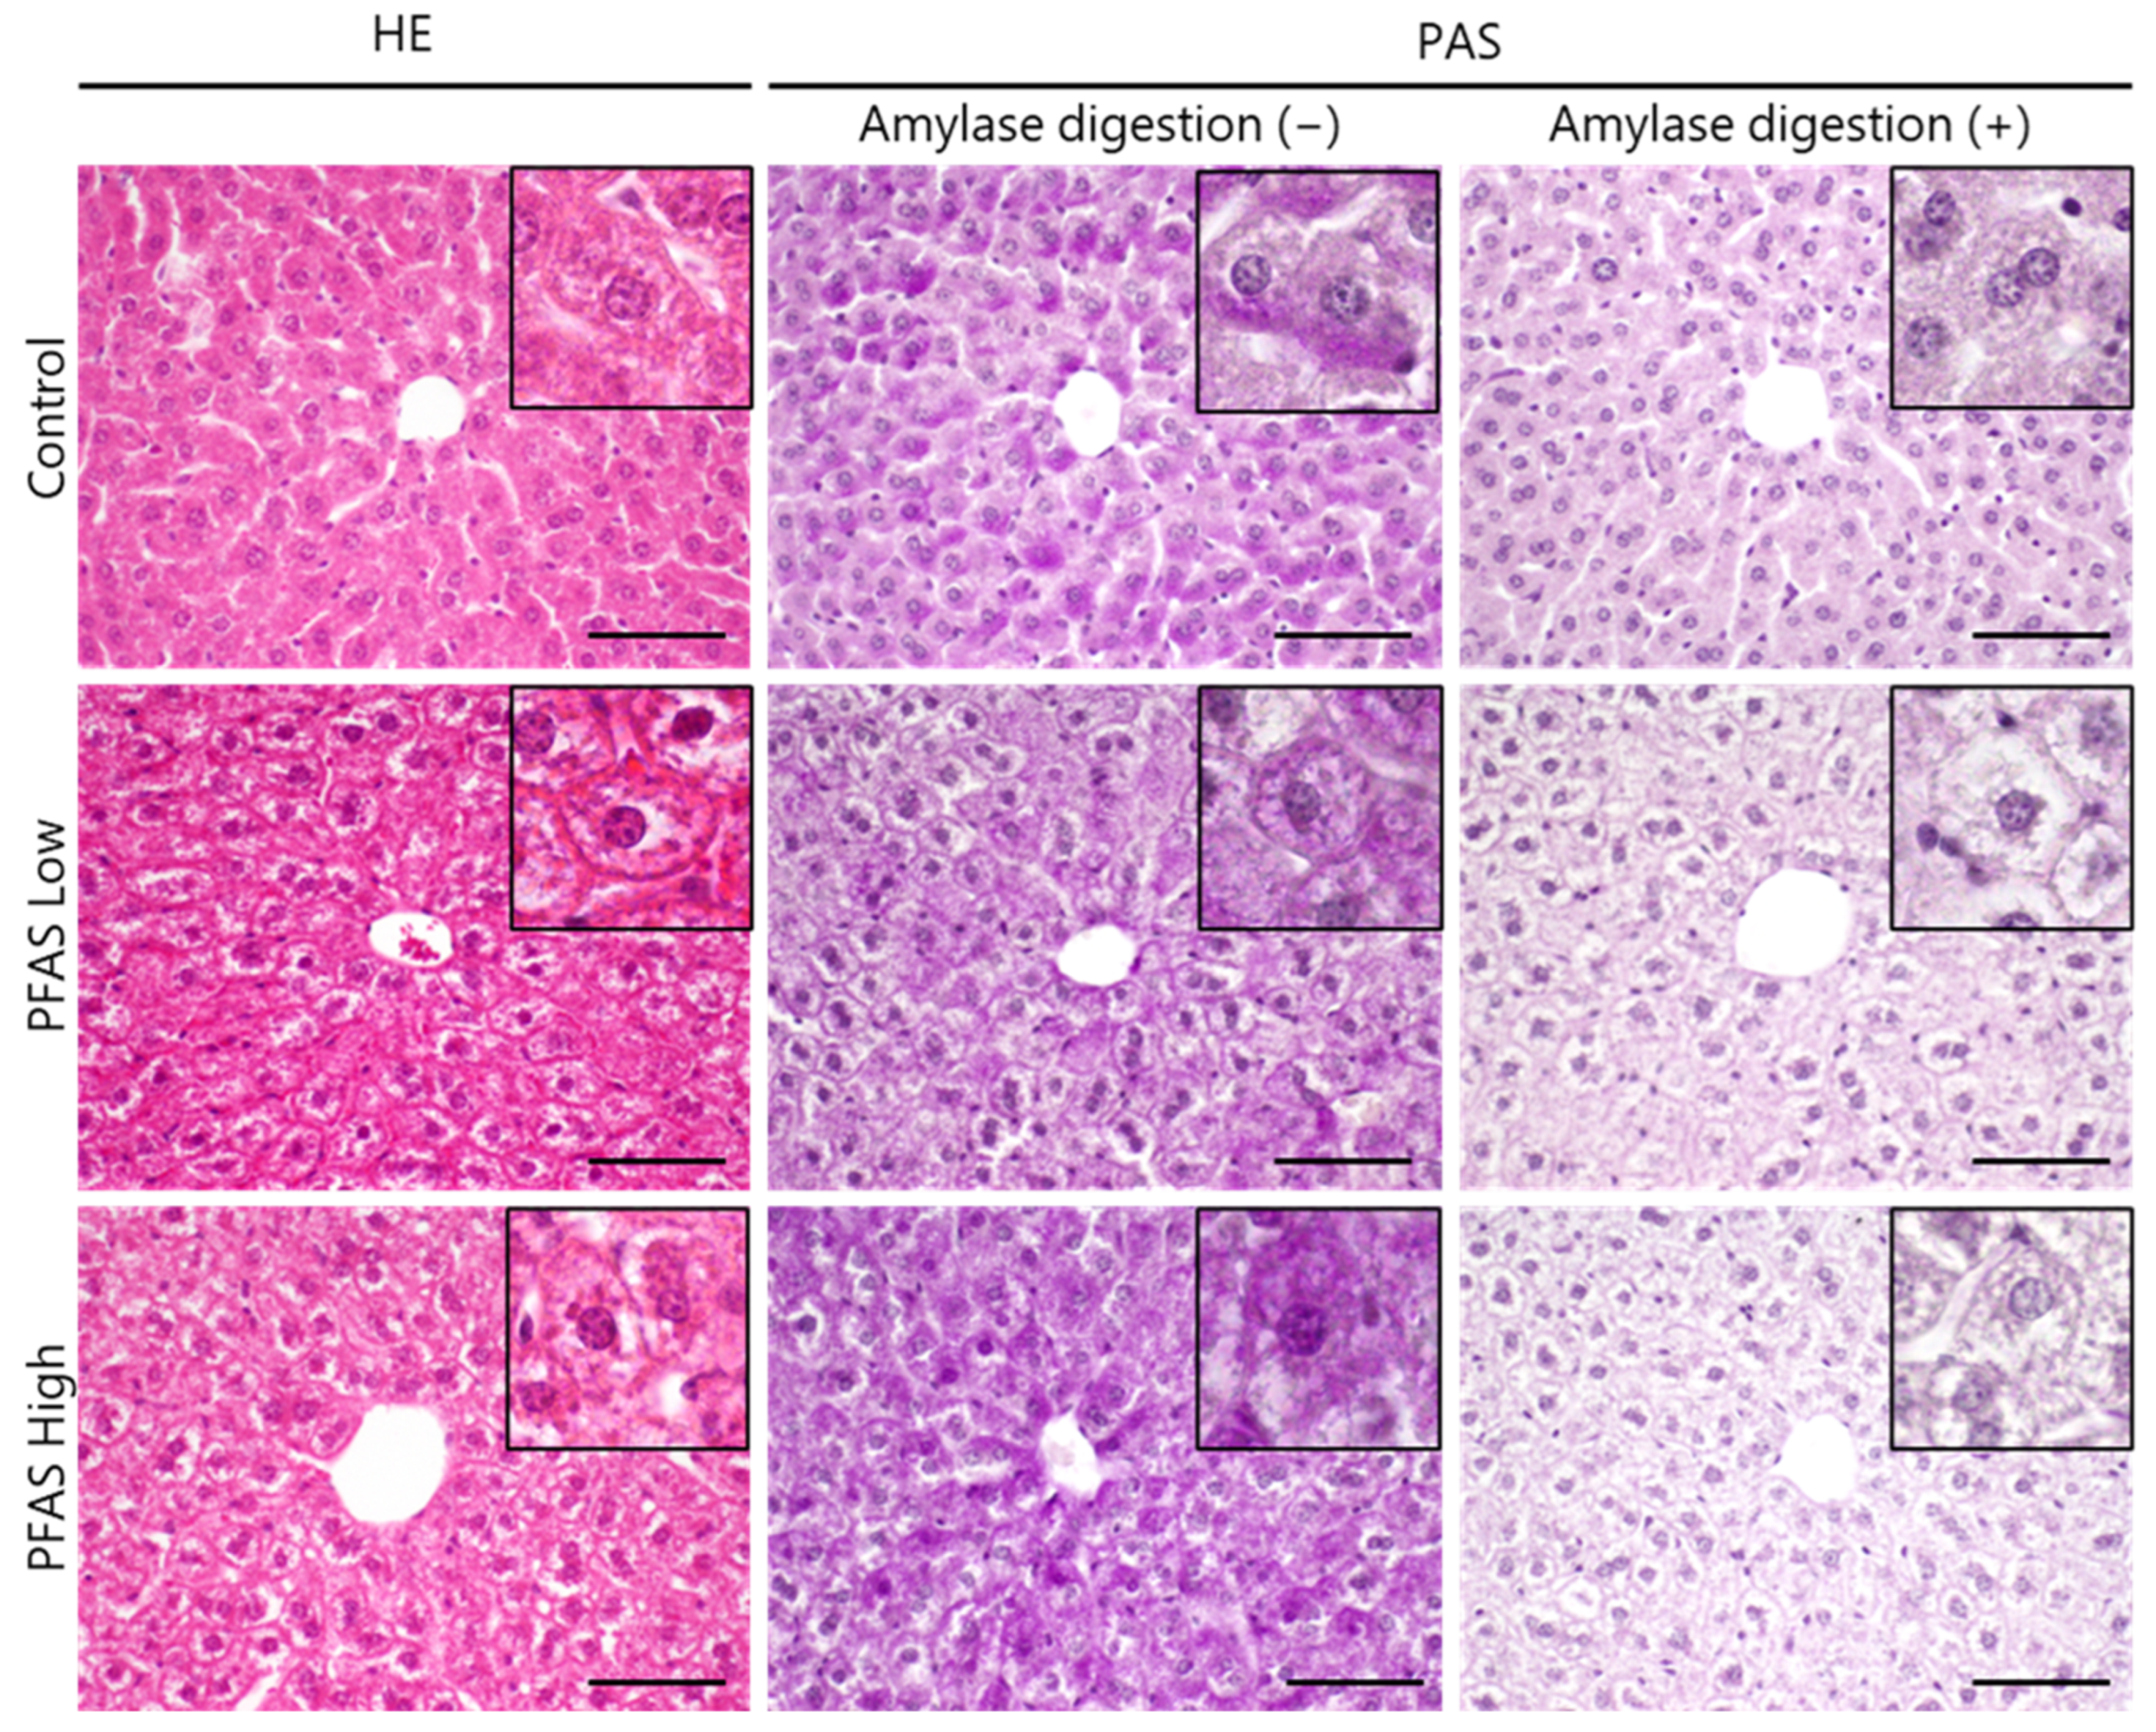
3.1. Histological Examination
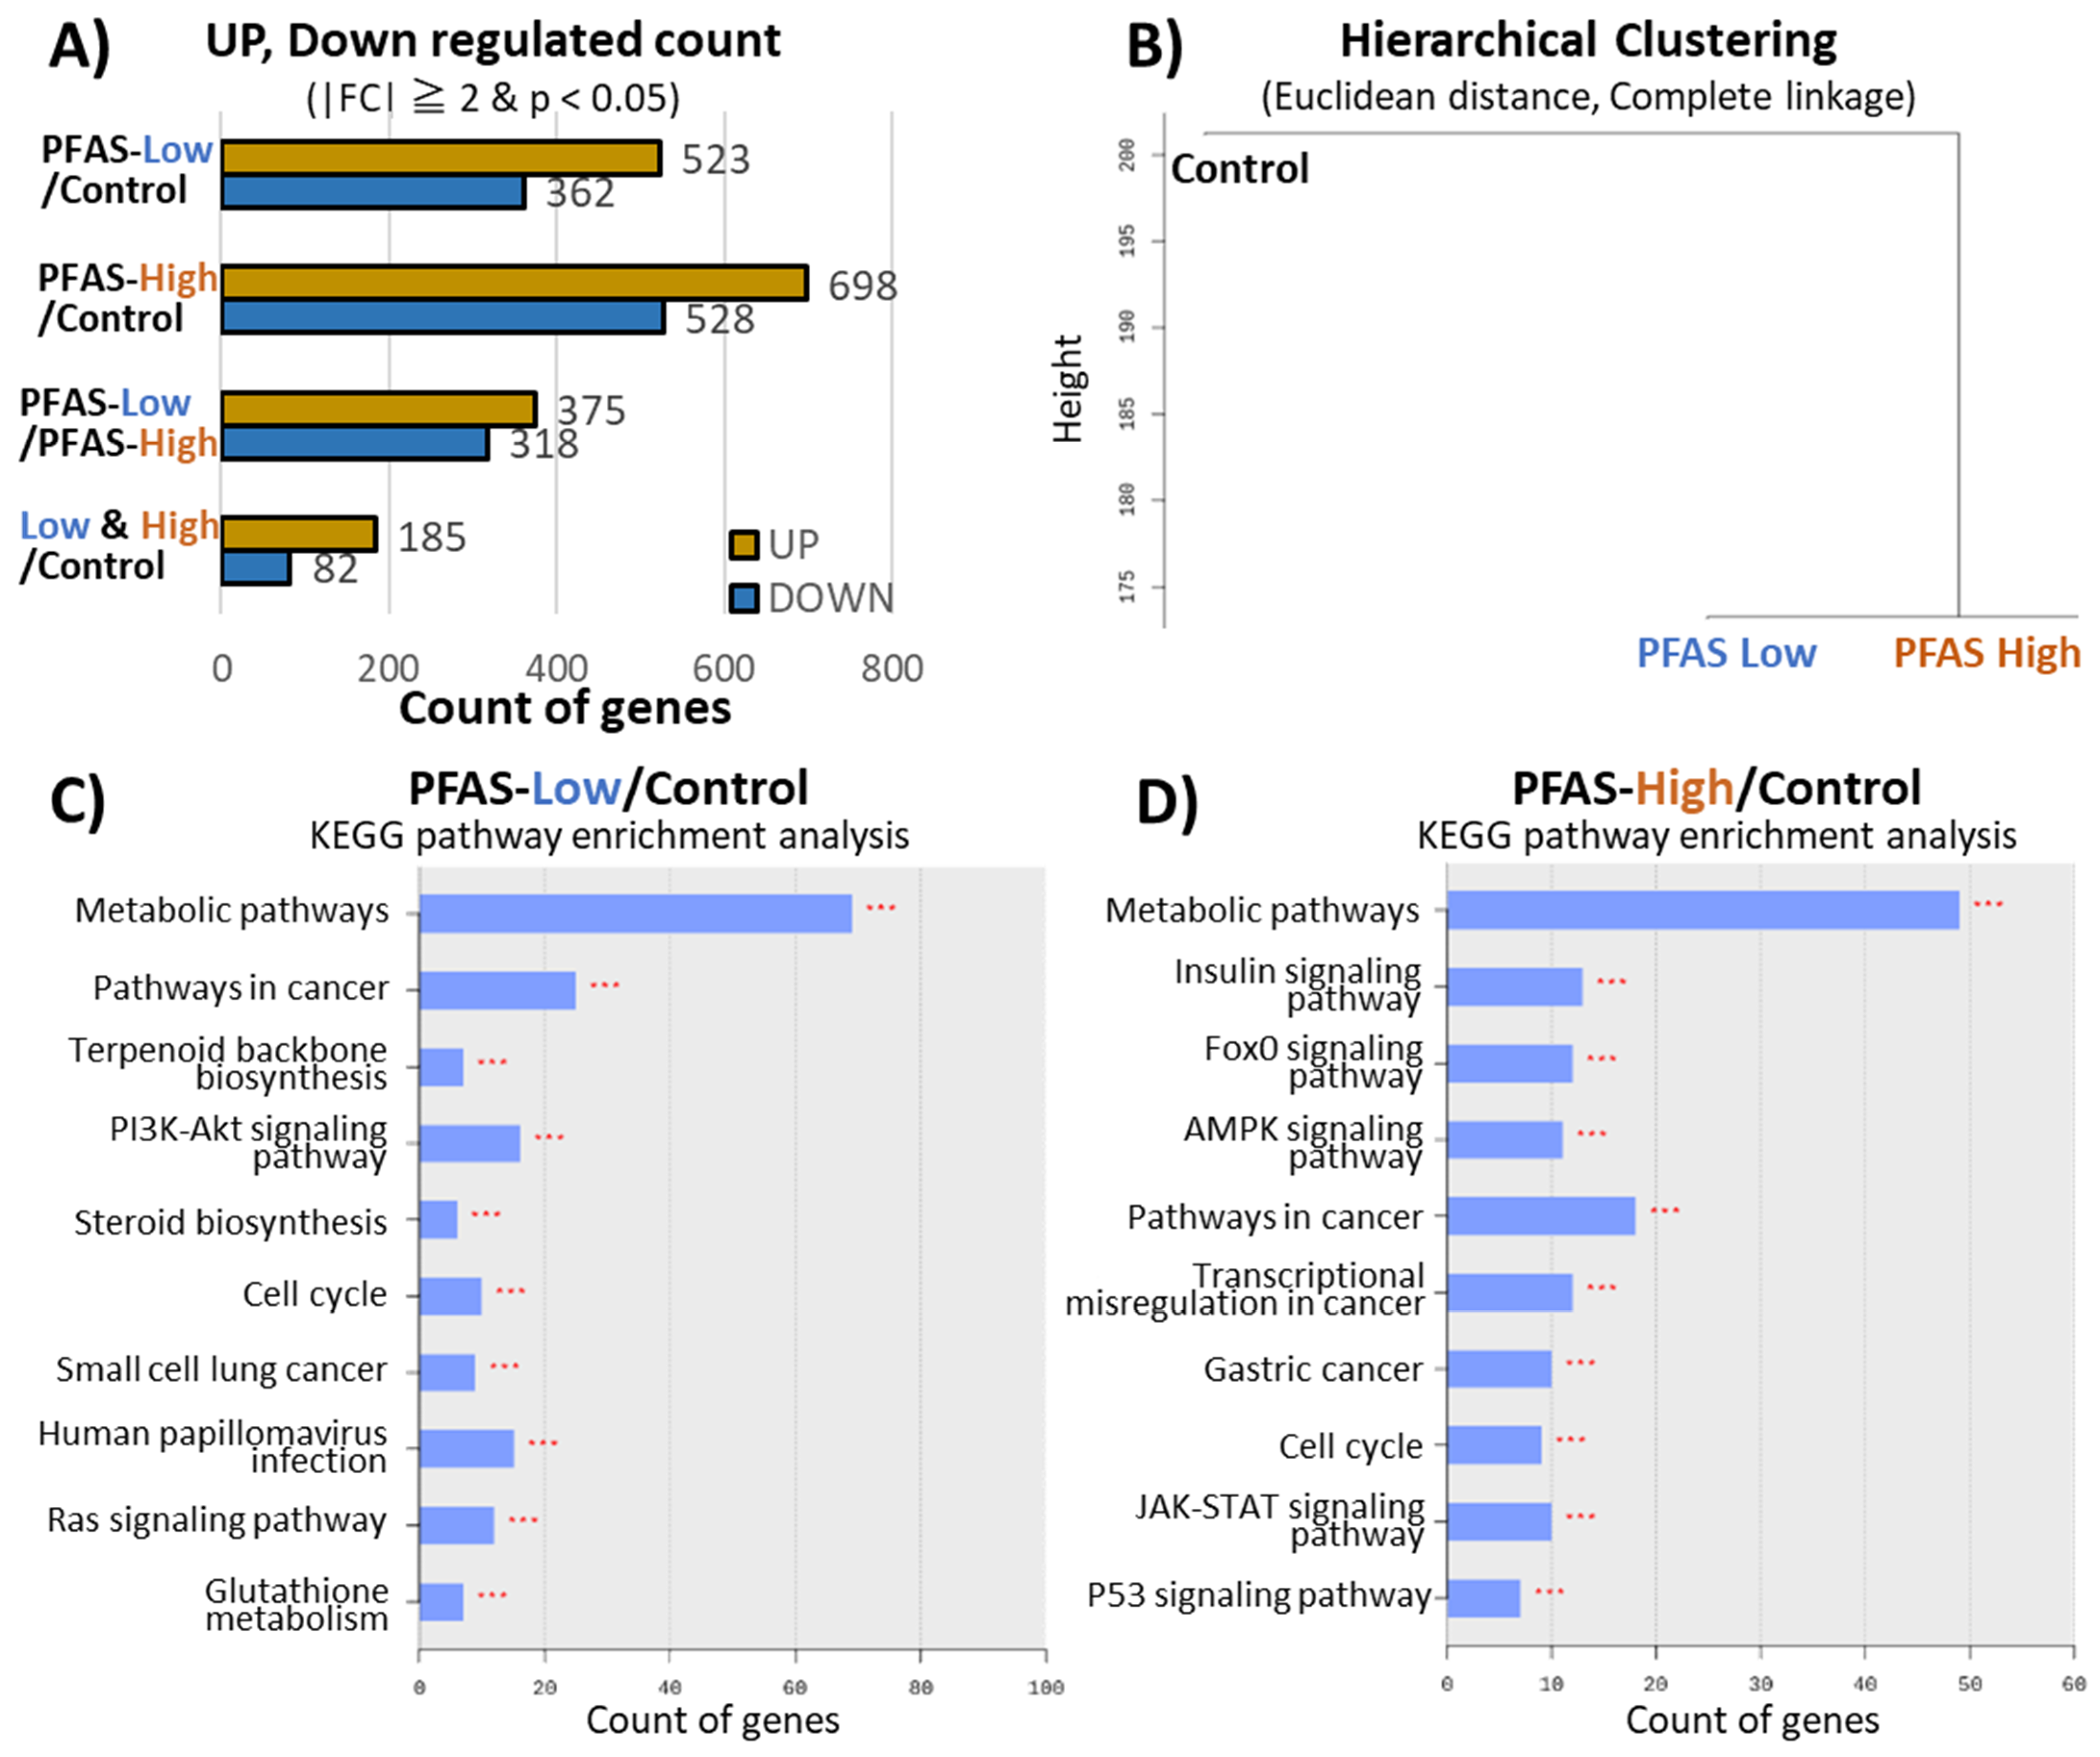
3.2. Liver Transcriptome Analysis
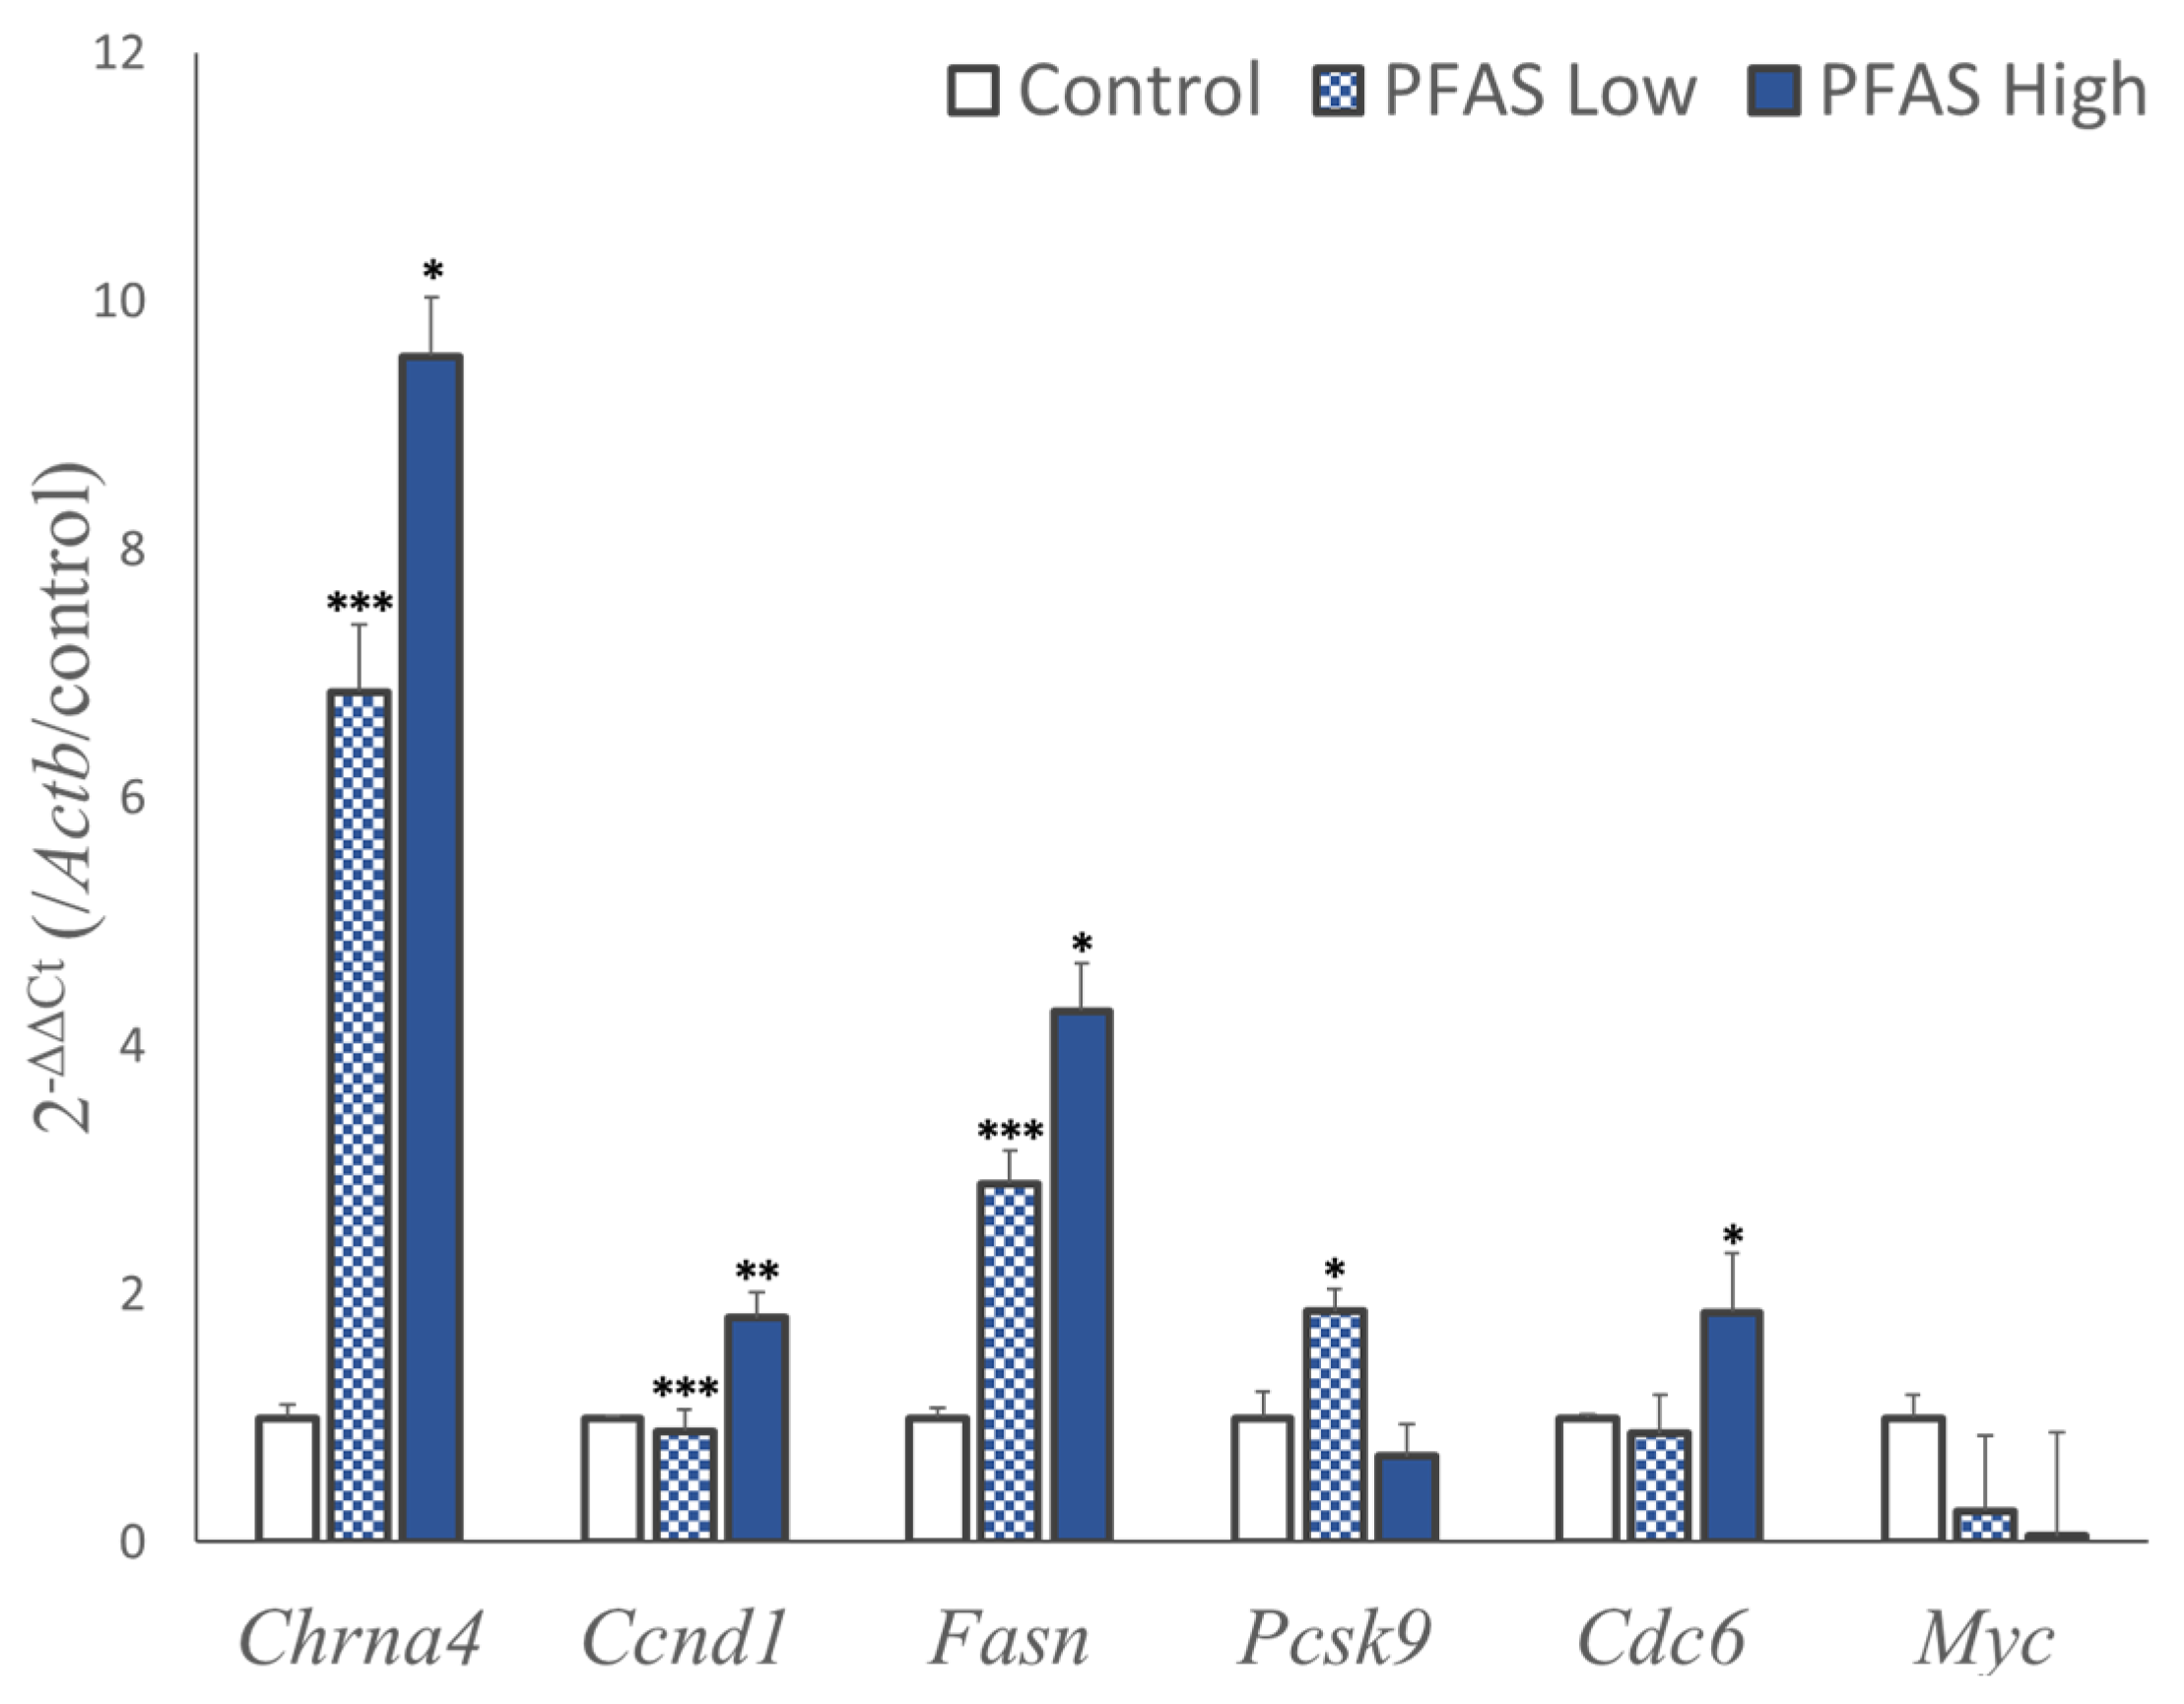
3.3. qPCR
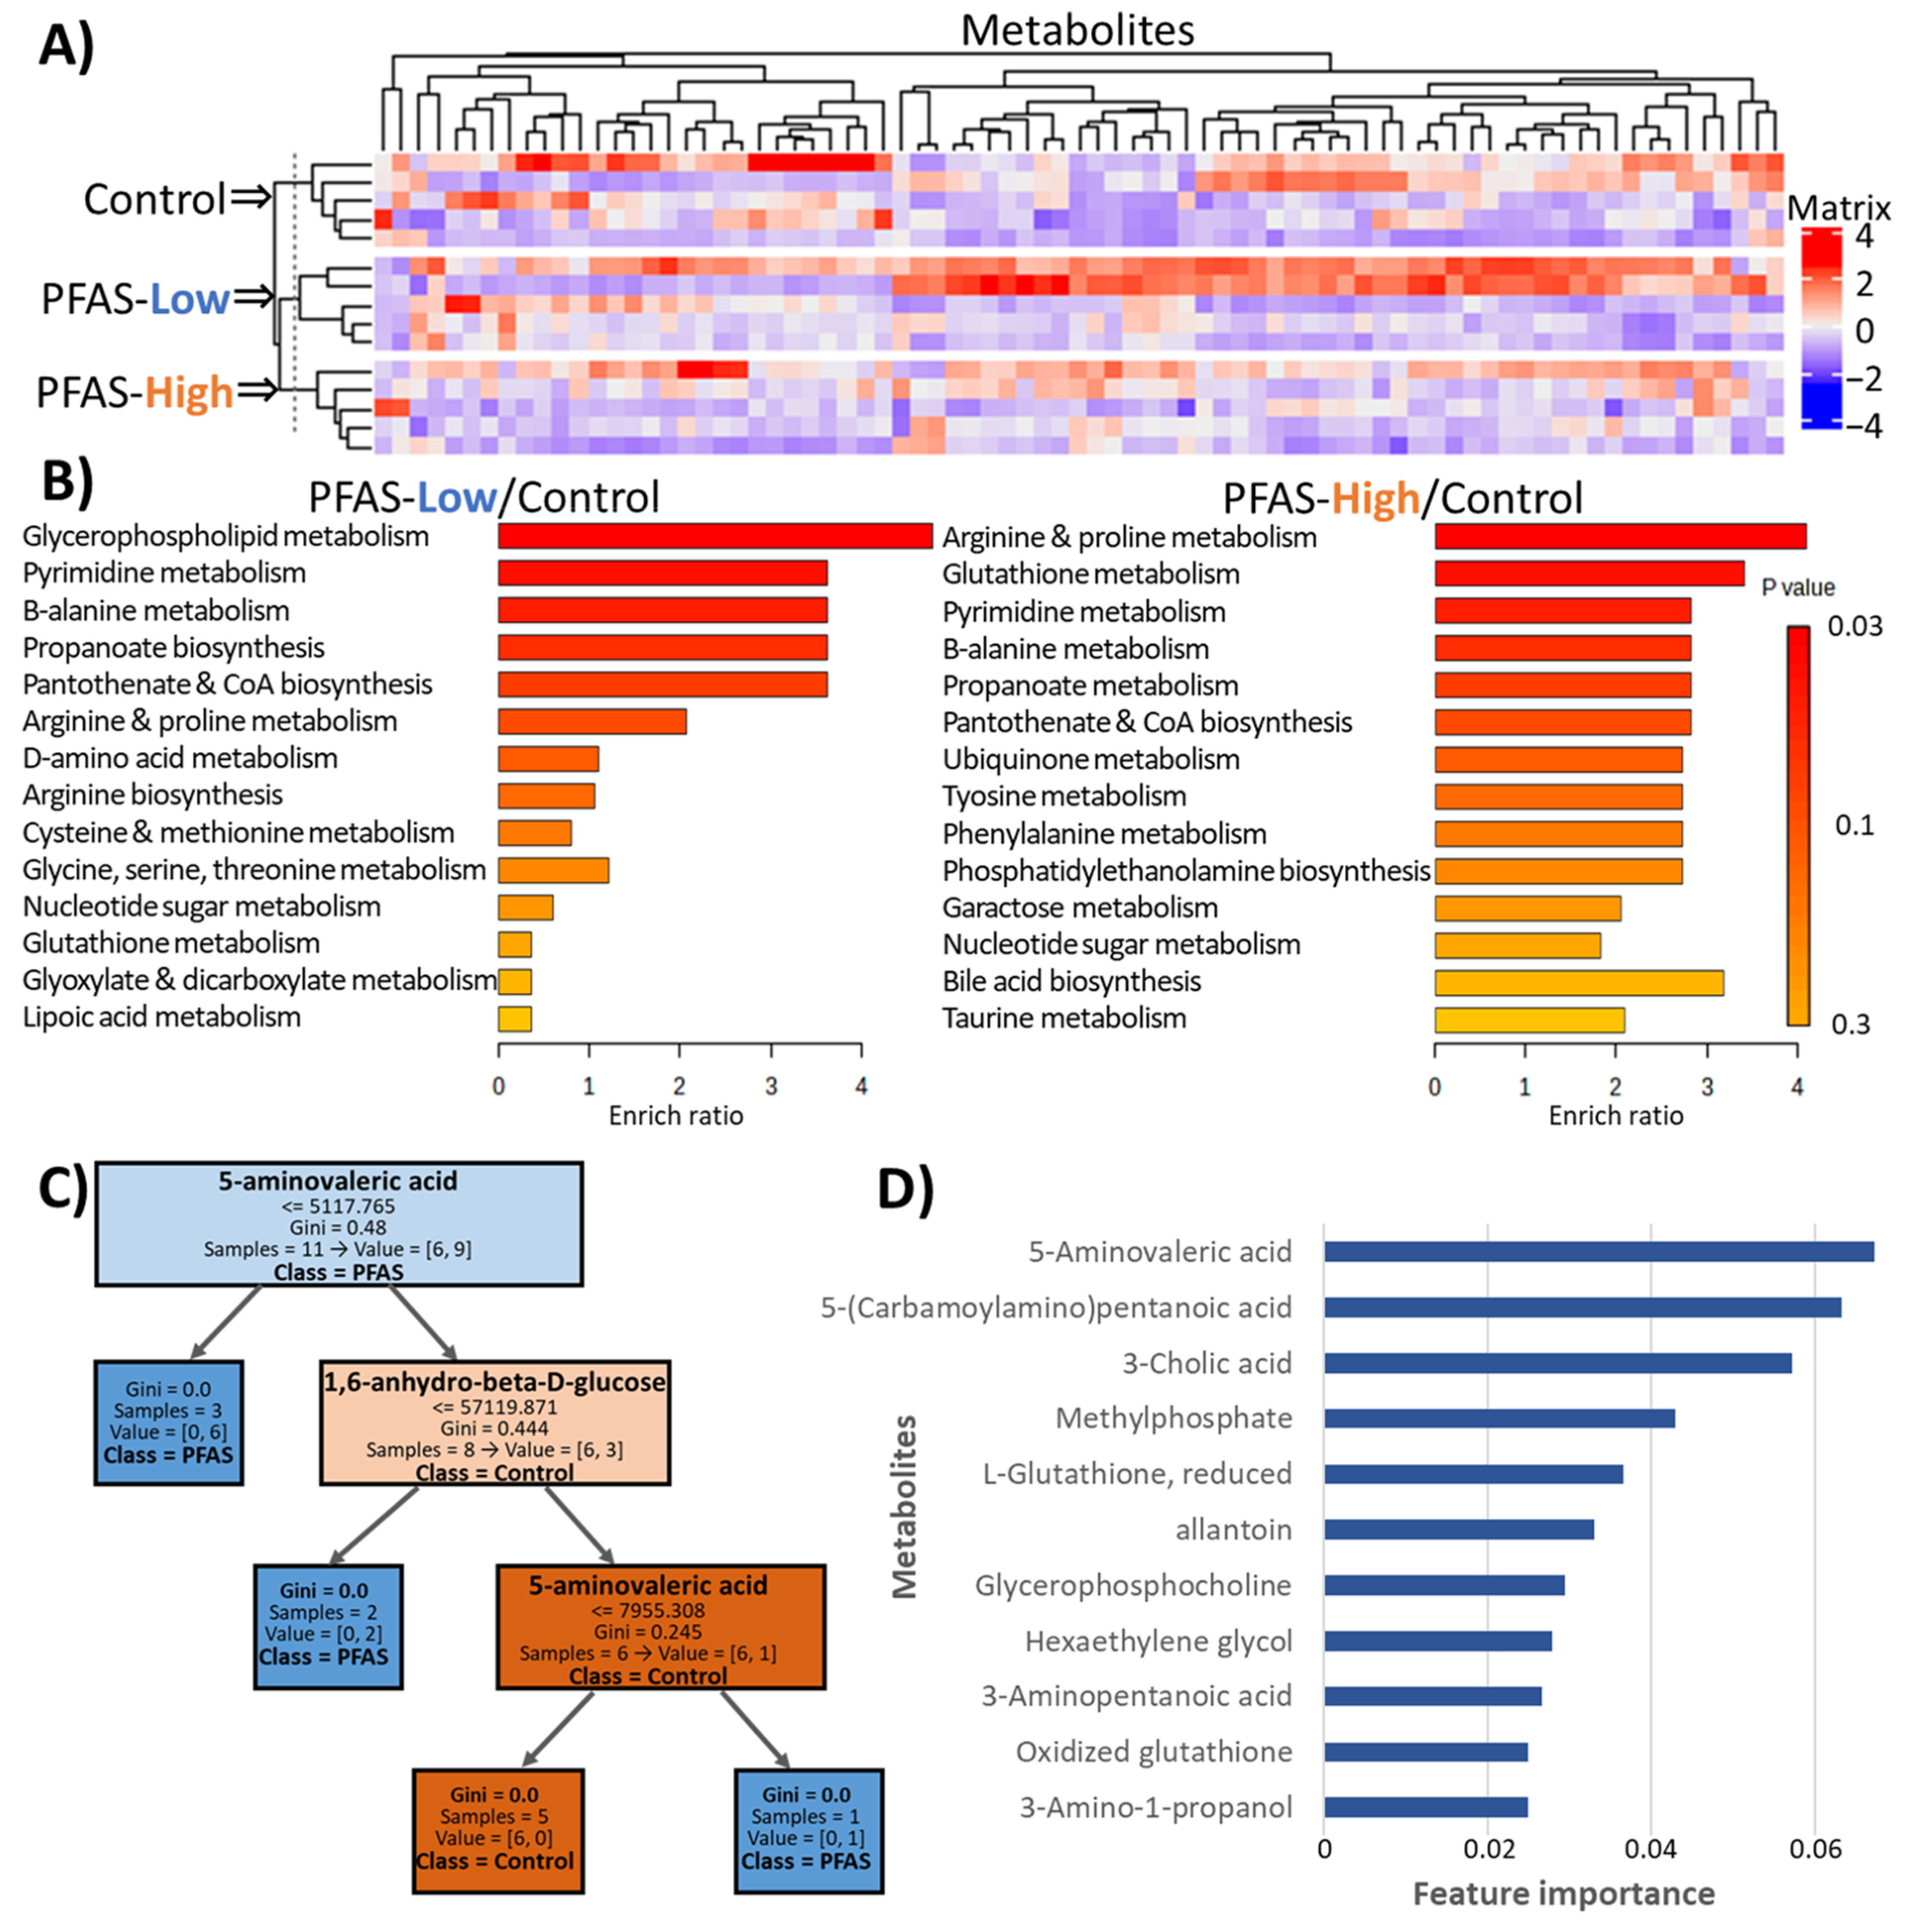
3.4. Metabolomics
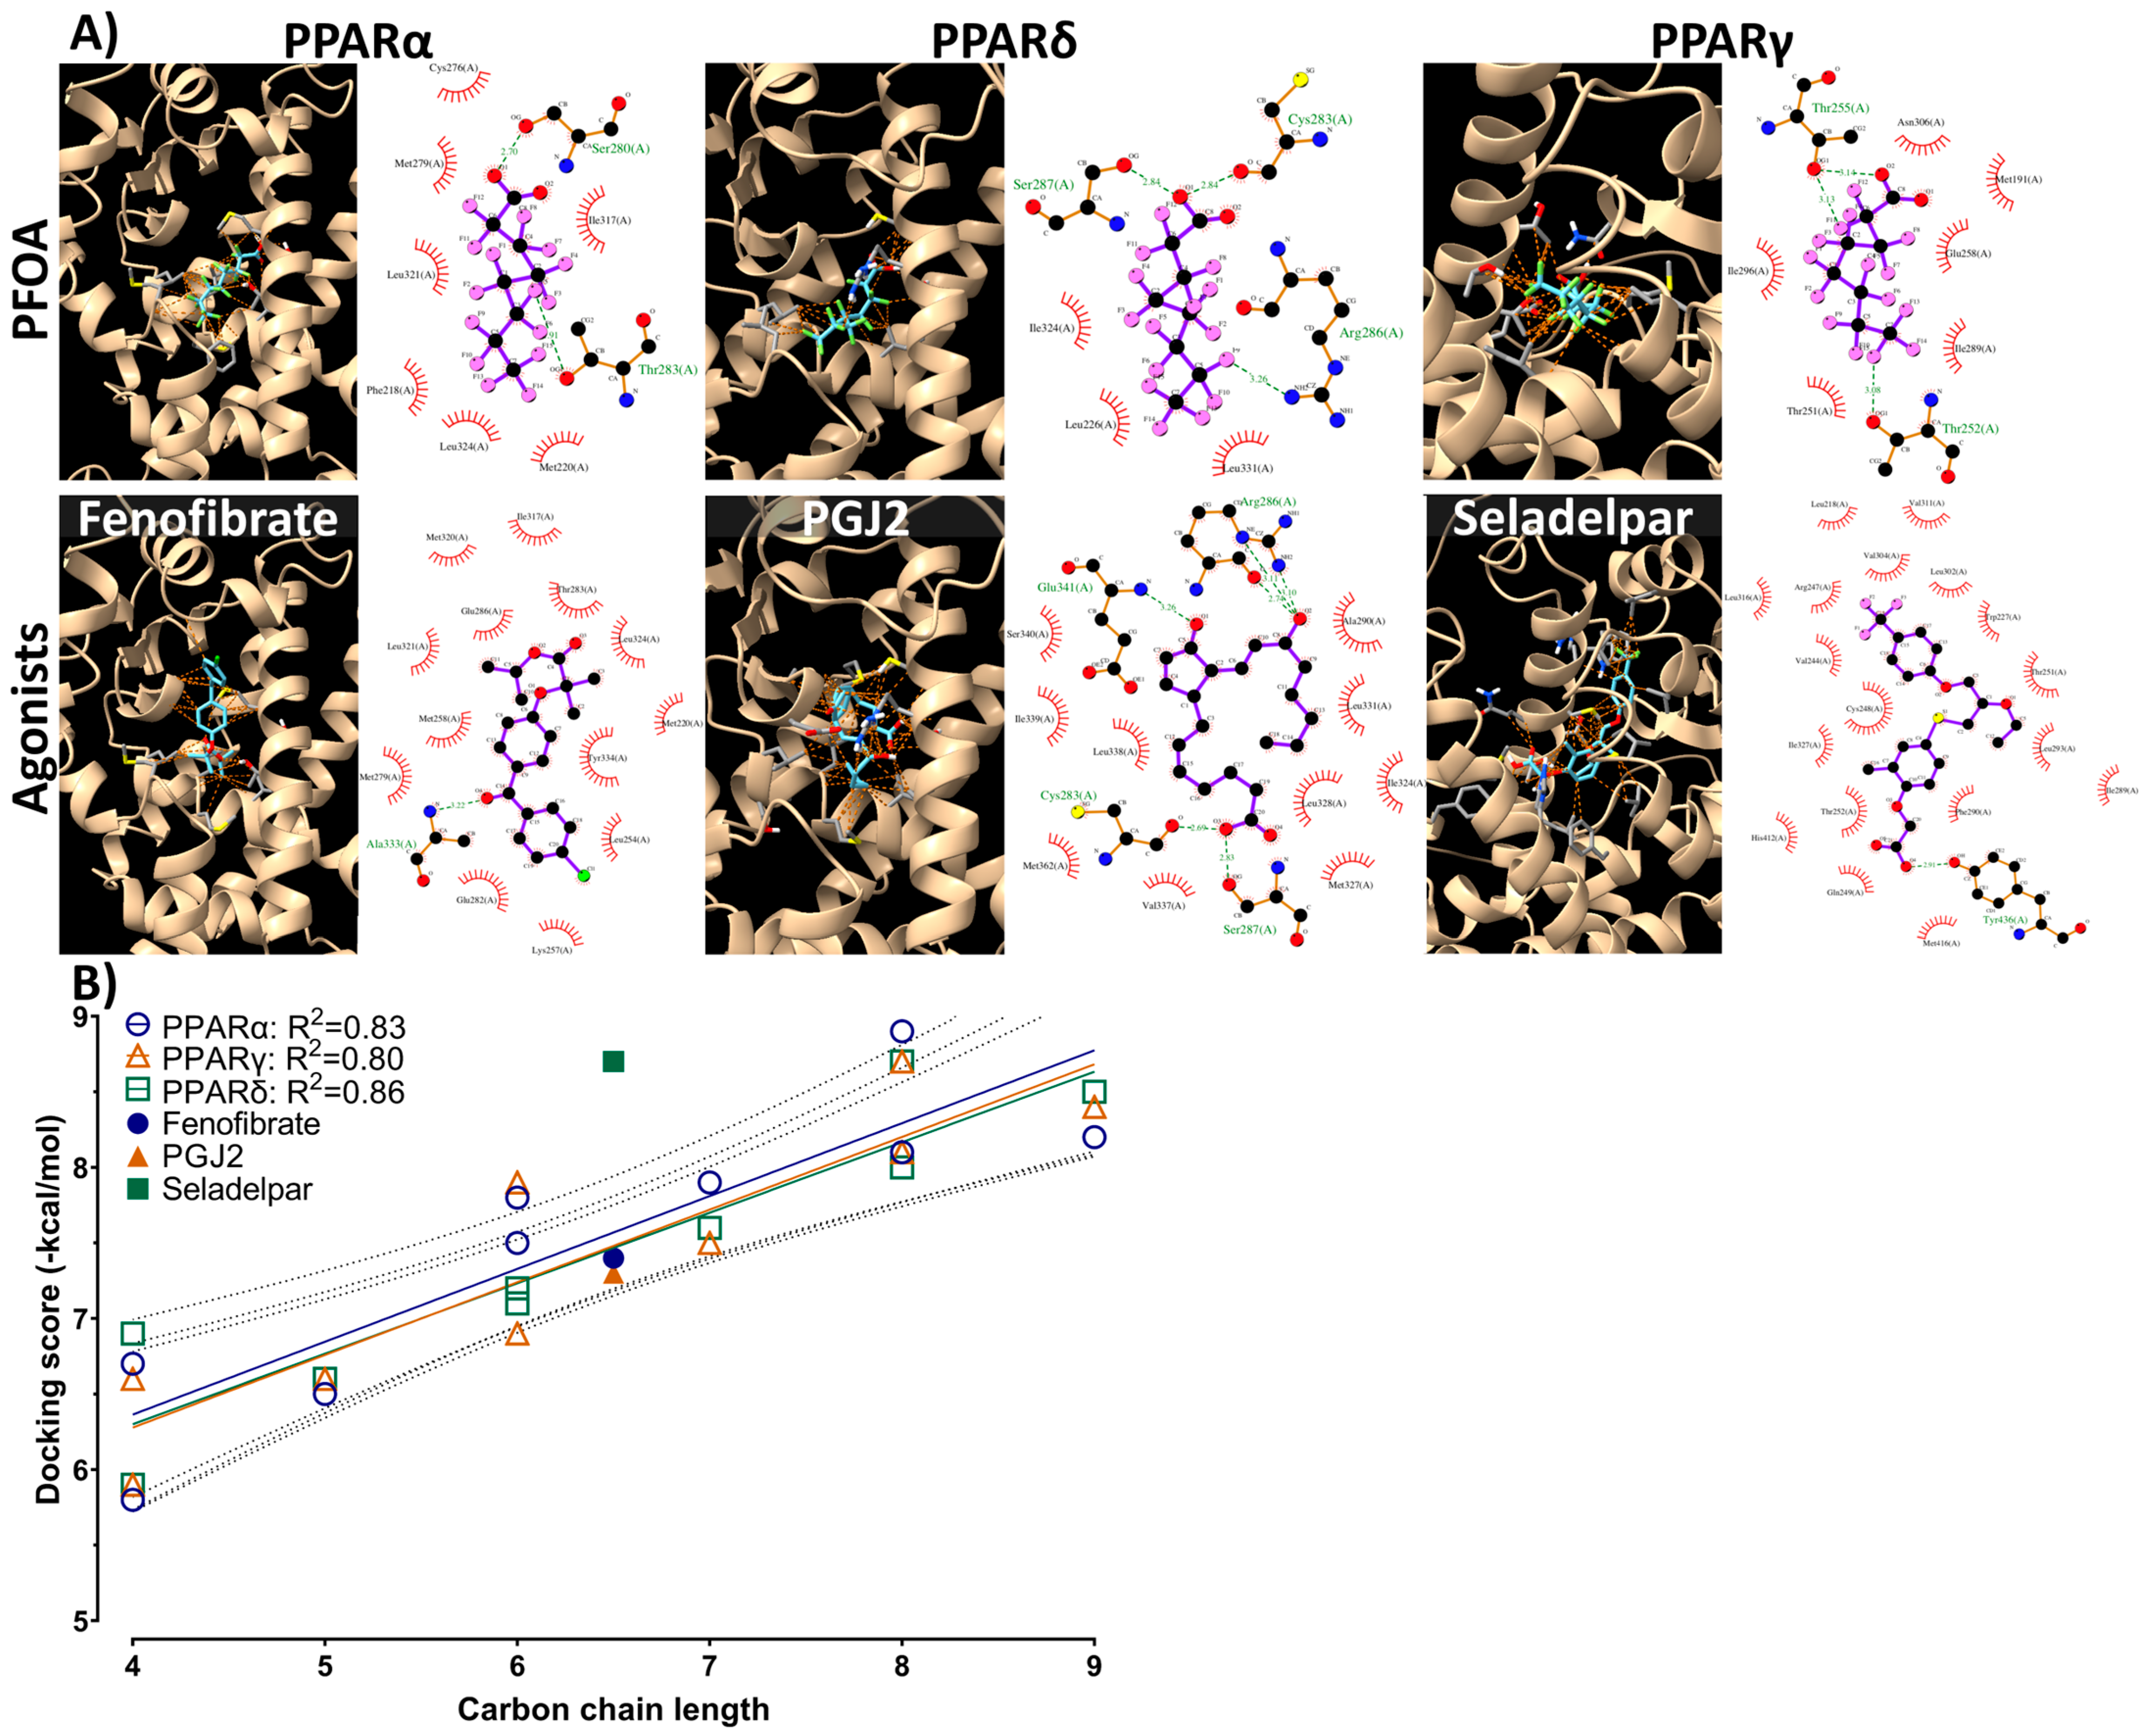
3.5. Molecular Docking
3.6. Biomarkers for Liver Injury
4. Discussion
5. Conclusions
Supplementary Materials
Author Contributions
Funding
Institutional Review Board Statement
Informed Consent Statement
Data Availability Statement
Conflicts of Interest
References
- Buck, R.C.; Franklin, J.; Berger, U.; Conder, J.M.; Cousins, I.T.; De Voogt, P.; Jensen, A.A.; Kannan, K.; Mabury, S.A.; van Leeuwen, S.P.J. Perfluoroalkyl and Polyfluoroalkyl Substances in the Environment: Terminology, Classification, and Origins. Integr. Environ. Assess. Manag. 2011, 7, 513–541. [Google Scholar] [CrossRef] [PubMed]
- Evich, M.G.; Davis, M.J.B.; McCord, J.P.; Acrey, B.; Awkerman, J.A.; Knappe, D.R.U.; Lindstrom, A.B.; Speth, T.F.; Tebes-Stevens, C.; Strynar, M.J.; et al. Per- and Polyfluoroalkyl Substances in the Environment. Science 2022, 375, eabg9065. [Google Scholar] [CrossRef] [PubMed]
- David Kempisty, E.M.; Racz, L. Forever Chemicals: Environmental, Economic, and Social Equity Concerns with PFAS in the Environment; CRC Press: Boca Raton, FL, USA, 2021. [Google Scholar]
- Stohler, S. Amazon Announces Ban on Toxic Chemicals and Plastics in Food Packaging. Available online: https://toxicfreefuture.org/press-room/amazon-announces-ban-on-toxic-chemicals-and-plastics-in-food-packaging/ (accessed on 9 November 2022).
- Olsen, G.W.; Burris, J.M.; Ehresman, D.J.; Froelich, J.W.; Seacat, A.M.; Butenhoff, J.L.; Zobel, L.R. Half-Life of Serum Elimination of Perfluorooctanesulfonate, Perfluorohexanesulfonate, and Perfluorooctanoate in Retired Fluorochemical Production Workers. Environ. Health Perspect. 2007, 115, 1298–1305. [Google Scholar] [CrossRef] [PubMed]
- All POPs listed in the Stockholm Convention. Available online: https://www.pops.int/TheConvention/ThePOPs/AllPOPs/tabid/2509/Default.aspx (accessed on 20 November 2023).
- Alexander, J.; Atli Auðunsson, G.; Benford, D.; Cockburn, A.; Cravedi, J.-P.; Dogliotti, E.; Di Domenico, A.; Luisa Fernández-Cruz, M.; Fink-Gremmels, J.; Fürst, P.; et al. Perfluorooctane Sulfonate (PFOS), Perfluorooctanoic Acid (PFOA) and Their Salts Scientific Opinion of the Panel on Contaminants in the Food Chain. EFSA J. 2008, 6, 653. [Google Scholar] [CrossRef]
- Schrenk, D.; Bignami, M.; Bodin, L.; Chipman, J.K.; del Mazo, J.; Grasl-Kraupp, B.; Hogstrand, C.; Hoogenboom, L.; Leblanc, J.C.; Nebbia, C.S.; et al. Risk to Human Health Related to the Presence of Perfluoroalkyl Substances in Food. EFSA J. 2020, 18, e06223. [Google Scholar] [CrossRef] [PubMed]
- US EPA. Drinking Water Health Advisories for PFOA and PFOS; US EPA: Washington, DC, USA, 2022.
- Japanese Ministry of the Environment Fifth Report “Review of Environmental Standards for the Protection of Human Health Pertaining to Water Pollution” (in Japanese). Available online: https://www.env.go.jp/press/108066.html (accessed on 6 January 2023).
- Fenton, S.E.; Ducatman, A.; Boobis, A.; DeWitt, J.C.; Lau, C.; Ng, C.; Smith, J.S.; Roberts, S.M. Per- and Polyfluoroalkyl Substance Toxicity and Human Health Review: Current State of Knowledge and Strategies for Informing Future Research. Environ. Toxicol. Chem. 2021, 40, 606–630. [Google Scholar] [CrossRef]
- Bjork, J.A.; Butenhoff, J.L.; Wallace, K.B. Multiplicity of Nuclear Receptor Activation by PFOA and PFOS in Primary Human and Rodent Hepatocytes. Toxicology 2011, 288, 8–17. [Google Scholar] [CrossRef]
- Rosen, M.B.; Das, K.P.; Rooney, J.; Abbott, B.; Lau, C.; Corton, J.C. PPARα-Independent Transcriptional Targets of Perfluoroalkyl Acids Revealed by Transcript Profiling. Toxicology 2017, 387, 95–107. [Google Scholar] [CrossRef]
- Blake, B.E.; Cope, H.A.; Hall, S.M.; Keys, R.D.; Mahler, B.W.; McCord, J.; Scott, B.; Stapleton, H.M.; Strynar, M.J.; Elmore, S.A.; et al. Evaluation of Maternal, Embryo, and Placental Effects in CD-1 Mice Following Gestational Exposure to Perfluorooctanoic Acid (PFOA) or Hexafluoropropylene Oxide Dimer Acid (HFPO-DA or GenX). Environ. Health Perspect. 2020, 128, 27006. [Google Scholar] [CrossRef]
- Pierozan, P.; Cattani, D.; Karlsson, O. Perfluorooctane Sulfonate (PFOS) and Perfluorooctanoic Acid (PFOA) Induce Epigenetic Alterations and Promote Human Breast Cell Carcinogenesis in Vitro. Arch. Toxicol. 2020, 94, 3893–3906. [Google Scholar] [CrossRef]
- Pierozan, P.; Cattani, D.; Karlsson, O. Tumorigenic Activity of Alternative Per- and Polyfluoroalkyl Substances (PFAS): Mechanistic in Vitro Studies. Sci. Total Environ. 2022, 808, 151945. [Google Scholar] [CrossRef] [PubMed]
- Chen, L.; Zhu, M.; Liu, Y.; Yang, Z.; Li, H.; Mu, H.; Liu, S.; Wu, B. Perfluorobutanesulfonate Exposure Induces Metabolic Disturbances in Different Regions of Mouse Gut. Sci. Total Environ. 2023, 866, 161261. [Google Scholar] [CrossRef]
- Chen, L.; Liu, Y.; Mu, H.; Li, H.; Liu, S.; Zhu, M.; Bu, Y.; Wu, B. Effects of Perfluorobutane Sulfonate and Perfluorooctane Sulfonate on Lipid Homeostasis in Mouse Liver. Environ. Pollut. 2022, 315, 120403. [Google Scholar] [CrossRef]
- Grønnestad, R.; Johanson, S.M.; Müller, M.H.B.; Schlenk, D.; Tanabe, P.; Krøkje, Å.; Jaspers, V.L.B.; Jenssen, B.M.; Ræder, E.M.; Lyche, J.L.; et al. Effects of an Environmentally Relevant PFAS Mixture on Dopamine and Steroid Hormone Levels in Exposed Mice. Toxicol. Appl. Pharmacol. 2021, 428, 115670. [Google Scholar] [CrossRef] [PubMed]
- Hallberg, I.; Persson, S.; Olovsson, M.; Sirard, M.A.; Damdimopoulou, P.; Rüegg, J.; Sjunnesson, Y.C.B. Perfluorooctane Sulfonate (PFOS) Exposure of Bovine Oocytes Affects Early Embryonic Development at Human-Relevant Levels in an in Vitro Model. Toxicology 2021, 464, 153028. [Google Scholar] [CrossRef] [PubMed]
- Pérez, F.; Llorca, M.; Köck-Schulmeyer, M.; Škrbić, B.; Oliveira, L.F.S.; da Boit Martinello, K.; Al-Dhabi, N.A.; Antić, I.; Farré, M.; Barceló, D. Assessment of Perfluoroalkyl Substances in Food Items at Global Scale. Environ. Res. 2014, 135, 181–189. [Google Scholar] [CrossRef]
- Kovac, R.; Rajkovic, V.; Koledin, I.; Matavulj, M. Acrylamide Alters Glycogen Content and Enzyme Activities in the Liver of Juvenile Rat. Acta Histochem. 2015, 117, 712–717. [Google Scholar] [CrossRef] [PubMed]
- Kanehisa, M.; Furumichi, M.; Sato, Y.; Kawashima, M.; Ishiguro-Watanabe, M. KEGG for Taxonomy-Based Analysis of Pathways and Genomes. Nucleic Acids Res. 2023, 51, D587–D592. [Google Scholar] [CrossRef]
- Kamata, R.; Okawa, Y.; Hamaguchi, Y.; Tabata, S.; Terasaki, M.; Takeda, K. Observation of Hapten-Induced Sensitization Responses for the Development of a Mouse Skin Sensitization Test, Including the Elicitation Phase. Sci. Rep. 2022, 12, 19898. [Google Scholar] [CrossRef]
- Schymanski, E.L.; Jeon, J.; Gulde, R.; Fenner, K.; Ruff, M.; Singer, H.P.; Hollender, J. Identifying Small Molecules via High Resolution Mass Spectrometry: Communicating Confidence. Environ. Sci. Technol. 2014, 48, 2097–2098. [Google Scholar] [CrossRef]
- Tsugawa, H.; Cajka, T.; Kind, T.; Ma, Y.; Higgins, B.; Ikeda, K.; Kanazawa, M.; Vandergheynst, J.; Fiehn, O.; Arita, M. MS-DIAL: Data-Independent MS/MS Deconvolution for Comprehensive Metabolome Analysis. Nat. Methods 2015, 12, 523–526. [Google Scholar] [CrossRef] [PubMed]
- Wishart, D.S.; Feunang, Y.D.; Marcu, A.; Guo, A.C.; Liang, K.; Vázquez-Fresno, R.; Sajed, T.; Johnson, D.; Li, C.; Karu, N.; et al. HMDB 4.0: The Human Metabolome Database for 2018. Nucleic Acids Res. 2018, 46, D608–D617. [Google Scholar] [CrossRef] [PubMed]
- Gasteiger, J.; Marsili, M. A New Model for Calculating Atomic Charges in Molecules. Tetrahedron Lett. 1978, 19, 3181–3184. [Google Scholar] [CrossRef]
- Jumper, J.; Evans, R.; Pritzel, A.; Green, T.; Figurnov, M.; Ronneberger, O.; Tunyasuvunakool, K.; Bates, R.; Žídek, A.; Potapenko, A.; et al. Highly Accurate Protein Structure Prediction with AlphaFold. Nature 2021, 596, 583–589. [Google Scholar] [CrossRef] [PubMed]
- Brooks, B.R.; Bruccoleri, R.E.; Olafson, B.D.; States, D.J.; Swaminathan, S.; Karplus, M. CHARMM: A Program for Macromolecular Energy, Minimization, and Dynamics Calculations. J. Comput. Chem. 1983, 4, 187–217. [Google Scholar] [CrossRef]
- Kawabata, T. Detection of Multiscale Pockets on Protein Surfaces Using Mathematical Morphology. Proteins Struct. Funct. Bioinform. 2010, 78, 1195–1211. [Google Scholar] [CrossRef]
- Trott, O.; Olson, A.J. AutoDock Vina: Improving the Speed and Accuracy of Docking with a New Scoring Function, Efficient Optimization, and Multithreading. J. Comput. Chem. 2010, 31, 455–461. [Google Scholar] [CrossRef]
- Laskowski, R.A.; Swindells, M.B. LigPlot+: Multiple Ligand-Protein Interaction Diagrams for Drug Discovery. J. Chem. Inf. Model. 2011, 51, 2778–2786. [Google Scholar] [CrossRef]
- Aalizadeh, R.; Alygizakis, N.A.; Schymanski, E.L.; Krauss, M.; Schulze, T.; Ibáñez, M.; McEachran, A.D.; Chao, A.; Williams, A.J.; Gago-Ferrero, P.; et al. Development and Application of Liquid Chromatographic Retention Time Indices in HRMS-Based Suspect and Nontarget Screening. Anal. Chem. 2021, 93, 11601–11611. [Google Scholar] [CrossRef]
- Xia, J.; Psychogios, N.; Young, N.; Wishart, D.S. MetaboAnalyst: A Web Server for Metabolomic Data Analysis and Interpretation. Nucleic Acids Res. 2009, 37, W652–W660. [Google Scholar] [CrossRef]
- Wright, M.N.; Ziegler, A. Ranger: A Fast Implementation of Random Forests for High Dimensional Data in C++ and R. J. Stat. Softw. 2017, 77, 1–17. [Google Scholar] [CrossRef]
- Oliveira, A.C.P.; Bertollo, C.M.; Rocha, L.T.S.; Nascimento, E.B.; Costa, K.A.; Coelho, M.M. Antinociceptive and Antiedematogenic Activities of Fenofibrate, an Agonist of PPAR Alpha, and Pioglitazone, an Agonist of PPAR Gamma. Eur. J. Pharmacol. 2007, 561, 194–201. [Google Scholar] [CrossRef] [PubMed]
- Tang, J.; Xiong, J.; Wu, T.; Tang, Z.; Ding, G.; Zhang, C.; Wang, S.; Liu, Y. Aspirin Treatment Improved Mesenchymal Stem Cell Immunomodulatory Properties via the 15d-PGJ2/PPARγ/TGF-Β1 Pathway. Stem Cells Dev. 2014, 23, 2093–2103. [Google Scholar] [CrossRef] [PubMed]
- Jones, D.; Boudes, P.F.; Swain, M.G.; Bowlus, C.L.; Galambos, M.R.; Bacon, B.R.; Doerffel, Y.; Gitlin, N.; Gordon, S.C.; Odin, J.A.; et al. Seladelpar (MBX-8025), a Selective PPAR-δ Agonist, in Patients with Primary Biliary Cholangitis with an Inadequate Response to Ursodeoxycholic Acid: A Double-Blind, Randomised, Placebo-Controlled, Phase 2, Proof-of-Concept Study. Lancet Gastroenterol. Hepatol. 2017, 2, 716–726. [Google Scholar] [CrossRef]
- Quimby, F.W.; Luong, R.H. Clinical Chemistry of the Laboratory Mouse. In The Mouse in Biomedical Research: History, Wild Mice, and Genetics, 2nd ed.; Elsevier: Amsterdam, The Netherlands, 2006; Volume 1–4, pp. 171–216. ISBN 9780123694546. [Google Scholar]
- Otto, G.P.; Rathkolb, B.; Oestereicher, M.A.; Lengger, C.J.; Moerth, C.; Micklich, K.; Fuchs, H.; Gailus-Durner, V.; Wolf, E.; De Angelis, M.H. Clinical Chemistry Reference Intervals for C57BL/6J, C57BL/6N, and C3HeB/FeJ Mice (Mus musculus). J. Am. Assoc. Lab. Anim. Sci. 2016, 55, 375–386. [Google Scholar] [PubMed]
- Hölzer, J.; Lilienthal, H.; Schümann, M. Human Biomonitoring (HBM)-I Values for Perfluorooctanoic Acid (PFOA) and Perfluorooctane Sulfonic Acid (PFOS)—Description, Derivation and Discussion. Regul. Toxicol. Pharmacol. 2021, 121, 104862. [Google Scholar] [CrossRef]
- Elcombe, C.R.; Elcombe, B.M.; Foster, J.R.; Chang, S.C.; Ehresman, D.J.; Noker, P.E.; Butenhoff, J.L. Evaluation of Hepatic and Thyroid Responses in Male Sprague Dawley Rats for up to Eighty-Four Days Following Seven Days of Dietary Exposure to Potassium Perfluorooctanesulfonate. Toxicology 2012, 293, 30–40. [Google Scholar] [CrossRef]
- Fhu, C.W.; Ali, A. Fatty Acid Synthase: An Emerging Target in Cancer. Molecules 2020, 25, 3935. [Google Scholar] [CrossRef]
- Valla, M.; Klæstad, E.; Ytterhus, B.; Bofin, A.M. CCND1 Amplification in Breast Cancer -Associations with Proliferation, Histopathological Grade, Molecular Subtype and Prognosis. J. Mammary Gland Biol. Neoplasia 2022, 27, 67–77. [Google Scholar] [CrossRef]
- Xie, Z.; Bailey, A.; Kuleshov, M.V.; Clarke, D.J.B.; Evangelista, J.E.; Jenkins, S.L.; Lachmann, A.; Wojciechowicz, M.L.; Kropiwnicki, E.; Jagodnik, K.M.; et al. Gene Set Knowledge Discovery with Enrichr. Curr. Protoc. 2021, 1, e90. [Google Scholar] [CrossRef]
- Luzzi, S.; Maggi, C.A.; Spagnesi, S.; Santicioli, P.; Zilletti, L. 5-Aminovaleric Acid Interactions with GABAA and GABAB Receptors in Guinea-Pig Ileum. J. Auton. Pharmacol. 1985, 5, 65–69. [Google Scholar] [CrossRef]
- Callery, P.S.; Geelhaar, L.A. 1-Piperideine as an in Vivo Precursor of the Gamma-Aminobutyric Acid Homologue 5-Aminopentanoic Acid. J. Neurochem. 1985, 45, 946–948. [Google Scholar] [CrossRef] [PubMed]
- Cheng, H.S.; Yip, Y.S.; Lim, E.K.Y.; Wahli, W.; Tan, N.S. PPARs and Tumor Microenvironment: The Emerging Roles of the Metabolic Master Regulators in Tumor Stromal-Epithelial Crosstalk and Carcinogenesis. Cancers 2021, 13, 2153. [Google Scholar] [CrossRef] [PubMed]
- Kuenemann, M.A.; Spears, P.A.; Orndorff, P.E.; Fourches, D. In Silico Predicted Glucose-1-Phosphate Uridylyltransferase (GalU) Inhibitors Block a Key Pathway Required for Listeria Virulence. Mol. Inform. 2018, 37, 1800004. [Google Scholar] [CrossRef] [PubMed]
- Evans, N.; Conley, J.M.; Cardon, M.; Hartig, P.; Medlock-Kakaley, E.; Gray, L.E. In Vitro Activity of a Panel of Per- and Polyfluoroalkyl Substances (PFAS), Fatty Acids, and Pharmaceuticals in Peroxisome Proliferator-Activated Receptor (PPAR) Alpha, PPAR Gamma, and Estrogen Receptor Assays. Toxicol. Appl. Pharmacol. 2022, 449, 116136. [Google Scholar] [CrossRef]
- Hall, A.P.; Elcombe, C.R.; Foster, J.R.; Harada, T.; Kaufmann, W.; Knippel, A.; Küttler, K.; Malarkey, D.E.; Maronpot, R.R.; Nishikawa, A.; et al. Liver Hypertrophy: A Review of Adaptive (Adverse and Non-Adverse) Changes-Conclusions from the 3rd International ESTP Expert Workshop. Toxicol. Pathol. 2012, 40, 971–994. [Google Scholar] [CrossRef]
- Cheung, C.; Akiyama, T.E.; Ward, J.M.; Nicol, C.J.; Feigenbaum, L.; Vinson, C.; Gonzalez, F.J. Diminished Hepatocellular Proliferation in Mice Humanized for the Nuclear Receptor Peroxisome Proliferator-Activated Receptor α. Cancer Res. 2004, 64, 3849–3854. [Google Scholar] [CrossRef]
- Rebholz, S.L.; Jones, T.; Herrick, R.L.; Xie, C.; Calafat, A.M.; Pinney, S.M.; Woollett, L.A. Hypercholesterolemia with Consumption of PFOA-Laced Western Diets Is Dependent on Strain and Sex of Mice. Toxicol. Rep. 2016, 3, 46–54. [Google Scholar] [CrossRef]
- Kawashita, E.; Ishihara, K.; Nomoto, M.; Taniguchi, M.; Akiba, S. A Comparative Analysis of Hepatic Pathological Phenotypes in C57BL/6J and C57BL/6N Mouse Strains in Non-Alcoholic Steatohepatitis Models. Sci. Rep. 2019, 9, 204. [Google Scholar] [CrossRef]
- Drakvik, E.; Altenburger, R.; Aoki, Y.; Backhaus, T.; Bahadori, T.; Barouki, R.; Brack, W.; Cronin, M.T.D.; Demeneix, B.; Hougaard Bennekou, S.; et al. Statement on Advancing the Assessment of Chemical Mixtures and Their Risks for Human Health and the Environment. Environ. Int. 2020, 134, 105267. [Google Scholar] [CrossRef]


| Compound | Abbreviation | % | Expected Concentration (ng/L) | Measured Concentration (ng/L) | Carbon Chain Length | Pubchem CID |
|---|---|---|---|---|---|---|
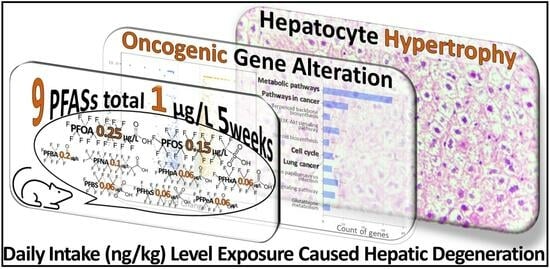
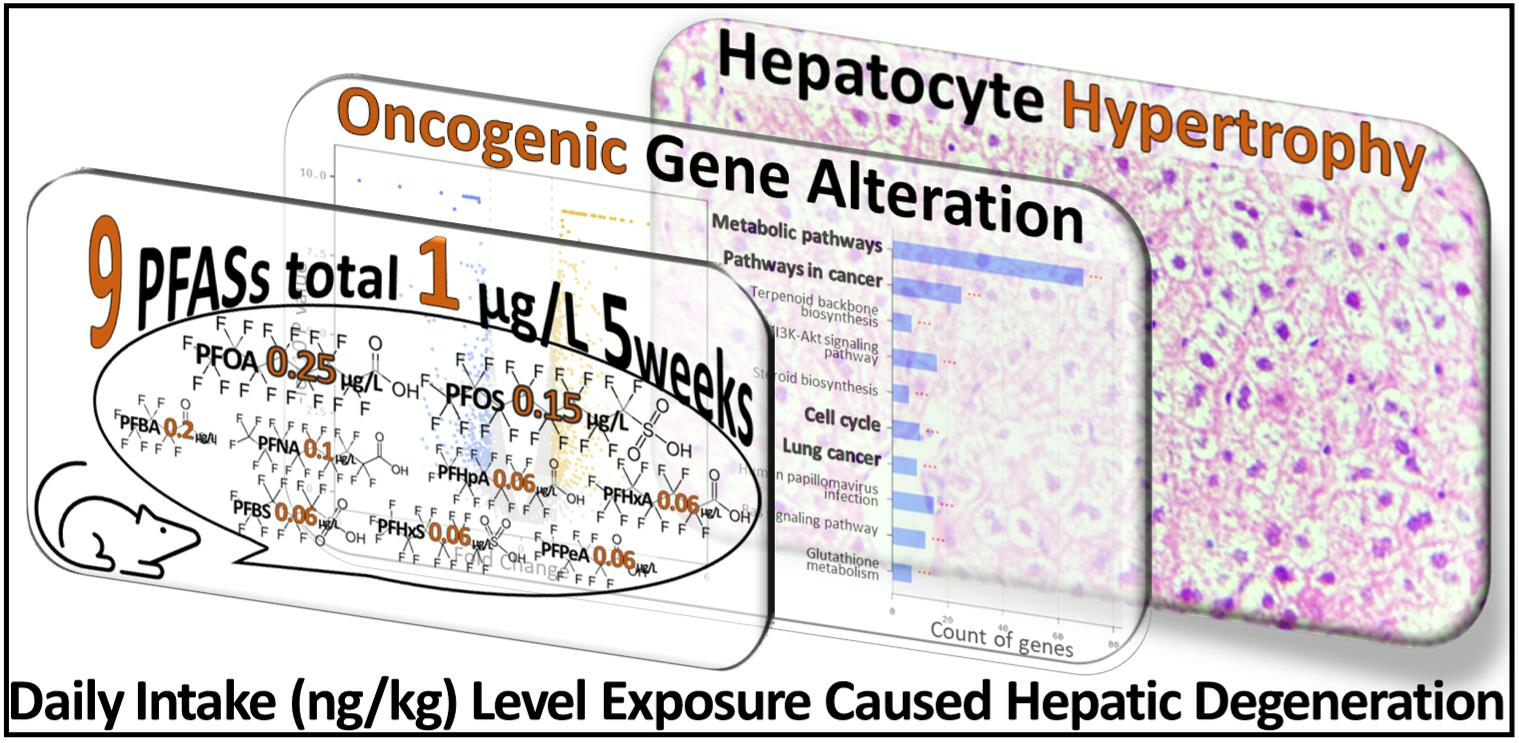
| Perfluorooctanoic acid | PFOA | 25 | 250 | 264 | 8 | 9554 |
| Perfluorobutanoic acid | PFBA | 20 | 200 | 298 | 4 | 9777 |
| Perfluorooctanesulfonic acid | PFOS | 15 | 150 | 113 | 8 | 74,483 |
| Perfluorononanoic acid | PFNA | 10 | 100 | 115 | 9 | 67,821 |
| Perfluorovaleric acid | PFPeA | 6 | 60 | 99 | 5 | 75,921 |
| Perfluorohexanoic acid | PFHxA | 6 | 60 | 72 | 6 | 67,542 |
| Perfluorobutanesulfonic acid | PFBS | 6 | 60 | 99 | 4 | 67,815 |
| Perfluoroheptanoic acid | PFHpA | 6 | 60 | 35 | 7 | 67,818 |
| Perfluorohexanesulfonic acid | PFHxS | 6 | 60 | 35 | 6 | 67,734 |
| SUM | 100 | 1000 | 1130 |
Disclaimer/Publisher’s Note: The statements, opinions and data contained in all publications are solely those of the individual author(s) and contributor(s) and not of MDPI and/or the editor(s). MDPI and/or the editor(s) disclaim responsibility for any injury to people or property resulting from any ideas, methods, instructions or products referred to in the content. |
© 2024 by the authors. Licensee MDPI, Basel, Switzerland. This article is an open access article distributed under the terms and conditions of the Creative Commons Attribution (CC BY) license (https://creativecommons.org/licenses/by/4.0/).
Share and Cite
Takeda, K.; Saito, T.; Sasaki, S.; Eguchi, A.; Sugiyama, M.; Eto, S.; Suzuki, K.; Kamata, R. Toxicity Assessment of Mixed Exposure of Nine Perfluoroalkyl Substances at Concentrations Relevant to Daily Intake. Toxics 2024, 12, 52. https://doi.org/10.3390/toxics12010052
Takeda K, Saito T, Sasaki S, Eguchi A, Sugiyama M, Eto S, Suzuki K, Kamata R. Toxicity Assessment of Mixed Exposure of Nine Perfluoroalkyl Substances at Concentrations Relevant to Daily Intake. Toxics. 2024; 12(1):52. https://doi.org/10.3390/toxics12010052
Chicago/Turabian StyleTakeda, Kazuki, Taki Saito, Sakura Sasaki, Akifumi Eguchi, Makoto Sugiyama, Saeka Eto, Kio Suzuki, and Ryo Kamata. 2024. "Toxicity Assessment of Mixed Exposure of Nine Perfluoroalkyl Substances at Concentrations Relevant to Daily Intake" Toxics 12, no. 1: 52. https://doi.org/10.3390/toxics12010052