
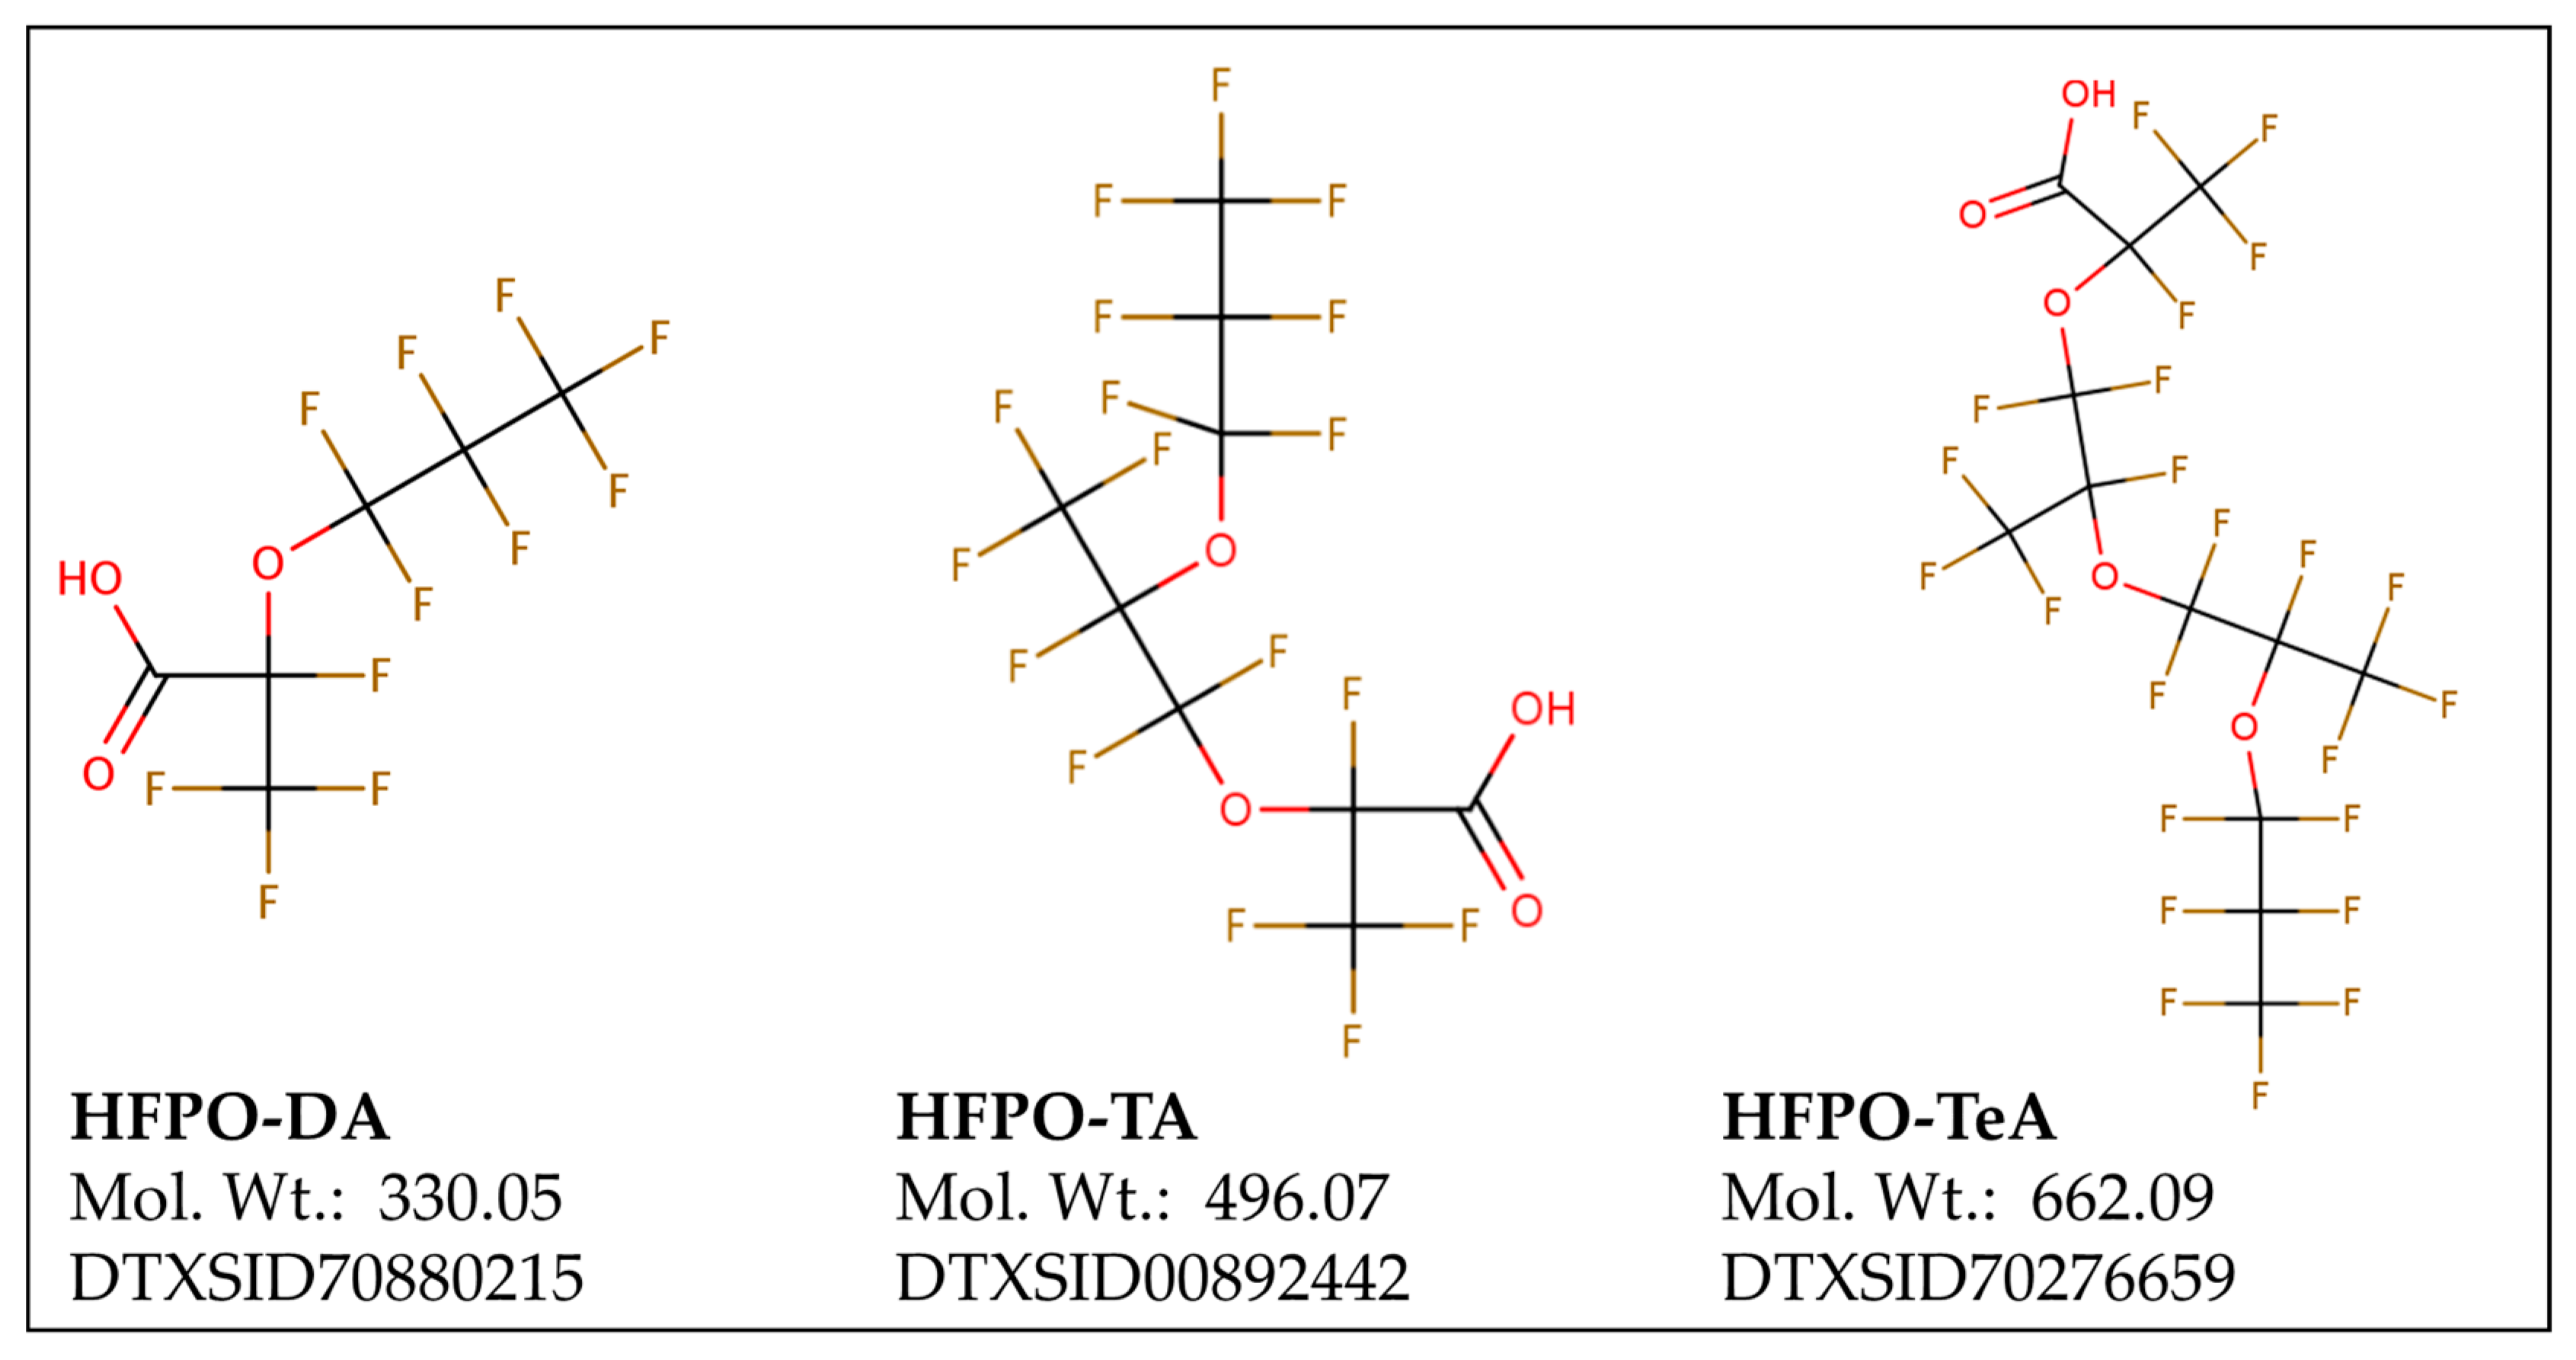
Dose Response, Dosimetric, and Metabolic Evaluations of Replacement PFAS Perfluoro-(2,5,8-trimethyl-3,6,9-trioxadodecanoic) Acid (HFPO-TeA)
 , , and
Abstract
:1. Introduction
2. Materials and Methods
2.1. In Vivo Exposure Chemicals, Study Design, and Analytical Assessments
2.1.1. Plasma Thyroid Hormone Assessment
Chemicals and Extraction Procedure
Analytical Chemistry
2.1.2. Plasma HFPO-TeA Dosimetry Assessment
Chemicals and Extraction Procedure
Analytical Chemistry
2.1.3. Liver HFPO-TeA Dosimetry Assessment
Chemicals, Materials, and Extraction Procedure
Analytical Chemistry
2.2. In Vivo and In Vitro Non-Targeted Analysis Chemicals and Data Analysis
2.3. Hepatocyte Metabolic Stability and Metabolite Formation Assay Materials, Chemicals, and Extraction
2.3.1. Hepatocyte Metabolic Stability Assay Study Design, Chemicals, and Calculations
2.3.2. Hepatic Metabolic Formation Assay Study Design
2.4. Ultracentrifugation Plasma Protein Binding Assay Chemicals, Materials, Study Design, and Calculations
Study Design, Chemicals, and Calculations
2.5. In Vitro Study Targeted Sample Analysis
2.6. LD50 Calculation
3. Results
3.1. In Vivo Results
3.1.1. Rat Body Weight, Liver Weights, and Clinical Observations
3.1.2. Plasma Thyroid Hormones
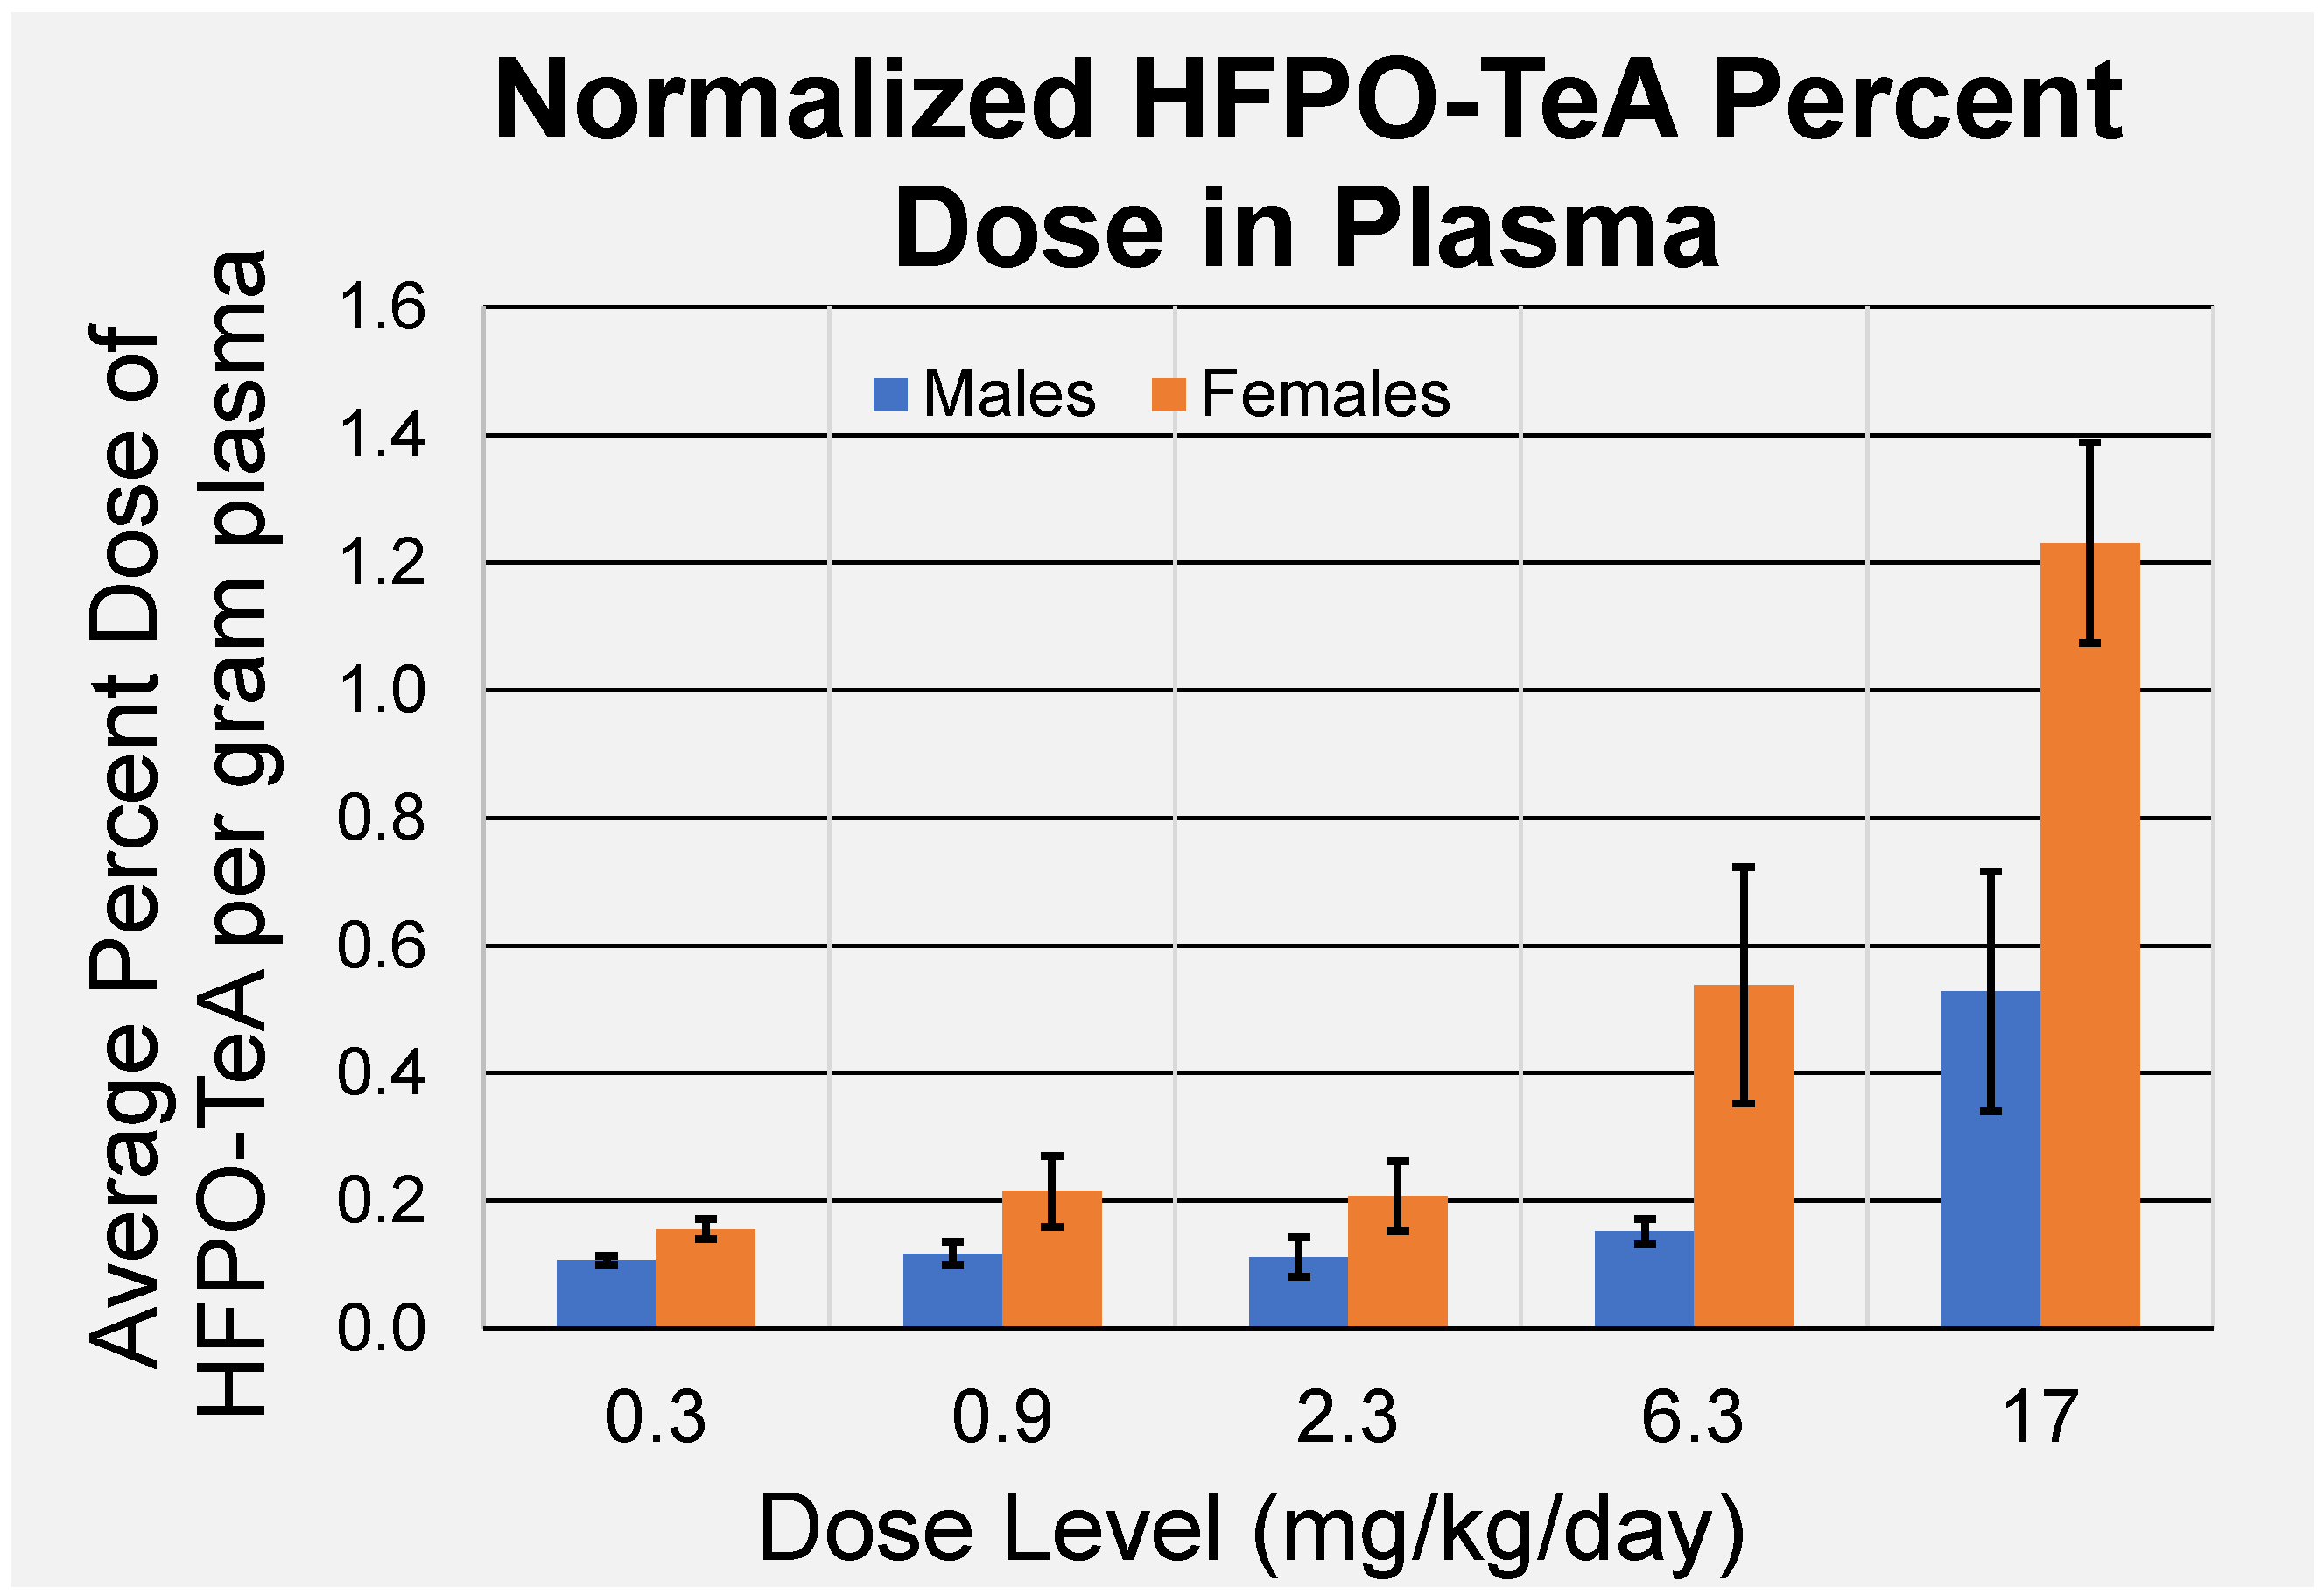
3.1.3. Plasma HFPO-TeA Dosimetry
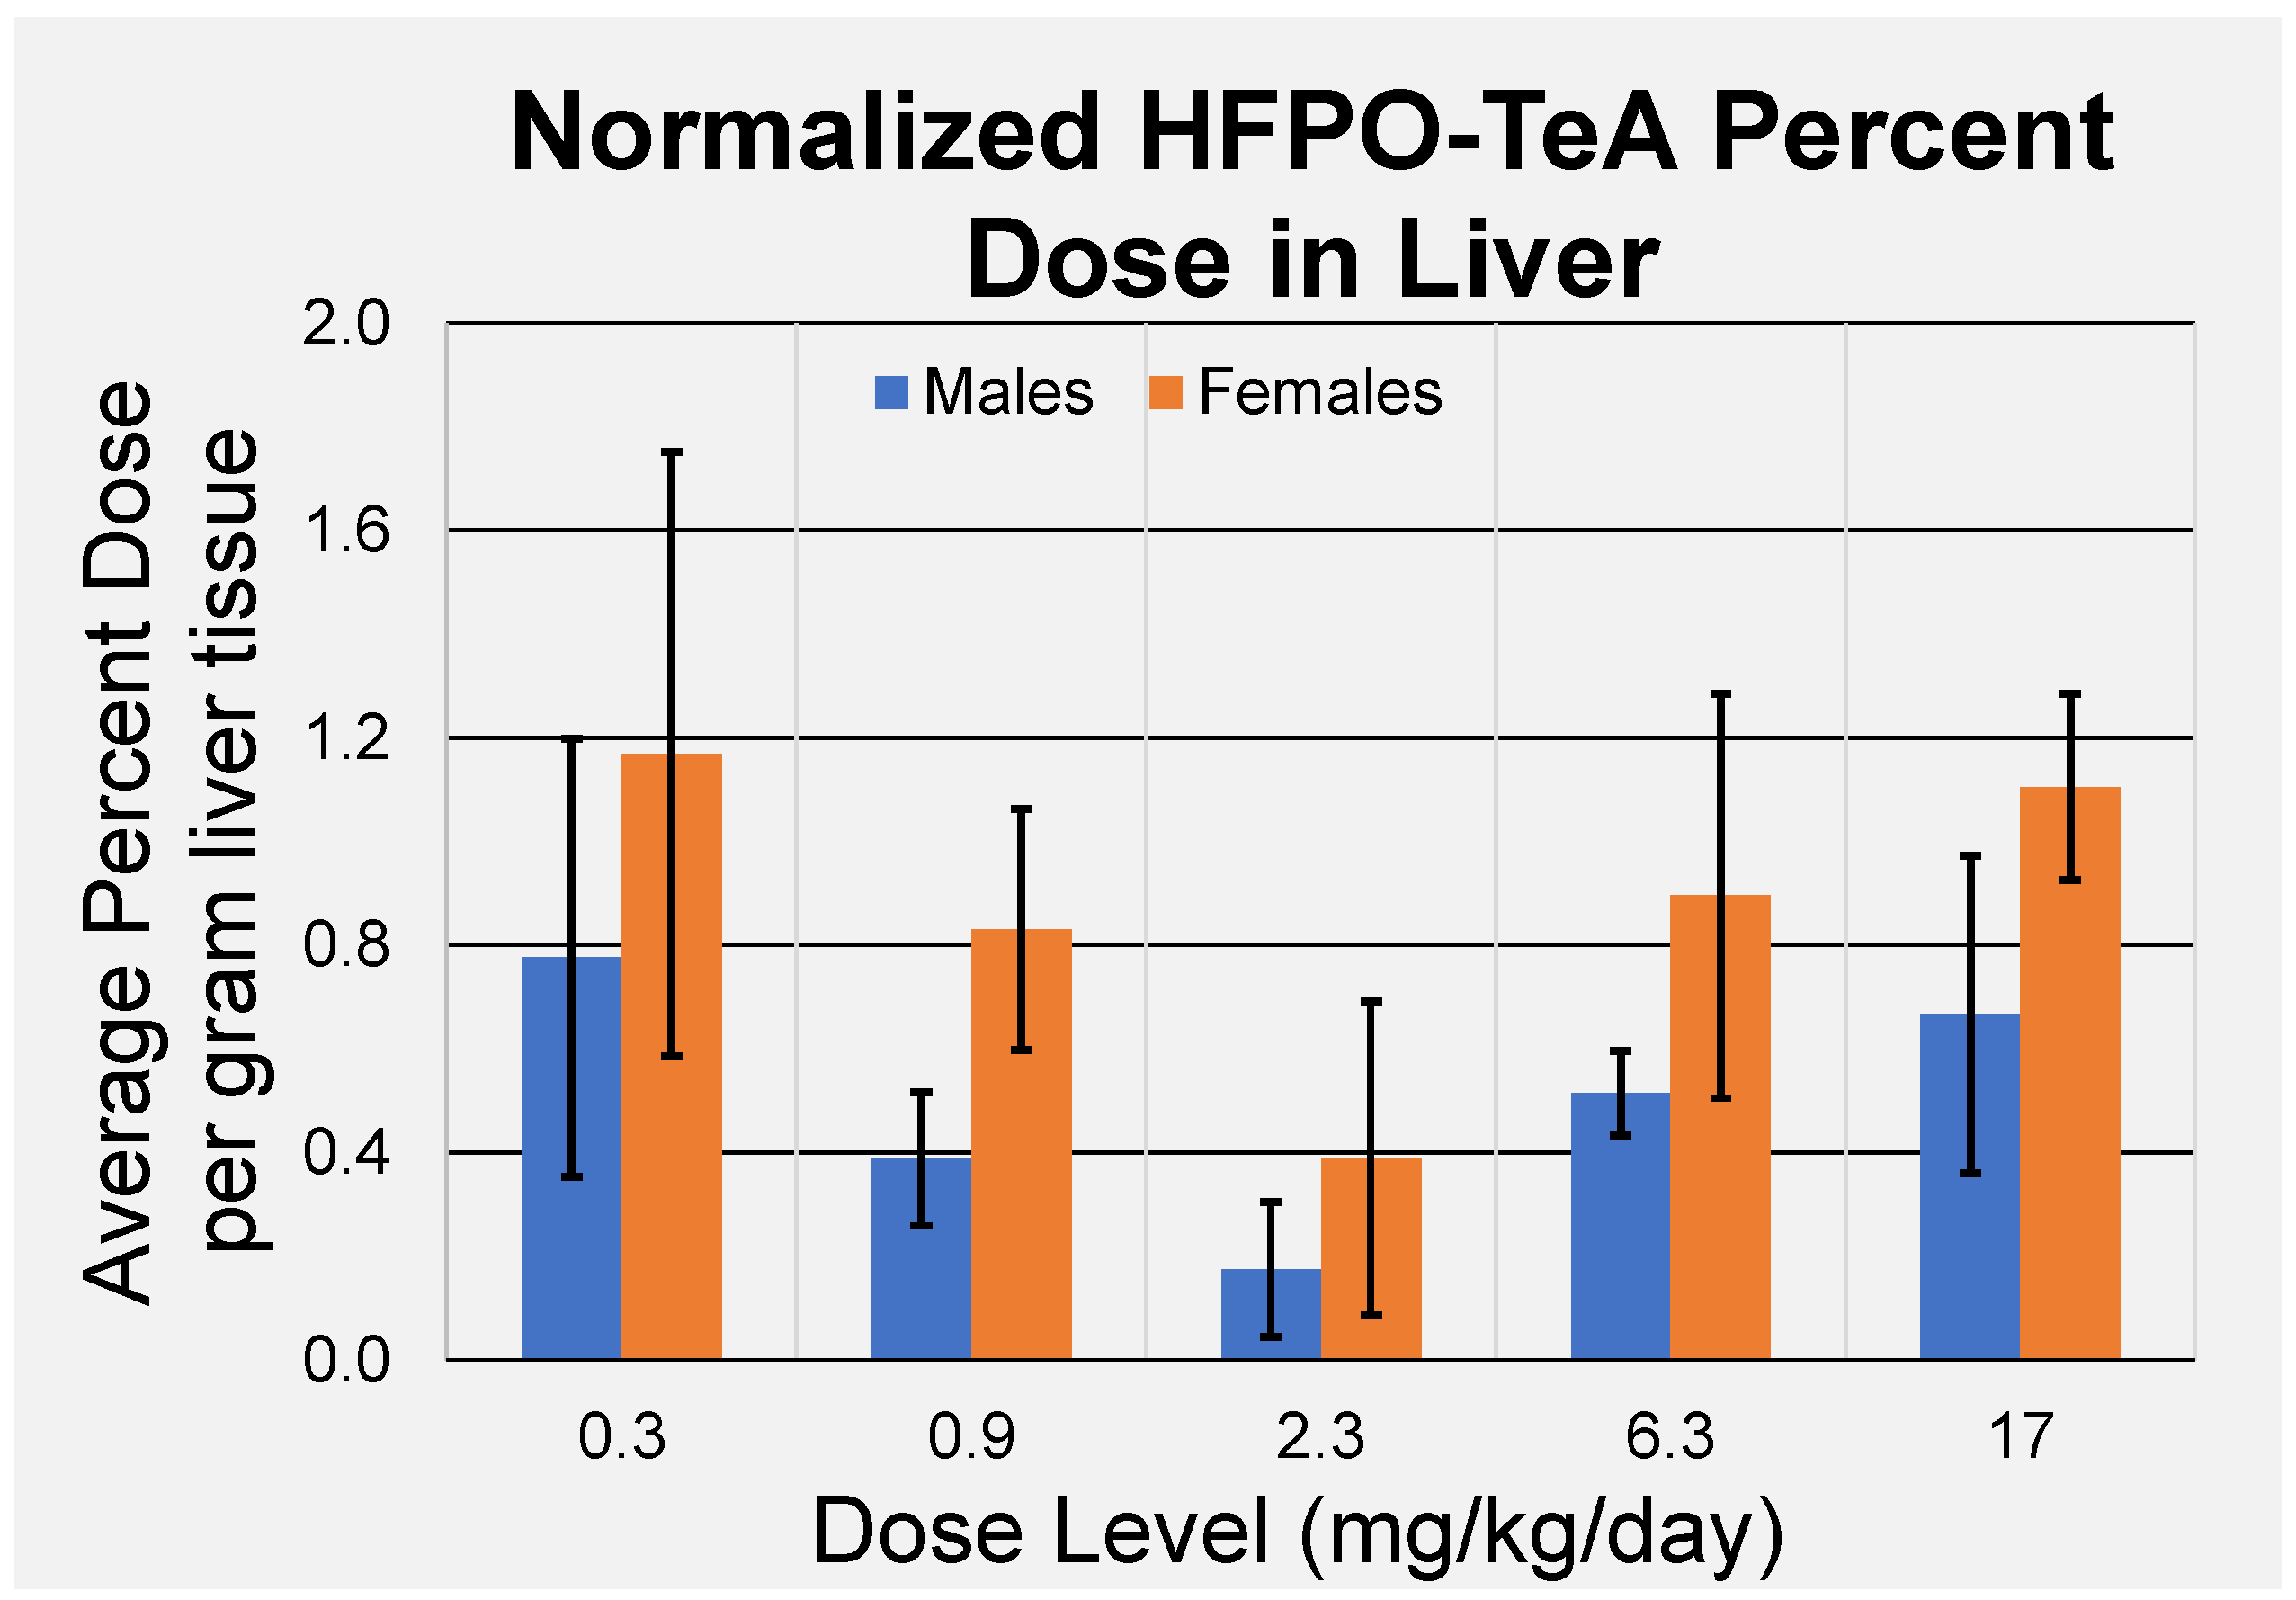
3.1.4. Liver HFPO-TeA Dosimetry
3.2. Non-Targeted Analysis
3.2.1. In Vivo Assays
3.2.2. In Vitro Assays
3.3. In Vitro Toxicokinetics (TK) and In Vitro–In Vivo Extrapolation (IVIVE)
4. Discussion
5. Conclusions
Supplementary Materials
Author Contributions
Funding
Institutional Review Board Statement
Data Availability Statement
Acknowledgments
Conflicts of Interest
References
- OCED/UNEP. Synthesis Paper of per and Poly Fluorinated Chemicals (PFC); Organisation for Economic Cooperation and Development and United Nations Environmental Program Global PFC Group: Paris, France, 2013. [Google Scholar]
- Kurwadkar, S.; Dane, J.; Kanel, S.R.; Nadagouda, M.N.; Cawdrey, R.W.; Ambade, B.; Struckhoff, G.C.; Wilkin, R. Per- and polyfluoroalkyl substances in water and wastewater: A critical review of their global occurrence and distribution. Sci. Total Environ. 2022, 809, 151003. [Google Scholar] [CrossRef]
- Bolan, N.; Sarkar, B.; Vithanage, M.; Singh, G.; Tsang, D.C.W.; Mukhopadhyay, R.; Ramadass, K.; Vinu, A.; Sun, Y.; Ramanayaka, S.; et al. Distribution, behavior, bioavailability and remediation of poly- and per-fluoroalky substances (PFAS) in solid biowastes and biowaste-treated soil. Environ. Int. 2021, 155, 106600. [Google Scholar] [CrossRef] [PubMed]
- Death, C.; Bell, C.; Champness, D.; Milne, C.; Reichman, S.; Hagen, T. Per- and polyfluoroalkyl substances (PFAS) in livestock and game species: A review. Sci. Total Environ. 2021, 774, 144795. [Google Scholar] [CrossRef] [PubMed]
- Jian, J.-M.; Guo, Y.; Zeng, L.; Liang-Yang, L.; Lu, X.; Wang, F.; Zeng, E.Y. Global distribution of perfluorochemicals (PFCs) in potential human exposure source—A review. Environ. Int. 2017, 108, 51–62. [Google Scholar] [CrossRef] [PubMed]
- USEPA. EPA and 3M Announce Phase out of PFOS. Available online: https://www.epa.gov/archive/epapages/newsroom_archive/newsreleases/33aa946e6cb11f35852568e1005246b4.html (accessed on 4 August 2023).
- Rutherford, D. 3M to Share Record on PFAS with House Oversight Subcommittee. Available online: https://pfas.3m.com/3M-to-share-record-on-PFAS-with-House-Oversight-Subcommittee (accessed on 4 August 2023).
- All POPs Listed in the Stockholm Convention. Available online: http://chm.pops.int/TheConvention/ThePOPs/AllPOPs/tabid/2509/Default.aspx (accessed on 1 May 2023).
- Brase, R.A.; Mullin, E.J.; Spink, D.C. Legacy and Emerging Per- and Polyfluoroalkyl Substances: Analytical Techniques, Environmental Fate, and Health Effects. Int. J. Mol. Sci. 2021, 22, 995. [Google Scholar] [CrossRef]
- Parsons, J.R.; Sáez, M.; Dolfing, J.; de Voogt, P. Biodegegradation of Perfluorinated Compounds. In Reviews of Environmental Contamination and Toxicology; Whitacre, D., Ed.; Springer: New York, NY, USA, 2008; Volume 196, pp. 53–71. [Google Scholar]
- Strynar, M.; Dagnino, S.; McMahen, R.; Liang, S.; Lindstrom, A.; Andersen, E.; McMillan, L.; Thurman, M.; Ferrer, I.; Ball, C. Identification of Novel Perfluoroalkyl Ether Carboxylic Acids (PFECAs) and Sulfnoic Acids (PFESAs) in Natural Waters Using Accurate Mass Time-of-Flight Mass Spectrometry (TOFMS). Environ. Sci. Technol. 2015, 49, 11622–11630. [Google Scholar] [CrossRef]
- Peng, B.-X.; Li, F.; Mortimer, M.; Xiao, X.; Ni, Y.; Lei, Y.; Li, M.; Guo, L.-H. Perfluorooctanoic acid alternatives hexafluoropropylene oxides exert male reproductive toxicity by disrupting blood-testis barrier. Sci. Total Environ. 2022, 846, 157313. [Google Scholar] [CrossRef] [PubMed]
- USEPA. Comptox Chemicals Dashboard: Ammonium Perfluoro-2-methyl-3-oxahexanoate. Available online: https://comptox.epa.gov/dashboard/chemical/details/DTXSID40108559 (accessed on 4 August 2023).
- Li, J.; He, J.; Niu, Z.; Zhang, Y. Legacy per- and polyfluoroalkyl substances (PFAS) and alternatives (short-chain analogues, F-53B, GenX and FC-98) in residential soils of China: Present implications of replacing legacy PFAS. Environ. Int. 2020, 135, 105419. [Google Scholar] [CrossRef]
- Galloway, J.E.; Moreno, A.V.P.; Lindstrom, A.B.; Strynar, M.J.; Newton, S.; May, A.A.; Weavers, L.K. Evidence of Air Dispersion: HFPO-Da and FPOA in Ohio and West Virginia Water and Soil near a Fluoropolymer Production Facility. Environ. Sci. Technol. 2020, 54, 7175–7184. [Google Scholar] [CrossRef]
- Brandsma, S.H.; Koekkoek, J.C.; van Velzen, M.J.M.; de Boer, J. The PFOA substitute GenX detected in the environment near a fluoropolymer maufacturing plant in the Netherlands. Chemosphere 2019, 220, 493–500. [Google Scholar] [CrossRef]
- Pan, Y.; Zhang, H.; Cui, Q.; Sheng, N.; Yeung, L.W.Y.; Sun, Y.; Guo, Y.; Dai, J. Worldwide Distribution of Novel Perfluoroether Carboxylic and Sulfonic Acids in Surface Water. Environ. Sci. Technol. 2018, 52, 7621–7629. [Google Scholar] [CrossRef] [PubMed]
- Zhou, J.; Zhao, G.; Li, M.; Li, J.; Liang, X.; Yang, X.; Guo, J.; Wang, T.; Zhu, L. Three-dimensional spatial distribution of legacy and novel poly/perfluoroalkyl substances in the Tibetan Plateau soil: Implications for transport and sources. Environ. Int. 2022, 158, 107007. [Google Scholar] [CrossRef]
- Shen, L.; Zhou, J.; Liang, X.; Qin, L.; Wang, T.; Zhu, L. Different Sources, Fractionation, and Migration of Legacy and Novel Per- and Polyfluoroalkyl Substances between Greenhouse and Open-Field Soils. Environ. Sci. Technol. 2023, 57, 1670–1679. [Google Scholar] [CrossRef]
- Li, Y.; Yao, J.; Zhang, J.; Pan, Y.; Dai, J.; Ji, C.; Tang, J. First Report on the Bioaccumulation and Trophic transfer of Perfluoroalkyl Ether Carboxylic Acids in Estuarine Food Web. Environ. Sci. Technol. 2022, 56, 6046–6055. [Google Scholar] [CrossRef]
- Meng, L.; Song, B.; Lu, Y.; Lv, K.; Gao, W.; Wang, Y.; Jiang, G. The occurrence of per- and polyfluoroalkyl substances (PFAS) in fluoropolymer raw materials and products made in China. J. Environ. Sci. 2021, 107, 77–86. [Google Scholar] [CrossRef] [PubMed]
- Song, X.; Vestergren, R.; Shi, Y.; Huang, J.; Cai, Y. Emissions, Transport, and Fate of Emerging Per- and Polyfluoroalkyl Substances from One of the Major Fluoropolymer Manufacturing Facilities in China. Environ. Sci. Technol. 2018, 52, 9694–9703. [Google Scholar] [CrossRef] [PubMed]
- Son, H.-Y.; Kim, S.-H.; Shin, H.-I.; Bae, H.I.; Yang, J.-H. Perfluorooctanoic acid-induced hepatic toxicity following 21-day exposure in mice. Arch. Toxicol. 2008, 82, 239–246. [Google Scholar] [CrossRef]
- Wang, Z.; Zhang, T.; Wu, J.; Wei, X.; Xu, A.; Wang, S.; Wang, Z. Male reproductive toxicity of perfluorooctanoate (PFOA): Rodent studies. Chemosphere 2021, 270, 128608. [Google Scholar] [CrossRef]
- Bartell, S.M.; Vieira, V.M. Critical review on PFOA, kidney cancer, and testicular cancer. J. Air Waste Manag. Assoc. 2021, 71, 663–679. [Google Scholar] [CrossRef]
- Dewitt, J.C.; Shnyra, A.; Badr, M.Z.; Loveless, S.E.; Hoban, D.; Frame, S.R.; Cunard, R.; Anderson, S.E.; Meade, J.B.; Peden-Adams, M.M.; et al. Immunotoxicity of Perfluorooctanoic Acid and Perfluorooctane Sulfonate and the Role of Peroxisome Proliferator-Activated Receptor Alpha. Crit. Rev. Toxicol. 2009, 39, 76–94. [Google Scholar] [CrossRef]
- U.S. Environmental Protection Agency, Office of Water, Health and Ecological Criteria Division. Human Health Toxicity Values for Hexafluoropropylene Oxide (HFPO) Dimer Acid and Its Ammonium Salt (CASRN 13252-13-6 and 62037-80-3) also Known as “GenX Chemicals”. Available online: https://www.epa.gov/system/files/documents/2022-06/drinking-water-genx-2022.pdf (accessed on 27 April 2023).
- Sheng, N.; Pan, Y.; Guo, Y.; Sun, Y.; Dai, J. Hepatotoxic Effects of Hexafluoropropylene Oxide Trimer Acid (HFPO-TA), A Novel Perfluorooctanoic Acid (PFOA) Alternative, on Mice. Environ. Sci. Technol. 2018, 52, 8005–8015. [Google Scholar] [CrossRef]
- Sun, S.; Zhang, L.; Li, X.; Zhang, L.; Huang, L.; Zeng, J.; Cao, Z.; Liao, X.; Zhong, Z.; Lu, H. Hexafluoropropylene oxide trimer acid, a perfluorooctanoic acid alternative, induces cardiovascular toxicity in zebrafish embryos. J. Environ. Sci. 2023, 139, 460–472. [Google Scholar] [CrossRef]
- Dong, Q.; Guo, Y.; Yuan, J.; Zhong, S.; Ni, H.; Liu, J.; Zhang, M.; Sun, J.; Yuan, S.; Yu, H.; et al. Hexafluoropropylene oxide tetramer acid (HFPO-TeA)-induced developmental toxicities in chicken embryo: Peroxisome proliferator-activated receptor Alpha (PPARα) is involved. Ecotoxicol. Environ. Saf. 2023, 253, 114671–114681. [Google Scholar] [CrossRef] [PubMed]
- Wang, J.; Wang, X.; Sheng, N.; Zhou, X.; Cui, R.; Zhang, H.; Dai, J. RNA-sequencing analysis reveals the hepatotoxic mechanism of perfluoroalkyl alternatives, HFPO2 and HFPO4, following exposure in mice. J. Appl. Toxicol. 2017, 37, 436–444. [Google Scholar] [CrossRef]
- Jia, Y.; Zhu, Y.; Xu, D.; Feng, X.; Yu, X.; Shan, G.; Zhu, L. Insights into the Competitive Mechanisms of Per- and Polyfluoroalkyl Substances Partition in Liver and Blood. Environ. Sci. Technol. 2022, 56, 6192–6200. [Google Scholar] [CrossRef]
- Xin, Y.; Ren, X.-M.; Wan, B.; Guo, L.-H. Comparative in Vitro and in Vivo Evaluation of the Estrogenic Effect of Hexafluoropropylene Oxide Homologues. Environ. Sci. Technol. 2019, 53, 8371–8380. [Google Scholar] [CrossRef] [PubMed]
- Sheng, N.; Cui, R.; Wang, J.; Guo, Y.; Wang, J.; Dai, J. Cytotoxicity of novel fluorinated alternatives to long-chain perfluoroalkyl substances to human liver cell line and their binding capacity to human liver fatty acid binding protein. Arch. Toxicol. 2018, 92, 359–369. [Google Scholar] [CrossRef] [PubMed]
- Zhang, C.; McElroy, A.C.; Liberatore, H.K.; Alexander, N.L.M.; Knappe, D.R.U. Stability of Per- and Polyfluoroalkyl Substances in Solvents Relevant to Environmental and Toxicological Analysis. Environ. Sci. Technol. 2022, 56, 6103–6112. [Google Scholar] [CrossRef]
- Liberatore, H.K.; Jackson, S.R.; Strynar, M.J.; McCord, J.P. Solvent Suitability for HFPO-DA (“GenX” Parent Acid) in Toxicological Studies. Environ. Sci. Technol. Lett. 2020, 7, 477–481. [Google Scholar] [CrossRef]
- Smeltz, M.G.; Wambaugh, J.F.; Wetmore, B.A. Plasma Protein Binding Evaluations of Per- and Polyfluoroalkyl Substances for Category-Based Toxicokinetic Assessment. Chem. Res. Toxicol. 2023, 36, 870–881. [Google Scholar] [CrossRef]
- Costello, E.; Rock, S.; Stratakis, N.; Eckel, S.P.; Walker, D.I.; Valvi, D.; Cserbik, D.; Jenkins, T.; Xanthakos, S.A.; Kohli, R.; et al. Exposure to per-and Polyfluoroalkyl Substances and Markers of Liver Injury: A Systematic Review and Meta-Analysis. Environ. Health Perspect. 2022, 130, 46001. [Google Scholar] [CrossRef]
- Committee for the Update of the Guide for the Care and Use of Laboratory Animals; Institute for Laboratory Aniimal Research; National Research Council of the National Academies. Guide for the Care and Use of Laboratory Animals, 8th ed.; The National Academies Press: Washington, DC, USA, 2011. [Google Scholar]
- Gwinn, W.M.; Auerbach, S.S.; Parham, F.; Stout, M.D.; Waidyanatha, S.; Mutlu, E.; Collins, B.; Paules, R.S.; Merrick, B.A.; Ferguson, S.S.; et al. Evaluation of 5-day In Vivo Rat Liver and Kidney With High-throughput Transcriptomics for Estimating Benchmark Doses of Apical Outcomes. Toxicol. Sci. 2020, 176, 343–354. [Google Scholar] [CrossRef]
- Thomas, R.S.; Wesselkamper, S.C.; Wang, N.C.Y.; Zhao, Q.J.; Petersen, D.D.; Lambert, J.C.; Cote, I.; Yang, L.; Healy, E.; Black, M.B.; et al. Temporal Concordance Between Apical and Transcriptomic Points of Depature for Chemical Risk Assessment. Toxicol. Sci. 2013, 134, 180–194. [Google Scholar] [CrossRef]
- NTP Research Report on National Toxicology Program Approach to Genomic Dose-Response Modeling; NIEHS: Durham, NC, USA, 2018.
- Slob, W.; Moerbeek, M.; Rauniomaa, E.; Piersma, A.H. A Statistical Evaluation of Toxicity Study Designs for the Estimation of the Benchmark Dose in Continuous Endpoints. Toxicol. Sci. 2005, 84, 167–185. [Google Scholar] [CrossRef]
- Caverly Rae, J.M.; Craig, L.; Slone, T.W.; Frame, S.R.; Buxton, L.W.; Kennedy, G.L. Evaluation of chronic toxicity and carcinogenicity of ammonium 2,3,3,3-tetrafluoro-2-(heptafluoropropoxy)-propanoate in Sprague-Daley rats. Toxicol. Rep. 2015, 2, 939–949. [Google Scholar] [CrossRef]
- Conley, J.M.; Lambright, C.S.; Evans, N.; Strynar, M.J.; McCord, J.; McIntyre, B.S.; Travlos, G.S.; Cardon, M.C.; Medlock-Kakaley, E.; Hartig, P.C.; et al. Adverse Maternal, Fetal, and Postnatal Effects of Hexafluoropropylene Oxide Dimer Acid (GenX) from Oral Gestational Exposure in Sprague-Dawley Rats. Environ. Health Perspect. 2019, 127, 37008. [Google Scholar] [CrossRef]
- O’Shaughnessy, K.L.; Kosian, P.A.; Ford, J.L.; Oshiro, W.M.; Degitxz, S.J.; Gilbert, M.E. Developmental Thyroid Hormone Insufficiency Induces a Cortical Brain Malformation and Learning Impairments: A Cross-Fostering Study. Toxicol. Sci. 2018, 163, 101–115. [Google Scholar] [CrossRef]
- Probst, R.J.; Lim, J.M.; Bird, D.N.; Pole, G.L.; Sato, A.K.; Claybaugh, J.R. Gender Differences in the Blood Volume of Conscious Sprague-Dawley Rats. J. Am. Assoc. Lab. Anim. Sci. 2006, 45, 49–52. [Google Scholar] [PubMed]
- Trudnowski, R.J.; Rodolfo, R.C. Specific Gravity of Blood and Plasma at 4 and 37 °C. Clin. Chem. 1974, 20, 615–616. [Google Scholar] [CrossRef] [PubMed]
- Conley, J.M.; Lambright, C.S.; Evans, N.; Medlock-Kakaley, E.; Hill, D.; McCord, J.; Strynar, M.J.; Wehmas, L.C.; Hester, S.; MacMillan, D.K.; et al. Developmental toxicity of Nafion byproduct 2 (NBP2) in the Sprague-Dawley rat with comparisons to hexafluoropropylene-dimer acid (HFPO-DA or GenX) and perfluorooctane sulfonate (PFOS). Environ. Int. 2022, 160, 107056. [Google Scholar] [CrossRef] [PubMed]
- Kim, S.-J.; Heo, S.-H.; Lee, D.-S.; Hwang, I.G.; Lee, Y.-B.; Cho, H.-Y. Gender differences in pharmacokinetics and tissue distribution of 3 perfluoroalkyl and polyfluoroalkyl substances in rats. Food Chem. Toxicol. 2019, 97, 243–255. [Google Scholar] [CrossRef]
- Yi, S.; Yang, D.; Zhu, L.; Mabury, S.A. Significant Reductive Transformation of 6:2 Chlorinated Polyfluorooctane Ether Sulfonate to Form Hydrogen-Substituted Polyfluorooctane Ether Sulfonate and Their Toxicokinetics in Male Sprague-Dawley Rats. Environ. Sci. Technol. 2022, 56, 6123–6132. [Google Scholar] [CrossRef] [PubMed]
- Lambert, J.-P.; Ivosev, G.; Couzens, A.L.; Larsen, B.; Taipale, M.; Lin, Z.-Y.; Zhong, Q.; Lindquist, S.; Vidal, M.; Aebersold, R.; et al. Mapping differential interactomes by affinity purification coupled with data independent mass spectrometry acquisition. Nat. Methods 2013, 10, 1239–1245. [Google Scholar] [CrossRef] [PubMed]
- Weber, E.J.; Tebes-Stevens, C.; Washington, J.W.; Gladstone, R. Development of a PFAS reaction library: Identifying plausible transformation pathways in environmental and biological systems. Environ. Sci. Process. Impacts 2022, 24, 689–753. [Google Scholar] [CrossRef] [PubMed]
- Djoumbou-Feunang, Y.; Gil-de-la-Fuente, A.; Greiner, R.; Manach, C.; Wishart, D.S. Biotransformer: A comprehensive computational tool for small molecule metabolism prediction and metabolite identification. J. Cheminformatics 2019, 11, 2. [Google Scholar] [CrossRef] [PubMed]
- Ruttkies, C.; Schymanski, E.L.; Wolf, S.; Hollender, J.; Neumann, S. MetFrag relaunched: Incorporating strategies beyond in silico fragmentation. J. Cheminformatics 2016, 8, 3. [Google Scholar] [CrossRef] [PubMed]
- Wetmore, B.A.; Wambaugh, J.F.; Ferguson, S.S.; Sochaski, M.A.; Rotroff, D.M.; Freeman, K.; Clewell, H.J., III; Dix, D.J.; Andersen, M.E.; Houck, K.A.; et al. Integration of Dosimetry, Exposure, and High-Throughput Screening Data in Chemical Toxicity Assessment. Toxicol. Sci. 2012, 125, 157–174. [Google Scholar] [CrossRef]
- Yao, J.; Sheng, N.; Guo, Y.; Yeung, L.W.Y.; Dai, J.; Pan, Y. Nontargeted Identification and Temporal Trends of Per- and Polyfluoroalkyl Substances in a Fluorochemical Industrial Zone and Adjacent Taihu Lake. Environ. Sci. Technol. 2022, 56, 7986–7996. [Google Scholar] [CrossRef]
- Wetmore, B.A. Quantitative in vitro-to-in vivo extrapolation in a high-throughput environment. Toxicology 2015, 332, 94–101. [Google Scholar] [CrossRef] [PubMed]
- Wilkinson, G.R.; Shand, D.G. A physiological approach to hepatic drug clearance. Clin. Pharmacol. Ther. 1975, 18, 377–390. [Google Scholar] [CrossRef]
- USEPA. Benchmark Dose Tools (BMDS) Online. Available online: https://bmdsonline.epa.gov/ (accessed on 18 December 2022).
- Schymanski, E.L.; Jeon, J.; Gulde, R.; Fenner, K.; Ruff, M.; Singer, H.P.; Hollender, J. Identifying Small Molecules via High Resolution Mass Spectrometry: Communicating Confidence. Environ. Sci. Technol. 2014, 48, 2097–2098. [Google Scholar] [CrossRef]
- Cui, L.; Zhou, Q.-F.; Liao, C.-Y.; Fu, J.-J.; Jiang, G.-B. Studies on the Toxicological Effects of PFOA and PFOS on Rats Using Histological Observation and Chemical Analysis. Arch. Environ. Contam. Toxicol. 2009, 56, 338–349. [Google Scholar] [CrossRef]
- Loveless, S.E.; Finlay, C.; Everds, N.E.; Frame, S.R.; Gillies, P.J.; O’Connor, J.C.; Powley, C.R.; Kennedy, G.L. Comparative responses of rats and mice exposed to linear/branched, linear, or branched ammonium perfluorooctanoate (APFO). Toxicology 2006, 220, 203–217. [Google Scholar] [CrossRef] [PubMed]
- Das, K.P.; Wood, C.R.; Lin, M.T.; Starkov, A.A.; Lau, C.; Wallace, K.B.; Corton, J.C.; Abbott, B.D. Perfluoroalkyl acids-induced liver steatosis: Effects on genes controlling lipid homeostasis. Toxicology 2017, 378, 37–52. [Google Scholar] [CrossRef]
- Conley, J.M.; Lambright, C.S.; Evans, N.; Medlock-Kakaley, E.; Dixon, A.; Hill, D.; McCord, J.; Strynar, M.; Ford, J.L.; Gray, L.E., Jr. Cumulative maternal and neonatal effects of combined exposure to a mixture of perfluorooctanoic acid (PFOA) and perfluorooctane sulfonic acid (PFOS) during pregnancy in the Sprague-Dawley rat. Environ. Int. 2022, 170, 107631. [Google Scholar] [CrossRef] [PubMed]
- Forthun, I.H.; Roelants, M.; Haug, L.S.; Knutsen, H.K.; Schell, L.M.; Jugessur, A.; Bjerknes, R.; Sabaredzovic, A.; Bruserud, I.S.; Juliusson, P.B. Levels of per- and polyfluoroalkyl substances (PFAS) in Norwegian children stratified by age and sex—Data from the Bergen Growth Study 2. Int. J. Hyg. Environ. Health 2023, 252, 114199. [Google Scholar] [CrossRef] [PubMed]
- Sen, P.; Qadri, S.; Luukkonen, P.K.; Ragnarsdottir, O.; McGlinchey, A.; Jäntti, S.; Juuti, A.; Arola, J.; Schlezinger, J.L.; Webster, T.F.; et al. Exposure to environmental contaminants is associated with altered hepatic lipid metabolism in non-alcoholic fatty liver disease. J. Hepatol. 2022, 76, 283–293. [Google Scholar] [CrossRef]
- Roth, K.; Yang, Z.; Agarwal, M.; Liu, W.; Peng, Z.; Ze, L.; Birbeck, J.A.; Westrick, J.A.; Liu, W.; Petriello, M.C. Exposure to a mixture of legacy, alternative, and replacement per- and polyfluoroalkyl substances (PFAS) results in sex-dependent modulation of cholesterol metabolism an dliver injury. Environ. Int. 2021, 157, 106843. [Google Scholar] [CrossRef]
- Huang, M.C.; Robinson, V.G.; Waidyanatha, S.; Dzierlenga, A.L.; DeVito, M.J.; Eifrid, M.A.; Gibbs, S.T.; Blystone, C.R. Toxiokinetics of 8:2 fluorotelomer alcohol (8:2-FTOH) in male and female Hsd:Sprague Dawley SD rats after inravenous and gavage administration. Toxicol. Rep. 2019, 6, 924–932. [Google Scholar] [CrossRef]
- Dzierlenga, A.L.; Robinson, V.G.; Waidyanatha, S.; DeVito, M.J.; Eifrid, M.A.; Gibbs, S.T.; Granville, C.A.; Blystone, C.R. Toxicokinetics of perfluorohexanoic acid (PFHxA), perfluorooctanoic acid (PFOA) and perfluorodecanoic acid (PFDA) in male and female Hsd:Sprague Dawley SD rats following intravenous or gavage administration. Xenobiotica 2020, 50, 722–732. [Google Scholar] [CrossRef]
- van der Vusse, G.J. Albumin as Fatty Acid Transporter. Drug Metab. Pharmacokinet. 2009, 24, 300–307. [Google Scholar] [CrossRef] [PubMed]
- Forsthuber, M.; Kaiser, A.M.; Granitzer, S.; Hall, I.; Hengstschläger, M.; Stangl, H.; Gundacker, C. Albumin is the major carrier protein for PFOS, PFOA, PFHxS, PFNA, and PFDA in human plasma. Environ. Int. 2020, 137, 105324. [Google Scholar] [CrossRef]
- Luebker, D.J.; Hansen, K.J.; Bass, N.M.; Butenhoff, J.L.; Seacat, A.M. Interactions of fluorochemicals with rat liver fatty acid-binding protein. Toxicology 2002, 176, 175–185. [Google Scholar] [CrossRef] [PubMed]
- Martin, J.W.; Mabury, S.A.; Solomon, K.R.; Muir, D.C.G. Bioconcentration and tissue distribution of perfluorinated acids in rainbow trout (Oncorhynchus mykiss). Environ. Toxicol. Chem. 2003, 22, 196–204. [Google Scholar] [CrossRef]
- Yu, N.; Wei, S.; Li, M.; Yang, J.; Li, K.; Jin, L.; Xie, Y.; Giesy, J.P.; Zhang, X.; Yu, H. Effects on Perfluorooctanoic Acid on Metabolic Profiles in Brain and Liver of Mouse Revealed by a High-throughput Targeted Metabolomics Approach. Sci. Rep. 2016, 6, 23963. [Google Scholar] [CrossRef] [PubMed]
- Nilsson, H.; Kärrman, A.; Rotander, A.; van Bavel, B.; Lindström, G.; Westberg, H. Biotransformation of fluorotelomer compound to perfluorocarboxylates in humans. Environ. Int. 2013, 51, 8–12. [Google Scholar] [CrossRef]
- Li, Z.-M.; Guo, L.-H.; Ren, X.-M. Biotransformation of 8:2 fluorotelomer alchol by recombinant human cytochrome P450s, human liver icrosomes, and human liver cytosol. Environ. Sci. Process. Impacts 2016, 18, 538–546. [Google Scholar] [CrossRef] [PubMed]
- Butt, C.M.; Muir, D.C.G.; Mabury, S.A. Biotransformation pathways of fluorotelomer-based polyfluoroalkyl substances: A review. Environ. Toxicol. Chem. 2014, 33, 243–267. [Google Scholar] [CrossRef]
- Kolanczyk, R.C.; Saley, M.R.; Serrano, J.A.; Daley, S.M.; Tapper, M.A. PFAS Biotransformation Pathways: A Species Comparison Study. Toxics 2023, 11, 74. [Google Scholar] [CrossRef]
- Berhanu, A.; Mutanda, I.; Taolin, J.; Qaria, M.A.; Yang, B.; Zhu, D. A review of microbial degradation of per- and polyfluoroalkyl substances (PFAS): Biotransformation routes and enzymes. Sci. Total Environ. 2023, 859, 160010. [Google Scholar] [CrossRef]
- Zhang, W.; Pang, S.; Lin, Z.; Mishra, S.; Bhatt, P.; Chen, S. Biotransformation of perfluoroalkyl acid precursors from various environmental systems: Advances and perspectives. Environ. Pollut. 2021, 272, 115908. [Google Scholar] [CrossRef] [PubMed]
- Wang, Y.; Jiang, S.; Wang, B.; CHen, X.; Lu, G. Comparison of developmental toxicity induced by PFOA, HFPO-DA, and HFPO-TA in zebrafish embryos. Chemosphere 2023, 311, 136999. [Google Scholar] [CrossRef] [PubMed]


| Dose Level (mg/kg/Day) | Sex | Body Weight Gain (g) | Absolute Liver Weight (g) | Relative Liver Weight (g%) |
|---|---|---|---|---|
| 0 | M | 31.3 ± 3.3 | 14.5038 ± 0.8279 | 4.577 ± 0.236 |
| 0.3 | M | 37.2 ± 9.0 | 15.2591 ± 1.0017 | 4.702 ± 0.220 |
| 0.9 | M | 39.6 ± 4.3 | 17.1421 ± 0.9748 * | 5.291 ± 0.201 * |
| 2.3 | M | 39.0 ± 4.8 | 19.2324 ± 1.2374 * | 5.916 ± 0.297 * |
| 6.3 | M | 31.8 ± 8.1 | 22.4551 ± 2.6306 * | 6.983 ± 0.527 * |
| 17 | M | −51.5 ± 10.9 * | 13.2446 ± 0.5851 | 5.600 ± 0.223 * |
| 0 | F | 3.7 ± 5.7 | 9.6210 ± 0.7224 | 4.190 ± 0.189 |
| 0.3 | F | 6.5 ± 4.4 | 10.24805 ± 0.2070 | 4.488 ± 0.062 * |
| 0.9 | F | 12.2 ± 4.3 | 11.8882 ± 0.5678 * | 5.086 ± 0.224 * |
| 2.3 | F | 12.3 ± 6.2 | 12.4296 ± 0.3397 * | 5.296 ± 0.073 * |
| 6.3 | F | −17.8 ± 14.3 * | 10.5446 ± 1.6664 | 5.329 ± 0.634 * |
| 17 | F | −55.2 ± 5.7 * | 9.6771 ± 0.3488 | 5.796 ± 0.216 * |
| Dose Level (mg/kg/Day) | Sex | T3 Conc. (ng/mL) | rT3 Conc. (ng/mL) | T4 Conc. (ng/mL) |
|---|---|---|---|---|
| 0 | M | 0.737 ± 0.066 | 0.0510 ± N/A | 39.8 ± 3.6 |
| 0.3 | M | 0.811 ± 0.111 | 0.127 ± N/A | 37.6 ± 10.4 |
| 0.9 | M | 0.723 ± 0.105 | < LOQ | 38.8 ± 5.2 |
| 2.3 | M | 0.678 ± 0.101 | 0.188 ± N/A | 35.8 ± 10.9 |
| 6.3 | M | 0.630 ± 0.060 | 0.0847 ± 0.0257 | 32.9 ± 6.9 |
| 17 | M | 0.423 ± 0.078 * | 0.0630 ± N/A | 9.82 ± 2.94 * |
| 0 | F | 0.870 ± 0.200 | 0.153 ± N/A | 29.7 ± 4.3 |
| 0.3 | F | 0.844 ± 0.106 | 0.143 ± N/A | 31.3 ± 3.5 |
| 0.9 | F | 0.799 ± 0.167 | <LOQ | 26.8 ± 4.2 |
| 2.3 | F | 0.781 ± 0.024 | 0.105 ± 0.012 | 34.9 ± 5.8 |
| 6.3 | F | 0.563 ± 0.162 * | 0.0860 ± N/A | 19.9 ± 7.1 |
| 17 | F | 0.585 ± 0.160 * | 0.0510 ± 0.0042 | 15.9 ± 5.9 * |
| Dose Level (mg/kg/Day) | Sex | 2 h Plasma Conc. (µM) | 5D Plasma Conc. (µM) | 5D Liver Conc. (µM) |
|---|---|---|---|---|
| 0 | M | N/A | N/A | N/A |
| 0.3 | M | 0.150 ± 0.020 | 0.827 ± 0.071 | 6.07 ± 3.40 |
| 0.9 | M | 0.573 ± 0.113 | 2.73 ± 0.45 | 9.06 ± 3.17 |
| 2.3 | M | 13.1 ± 2.8 | 6.64 ± 1.73 | 10.3 ± 7.5 |
| 6.3 | M | 34.0 ± 5.5 | 24.5 ± 2.3 | 82.7 ± 10.5 * |
| 17 | M | 126 ± 62 * | 168 ± 53 * | 210 ± 85 * |
| 0 | F | N/A | N/A | N/A |
| 0.3 | F | 0.137 ± 0.033 | 0.854 ± 0.086 | 6.38 ± 3.14 |
| 0.9 | F | 0.620 ± 0.133 | 3.62 ± 0.91 | 14.0 ± 4.3 |
| 2.3 | F | 15.1 ± 5.3 | 8.92 ± 2.36 | 16.5 ± 12.6 |
| 6.3 | F | 53.2 ± 16.5 | 52.6 ± 14.3 * | 86.8 ± 31.7 * |
| 17 | F | 224 ± 76 * | 278 ± 28 * | 250 ± 39 * |
| Dose (mg/kg/Day) | Liver Kp (M) | Liver Kp (F) |
|---|---|---|
| 0.3 | 7.28 ± 3.71 | 7.81 ± 4.68 |
| 0.9 | 3.38 ± 1.24 | 4.04 ± 1.37 |
| 2.3 | 1.54 ± 0.91 | 1.90 ± 1.47 |
| 6.3 | 3.41 ± 0.60 | 1.65 ± 0.46 |
| 17 | 1.32 ± 0.55 a | 0.903 ± 0.145 |
| Predicted Product | Formula | Monoisotopic Mass, Da | Metabolic Transformation | Reaction Enzyme | Biosystem |
|---|---|---|---|---|---|
| Glycine conjugate | C14H4F23NO6 | 718.9671 | EC-based OR Phase II Transformation | Glycine-N-acyltransferase | Human |
| O-glucuronide | C18H9F23O11 | 837.9777 | EC-based OR Phase II Transformation | UDP-glucuronosyltransferase | Human And Human Gut Microbial |
| Carnitine conjugate | C19H14F23NO7 | 805.0403 | EC-based OR Phase II Transformation | Carnitine-O-acetyltransferase | Human |
| Ion (m/z) | Matrix | TOF MS/MS Fragments (m/z) | TOF MS/MS Fragment Proposed Molecular Formula | Relative Retention Time (min) * |
|---|---|---|---|---|
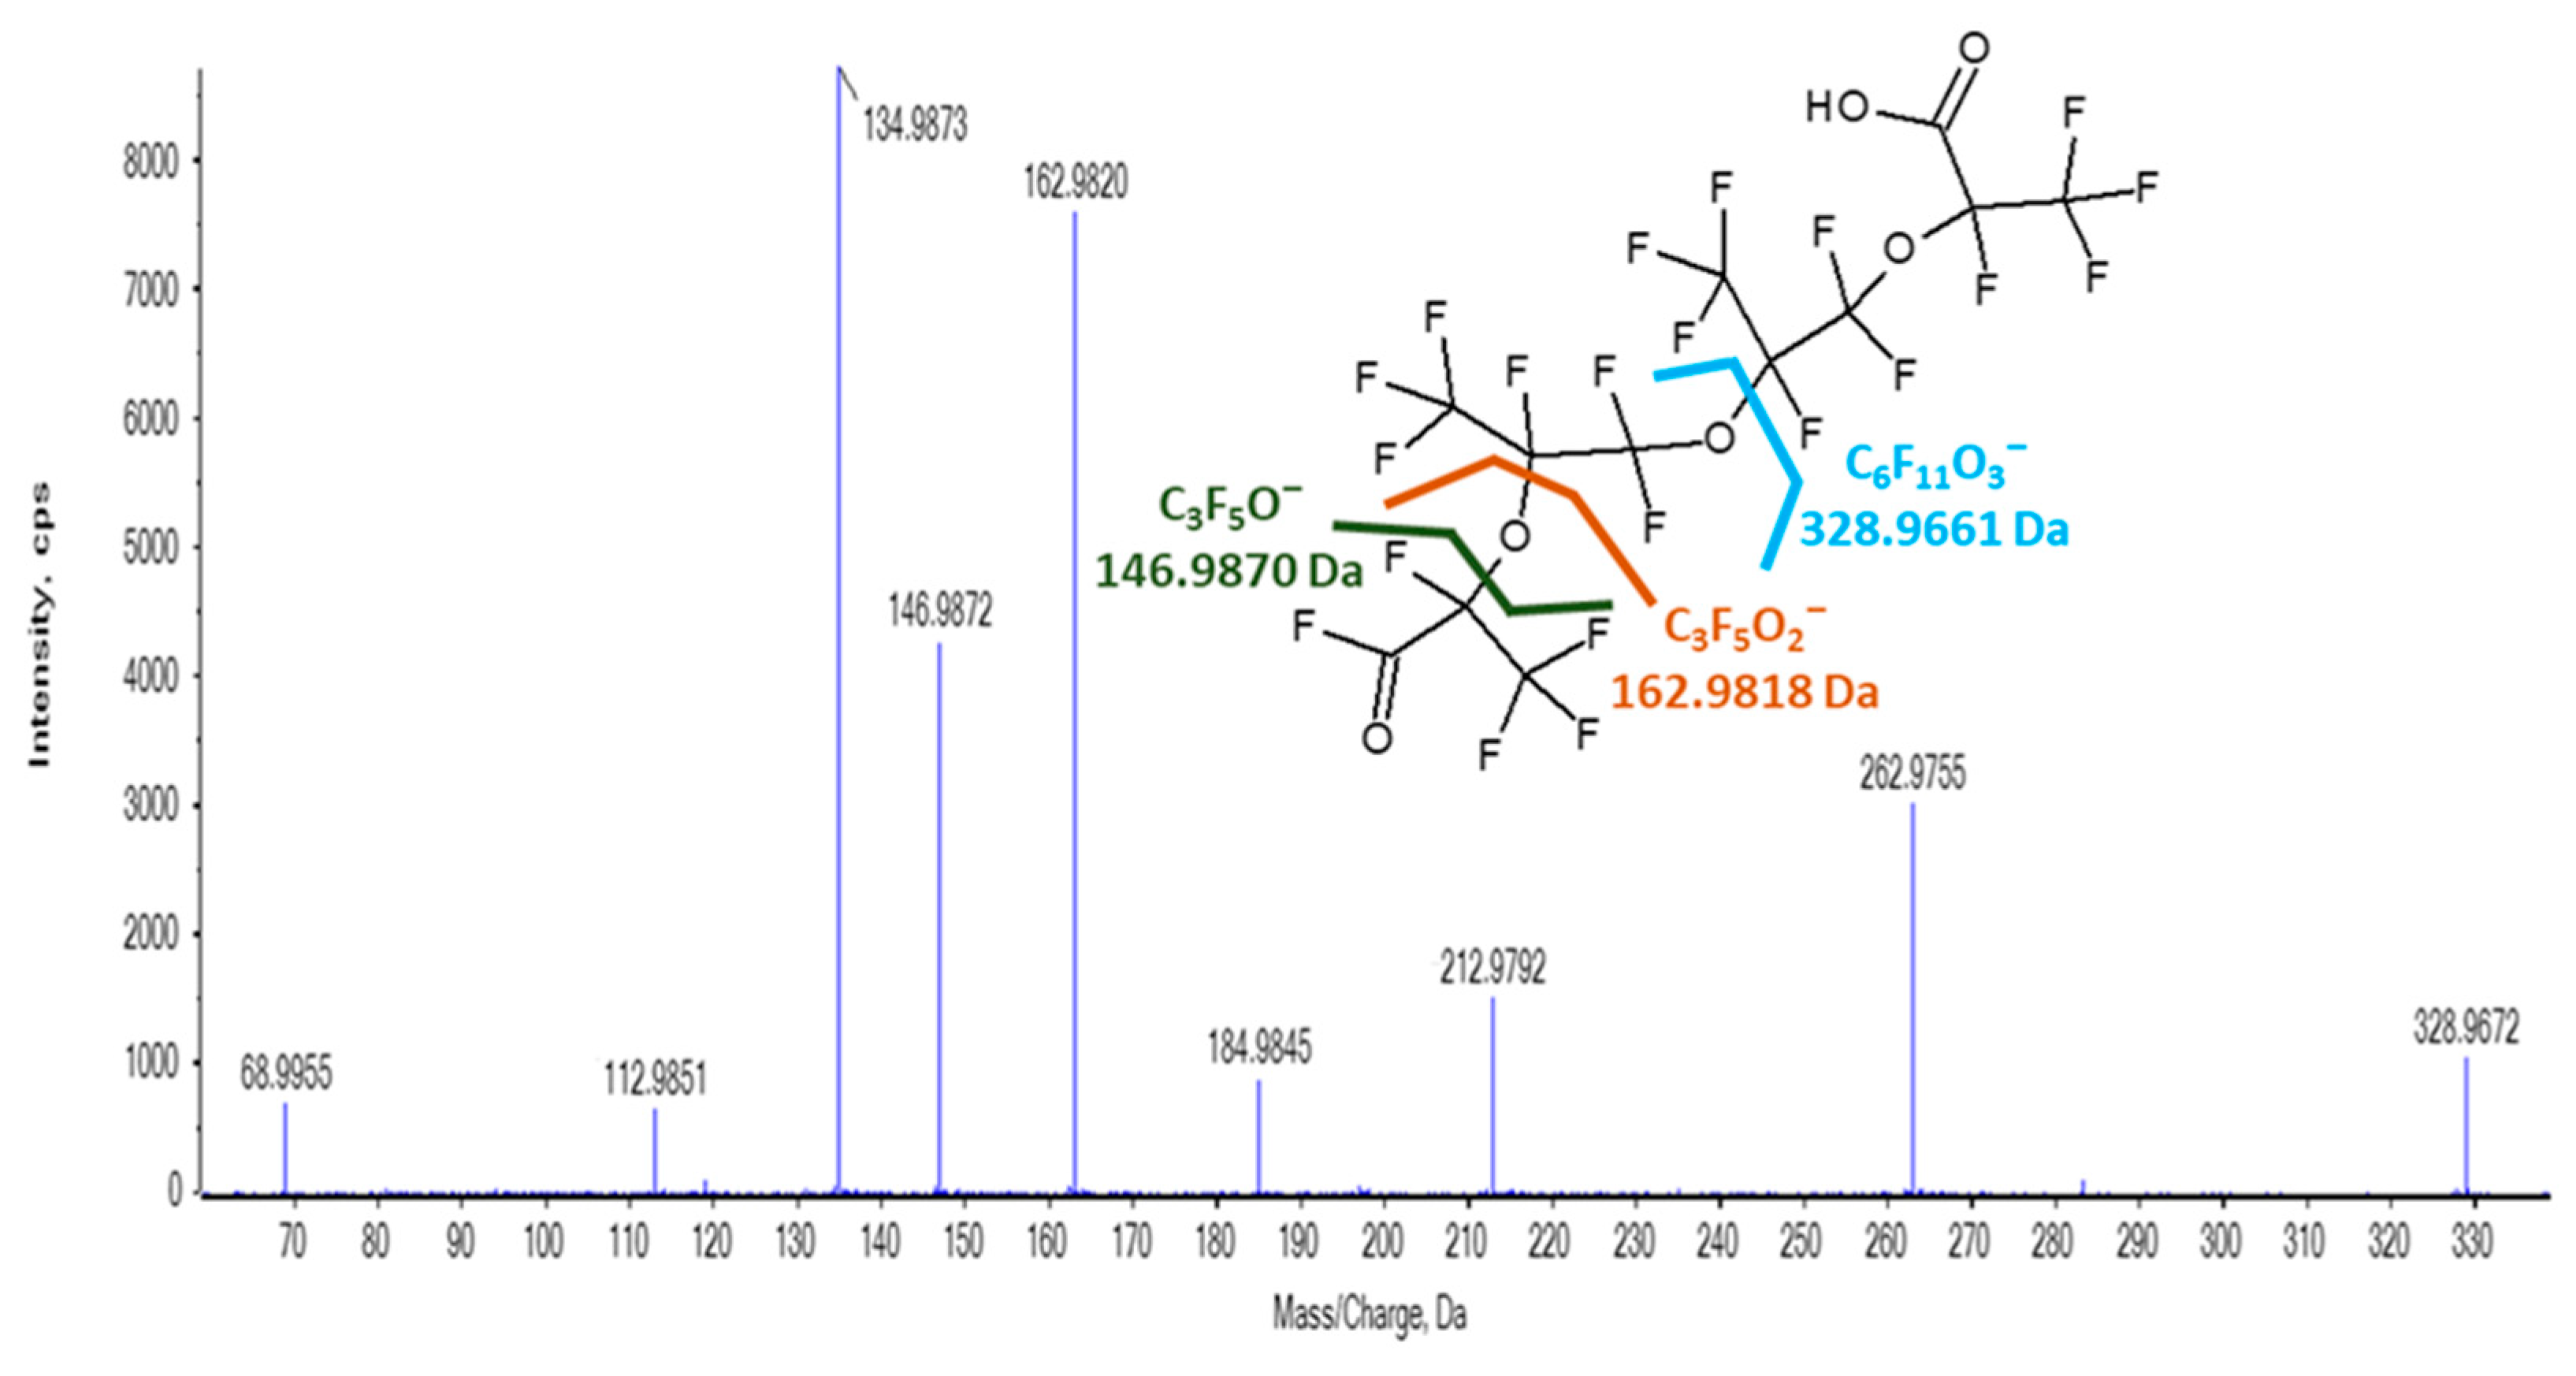
| 328.9661 | Plasma and Liver | 68.995 | CF3− | 0.98 |
| 112.9852 | C2F3O2− | |||
| 134.9869 | C2F5O− | |||
| 146.9870 | C3F5O− | |||
| 162.9818 | C3F5O2− | |||
| 184.9835 | C3F7O− | |||
| 212.9787 | C4F7O2− | |||
| 262.9750 | C5F9O2− | |||
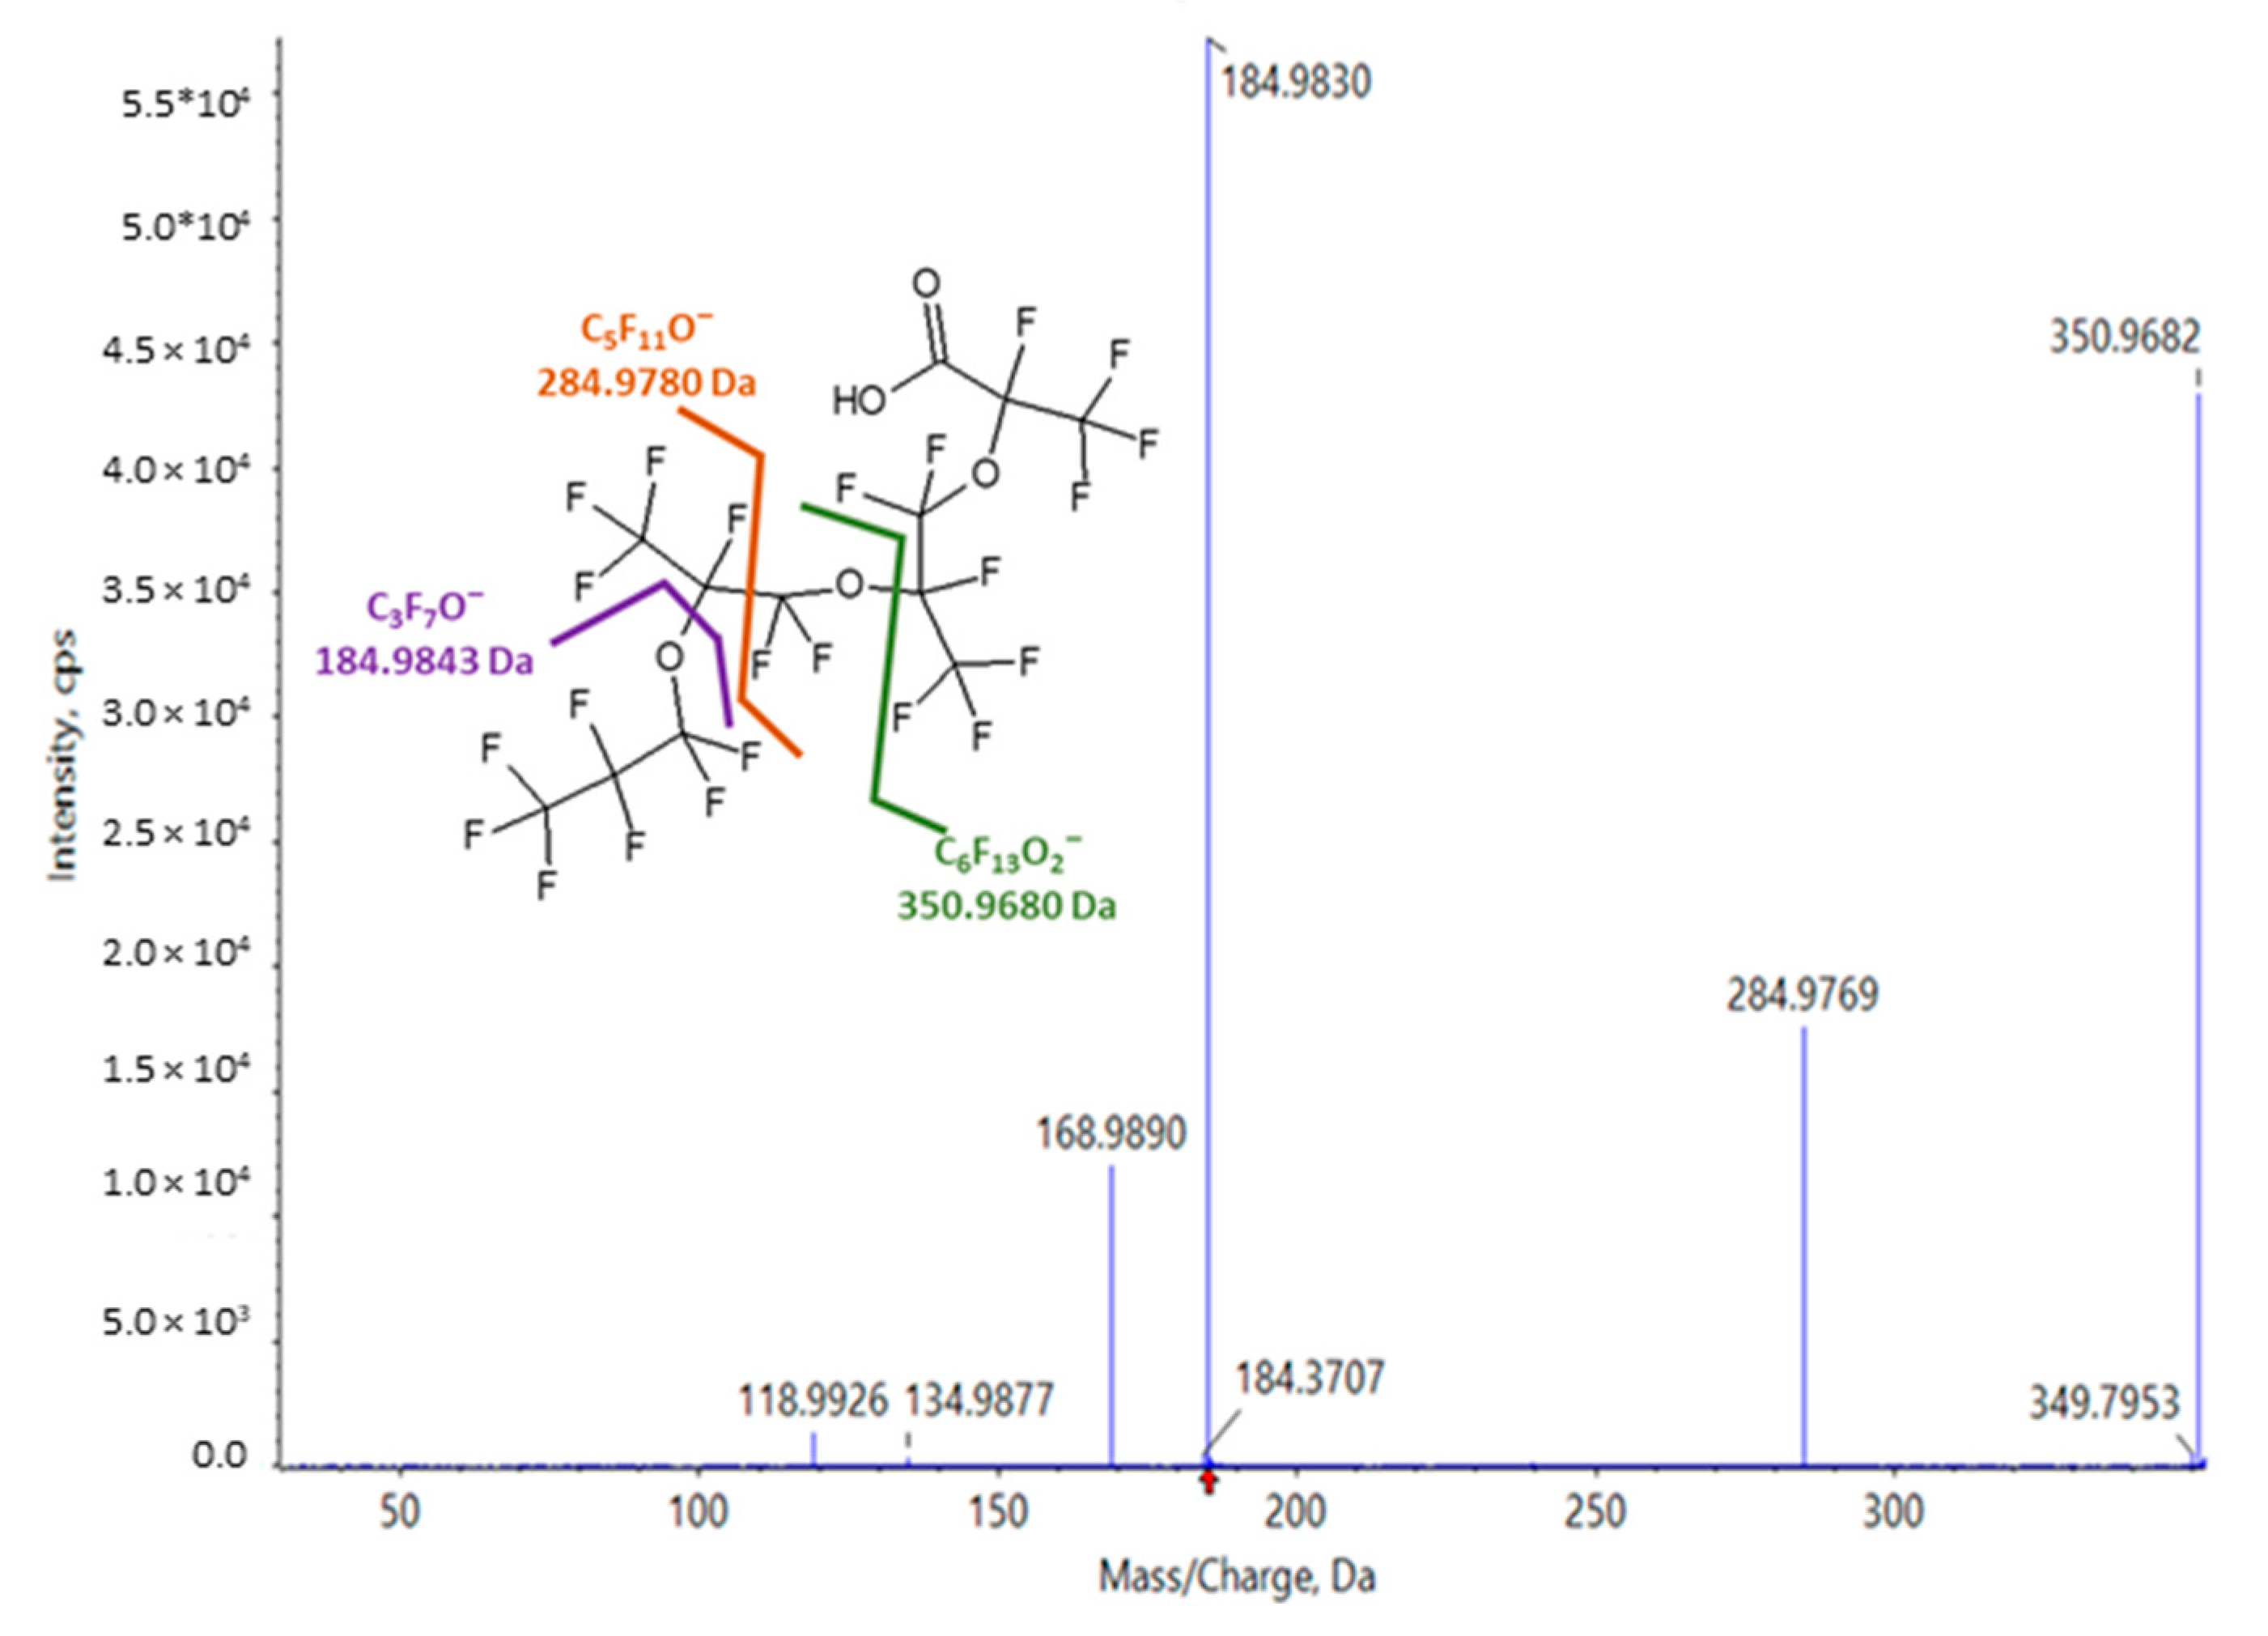
| 350.9680 | Plasma and Liver | 118.9921 | C2F5− | 1.00 |
| 134.9876 | C2F5O− | |||
| 168.9889 | C3F7− | |||
| 184.9843 | C3F7O− | |||
| 284.9780 | C5F11O− | |||
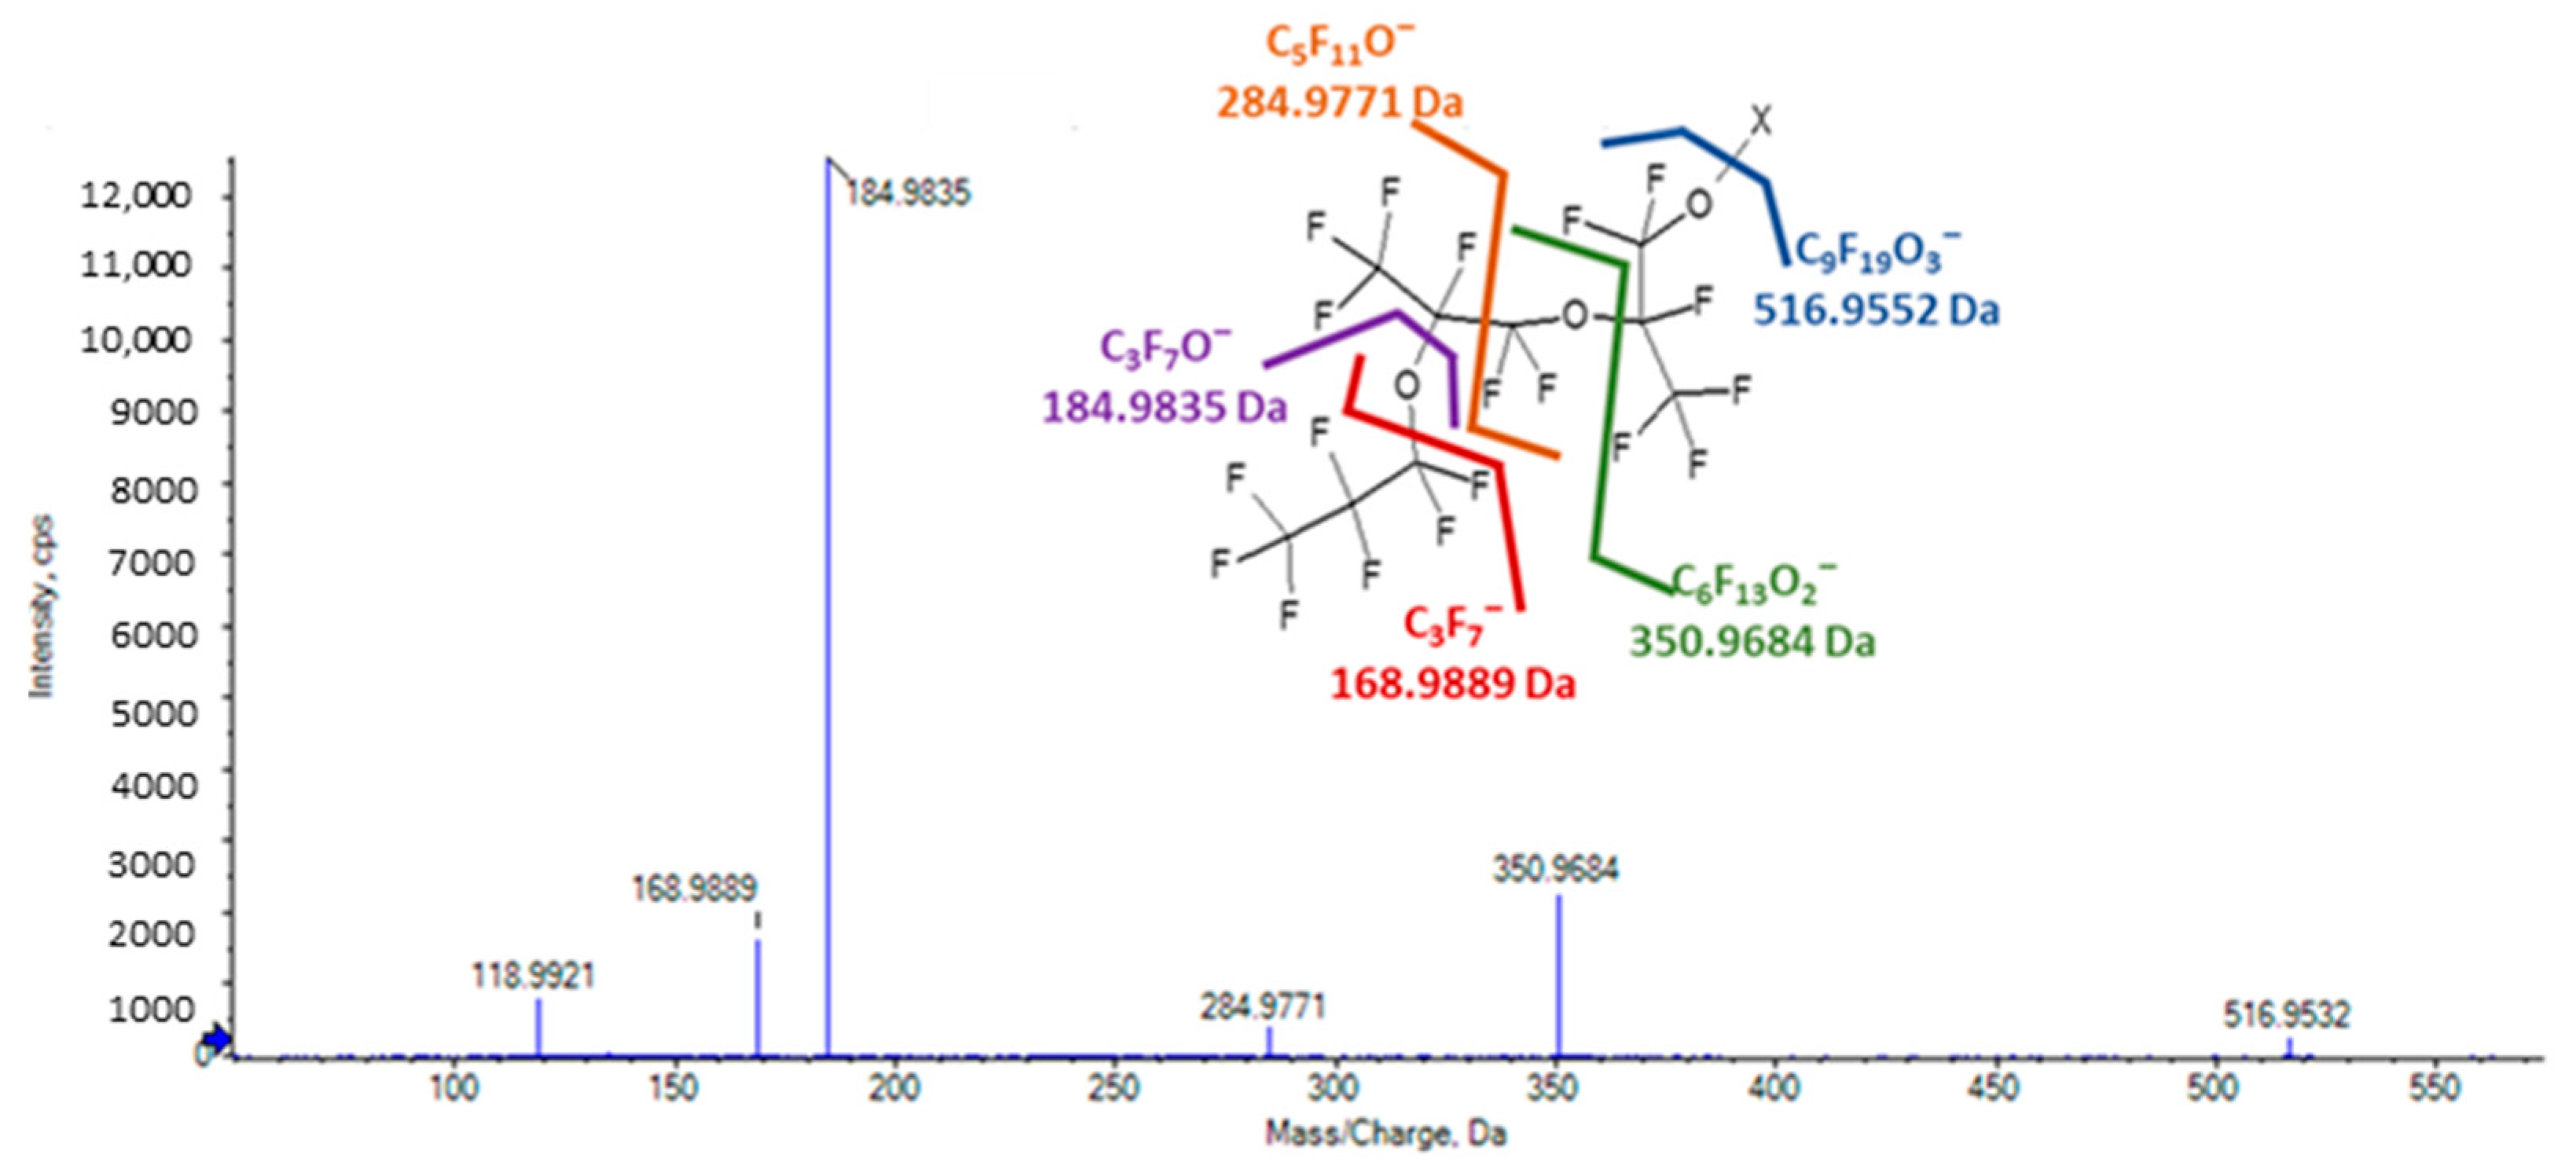
| 516.9552 | Plasma and Liver | 118.9921 | C2F5− | 1.07 |
| 168.9889 | C3F7− | |||
| 184.9835 | C3F7O− | |||
| 284.9771 | C5F11O− | |||
| 350.9680 | C6F13O2− | |||
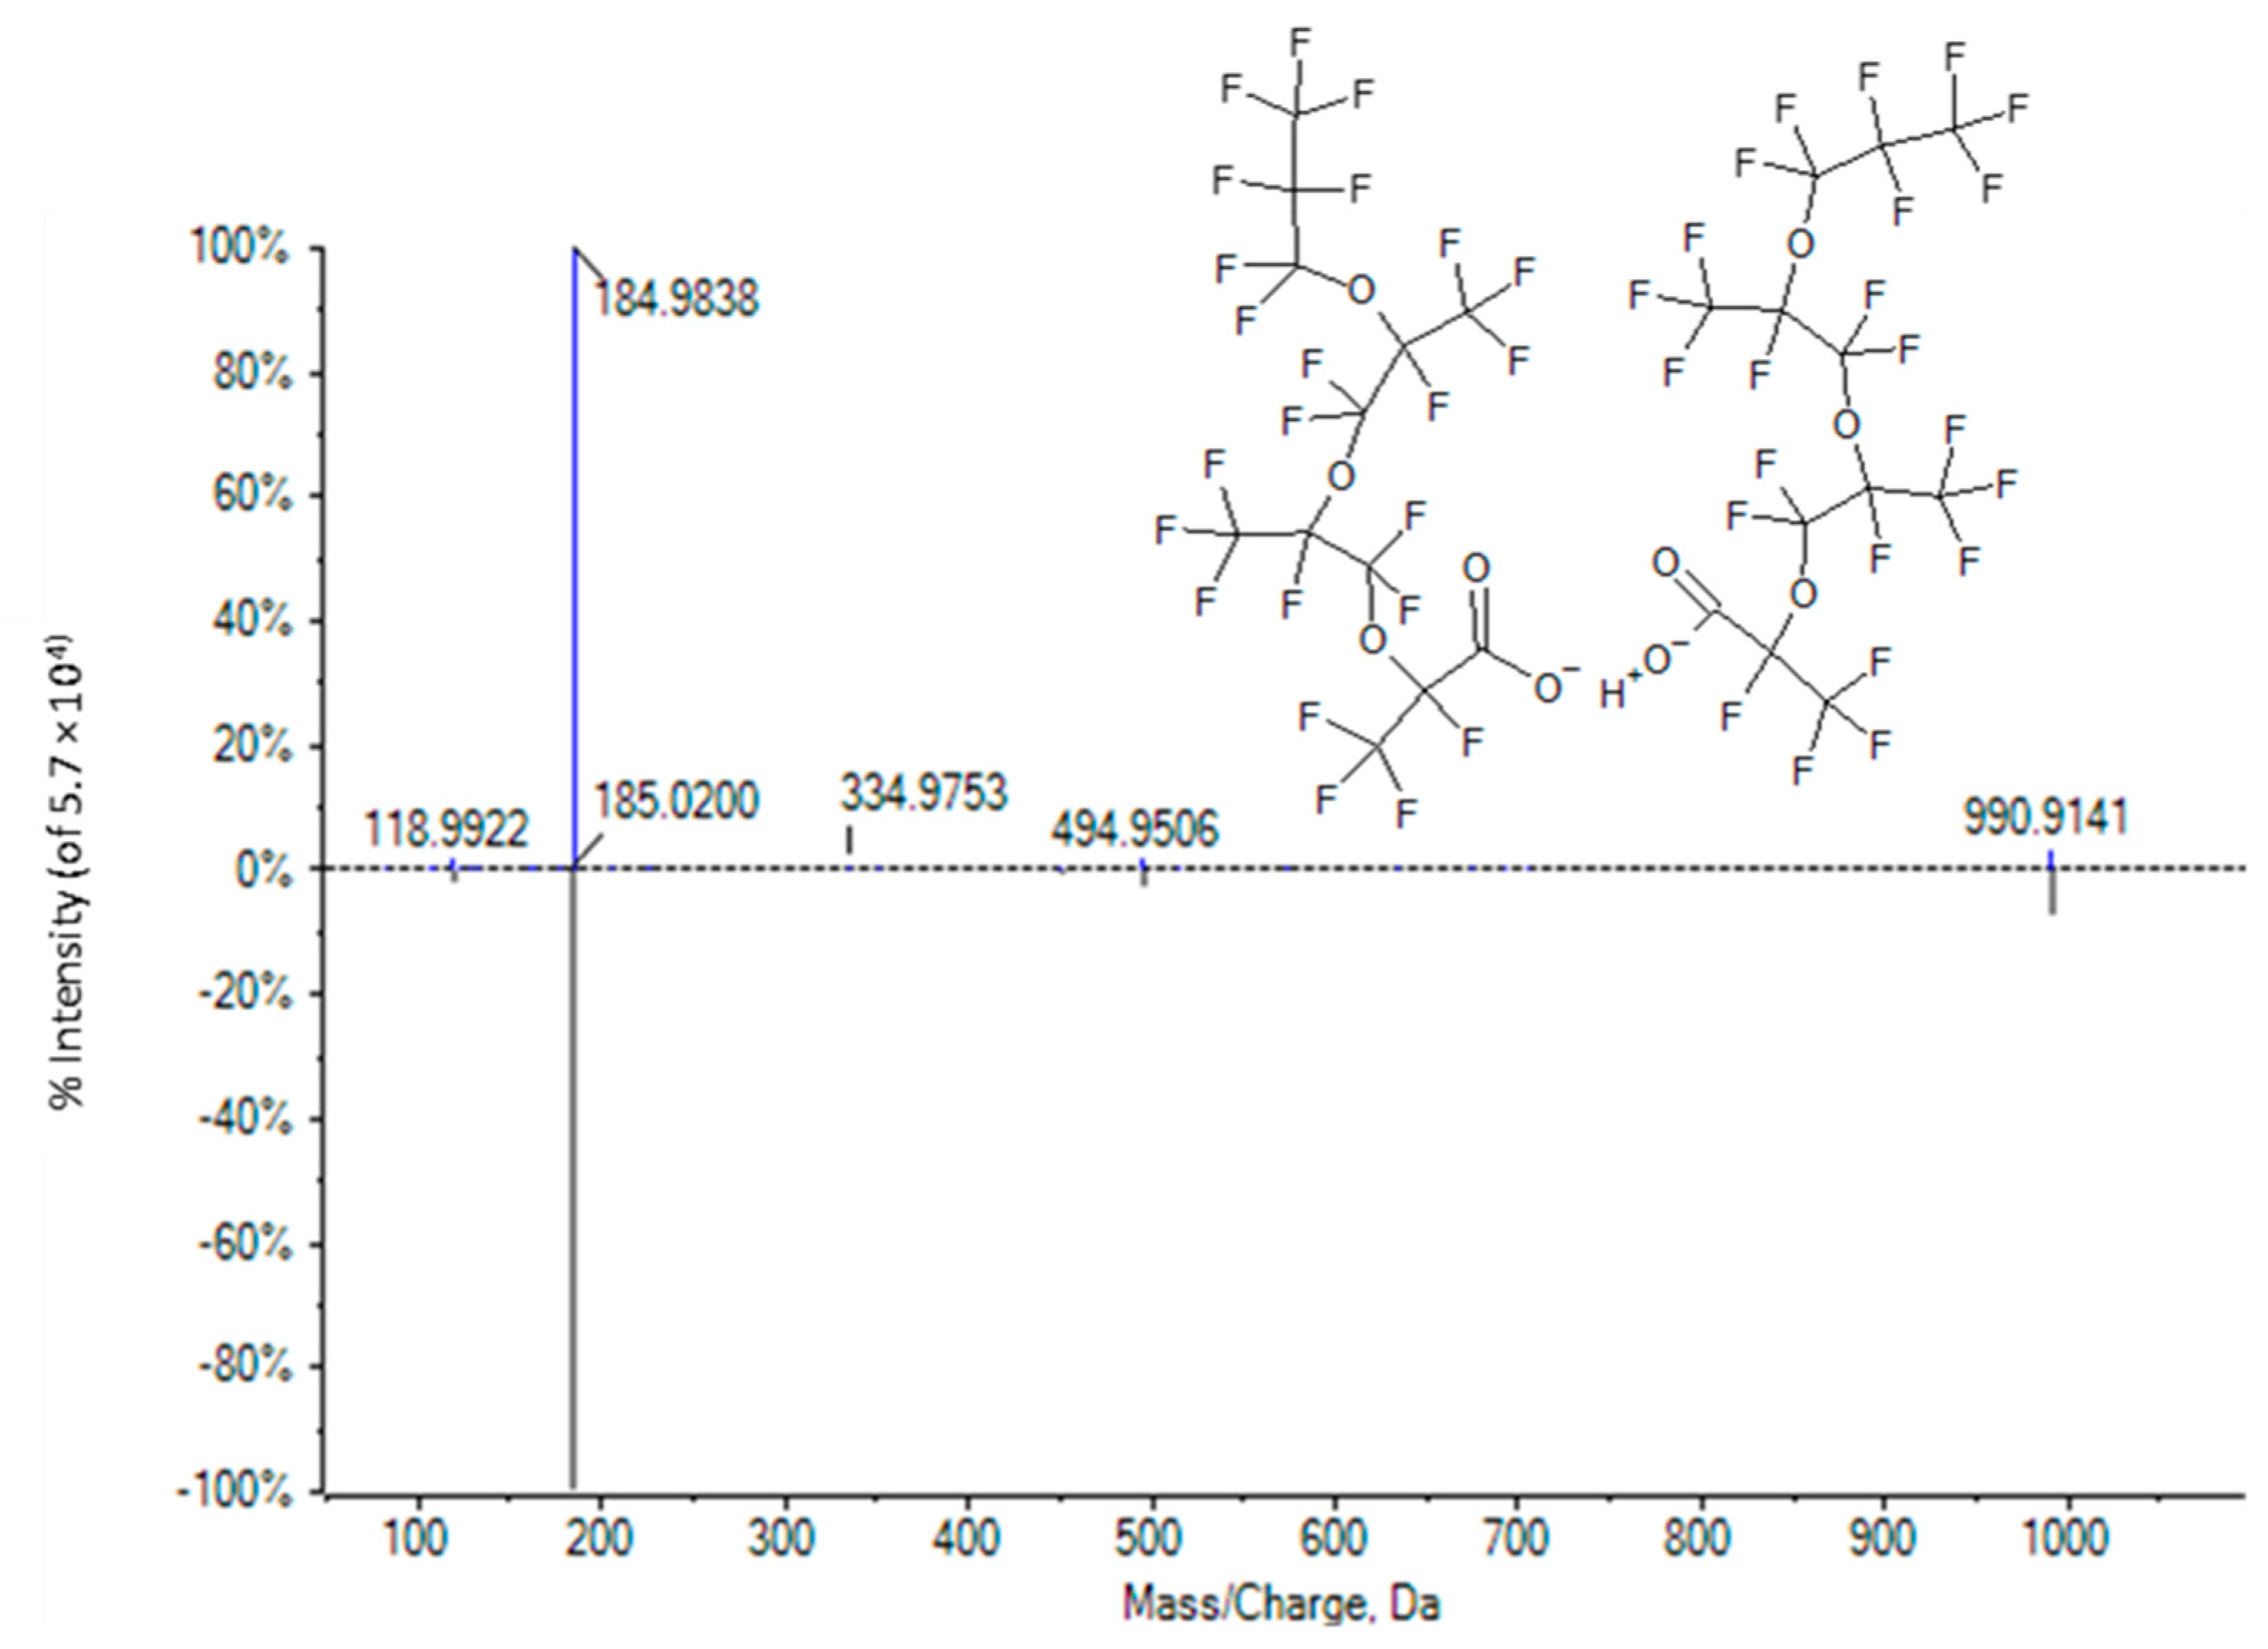
| 990.9106 | Plasma | 184.9833 | C3F7O− | 0.88 |
| 494.9521 | C9F17O4− |
| HFPO-TeA Dose Conc. (mg/kg/Day) | m/z 328.9661 RA Plasma | m/z 328.9661 RA Liver | m/z 516.9552 RA Plasma | m/z 516.9552 RA Liver | m/z 990.9106 RA Plasma |
|---|---|---|---|---|---|
| Vehicle | N/A | N/A | N/A | N/A | N/A |
| 0.3 | 0.69 ± 0.34 | N/A | 0.09 ± 0.14 | N/A | N/A |
| 0.9 | 1.35 ± 0.26 | N/A | 0.51 ± 0.17 | N/A | N/A |
| 2.3 | 2.14 ±0.41 | N/A | 0.71 ± 0.83 | N/A | N/A |
| 6.3 | 3.40 ± 0.69 | 1.91 ± 0.43 | 3.58 ± 1.07 | 0.52 ± 0.43 | 0.05 ± 0.04 |
| 17 | 6.43 ± 0.48 | 8.55 ± 1.01 | 2.67 ± 0.61 | 6.25 ± 1.37 | 1.83 ± 0.85 |
| Cell Type | Compound Name | Experimental fup | fub | Clrenal (L/h) | Clhep (L/h) | Css (µM) |
|---|---|---|---|---|---|---|
| Human | HFPO-DA | 0.0098 | 0.0178 | 0.1192 | 0 | 74.75 |
| HFPO-TA | 0.0013 | 0.0024 | 0.0158 | 0 | 375.76 | |
| HFPO-TeA | 0.0124 | 0.0226 | 0.1514 | 0 | 29.34 | |
| Rat | HFPO-DA | 0.0307 | 0.0547 | 0.0044 | 0 | 7.27 |
| HFPO-TA | 0.0018 | 0.0032 | 0.0003 | 0 | 81.84 | |
| HFPO-TeA | 0.0059 | 0.0105 | 0.008 | 0 | 18.96 |
Disclaimer/Publisher’s Note: The statements, opinions and data contained in all publications are solely those of the individual author(s) and contributor(s) and not of MDPI and/or the editor(s). MDPI and/or the editor(s) disclaim responsibility for any injury to people or property resulting from any ideas, methods, instructions or products referred to in the content. |
© 2023 by the authors. Licensee MDPI, Basel, Switzerland. This article is an open access article distributed under the terms and conditions of the Creative Commons Attribution (CC BY) license (https://creativecommons.org/licenses/by/4.0/).
Share and Cite
Renyer, A.; Ravindra, K.; Wetmore, B.A.; Ford, J.L.; DeVito, M.; Hughes, M.F.; Wehmas, L.C.; MacMillan, D.K. Dose Response, Dosimetric, and Metabolic Evaluations of Replacement PFAS Perfluoro-(2,5,8-trimethyl-3,6,9-trioxadodecanoic) Acid (HFPO-TeA). Toxics 2023, 11, 951. https://doi.org/10.3390/toxics11120951
Renyer A, Ravindra K, Wetmore BA, Ford JL, DeVito M, Hughes MF, Wehmas LC, MacMillan DK. Dose Response, Dosimetric, and Metabolic Evaluations of Replacement PFAS Perfluoro-(2,5,8-trimethyl-3,6,9-trioxadodecanoic) Acid (HFPO-TeA). Toxics. 2023; 11(12):951. https://doi.org/10.3390/toxics11120951
Chicago/Turabian StyleRenyer, Aero, Krishna Ravindra, Barbara A. Wetmore, Jermaine L. Ford, Michael DeVito, Michael F. Hughes, Leah C. Wehmas, and Denise K. MacMillan. 2023. "Dose Response, Dosimetric, and Metabolic Evaluations of Replacement PFAS Perfluoro-(2,5,8-trimethyl-3,6,9-trioxadodecanoic) Acid (HFPO-TeA)" Toxics 11, no. 12: 951. https://doi.org/10.3390/toxics11120951