
A Machine Learning Model to Estimate Toxicokinetic Half-Lives of Per- and Polyfluoro-Alkyl Substances (PFAS) in Multiple Species
 ,
,
Abstract
:
1. Introduction
2. Materials and Methods
2.1. Dataset Assembly
2.1.1. PFAS Half-Life Data (Dependent Variable)
2.1.2. Chemical and Species Descriptors (Independent Variables)
2.1.3. Descriptor Reduction
2.2. Model Development
2.3. Model Evaluation
2.4. Model Application
2.4.1. Prediction of Half-Lives for Novel Chemicals and Species
2.4.2. Prediction of Serum Concentration
3. Results and Discussion
3.1. Half-Life Model Optimization and Selection
3.2. Model Evaluation
3.3. Application of the Model to a PFAS Library
3.3.1. t½ Predictions for CCD PFAS List
3.3.2. Prediction of Whole-Body Clearance and Steady-State Concentration
3.3.3. Domain of Applicability
3.4. Model Limitations and Future Considerations
Supplementary Materials
Author Contributions
Funding
Institutional Review Board Statement
Informed Consent Statement
Data Availability Statement
Acknowledgments
Conflicts of Interest
References
- DeWitt, J.C. Toxicological Effects of Perfluoroalkyl and Polyfluoroalkyl Substances; Springer: Berlin/Heidelberg, Germany, 2015. [Google Scholar]
- Buck, R.C.; Murphy, P.M.; Pabon, M. Chemistry, properties, and uses of commercial fluorinated surfactants. In Polyfluorinated Chemicals and Transformation Products; Springer: Berlin/Heidelberg, Germany, 2012; pp. 1–24. [Google Scholar]
- Rao, N.S.; Baker, B.E. Textile finishes and fluorosurfactants. In Organofluorine Chemistry; Springer: Berlin/Heidelberg, Germany, 1994; pp. 321–338. [Google Scholar]
- Rayne, S.; Forest, K.; Friesen, K.J. Congener-specific numbering systems for the environmentally relevant C4 through C8 perfluorinated homologue groups of alkyl sulfonates, carboxylates, telomer alcohols, olefins, and acids, and their derivatives. J. Environ. Sci. Health Part A 2008, 43, 1391–1401. [Google Scholar] [CrossRef] [PubMed]
- Wang, Z.; Cousins, I.T.; Scheringer, M.; Hungerbühler, K. Fluorinated alternatives to long-chain perfluoroalkyl carboxylic acids (PFCAs), perfluoroalkane sulfonic acids (PFSAs) and their potential precursors. Environ. Int. 2013, 60, 242–248. [Google Scholar] [CrossRef] [PubMed]
- Wang, Z.; Cousins, I.T.; Scheringer, M.; Hungerbuehler, K. Hazard assessment of fluorinated alternatives to long-chain perfluoroalkyl acids (PFAAs) and their precursors: Status quo, ongoing challenges and possible solutions. Environ. Int. 2015, 75, 172–179. [Google Scholar] [CrossRef] [PubMed]
- Schulz, K.; Silva, M.R.; Klaper, R. Distribution and effects of branched versus linear isomers of PFOA, PFOS, and PFHxS: A review of recent literature. Sci. Total Environ. 2020, 733, 139186. [Google Scholar] [CrossRef] [PubMed]
- Loveless, S.E.; Finlay, C.; Everds, N.E.; Frame, S.R.; Gillies, P.J.; O’Connor, J.C.; Powley, C.R.; Kennedy, G.L. Comparative responses of rats and mice exposed to linear/branched, linear, or branched ammonium perfluorooctanoate (APFO). Toxicology 2006, 220, 203–217. [Google Scholar] [CrossRef] [PubMed]
- Yang, D.; Han, J.; Hall, D.R.; Sun, J.; Fu, J.; Kutarna, S.; Houck, K.A.; LaLone, C.A.; Doering, J.A.; Ng, C.A. Nontarget screening of per-and polyfluoroalkyl substances binding to human liver fatty acid binding protein. Environ. Sci. Sci. Sci. Technol. 2020, 54, 5676–5686. [Google Scholar] [CrossRef]
- Robuck, A.R.; McCord, J.P.; Strynar, M.J.; Cantwell, M.G.; Wiley, D.N.; Lohmann, R. Tissue-Specific Distribution of Legacy and Novel Per-and Polyfluoroalkyl Substances in Juvenile Seabirds. Environ. Sci. Technol. Lett. 2021, 8, 457–462. [Google Scholar] [CrossRef]
- Fenton, S.E.; Ducatman, A.; Boobis, A.; DeWitt, J.C.; Lau, C.; Ng, C.; Smith, J.S.; Roberts, S.M. Per- and Polyfluoroalkyl Substance Toxicity and Human Health Review: Current State of Knowledge and Strategies for Informing Future Research. Environ. Toxicol. Chem. 2021, 40, 606–630. [Google Scholar] [CrossRef]
- Patlewicz, G.; Richard, A.M.; Williams, A.J.; Grulke, C.M.; Sams, R.; Lambert, J.; Noyes, P.D.; DeVito, M.J.; Hines, R.N.; Strynar, M. A chemical category-based prioritization approach for selecting 75 per-and polyfluoroalkyl substances (PFAS) for tiered toxicity and toxicokinetic testing. Environ. Health Perspect. 2019, 127, 014501. [Google Scholar] [CrossRef] [Green Version]
- Glaser, D.; Lamoureux, E.; Opdyke, D.; LaRoe, S.; Reidy, D.; Connolly, J. The impact of precursors on aquatic exposure assessment for PFAS: Insights from bioaccumulation modeling. Integr. Environ. Assess. Manag. 2021, 17, 705–715. [Google Scholar] [CrossRef]
- Wambaugh, J.F.; Setzer, R.W.; Pitruzzello, A.M.; Liu, J.; Reif, D.M.; Kleinstreuer, N.C.; Wang, N.C.Y.; Sipes, N.; Martin, M.; Das, K. Dosimetric anchoring of in vivo and in vitro studies for perfluorooctanoate and perfluorooctanesulfonate. Toxicol. Sci. 2013, 136, 308–327. [Google Scholar] [CrossRef] [PubMed] [Green Version]
- Egeghy, P.P.; Lorber, M. An assessment of the exposure of Americans to perfluorooctane sulfonate: A comparison of estimated intake with values inferred from NHANES data. J. Expo. Sci. Environ. Epidemiol. 2011, 21, 150–168. [Google Scholar] [CrossRef] [Green Version]
- Chiu, W.A.; Lynch, M.T.; Lay, C.R.; Antezana, A.; Malek, P.; Sokolinski, S.; Rogers, R.D. Bayesian Estimation of Human Population Toxicokinetics of PFOA, PFOS, PFHxS, and PFNA from Studies of Contaminated Drinking Water. Environ. Health Perspect. 2022, 130, 127001. [Google Scholar] [CrossRef] [PubMed]
- Lorber, M.; Egeghy, P.P. Simple intake and pharmacokinetic modeling to characterize exposure of Americans to perfluoroctanoic acid, PFOA. Environ. Sci. Technol. 2011, 45, 8006–8014. [Google Scholar] [CrossRef] [PubMed]
- Arnot, J.A.; MacKay, D.; Webster, E.; Southwood, J.M. Screening level risk assessment model for chemical fate and effects in the environment. Environ. Sci. Technol. 2006, 40, 2316–2323. [Google Scholar] [CrossRef]
- Arnot, J.A.; Brown, T.N.; Wania, F. Estimating screening-level organic chemical half-lives in humans. Environ. Sci. Technol. 2014, 48, 723–730. [Google Scholar] [CrossRef]
- Dawson, D.E.; Ingle, B.L.; Phillips, K.A.; Nichols, J.W.; Wambaugh, J.F.; Tornero-Velez, R. Designing QSARs for Parameters of High-Throughput Toxicokinetic Models Using Open-Source Descriptors. Environ. Sci. Technol. 2021, 55, 6505–6517. [Google Scholar] [CrossRef]
- Pradeep, P.; Patlewicz, G.; Pearce, R.; Wambaugh, J.; Wetmore, B.; Judson, R. Using chemical structure information to develop predictive models for in vitro toxicokinetic parameters to inform high-throughput risk-assessment. Comput. Toxicol. 2020, 16, 100136. [Google Scholar] [CrossRef]
- Sipes, N.S.; Wambaugh, J.F.; Pearce, R.; Auerbach, S.S.; Wetmore, B.A.; Hsieh, J.-H.; Shapiro, A.J.; Svoboda, D.; DeVito, M.J.; Ferguson, S.S. An Intuitive Approach for Predicting Potential Human Health Risk with the Tox21 10k Library. Environ. Sci. Technol. 2017, 51, 10786–10796. [Google Scholar] [CrossRef]
- Wambaugh, J.F.; Wetmore, B.A.; Pearce, R.; Strope, C.; Goldsmith, R.; Sluka, J.P.; Sedykh, A.; Tropsha, A.; Bosgra, S.; Shah, I. Toxicokinetic triage for environmental chemicals. Toxicol. Sci. 2015, 147, 55–67. [Google Scholar] [CrossRef]
- Cametti, M.; Crousse, B.; Metrangolo, P.; Milani, R.; Resnati, G. The fluorous effect in biomolecular applications. Chem. Soc. Rev. 2012, 41, 31–42. [Google Scholar] [CrossRef] [PubMed]
- Ohmori, K.; Kudo, N.; Katayama, K.; Kawashima, Y. Comparison of the toxicokinetics between perfluorocarboxylic acids with different carbon chain length. Toxicology 2003, 184, 135–140. [Google Scholar] [CrossRef] [PubMed]
- Han, X.; Nabb, D.L.; Russell, M.H.; Kennedy, G.L.; Rickard, R.W. Renal Elimination of Perfluorocarboxylates (PFCAs). Chem. Res. Toxicol. 2012, 25, 35–46. [Google Scholar] [CrossRef] [PubMed]
- Pizzurro, D.M.; Seeley, M.; Kerper, L.E.; Beck, B.D. Interspecies differences in perfluoroalkyl substances (PFAS) toxicokinetics and application to health-based criteria. Regul. Toxicol. Pharmacol. 2019, 106, 239–250. [Google Scholar] [CrossRef]
- Lau, C. Perfluorinated Compounds. In Molecular, Clinical and Environmental Toxicology: Volume 3: Environmental Toxicology; Luch, A., Ed.; Springer: Basel, Switzerland, 2012; pp. 47–86. [Google Scholar]
- Lau, C. Perfluorinated compounds: An overview. In Toxicological Effects of Perfluoroalkyl and Polyfluoroalkyl Substances; Humana Press: Cham, Switzerland, 2015; pp. 1–21. [Google Scholar]
- Lau, C.; Anitole, K.; Hodes, C.; Lai, D.; Pfahles-Hutchens, A.; Seed, J. Perfluoroalkyl Acids: A Review of Monitoring and Toxicological Findings. Toxicol. Sci. 2007, 99, 366–394. [Google Scholar] [CrossRef] [Green Version]
- Russell, M.H.; Nilsson, H.; Buck, R.C. Elimination kinetics of perfluorohexanoic acid in humans and comparison with mouse, rat and monkey. Chemosphere 2013, 93, 2419–2425. [Google Scholar] [CrossRef]
- Chang, S.-C.; Noker, P.E.; Gorman, G.S.; Gibson, S.J.; Hart, J.A.; Ehresman, D.J.; Butenhoff, J.L. Comparative pharmacokinetics of perfluorooctanesulfonate (PFOS) in rats, mice, and monkeys. Reprod. Toxicol. 2012, 33, 428–440. [Google Scholar] [CrossRef]
- Teeguarden, J.G.; Tan, Y.-M.; Edwards, S.W.; Leonard, J.A.; Anderson, K.A.; Corley, R.A.; Kile, M.L.; Simonich, S.M.; Stone, D.; Tanguay, R.L.; et al. Completing the Link between Exposure Science and Toxicology for Improved Environmental Health Decision Making: The Aggregate Exposure Pathway Framework. Environ. Sci. Technol. 2016, 50, 4579–4586. [Google Scholar] [CrossRef] [Green Version]
- Huang, M.; Dzierlenga, A.; Robinson, V.; Waidyanatha, S.; DeVito, M.; Eifrid, M.; Granville, C.; Gibbs, S.; Blystone, C. Toxicokinetics of perfluorobutane sulfonate (PFBS), perfluorohexane-1-sulphonic acid (PFHxS), and perfluorooctane sulfonic acid (PFOS) in male and female Hsd: Sprague Dawley SD rats after intravenous and gavage administration. Toxicol. Rep. 2019, 6, 645–655. [Google Scholar] [CrossRef]
- Zhang, Y.; Beesoon, S.; Zhu, L.; Martin, J.W. Biomonitoring of perfluoroalkyl acids in human urine and estimates of biological half-life. Environ. Sci. Technol. 2013, 47, 10619–10627. [Google Scholar] [CrossRef]
- Xu, Y.; Fletcher, T.; Pineda, D.; Lindh, C.H.; Nilsson, C.; Glynn, A.; Vogs, C.; Norström, K.; Lilja, K.; Jakobsson, K. Serum half-lives for short-and long-chain perfluoroalkyl acids after ceasing exposure from drinking water contaminated by firefighting foam. Environ. Health Perspect. 2020, 128, 077004. [Google Scholar] [CrossRef] [PubMed]
- Worley, R.R.; Moore, S.M.; Tierney, B.C.; Ye, X.; Calafat, A.M.; Campbell, S.; Woudneh, M.B.; Fisher, J. Per-and polyfluoroalkyl substances in human serum and urine samples from a residentially exposed community. Environ. Int. 2017, 106, 135–143. [Google Scholar] [CrossRef] [PubMed]
- Olsen, G.W.; Burris, J.M.; Ehresman, D.J.; Froehlich, J.W.; Seacat, A.M.; Butenhoff, J.L.; Zobel, L.R. Half-life of serum elimination of perfluorooctanesulfonate, perfluorohexanesulfonate, and perfluorooctanoate in retired fluorochemical production workers. Environ. Health Perspect. 2007, 115, 1298–1305. [Google Scholar] [CrossRef] [PubMed]
- Li, Y.; Fletcher, T.; Mucs, D.; Scott, K.; Lindh, C.H.; Tallving, P.; Jakobsson, K. Half-lives of PFOS, PFHxS and PFOA after end of exposure to contaminated drinking water. Occup. Environ. Med. 2018, 75, 46–51. [Google Scholar] [CrossRef] [PubMed] [Green Version]
- Krewski, D.; Andersen, M.E.; Tyshenko, M.G.; Krishnan, K.; Hartung, T.; Boekelheide, K.; Wambaugh, J.F.; Jones, D.; Whelan, M.; Thomas, R.; et al. Toxicity testing in the 21st century: Progress in the past decade and future perspectives. Arch. Toxicol. 2020, 94, 1–58. [Google Scholar] [CrossRef]
- Chou, W.-C.; Lin, Z. Bayesian evaluation of a physiologically based pharmacokinetic (PBPK) model for perfluorooctane sulfonate (PFOS) to characterize the interspecies uncertainty between mice, rats, monkeys, and humans: Development and performance verification. Environ. Int. 2019, 129, 408–422. [Google Scholar] [CrossRef]
- U.S. Environmental Protection Agency. PFOA Health Advisory; 2016. Available online: https://www.epa.gov/ (accessed on 1 January 2023).
- Kenyon, E.M. Interspecies Extrapolation. In Computational Toxicology: Volume I; Reisfeld, B., Mayeno, A.N., Eds.; Humana Press: Totowa, NJ, USA, 2012; pp. 501–520. [Google Scholar]
- Chiu, W.A.; Barton, H.A.; DeWoskin, R.S.; Schlosser, P.; Thompson, C.M.; Sonawane, B.; Lipscomb, J.C.; Krishnan, K. Evaluation of physiologically based pharmacokinetic models for use in risk assessment. J. Appl. Toxicol. 2007, 27, 218–237. [Google Scholar] [CrossRef]
- Huang, M.; Robinson, V.; Waidyanatha, S.; Dzierlenga, A.; DeVito, M.; Eifrid, M.; Gibbs, S.; Blystone, C. Toxicokinetics of 8: 2 fluorotelomer alcohol (8: 2-FTOH) in male and female Hsd: Sprague Dawley SD rats after intravenous and gavage administration. Toxicol. Rep. 2019, 6, 924–932. [Google Scholar] [CrossRef]
- Bell, S.M.; Chang, X.; Wambaugh, J.F.; Allen, D.G.; Bartels, M.; Brouwer, K.L.R.; Casey, W.M.; Choksi, N.; Ferguson, S.S.; Fraczkiewicz, G.; et al. In vitro to in vivo extrapolation for high throughput prioritization and decision making. Toxicol. In Vitro 2018, 47, 213–227. [Google Scholar] [CrossRef]
- Hope, W.W.; Petraitis, V.; Walsh, T.J. Experimental design considerations in pharmacokinetic studies. In ADME and Biopharmaceutical Properties; John Wiley & Sons, Inc.: Hoboken, NJ, USA, 2008; p. 1059. [Google Scholar]
- Loccisano, A.E.; Campbell, J.L., Jr.; Andersen, M.E.; Clewell III, H.J. Evaluation and prediction of pharmacokinetics of PFOA and PFOS in the monkey and human using a PBPK model. Regul. Toxicol. Pharmacol. 2011, 59, 157–175. [Google Scholar] [CrossRef]
- Chou, W.-C.; Lin, Z. Machine Learning and Artificial Intelligence in Physiologically Based Pharmacokinetic Modeling. Toxicol. Sci. 2022, kfac101. [Google Scholar] [CrossRef] [PubMed]
- Mansouri, K.; Grulke, C.M.; Judson, R.S.; Williams, A.J. OPERA models for predicting physicochemical properties and environmental fate endpoints. J. Cheminformatics 2018, 10, 10. [Google Scholar] [CrossRef] [PubMed] [Green Version]
- Raza, A.; Bardhan, S.; Xu, L.; Yamijala, S.S.R.K.C.; Lian, C.; Kwon, H.; Wong, B.M. A Machine Learning Approach for Predicting Defluorination of Per- and Polyfluoroalkyl Substances (PFAS) for Their Efficient Treatment and Removal. Environ. Sci. Technol. Lett. 2019, 6, 624–629. [Google Scholar] [CrossRef]
- George, S.; Dixit, A. A machine learning approach for prioritizing groundwater testing for per-and polyfluoroalkyl substances (PFAS). J. Environ. Manag. 2021, 295, 113359. [Google Scholar] [CrossRef] [PubMed]
- Mitchell, J.B.O. Machine learning methods in chemoinformatics. WIREs Comput. Mol. Sci. 2014, 4, 468–481. [Google Scholar] [CrossRef] [Green Version]
- R Core Team. R: A Language and Environment for Statistical Computing; R Foundation for Statistical Computing: Vienna, Austria, 2022. [Google Scholar]
- Kuhn, M.; Wing, J.; Weston, S.; Williams, A.; Keefer, C.; Engelhardt, A.; Cooper, T.; Mayer, Z.; Kenkel, B. Caret: Classification and Regression Training, R package version 6.0-86; Astrophysics Source Code Library: Cambridge, MA, USA, 2020. [Google Scholar]
- Djoumbou Feunang, Y.; Eisner, R.; Knox, C.; Chepelev, L.; Hastings, J.; Owen, G.; Fahy, E.; Steinbeck, C.; Subramanian, S.; Bolton, E. ClassyFire: Automated chemical classification with a comprehensive, computable taxonomy. J. Cheminform. 2016, 8, 61. [Google Scholar] [CrossRef] [Green Version]
- Fantke, P.; Chiu, W.A.; Aylward, L.; Judson, R.; Huang, L.; Jang, S.; Gouin, T.; Rhomberg, L.; Aurisano, N.; McKone, T.; et al. Exposure and toxicity characterization of chemical emissions and chemicals in products: Global recommendations and implementation in USEtox. Int. J. Life Cycle Assess. 2021, 26, 899–915. [Google Scholar] [CrossRef]
- Dowle, M.; Srinivasan, A. data.table: Extension of ‘data.frame’, R package version 1.14.2; R Foundation for Statistical Computing: Vienna, Austria, 2021.
- Warnes, G.R.; Bolker, B.; Gorjanc, G.; Grothendieck, G.; Korosec, A.; Lumley, T.; MacQueen, D.; Magnusson, A.; Rogers, J. Others. Gdata: Various R Programming Tools for Data Manipulation, R package version 2.18.0.1; R Foundation for Statistical Computing: Vienna, Austria, 2022.
- Wickham, H. ggplot2: Elegant Graphics for Data Analysis; Springer: New York, NY, USA, 2016. [Google Scholar]
- Pearce, R.G.; Setzer, R.W.; Strope, C.L.; Sipes, N.S.; Wambaugh, J.F. httk: R package for high-throughput toxicokinetics. J. Stat. Softw. 2017, 79, 1–26. [Google Scholar] [CrossRef] [Green Version]
- Yan, Y. MLmetrics: Machine Learning Evaluation Metrics, R package version 1.1.1; R Foundation for Statistical Computing: Vienna, Austria, 2016.
- von Jouanne-Diedrich, H. OneR: One Rule Machine Learning Classification Algorithm with Enhancements, R Package Version 2.2l; R Foundation for Statistical Computing: Vienna, Austria, 2017.
- Schauberger, P.; Walker, A. Openxlsx: Read, Write and Edit xlsx Files, R package version 4.2.5; R Foundation for Statistical Computing: Vienna, Austria, 2021.
- Henry, L.; Wickham, H. Purrr: Functional Programming Tools, R package version 0.3.4; R Foundation for Statistical Computing: Vienna, Austria, 2020.
- Liaw, A.; Wiener, M. Classification and regression by randomForest. R News 2002, 2, 18–22. [Google Scholar]
- Wickham, H.; Bryan, J. Readxl: Read Excel Files, R package version 1.4.1; R Foundation for Statistical Computing: Vienna, Austria, 2022.
- Wickham, H.; Seidel, D. Scales: Scale Functions for Visualization, R package version 1.2.1; R Foundation for Statistical Computing: Vienna, Austria, 2022.
- Qiu, Y. Showtext: Using Fonts More Easily in R Graphs, R package version 0.9-5; R Foundation for Statistical Computing: Vienna, Austria, 2022.
- Wickham, H. Stringr: Simple, Consistent Wrappers for Common String Operations, R package version 1.4.1; R Foundation for Statistical Computing: Vienna, Austria, 2022.
- Wickham, H.; Girlich, M. Tidyr: Tidy Messy Data, R package version 1.2.1; R Foundation for Statistical Computing: Vienna, Austria, 2022.
- Delignette-Muller, M.L.; Dutang, C. fitdistrplus: An R Package for Fitting Distributions. J. Stat. Softw. 2015, 64, 1–34. [Google Scholar] [CrossRef] [Green Version]
- Olsen, G.W.; Chang, S.-C.; Noker, P.E.; Gorman, G.S.; Ehresman, D.J.; Lieder, P.H.; Butenhoff, J.L. A comparison of the pharmacokinetics of perfluorobutanesulfonate (PFBS) in rats, monkeys, and humans. Toxicology 2009, 256, 65–74. [Google Scholar] [CrossRef] [PubMed]
- Chengelis, C.P.; Kirkpatrick, J.B.; Myers, N.R.; Shinohara, M.; Stetson, P.L.; Sved, D.W. Comparison of the toxicokinetic behavior of perfluorohexanoic acid (PFHxA) and nonafluorobutane-1-sulfonic acid (PFBS) in cynomolgus monkeys and rats. Reprod. Toxicol. 2009, 27, 400–406. [Google Scholar] [CrossRef] [PubMed]
- Lau, C.; Rumpler, J.; Das, K.P.; Wood, C.R.; Schmid, J.E.; Strynar, M.J.; Wambaugh, J.F. Pharmacokinetic profile of Perfluorobutane Sulfonate and activation of hepatic nuclear receptor target genes in mice. Toxicology 2020, 441, 152522. [Google Scholar] [CrossRef] [PubMed]
- Sundström, M.; Chang, S.-C.; Noker, P.E.; Gorman, G.S.; Hart, J.A.; Ehresman, D.J.; Bergman, Å.; Butenhoff, J.L. Comparative pharmacokinetics of perfluorohexanesulfonate (PFHxS) in rats, mice, and monkeys. Reprod. Toxicol. 2012, 33, 441–451. [Google Scholar] [CrossRef] [PubMed]
- Kim, S.-J.; Heo, S.-H.; Lee, D.-S.; Hwang, I.G.; Lee, Y.-B.; Cho, H.-Y. Gender differences in pharmacokinetics and tissue distribution of 3 perfluoroalkyl and polyfluoroalkyl substances in rats. Food Chem. Toxicol. 2016, 97, 243–255. [Google Scholar] [CrossRef]
- Chang, S.-C.; Das, K.; Ehresman, D.J.; Ellefson, M.E.; Gorman, G.S.; Hart, J.A.; Noker, P.E.; Tan, Y.-M.; Lieder, P.H.; Lau, C. Comparative pharmacokinetics of perfluorobutyrate in rats, mice, monkeys, and humans and relevance to human exposure via drinking water. Toxicol. Sci. 2008, 104, 40–53. [Google Scholar] [CrossRef] [Green Version]
- Kabadi, S.V.; Fisher, J.; Aungst, J.; Rice, P. Internal exposure-based pharmacokinetic evaluation of potential for biopersistence of 6: 2 fluorotelomer alcohol (FTOH) and its metabolites. Food Chem. Toxicol. 2018, 112, 375–382. [Google Scholar] [CrossRef]
- Dzierlenga, A.L.; Robinson, V.G.; Waidyanatha, S.; DeVito, M.J.; Eifrid, M.A.; Gibbs, S.T.; Granville, C.A.; Blystone, C.R. Toxicokinetics of perfluorohexanoic acid (PFHxA), perfluorooctanoic acid (PFOA) and perfluorodecanoic acid (PFDA) in male and female Hsd: Sprague dawley SD rats following intravenous or gavage administration. Xenobiotica 2020, 50, 722–732. [Google Scholar] [CrossRef]
- Gannon, S.A.; Johnson, T.; Nabb, D.L.; Serex, T.L.; Buck, R.C.; Loveless, S.E. Absorption, distribution, metabolism, and excretion of [1-14C]-perfluorohexanoate ([14C]-PFHx) in rats and mice. Toxicology 2011, 283, 55–62. [Google Scholar] [CrossRef]
- Heuvel, J.P.V.; Kuslikis, B.I.; Van Rafelghem, M.J.; Peterson, R.E. Tissue distribution, metabolism, and elimination of perfluorooctanoic acid in male and female rats. J. Biochem. Toxicol. 1991, 6, 83–92. [Google Scholar] [CrossRef]
- Lou, I.; Wambaugh, J.F.; Lau, C.; Hanson, R.G.; Lindstrom, A.B.; Strynar, M.J.; Zehr, R.D.; Setzer, R.W.; Barton, H.A. Modeling single and repeated dose pharmacokinetics of PFOA in mice. Toxicol. Sci. 2009, 107, 331–341. [Google Scholar] [CrossRef] [PubMed]
- Butenhoff, J.L.; Gaylor, D.W.; Moore, J.A.; Olsen, G.W.; Rodricks, J.; Mandel, J.H.; Zobel, L.R. Characterization of risk for general population exposure to perfluorooctanoate. Regul. Toxicol. Pharmacol. 2004, 39, 363–380. [Google Scholar] [CrossRef] [PubMed]
- Bartell, S.M.; Calafat, A.M.; Lyu, C.; Kato, K.; Ryan, P.B.; Steenland, K. Rate of decline in serum PFOA concentrations after granular activated carbon filtration at two public water systems in Ohio and West Virginia. Environ. Health Perspect. 2010, 118, 222–228. [Google Scholar] [CrossRef] [PubMed] [Green Version]
- Kim, S.-J.; Choi, E.-J.; Choi, G.-W.; Lee, Y.-B.; Cho, H.-Y. Exploring sex differences in human health risk assessment for PFNA and PFDA using a PBPK model. Arch. Toxicol. 2019, 93, 311–330. [Google Scholar] [CrossRef]
- Tatum-Gibbs, K.; Wambaugh, J.F.; Das, K.P.; Zehr, R.D.; Strynar, M.J.; Lindstrom, A.B.; Delinsky, A.; Lau, C. Comparative pharmacokinetics of perfluorononanoic acid in rat and mouse. Toxicology 2011, 281, 48–55. [Google Scholar] [CrossRef]
- Shi, Y.; Vestergren, R.; Xu, L.; Zhou, Z.; Li, C.; Liang, Y.; Cai, Y. Human exposure and elimination kinetics of chlorinated polyfluoroalkyl ether sulfonic acids (Cl-PFESAs). Environ. Sci. Technol. 2016, 50, 2396–2404. [Google Scholar] [CrossRef]
- Gannon, S.A.; Fasano, W.J.; Mawn, M.P.; Nabb, D.L.; Buck, R.C.; Buxton, L.W.; Jepson, G.W.; Frame, S.R. Absorption, distribution, metabolism, excretion, and kinetics of 2, 3, 3, 3-tetrafluoro-2-(heptafluoropropoxy) propanoic acid ammonium salt following a single dose in rat, mouse, and cynomolgus monkey. Toxicology 2016, 340, 1–9. [Google Scholar] [CrossRef]
- ECHA—The European Chemicals Agency. Exposure Related Observations in Humans: Other Data; E.C.A. 700-242-3; ECHA: Helsinki, Finland, 2021. [Google Scholar]
- Zhu, X.-W.; Sedykh, A.; Zhu, H.; Liu, S.-S.; Tropsha, A. The use of pseudo-equilibrium constant affords improved QSAR models of human plasma protein binding. Pharm. Res. 2013, 30, 1790–1798. [Google Scholar] [CrossRef] [Green Version]
- Ingle, B.L.; Veber, B.C.; Nichols, J.W.; Tornero-Velez, R. Informing the Human Plasma Protein Binding of Environmental Chemicals by Machine Learning in the Pharmaceutical Space: Applicability Domain and Limits of Predictability. J. Chem. Inf. Model. 2016, 56, 2243–2252. [Google Scholar] [CrossRef]
- Yun, Y.E.; Tornero-Velez, R.; Purucker, S.T.; Chang, D.T.; Edginton, A.N. Evaluation of Quantitative Structure Property Relationship Algorithms for Predicting Plasma Protein Binding in Humans. Comput. Toxicol. 2020, 17, 100142. [Google Scholar] [CrossRef]
- Munoz, G.; Liu, J.; Vo Duy, S.; Sauvé, S. Analysis of F-53B, Gen-X, ADONA, and emerging fluoroalkylether substances in environmental and biomonitoring samples: A review. Trends Environ. Anal. Chem. 2019, 23, e00066. [Google Scholar] [CrossRef]
- Yang, C.; Tarkhov, A.; Marusczyk, J.; Bienfait, B.; Gasteiger, J.; Kleinoeder, T.; Magdziarz, T.; Sacher, O.; Schwab, C.H.; Schwoebel, J. New publicly available chemical query language, CSRML, to support chemotype representations for application to data mining and modeling. J. Chem. Inf. Model. 2015, 55, 510–528. [Google Scholar] [CrossRef]
- Andersen, M.E.; Clewell, H.J.; Tan, Y.-M.; Butenhoff, J.L.; Olsen, G.W. Pharmacokinetic modeling of saturable, renal resorption of perfluoroalkylacids in monkeys—Probing the determinants of long plasma half-lives. Toxicology 2006, 227, 156–164. [Google Scholar] [CrossRef]
- Cheng, X.; Klaassen, C.D. Critical Role of PPAR-α in Perfluorooctanoic Acid– and Perfluorodecanoic Acid–Induced Downregulation of Oatp Uptake Transporters in Mouse Livers. Toxicol. Sci. 2008, 106, 37–45. [Google Scholar] [CrossRef] [PubMed] [Green Version]
- van Groen, B.D.; Nicolaï, J.; Kuik, A.C.; Van Cruchten, S.; van Peer, E.; Smits, A.; Schmidt, S.; de Wildt, S.N.; Allegaert, K.; De Schaepdrijver, L.; et al. Ontogeny of Hepatic Transporters and Drug-Metabolizing Enzymes in Humans and in Nonclinical Species. Pharmacol. Rev. 2021, 73, 597–678. [Google Scholar] [CrossRef] [PubMed]
- Ferrari, F.; Orlando, A.; Ricci, Z.; Ronco, C. Persistent pollutants: Focus on perfluorinated compounds and kidney. Curr. Opin. Crit. Care 2019, 25, 539–549. [Google Scholar] [CrossRef] [PubMed]
- Komiya, I. Urine flow-dependence and interspecies variation of the renal reabsorption of sulfanilamide. J. Pharmacobiodyn. 1987, 10, 1–7. [Google Scholar] [CrossRef] [PubMed]
- Oliver, J. Nephrons and Kidneys; Hoeber: New York, NY, USA, 1968. [Google Scholar]
- Davies, B.; Morris, T. Physiological parameters in laboratory animals and humans. Pharm. Res. 1993, 10, 1093–1095. [Google Scholar] [CrossRef]
- Rappaport, S.M.; Barupal, D.K.; Wishart, D.; Vineis, P.; Scalbert, A. The blood exposome and its role in discovering causes of disease. Environ. Health Perspect. 2014, 122, 769. [Google Scholar] [CrossRef]
- O’Hagan, S.; Kell, D.B. Understanding the foundations of the structural similarities between marketed drugs and endogenous human metabolites. Front. Pharmacol. 2015, 6, 105. [Google Scholar] [CrossRef] [Green Version]
- Brodin, B.; Nielsen, C.U.; Steffansen, B.; Frøkjær, S. Transport of Peptidomimetic Drugs by the Intestinal Di/tri-peptide Transporter, PepT1. Pharmacol. Toxicol. 2002, 90, 285–296. [Google Scholar] [CrossRef] [PubMed]
- Tramonti, G.; Xie, P.; Wallner, E.I.; Danesh, F.R.; Kanwar, Y.S. Expression and functional characteristics of tubular transporters: P-glycoprotein, PEPT1, and PEPT2 in renal mass reduction and diabetes. Am. J. Physiol.-Ren. Physiol. 2006, 291, F972–F980. [Google Scholar] [CrossRef] [PubMed] [Green Version]
- Tanimoto, T.T. Elementary Mathematical Theory of Classification and Prediction; International Business Machines Corp: Armonk, NY, USA, 1958. [Google Scholar]
- Zhang, L.; Ren, X.-M.; Guo, L.-H. Structure-based investigation on the interaction of perfluorinated compounds with human liver fatty acid binding protein. Environ. Sci. Technol. 2013, 47, 11293–11301. [Google Scholar] [CrossRef] [PubMed]
- Breiman, L. Random forests. Mach. Learn. 2001, 45, 5–32. [Google Scholar] [CrossRef] [Green Version]
- Williams, A.J.; Grulke, C.M.; Edwards, J.; McEachran, A.D.; Mansouri, K.; Baker, N.C.; Patlewicz, G.; Shah, I.; Wambaugh, J.F.; Judson, R.S. The CompTox Chemistry Dashboard: A community data resource for environmental chemistry. J. Cheminform. 2017, 9, 61. [Google Scholar] [CrossRef] [Green Version]
- Roy, K.; Kar, S.; Ambure, P. On a simple approach for determining applicability domain of QSAR models. Chemom. Intell. Lab. Syst. 2015, 145, 22–29. [Google Scholar] [CrossRef]
- Greenblatt, D.J. Volume of distribution–Again. Clin. Pharmacol. Drug Dev. 2014, 3, 419–420. [Google Scholar] [CrossRef]
- Kvålseth, T.O. Note on Cohen’s kappa. Psychological reports 1989, 65, 223–226. [Google Scholar] [CrossRef]
- Hofer, T.; Myhre, O.; Peltola-Thies, J.; Hirmann, D. Analysis of elimination half-lives in MamTKDB 1.0 related to bioaccumulation: Requirement of repeated administration and blood plasma values underrepresent tissues. Environ. Int. 2021, 155, 106592. [Google Scholar] [CrossRef]
- Tropsha, A.; Golbraikh, A. Predictive QSAR modeling workflow, model applicability domains, and virtual screening. Curr. Pharm. Des. 2007, 13, 3494–3504. [Google Scholar] [CrossRef]
- Han, X.; Snow, T.A.; Kemper, R.A.; Jepson, G.W. Binding of perfluorooctanoic acid to rat and human plasma proteins. Chem. Res. Toxicol. 2003, 16, 775–781. [Google Scholar] [CrossRef] [PubMed]
- Pan, Y.; Zhang, H.; Cui, Q.; Sheng, N.; Yeung, L.W.Y.; Guo, Y.; Sun, Y.; Dai, J. First Report on the Occurrence and Bioaccumulation of Hexafluoropropylene Oxide Trimer Acid: An Emerging Concern. Environ. Sci. Technol. 2017, 51, 9553–9560. [Google Scholar] [CrossRef] [PubMed]
- Wetmore, B.A. Quantitative in vitro-to-in vivo extrapolation in a high-throughput environment. Toxicology 2015, 332, 94–101. [Google Scholar] [CrossRef] [PubMed]
- Mansouri, K.; Cariello, N.F.; Korotcov, A.; Tkachenko, V.; Grulke, C.M.; Sprankle, C.S.; Allen, D.; Casey, W.M.; Kleinstreuer, N.C.; Williams, A.J. Open-source QSAR models for pKa prediction using multiple machine learning approaches. J. Cheminformatics 2019, 11, 1–20. [Google Scholar] [CrossRef]
- Rodgers, T.; Leahy, D.; Rowland, M. Physiologically based pharmacokinetic modeling 1: Predicting the tissue distribution of moderate-to-strong bases. J. Pharm. Sci. 2005, 94, 1259–1276. [Google Scholar] [CrossRef]
- Peyret, T.; Poulin, P.; Krishnan, K. A unified algorithm for predicting partition coefficients for PBPK modeling of drugs and environmental chemicals. Toxicol. Appl. Pharmacol. 2010, 249, 197–207. [Google Scholar] [CrossRef]
- Strope, C.L.; Mansouri, K.; Clewell, H.J.; Rabinowitz, J.R.; Stevens, C.; Wambaugh, J.F. High-throughput in-silico prediction of ionization equilibria for pharmacokinetic modeling. Sci. Total Environ. 2018, 615, 150–160. [Google Scholar] [CrossRef]
- Arnot, J.A.; Brown, T.N.; Wania, F.; Breivik, K.; McLachlan, M.S. Prioritizing Chemicals and Data Requirements for Screening-Level Exposure and Risk Assessment. Environ. Health Perspect. 2012, 120, 1565–1570. [Google Scholar] [CrossRef]
- Wetmore, B.A.; Wambaugh, J.F.; Ferguson, S.S.; Sochaski, M.A.; Rotroff, D.M.; Freeman, K.; Clewell, H.J., 3rd; Dix, D.J.; Andersen, M.E.; Houck, K.A.; et al. Integration of dosimetry, exposure, and high-throughput screening data in chemical toxicity assessment. Toxicol. Sci. 2012, 125, 157–174. [Google Scholar] [CrossRef] [Green Version]
- Armitage, J.M.; Wania, F.; Arnot, J.A. Application of mass balance models and the chemical activity concept to facilitate the use of in vitro toxicity data for risk assessment. Environ. Sci. Technol. 2014, 48, 9770–9779. [Google Scholar] [CrossRef]
- Purser, S.; Moore, P.R.; Swallow, S.; Gouverneur, V. Fluorine in medicinal chemistry. Chem. Soc. Rev. 2008, 37, 320–330. [Google Scholar] [CrossRef] [PubMed]
- Wang, N.C.Y.; Zhao, Q.J.; Wesselkamper, S.C.; Lambert, J.C.; Petersen, D.; Hess-Wilson, J.K. Application of computational toxicological approaches in human health risk assessment. I. A tiered surrogate approach. Regul. Toxicol. Pharmacol. 2012, 63, 10–19. [Google Scholar] [CrossRef] [PubMed]
- Tal, T.; Vogs, C. Invited Perspective: PFAS Bioconcentration and Biotransformation in Early Life Stage Zebrafish and Its Implications for Human Health Protection. Environ. Health Perspect. 2021, 129, 071304. [Google Scholar] [CrossRef] [PubMed]
- Riess, J.G. Fluorous micro-and nanophases with a biomedical perspective. Tetrahedron. 2002, 58, 4113–4131. [Google Scholar] [CrossRef]
- Bhhatarai, B.; Gramatica, P. Prediction of aqueous solubility, vapor pressure and critical micelle concentration for aquatic partitioning of perfluorinated chemicals. Environ. Sci. Technol. 2011, 45, 8120–8128. [Google Scholar] [CrossRef] [PubMed]
- Wambaugh, J.F.; Barton, H.A.; Setzer, R.W. Comparing models for perfluorooctanoic acid pharmacokinetics using Bayesian analysis. J. Pharmacokinet. Pharmacodyn. 2008, 35, 683–712. [Google Scholar] [CrossRef]
- Langenbach, B.; Wilson, M. Per- and Polyfluoroalkyl Substances (PFAS): Significance and Considerations within the Regulatory Framework of the USA. Int. J. Environ. Res. Public Health 2021, 18, 11142. [Google Scholar] [CrossRef] [PubMed]
- Jian, J.-M.; Chen, D.; Han, F.-J.; Guo, Y.; Zeng, L.; Lu, X.; Wang, F. A short review on human exposure to and tissue distribution of per-and polyfluoroalkyl substances (PFASs). Sci. Total Environ. 2018, 636, 1058–1069. [Google Scholar] [CrossRef]
- Maurya, H.; Kumar, T.; Kumar, S. Anatomical and physiological similarities of kidney in different experimental animals used for basic studies. J. Clin. Exp. Nephrol. 2018, 3, 9. [Google Scholar] [CrossRef]
- Mandikian, D.; Figueroa, I.; Oldendorp, A.; Rafidi, H.; Ulufatu, S.; Schweiger, M.G.; Couch, J.A.; Dybdal, N.; Joseph, S.B.; Prabhu, S. Tissue physiology of cynomolgus monkeys: Cross-species comparison and implications for translational pharmacology. AAPS J. 2018, 20, 1–13. [Google Scholar] [CrossRef] [Green Version]
- Bolton, E.E.; Wang, Y.; Thiessen, P.A.; Bryant, S.H. PubChem: Integrated platform of small molecules and biological activities. In Annual Reports in Computational Chemistry; Elsevier: Amsterdam, The Netherlands, 2008; Volume 4, pp. 217–241. [Google Scholar]
- Morgan, H.L. The generation of a unique machine description for chemical structures-a technique developed at chemical abstracts service. J. Chem. Doc. 1965, 5, 107–113. [Google Scholar] [CrossRef]


| Rat | Mouse | Monkey | Human | ||||||||||
|---|---|---|---|---|---|---|---|---|---|---|---|---|---|
| (Rattus rattus) | (Mus musculus) | (Macaca fascicularis) | (Homo sapiens) | ||||||||||
| Chemical CAS/DTXSID | Sex | Value | Unit | Ref. | Value | Unit | Ref. | Value | Unit | Ref. | Value | Unit | Ref. |
| PFBS (C4) 375-73-5 DTXSID5030030 | F | 1.5–7.4 | Hours | [34,73,74] | 4.5 | Hours | [75] | 1.1 | Days | [73,74] | 35 | Days | [36,73] |
| M | 3.6–5.0 | 5.8 | 1.6 | 36 | |||||||||
| PFHxS (C6) 355-46-4 DTXSID7040150 | F | 1.3–1.4 | Days | [34,76,77] | 27 | Days | [76] | 87 | Days | [76] | 13 | Years | [35,36,37,39] |
| M | 26–27 | 28 | 140 | 14 | |||||||||
| PFOS (C8) 1763-23-1 DTXSID3031864 | F | 28–43 | Days | [32,34,77] | 38 | Days | [32] | 110 | Days | [32] | 3.4 | Years | [35,36,37,38,39] |
| M | 34–36 | 43 | 130 | 3.7 | |||||||||
| PFBA (C4) 375-22-4 DTXSID4059916 | F | 1.8 | Hours | [78] | 6.2 | Hours | [78] | 1.7 | Days | [78] | 3 | Days | [78] |
| M | 9.2 | 12 | |||||||||||
| PFHxA (C6) 307-24-4 DTXSID3031862 | F | 0.5–7.3 | Hours | [74,79,80,81] | 2.4 | Hours | [74] | 32 | Days | [31] | |||
| M | 1.3–11 | 5.3 | |||||||||||
| PFHpA (C7) 375-85-9 DTXSID1037303 | F | 1.2–2.1 | Hours | [25,79] | 140 | Days | [35,36] | ||||||
| M | 1.5–2.4 | 130 | |||||||||||
| PFOA (C8) 335-67-1 DTXSID8031865 | F | 1.7–4.8 | Hours | [25,77,80,82] | 16 | Days | [83] | 33 | Days | [84] | 3.5 | Years | [35,36,37,85] |
| M | 8.1–8.5 | Days | 22 | 20–21 | |||||||||
| PFNA (C9) 375-95-1 DTXSID8031863 | F | 6.4 | Days | [25,86,87] | 42 | Days | [87] | 1.7 | Years | [35] | |||
| M | 3.3–5.5 | 87 | 3.2 | ||||||||||
| PFDA (C10) 335-76-2 DTXSID3031860 | F | 45–59 | Days | [25,80,86] | 4 | Years | [35] | ||||||
| M | 55–83 | 7.1 | |||||||||||
| F-53B 756426-58-1 DTXSID80892506 | F | 18 | Years | [88] | |||||||||
| M | |||||||||||||
| GenX 13252-13-6 DTXSID70880215 | F | 0.9–2.8 | Days | [89] | 1.0 | Days | [89] | 3.3 | Days | [89] | 3.4 | Days | [90] |
| M | 3.0–3.7 | 1.5 | 2.7 | ||||||||||
| A–Chemical Structure Descriptors | |||||
| Parameter Type | Descriptor | Chemical Coverage (%) | Training Set Median | Training Set Min | Training Set Max |
| Protein binding | Albumin binding affinity constant (Mol−1) | 45.45 | 2.84 × 10⁵ | 2800 | 1.10 × 10⁶ |
| Physico-chemical | Average Mass (g/mol) | 100 | 400.1 | 214 | 532 |
| Log Vapor Pressure (mmHg) | −2.07 | −8.09 | 1.53 | ||
| Log Octanol: Air | 4.16 | 3.46 | 6.33 | ||
| Log Octanol: Water | 3.11 | 1.43 | 5.61 | ||
| Log Water Solubility (Mol/L at 25 °C) | −2.68 | −4.9 | −0.5 | ||
| Ether bond present | 0.13 * | 0 | 1 | ||
| Endogenous Ligand Similarity | CAS 142-62-1 | 100 | 0.18 * | 0 | 1 |
| CAS 107-92-6 | 0.088 * | ||||
| CAS 111-16-0 | 0.066 * | ||||
| B–Physiological Descriptors | |||||
| Species | Proximal tubule diameter (mm) | Body Weight (kg) | Kidney Weight/Body Weight (g/kg) | Glomerular Surface Area/Proximal Tubule Volume (1/mm) | Glomerular Surface Area/Kidney Weight (mm2/kg) |
| Human | 0.072 | 70 | 2.23 | 3.16 | 1.65 |
| Monkey | 0.062 | 5 | 2.5 | 2.13 | 2.04 |
| Mouse | 0.054 | 0.02 | 8 | 2.05 | 2.28 |
| Rat | 0.058 | 0.24 | 2.92 | 2.31 | 3.26 |
| C–Categorical Descriptors | |||||
| Sex | Female/Male | ||||
| Dosing | intravenous, oral, other (epidemiological, via metabolite extrapolation) | ||||
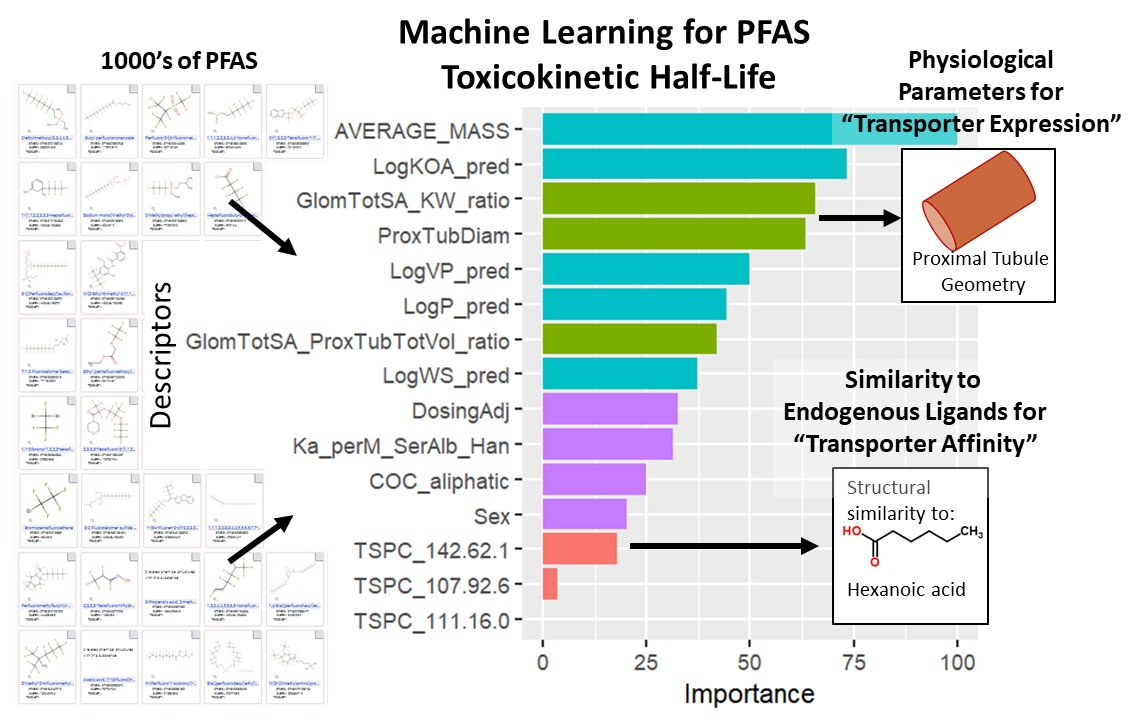
| Parameter | Raw Accuracy Change | Scaled Accuracy Change |
|---|---|---|
| Average mass | 9.49 | 100 |
| Log Octanol:Air (OPERA) | 7.02 | 73.3 |
| Glomerular Surface Area (SA): Kidney Weight Ratio | 6.32 | 65.6 |
| Proximal Tubule Diameter | 6.11 | 63.4 |
| Log Vapor Pressure (OPERA) | 4.86 | 49.7 |
| Log Octanol:Water (OPERA) | 4.37 | 44.4 |
| Glomerular Surface Area: Proximal Tubule Volume Ratio | 4.14 | 42.0 |
| Log Water Solubility (OPERA) | 3.72 | 37.4 |
| Dosing Form | 3.26 | 32.4 |
| Albumin binding affinity | 3.16 | 31.3 |
| Ether Bond (COC) | 2.56 | 24.8 |
| Sex | 2.14 | 20.2 |
| Similarity to CAS 142-62-1 | 1.93 | 18.0 |
| Similarity to CAS 107-92-6 | 0.61 | 3.63 |
| Similarity to CAS 111-16-0 | 0.27 | 0 |
Disclaimer/Publisher’s Note: The statements, opinions and data contained in all publications are solely those of the individual author(s) and contributor(s) and not of MDPI and/or the editor(s). MDPI and/or the editor(s) disclaim responsibility for any injury to people or property resulting from any ideas, methods, instructions or products referred to in the content. |
© 2023 by the authors. Licensee MDPI, Basel, Switzerland. This article is an open access article distributed under the terms and conditions of the Creative Commons Attribution (CC BY) license (https://creativecommons.org/licenses/by/4.0/).
Share and Cite
Dawson, D.E.; Lau, C.; Pradeep, P.; Sayre, R.R.; Judson, R.S.; Tornero-Velez, R.; Wambaugh, J.F. A Machine Learning Model to Estimate Toxicokinetic Half-Lives of Per- and Polyfluoro-Alkyl Substances (PFAS) in Multiple Species. Toxics 2023, 11, 98. https://doi.org/10.3390/toxics11020098
Dawson DE, Lau C, Pradeep P, Sayre RR, Judson RS, Tornero-Velez R, Wambaugh JF. A Machine Learning Model to Estimate Toxicokinetic Half-Lives of Per- and Polyfluoro-Alkyl Substances (PFAS) in Multiple Species. Toxics. 2023; 11(2):98. https://doi.org/10.3390/toxics11020098
Chicago/Turabian StyleDawson, Daniel E., Christopher Lau, Prachi Pradeep, Risa R. Sayre, Richard S. Judson, Rogelio Tornero-Velez, and John F. Wambaugh. 2023. "A Machine Learning Model to Estimate Toxicokinetic Half-Lives of Per- and Polyfluoro-Alkyl Substances (PFAS) in Multiple Species" Toxics 11, no. 2: 98. https://doi.org/10.3390/toxics11020098