Article

Efficient Humanitarian Logistics: Multi-Commodity Location–Inventory Model Incorporating Demand Probability and Consumption Coefficients

by
Majid Mehrabi Delshad
1,
Adel Pourghader Chobar
2,
Peiman Ghasemi
3,* and
Davoud Jafari
1
1
Department of Industrial Engineer, Engineering Faculty, Parand Branch, Islamic Azad University, Parand 3761396361, Iran
2
Department of Industrial Engineering, Faculty of Industrial and Mechanical Engineering, Qazvin Branch, Islamic Azad University, Qazvin 341851416, Iran
3
Department of Business Decisions and Analytics, University of Vienna, Kolingasse 14-16, 1090 Vienna, Austria
*
Author to whom correspondence should be addressed.
Logistics 2024, 8(1), 9; https://doi.org/10.3390/logistics8010009
Submission received: 13 October 2023 / Revised: 18 December 2023 / Accepted: 2 January 2024 / Published: 11 January 2024
(This article belongs to the Section Humanitarian and Healthcare Logistics)

Abstract

:
Background: A logistics network plan could be a major key issue due to its effect on supply chain effectiveness and responsiveness. This study aims to investigate the inventory location in the humanitarian logistics response stage using a three-level logistics network to integrate location–allocation problems such as warehouse location and shelter allocation to each facility, and then determine the inventory level in each warehouse. Methods: In this research, the center and its distribution, as well as the reduction in service-level costs due to inventory deficit, have been considered to increase the level of shelter services. In order to investigate the network, in this study, bi-objective mixed-integer linear programming (BOMILP) is presented. Results: The first objective is to reduce location costs and inventory costs that take into account probable demand, consumption factors, and transportation costs, and the second objective is to raise the level of services offered to victims in the model. The software programs GAMS win32, 25.1.2 and MATLAB have been utilized with numerical examples in various dimensions. Conclusions: To maximize the efficiency and quality of the service, first, the model was numerically solved, and then the location where the most commodities could be transported at the lowest possible cost was identified.

1. Introduction

On the one hand, the increase in the number of natural disasters and the extension of their damaging scope, and on the other hand, the increase in the populace of totally different districts of the world have caused an increase in financial misfortunes and human casualties caused by such mischances. Concurrent with the Normal Calamities Database, in 2022, 387 natural disasters happened around the world, coming about as 30,704 passings, 185 million wounds, and 223.8 billion USD in financial losses. In social sciences, particularly in sociology, geography, and epidemiology, attempts to define disaster and utilize these categories to understand different social, health, and demographic phenomena have a long history [1]. Different perspectives are taken on disasters. When it comes to economics, for instance, disasters are frequently seen as a subset of shocks that cause unanticipated changes [2]. Yet, there are many different definitions of what constitutes a humanitarian response. A humanitarian movement cannot survive without adhering to the three general principles of humanity, impartiality, and equality. Henry Dunant developed these concepts following the Solferino War. The creation of non-governmental organizations (NGOs) and relief centers is motivated by humanity, which holds that assistance should be given whenever a tragedy or disaster happens. The assistance should be given in times of conflict without any bias or partiality, according to impartiality. Equal treatment also implies that those in need should receive aid without hindrance according to their most pressing need [3]. The logistics component of any disaster assistance project can determine whether an operation is efficient or not [4]. The efficacy and efficiency of humanitarian efforts are significantly impacted by humanitarian logistics, which can account for up to 80% of the expenditures of relief operations [4]. Following a disaster, it is important to provide for the victims’ needs, including shelter, food, medication, water, and other non-food items [5]. On 21 May 2021, EM-DAT indicated that about 389 natural disasters occurred in 2020. Generally, these disasters incurred a cost of 171.3 billion USD, inflicted 15,080 fatalities, and impacted 98.4 million people. Aside from the Coronavirus outbreak, meteorological disasters dominated that year’s events. Disasters in 2020 had a bigger impact in terms of the number of incidents that were documented and economic losses (151.6 billion USD) compared to the previous two decades (2000–2019). There were significantly fewer fatalities than the annual mean of 61,709 and fewer people directly affected compared to the annual mean of 201.3 million people. This decrease in effects was brought about by the lack of catastrophic disasters, such as the 2010 Haiti earthquake that killed 222,500 people, and the 2004 Indian Ocean Tsunami that killed 227,000 people (330 million people). Nevertheless, there were 26% more storms (102 events) than the annual average, 23% more floods (163 events), and 18% more flood-related deaths (5233 occurrences) than the annual average in 2020. These events had unevenly dispersed effects. Some examples include the 2556 fatalities in Britain, 19,245 in France, 1460 in Belgium, and 400 in the Netherlands due to the heatwave. In addition, Cyclone Amphan in India, the typhoon in China, the drought in Niger, and the population of Burkina Faso each had an influence on 18 million, 10 million, 3.7 million, and 2.9 million people, respectively. In terms of economic damages, the storm in China cost 17 billion USD, Cyclone Amphan in India inflicted damages costing 13 billion USD, and Hurricane Laura in the United States cost 13 billion USD. These statistics are not limited to these examples [6]. Disasters are viewed as recurrent events in the four phases of risk mitigation, preparedness, response, and rehabilitation in the disaster management cycle [3]. The phase of risk mitigation deals with policies and procedures that mitigate social vulnerability. These are matters that belong to the obligations of governments and do not directly involve logistics professionals. The many activities that take place before a disaster are referred to as the preparedness phase. This stage incorporates tactics for correctly carrying out actions at the scene of the disaster Since it is one of the most crucial and fundamental steps in the design of the physical network and the communication information systems created for cooperation, it is also regarded as a crucial stage. The largest possible catastrophic outcomes are to be avoided during this time. To prepare for future disasters, this phase is also developed by coordinating efforts during current occurrences, learning from them, and adjusting to prior experiences. The activities that are conducted in reaction to occurrences are referred to as the response phase. This phase has two main objectives [7]. The first is a quick response by the activity of a “silent network” or “temporary networks”, proposed by [8] as the immediate response sub-phase, and the second is restoration in the shortest time to provide services and commodities to respond to the largest number of beneficiaries (restore sub-phase). The difference in responses to occurrences is referred to as the rehabilitation phase. This phase aims to convey long-term problems, and it also includes actions to better restore the circumstances to the former level. The public is negatively impacted by the long-lasting impacts of events [7]. A bi-objective model is suggested in this study to develop the working model of [9]. To raise the level of services, the first objective is to lower the building and measuring of roads conveying people, goods, and inventory-related costs, and the second objective attempts to minimize the expenses associated with not delivering services and commodities to the victims. Two minimization models are available, but there are criteria for judging the significance of the items and the quantity of precautionary storage, so that the commodities may be provided and stored in the necessary amount under the priority. The following list includes the research’s key characteristics: (1) An inventory location model that takes into account two commodities and probable demand. (2) Considers the relevance of each service type when calculating the precautionary reserve. (3) Each commodity is paid for individually after taking into account the delivery time. The leading study in Section 2 summarizes the literature before presenting the programming in Section 3. A meta-heuristic method is used to solve the mathematical model, a BOMILP model, which is evaluated in Section 4, before the conclusions and recommendations are presented.

2. Literature Review

The combination of locationn–inventory costs was reported as the first study in the field of location inventory. Several literary trends are relevant to the current investigation. The first has to do with how they are used in the actual world. The theoretical application of this issue is in the second case, inventory and location are used in the third case, and finally, how these investigations are applied in humanitarian logistics. Location models are used to determine the most cost-effective location for communicating with other network levels [10]. Moreno et al. [11] proposed two programming models to integrate and coordinate fleet location, distribution, and size decisions in post-disaster conditions under an uncertain, multi-commodity, multi-period, and multi-modal environment. To save overall resources and improve service levels, one model considered the option of reusing vehicles to cover additional routes in the same timeframe. The findings showed that the integration of decisions in a multi-period environment and the option of reusing vehicles reduce the total cost. The inventory location problem is provided in a three-level network that integrates distribution centers, flow allocation, and transport fleet size to offer a continuous non-linear programming model. The model has been addressed utilizing iterative heuristic algorithms [12]. A study has examined a multi-level inventory location model that takes into account retail, the location of warehouses, and the inventory control procedures in each warehouse. This model was addressed using the Lagrangian release method as a mixed integer nonlinear programming problem. Finally, the algorithm’s efficiency and advantage were analyzed [13]. Presenting a bi-objective LIRP (Location–Inventory–Routing Problem) routing–inventory–location model has allowed researchers to study the design of a multi-period, multi-product supply chain network. Four meta-heuristic algorithms were employed to solve this model, assuming that the travel time between consumers is probable. The results of these methods were then compared [14,15]. A programming to choose the locations of temporary shelters is offered. The objective of this study is to increase the minimum weight of the existing accommodation facilities and distribute the population among them to regulate efficiency [16]. Espejo-Díaz and Guerrero [17] expanded their past inquiry from 2020 by considering human behaviors such as casualty verbalization and anxiety. They examined a dynamic post-disaster relief delivery issue considering economic help, defined as a stock directing issue. Due to the plausibility of post-quake tremors or modern disaster occurrences (i.e., auxiliary disasters), they attempted to play down the hazard of stock misfortune in addition to stock deficiencies. The findings showed that rejecting behavioral variables leads to the most prominent need of stock in HRSC. To incorporate choices in the planning of facilities and warehouses, evacuation routes, and relief vehicles in the two phases of humanitarian logistics preparedness (pre-incident) and response (post-incident), a probabilistic mixed integer model is developed [18]. A closed-loop supply chain including a factory, distribution-receiving centers, and retail is considered. This model of inventory location coordination under unknown demand is used. Distribution-receiving centers are in charge of managing new inventories and returned commodities and have a regular visitation program. This model outlines the locations of distribution facilities, their policies about inventory, and the distribution of retailers among them. In this study, six distinct coordinating strategies are modeled, each with a non-linear integer programming problem and a chance constraint. Following the model being solved using CPLEX and remodeled as a quadratic integer program, the benefits of various approaches have been demonstrated [19]. With the correlation of retailers’ demand with inventory plans, the issue of inventory location in a three-level supply chain is analyzed. A periodic visit policy has been considered for the inventory level to properly monitor the state of the inventory. The given methodology similarly takes the form of non-linear integer programming with the objective function of minimizing supply chain costs overall. Two Simulated Annealing algorithms and a genetic algorithm were utilized to solve the stated problem [20]. An inventory location model has been presented for designing a supply chain network with multiple distribution and retail centers. The number of distribution centers, the distribution of retailers among the centers, and the size and length of the order were all determined by the created model. Additionally, this model considered non-deterministic demand, the length of replenishment, and the queuing theory approach [14]. These kinds of warehouses are affordable as a consequence of the programming of location–allocation that has been given and solved utilizing information from prior instances. To examine the benefits of container warehouses (such as the proper inventory level for each type of inventory item), studies have also looked at substituting warehouses with containers [21]. Uncertainty is a frequent obstacle for humanitarian logistics. For multi-period site allocation problems with different resources and capacity levels under unknown emergency demand, a distributive resistant model (DRM) is provided. Furthermore, the branch and Benders approach has been used to build and solve a mixed integer model [22]. Uncertainty on the supply and demand sides may significantly raise mortality during the planning stage of humanitarian logistics. The authors provided a limited-chance resistant facility location model that includes failing network nodes and edges. Since the chance limits cannot be solved, a conical and linear approximation has been suggested instead. This approximation has been solved using Benders decomposition [23]. Demand prediction for humanitarian logistics is a challenging issue with urgent practical repercussions. The demand for fuel during a regional humanitarian disaster event is discussed in this study as a component of the coordinated response. They presented a model for resistant principal component analysis (RPCA) and long short-term memory (LSTM) to deal with demand prediction issues, which has also contributed to correcting the delay in online learning. They employed a machine learning approach for demand prediction in their problem [24]. International and local aid is frequently employed to assist impacted communities in recovering from calamities or disasters. Creating warehouses to store supplies to be sent to disaster zones is a common response. With the use of historical data and the Pareto front, the researchers provide a strategy for the bi-objective problem of choosing the location of warehouses to reduce costs and service delivery times. Moreover, they employ stable optimization to find the optimal solution [25]. Plans to address urgent problems will be developed as a result of the randomness and unpredictability of disasters like earthquakes to lower risks when they occur. The operationally efficient distribution of supplies and support equipment is crucial to post-quake relief and rescue efforts. In the three-level relief chain, a two-phase, mixed multi-objective, multi-period, and multi-commodity programming is presented, wherein the first stage takes into account the location of the distribution centers and warehouses with various capacities, as well as decisions regarding the commodities stored in those locations. Due to the stringent time frame restrictions, operational planning was performed in the second stage for vehicle routing and commodities distribution to the impacted locations to reduce the overall cost and enhance route reliability. Similarly, researchers solved the provided model using the NSGA II and MOPSO (Multi-objective particle swarm optimization) algorithms [26]. A mathematical model for locating distribution points and allocating inventories has been presented in the humanitarian logistics post-incident phase. This model enables demand nodes to be served from multiple points of distribution (PODs) while minimizing location, logistics, and deprivation costs (i.e., the cost imposed on survivors due to the lack of access to essential resources). This is crucial when a POD might not have sufficient inventory to satisfy all of the demand points that have been allocated to it. The paper discusses the significance of considering the time component of the system and the ensuing social costs at the facility site. The problem is also resolved using the Butterfly Optimization Algorithm (B-OA) [27]. A two-phase, multi-objective, mixed-integer, multi-period, and multi-commodity mathematical model has been presented in the three-level supply chain in which the decisions regarding the storage of products in warehouses and distribution centers created in the first stage, as well as the location of distribution centers and warehouses with various capacity levels, are considered. In the second stage, practical planning was performed to direct trucks and deliver products to the impacted regions to reduce the overall cost due to the limited hard-time windows. The critical region is supposed to be serviced multiple times under special circumstances in the model. The robust optimization approach based on the creation of the model for refusing uncertain circumstances has been used to create the model to bring it closer to reality. Algorithms such as NSGA II and MOPSO have been utilized to solve it [26]. Resources for disaster preparedness have been predetermined using a facility location model. This formulation has several characteristics, one of which is that the objective function takes deprivation costs into account. This methodology seeks to reduce the expenses associated with transportation, inventory, fixed facilities, and inventory deficit [28]. The choice of the carrier is crucial in humanitarian missions. In their study, the researchers stressed the significance of the suppliers of commodities and vehicles, emphasizing the need for the prompt provision of any relief supplies by suppliers and the integration of carrier and supplier selection in humanitarian logistics to ensure the prevention of shortages. To generate collaborative choices in the stages of humanitarian logistics preparedness and action and to develop a contract for the reservation of commodities and equipment, they provided a two-stage scenario-based stochastic planning model. Also, they attempted to solve their model for big, actual problems using an ineffective two-step approach [29]. To design a multi-period, bi-objective humanitarian logistics network, a probabilistic location–allocation model is given. This aims to cut expenses while increasing the overall network coverage. The injured are also categorized according to the severity of the accident in the provided model, which also considers the movement of hurt people before and after the accident as well as the inventory management of perishable goods. In addition, fuzzy chance-constrained programming has been used for uncertainty. Lastly, a fuzzy interactive programming approach derived from an algorithm method and two meta-heuristic algorithms, namely the imperialist competitive algorithm and Invasive Weed Optimization algorithm, have been used. Additionally, a case study has been used to show the model’s efficiency [30]. For the multi-period location–allocation problem with multiple resources and capacity levels under uncertain emergency demands and resource fulfillment times with only limited distribution data accessible in humanitarian logistics, a robust distribution mathematical model has been provided. They generated the branch-and-cut algorithm and Benders decomposition algorithm to solve the model after formulating it as a mixed integer linear programming model [22]. Following the predicted demand, the conventional multi-echelon networks for push-mode strategies provided rescue supplies under the crisis circumstances described in this article. More specifically, approximation and deterministic analyses were used to derive an approximate solution from a dynamic stochastic optimization problem for the optimal inventory distribution strategy. They found the disaster circumstances using the approximate strategy and suggested a different network structure [31].
Our goal is to investigate the issues associated with locating facilities for emergency humanitarian logistics based on the different types of data modeling and issues and to look at the pre- and post-disaster situations concerning the locations of the facilities, such as distribution centers, warehouses, shelters, debris removal sites, and medical centers. The four key issues—deterministic facility location problems, dynamic facility location problems, stochastic facility location problems, and stable facility location problems—that were mentioned in the literature review are examined in this study. Each problem’s facility location, data modeling kind, disaster type, judgments, objectives, restrictions, and approach to solving them are analyzed [32,33,34]. To locate and assess the location of predetermined stocks in international humanitarian relief organizations, a hybrid FAHP (Fuzzy Analytical Hierarchy Process) and FTOPSIS (Fuzzy Technique for Order Preference by Similarity to Ideal Solution) framework was applied. To improve the efficiency, this framework develops a more precise, practical, and systematic decision-support tool for the progressive implementation of warehouse location selection in humanitarian relief operations [32]. In addition, a mixed-integer programming model was presented for location and allocation. In this study, there are two categories of relief centers. Additionally, we have solved our model using CPLEX software 20.1.0 [9].

3. Mathematical Modeling

When considering the historical significance of relief efforts, one of the most crucial aspects is determining where and when to be present to receive assistance when needed. Disasters, as commonly understood, fall into two categories: those caused by human actions, such as war and terrorism, and those caused by natural events like floods, storms, earthquakes, etc. Beyond categorizing catastrophes, there are two main phases for actions in each case: before and after the event. Risk mitigation and planning fall under the pre-miss category, while relief and reconstruction fall under the post-miss category. This poses a significant challenge in the field of humanitarian logistics. The problem discussed here is designed for post-miss scenarios, specifically addressing demand regions (I), such as cities or towns, in the logistic chain problem illustrated in Figure 1. In the event of a disaster, these regions may experience building damage, destruction, casualties, and other negative outcomes.
Each region (I) in the logistic chain problem has J health and medical facilities providing S services. Some of these facilities may suffer damage or destruction during a disaster, making them unable to assist victims. The facilities that have not been affected by the disaster are responsible for aiding the victims. However, due to factors such as increased demand for relief supplies and crowded situations, these facilities may not fully satisfy the victims’ demands. Therefore, mobile relief centers are required. The key question is the following: where should these centers be located to ensure quick assistance for all those in need? To answer this question, it is essential to note that relief centers are effective when they can deliver the required services in the shortest possible time. Another critical concern is how to locate relief centers with the necessary capacity to move and store supplies required for adequate service delivery to the victims. Additionally, K warehouse and distribution centers should be strategically located to meet the needs of both support centers and the remaining centers under inventory regulations. This article considers two types of shelters for victims based on S1 and S2 services, with the first shelter providing S1 first aid (ambulatory medical services) and the second shelter offering S2 medical and psychological care services.

3.1. Assumptions

The following assumptions are considered in solving the model:
  • For two types of services, there are two sorts of commodities.
  • Basic first aid is the first form of service, which requires the first type of product. Psychological medical aid is the second type of service, and it requires the second type of product.
  • The nearest square or rectangular form is what we think of as products and available space.
  • It is a straight line distance.
  • The space allotted for each warehouse is considered, and it is assumed that 90% of the space is used for the ideal order quantity, which represents the level of service provided by each warehouse and distribution center, and 10% is set aside for managers and high-level decision makers’ precautionary storage.
  • Products are not gender, age, or other features.
  • The importance coefficients for the first and second products in each warehouse are γ k and α k , respectively.
  • Any product’s delivery time demand follows a normal distribution. In this statement, it is assumed that the delivery time is a normal distribution function with a mean of μ k m L T and a standard deviation of σ k m L T .
    D k m L T ~ N ( μ k m L T ;   σ k m L T )
  • Only one kind of service is provided by each J relief center.
  • There is just one warehouse that covers each J relief center.
  • For each of the m = 1 ;   2 products—one for the first kind of service and two for the second—presumably, the precautionary reserve might fall between the following ranges.
    m = 1 0 S 1 S S 1 k 0.1 S k m = 2 0 S 2 S S 2 k 0.1 S k
  • There is no disease transmission between relief centers.
  • The commodities are not substitutes and have independent demand, i.e.,
c o v D k 1 L T ;   D k 2 L T = 0
In other words, the demand for both products 1 and 2 during the delivery period exists independently of one another.

3.2. Defining the Notations

Table 1 presents the indices, parameters, and variables used in the model.

3.3. Development of Mathematical Model

The first objective function shows the costs of the entire system, which includes the costs of locating warehouses and relief centers, as well as the costs of transporting injured people and products.
min Z 1 = S J f j y j s + K f k L k + S K J C s k j Z s k j + I J S C i j N s i j
min Z 2 = k L k ρ k e 1 2 r k s μ L T k s s σ L T k s 2 1 + r k s μ L T k s s σ L T k s 2 Q k 2 π
The second objective function aims to provide better services. This objective function tries to reduce the shortage of warehouses from providing products to customers.
X j k R j k L k ;   j ; k
S y j s 1 ;   j
K X j k = S y j s ;   j
N s i j W s i y j s ;   i ; j ; s
J N s i j = W s i ; i ; s
I N s i j q s j y s j ;   j ; s
K Z s k j R k j = I N s i j ;   s ; j
J Z s k j I m a x k s ;   s ;   k
D s k = J Z s k j ;   s ; k
I m a x k s = Q s k + S S s k L k ;   s ; k
I m a x k = S I m a x k s ;   k
S S s k Q s k 0.9 S k ;   k
S 1 k α k S S 1 k + S 2 k γ k S S 2 k 0.1 S k ;   k
Q k = s Q s k ;   k
r k = S μ L T k s + S S k ;   k
α k = D s = 1 k s D s k ;   k
γ k = D s = 2 k s D s k ;   k
S S k = m S S s k ;   k
γ k + α k = 1 ;   k
ρ k = φ 1 p ( Z < O m 1 ) + ψ 1 p ( Z < O m 2 ) ;   k
X j k ; y s j ; L k ( 0 ;   1 )
0 γ k ; α k ; ρ k 1
S k ; S k s ; φ ; ψ ; R j k ; C s i j ; C i j ; f j ; f k > 0
S S k ; D k s ; Q k s ; w s i ; r k ; D k s L T ; I k m a x ; I k s m a x ; N s i j ; S S s k ; Z s k j 0   &   i n t e g e r
If the relief center is within the warehouse’s coverage radius, then, according to constraint 3, it will be assigned to warehouse k. Constraint 4 ensures that every relief center offers a maximum of one service (the established relief centers provide exactly one service). The relief center j must offer service if it is allocated to a warehouse, according to Constraint 5. As long as warehouse k is present and offering service s, constraint 6 ensures that if demand point i is the one requesting service s, it will be assigned to relief center j. Constraint 7 stipulates that wounded people are sent to existing relief centers when they request assistance. Constraint 8 also reveals how many relief centers are available. Constraint 9 displays the remaining applicants for services allotted to each relief center, as well as the products acquired from existing warehouses that correspond to each type of service. Constraint 10 refers to the warehouse’s capacity, while Constraint 11 indicates the volume of each warehouse’s demand for services-related commodities. The maximum inventory of each type of product in the kth warehouse is shown in constraint 12. The maximum capacity or inventory of the kth warehouse is shown in constraint 13. The area needed to store both types of products in a precautionary manner must not exceed the amount of space allowed in the kth warehouse, according to constraint 14. Constraint 15 displays the entire stock of both commodities together with the precautionary stock percentage. The total number of orders that the kth warehouse will have is indicated by constraint 16. The ordering point for the kth warehouse is shown in constraint 17. The importance factor of service s in the kth warehouse is shown by constraints 18 and 19. Constraint 18 applies to service type one in warehouse k, and constraint 19 applies to service type two in warehouse k. Moreover, constraint 20 indicates the total precautionary stock in the kth warehouse. The importance coefficients for each type of service must be equal to one, according to constraint 21. Constraint 22 also illustrates the loss brought on by the scarcity of commodities in the kth warehouse. The limitations of the decision variables and parameters are shown by constraints 23 to 26.
Three probable inventory scenarios may arise depending on the demands of the relief center in each of the kth warehouses:
  • When the commodity type o is terminated: m 1 = 0 I k m 1 m a x = 0 .
  • When the commodity type two is terminated: m 21 = 0 I k m 2 m a x = 0 .
  • Both kinds of products have been finished. In such a situation, this state’s representation is equal to the total of the two states mentioned above.
Accordingly, the loss of kth warehouse is calculated, and if the commodities type 1 and 2 are not enough, the penalties φ and ψ will be incurred for the system, respectively.
All losses are expressed by the following formula:
p I k m 1 m a x = 0 I k m 1 m a x D k m 1 L T = φ p I k m 2 m a x = 0 I k m 2 m a x D k m 2 L T = ψ
In addition, the loss of warehouse k is obtained by Equation (28):
ρ k = p I k m 1 m a x = 0 I k m 1 m a x D k m 1 L T * p ( I k m 1 m a x D k m 1 L T ) + p I k m 2 m a x = 0 I k m 2 m a x D k m 2 L T * p ( I k m 2 m a x D k m 2 L T )
The probable deficiency is also formulated as follows:
p I k m 1 m a x D k m 1 L T = 1 p D k m 1 L T < I k m 1 m a x = 1 p I k m 1 m a x μ k m 1 L T σ k m 1 L T = 1 p ( Z < O m 1 )
And, for the second product:
p I k m 2 m a x D k m 2 L T = 1 p D k m 2 L T < I k m 2 m a x = 1 p I k m 2 m a x μ k m 2 L T σ k m 2 L T = 1 p ( Z < O m 2 )
where Z ~ N ( 0 ;   1 ) .
Equation (31) is then used to compute the loss. Additionally, the first type of service calls for the first type of product, while the second type of service calls for the second type of product.
ρ k = φ 1 p ( Z < O m 1 + ψ 1 p ( Z < O m 2

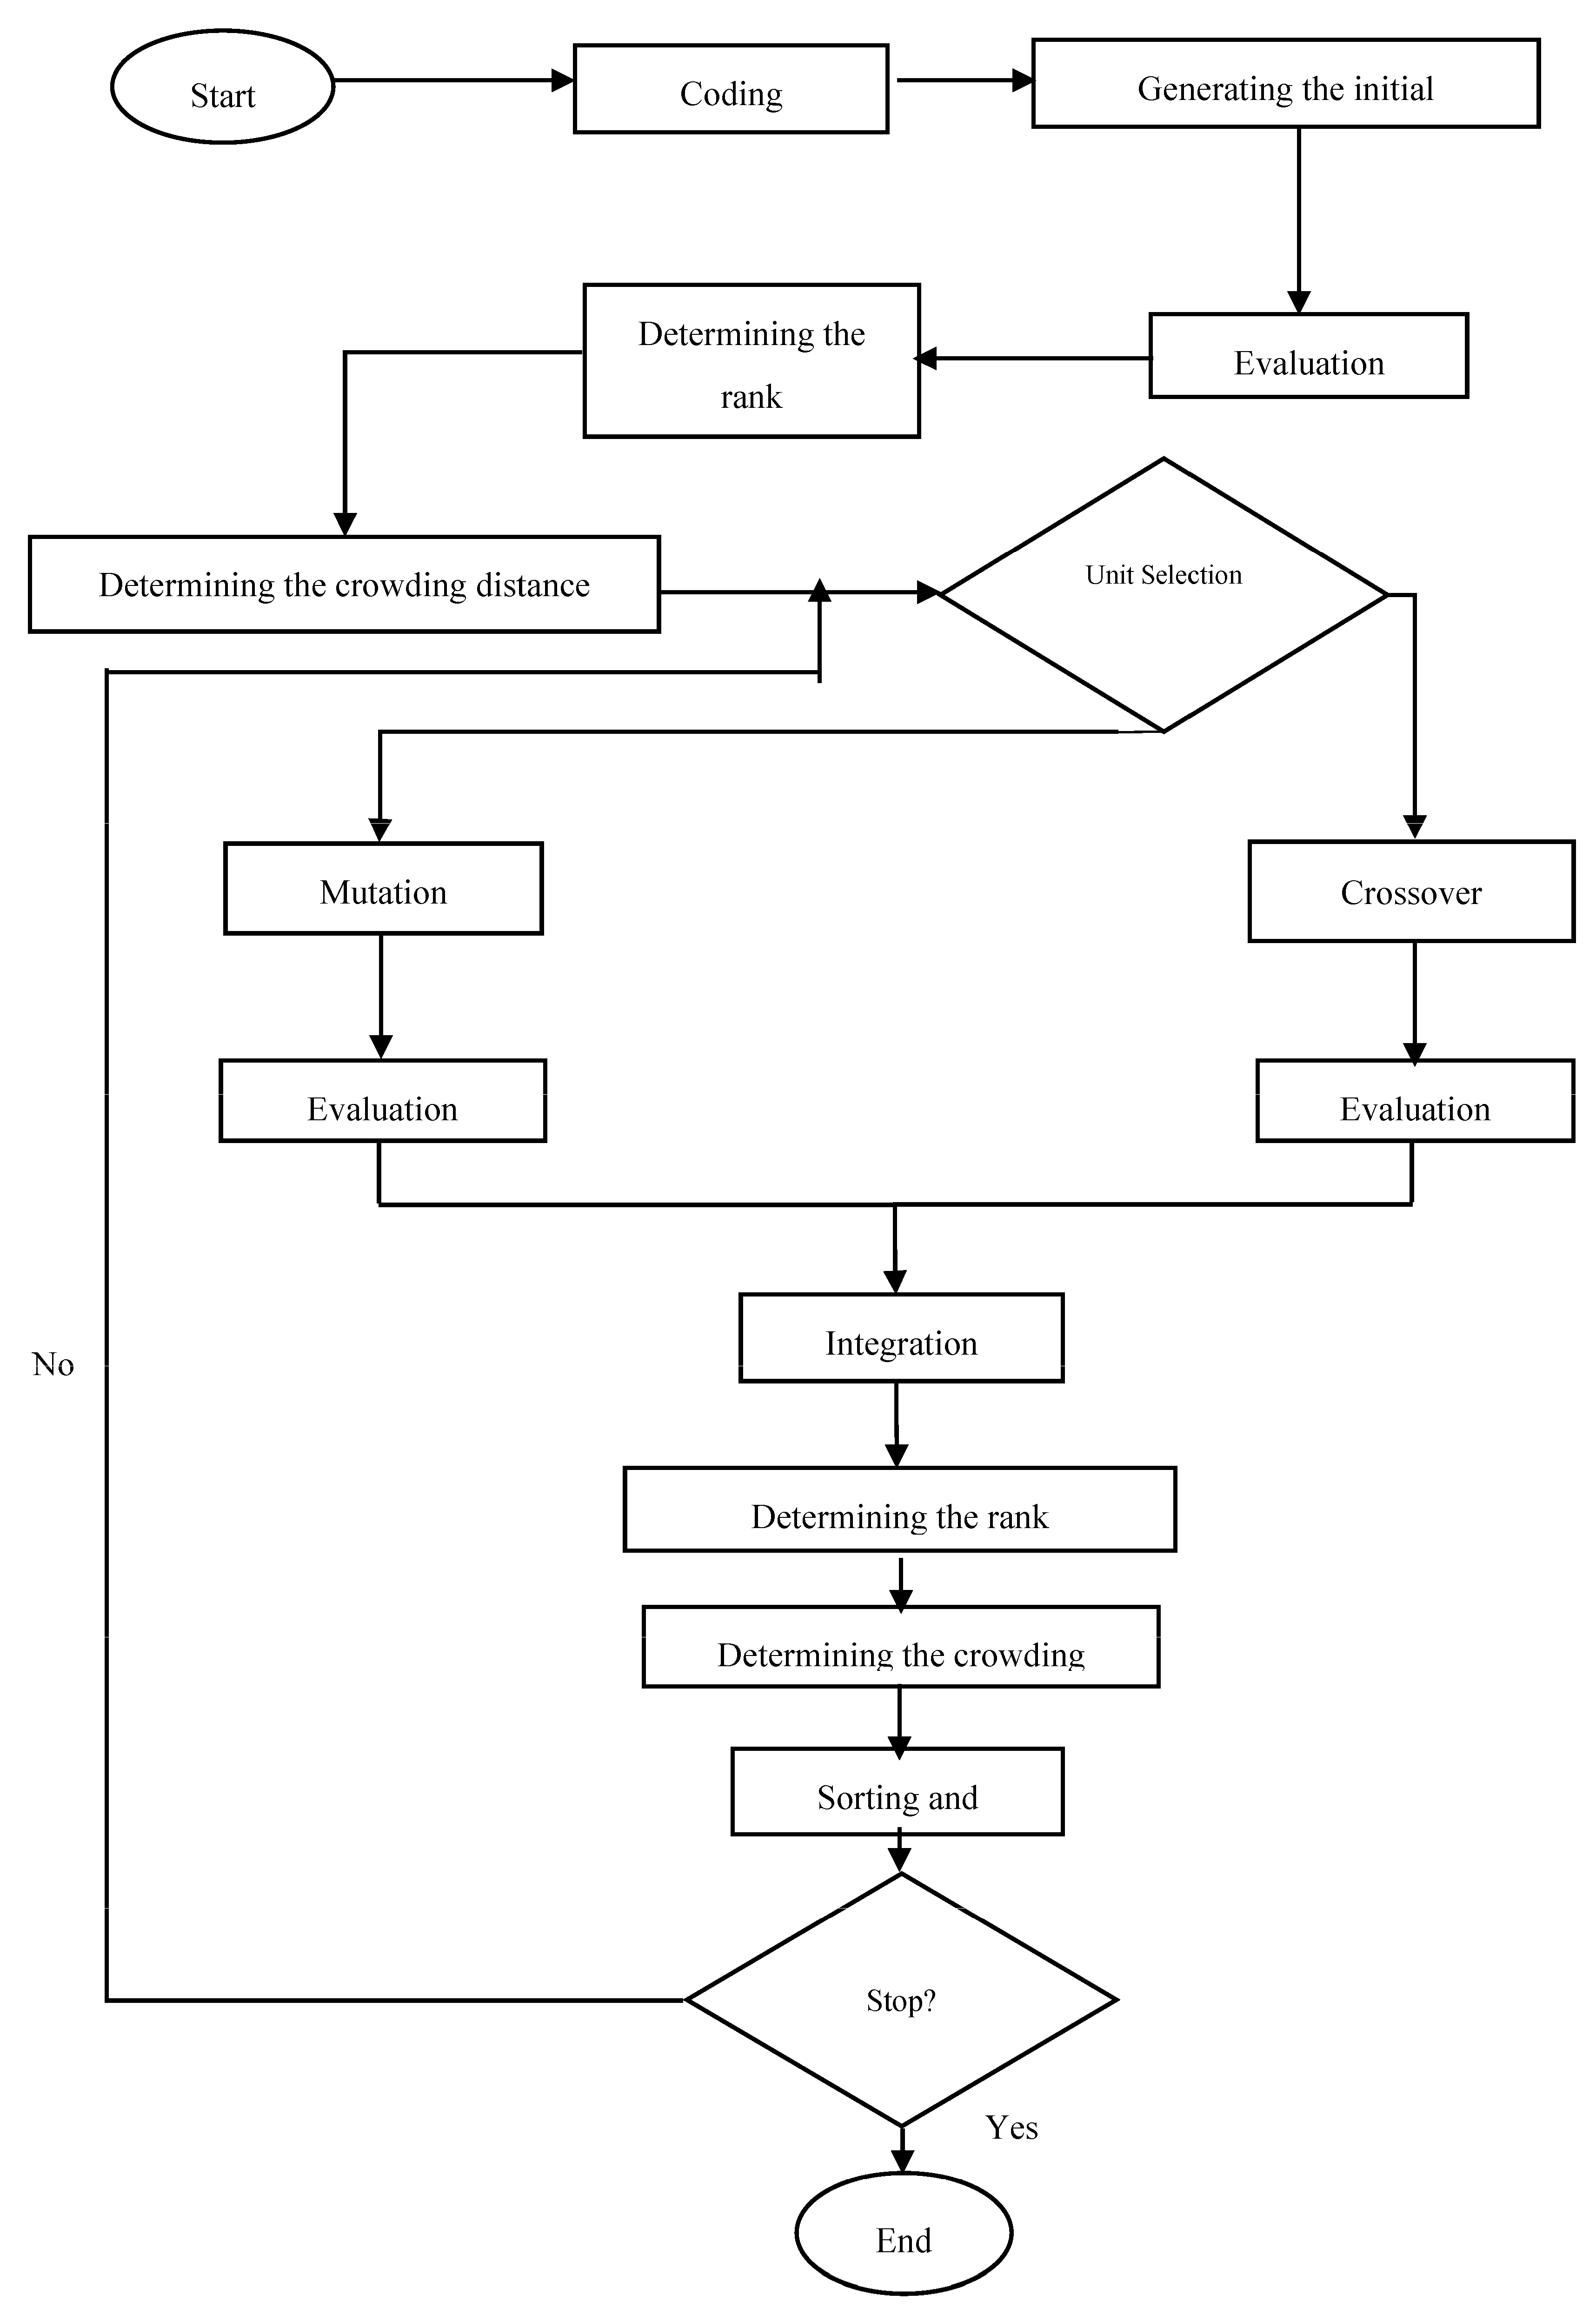
4. Solution Algorithm

There are many metaheuristic algorithms such as goat search algorithms that have high operational efficiency. But in this article, the NSGAII algorithm is used [33]. The NSGA-II method, which was developed by [33] and is one of the most well-known and effective ones available for addressing multi-objective optimization problems, is shown in Figure 2. This elitist multi-objective algorithm has been proven to be useful in a variety of problems by the numerous studies that have used it to discover the set of Pareto solutions. The advantages of this optimization method include the following:
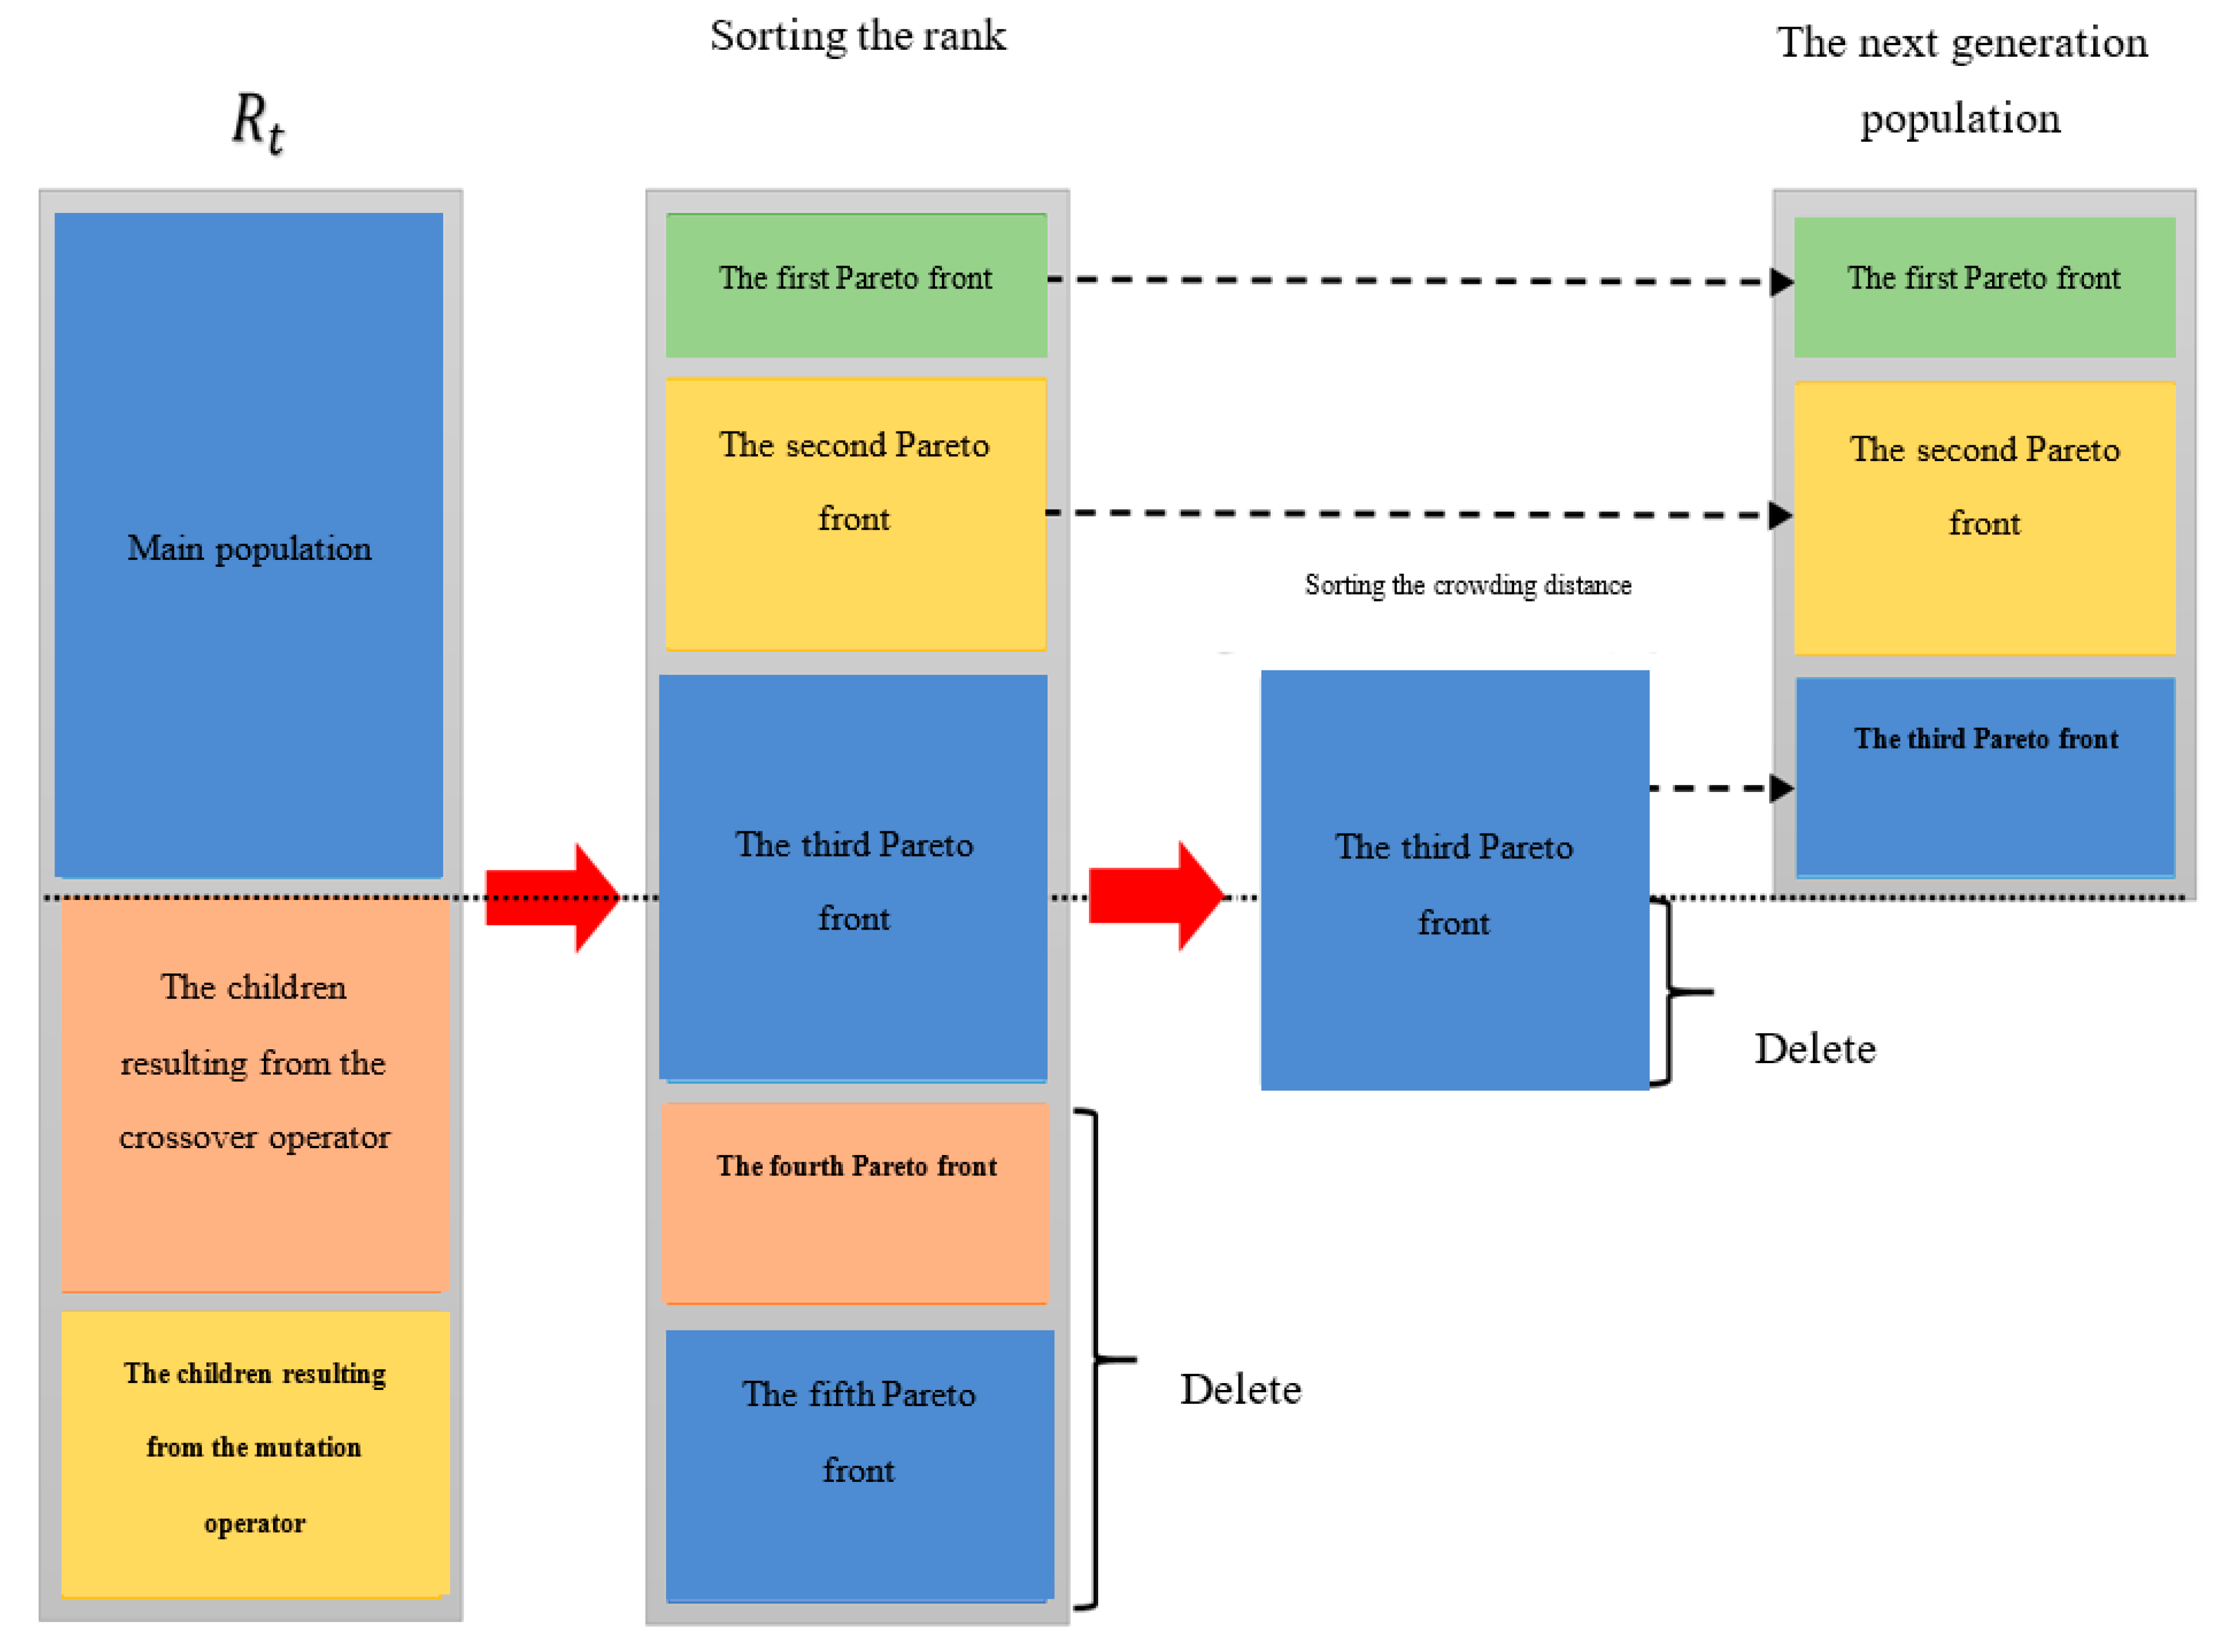
  • An answer that has more points than any other answer is unquestionably superior. Depending on how many superior answers there are, the answers are ranked and arranged.
  • Competence (fitness) is assigned to the answers based on their rank and non-predominance of other answers.
  • To alter the answers’ dispersion positively and spread them equally over the search space, the crowding distance is utilized to choose amongst similar answers.
  • Saving and preserving the non-dominant answers from the algorithm’s earlier phases (elitism).
Figure 2. The flowchart of algorithm NSGA-II.
Logistics 08 00009 g002
  • Step 1. Coding
How to provide the problem solutions is the first step in employing evolutionary algorithms. The chromosomal problem has a solution, which is coded as three distinct integer strings in the suggested algorithms to display it: The stated problem indicates that the priority-oriented approach is the best strategy for coding the problem. The designed chromosome in this study is a (K + J + I) string or vector that is employed to generate a solution, where K, J, and I represent the number of warehouses, the number of relief centers (supply centers), and the number of areas requesting aid, respectively. The inserted chromosome indicates that the genotype has three gene strands, the first of which is associated with warehouses, the second to relief centers, and the third to the applicant’s locations. This chromosome is randomly populated with actual integers between 0 and 1. The genotype’s genes are then ordered according to these actual numbers. These sorted numbers indicate either the priority of the assistance centers to link to the sorted warehouses or the priority of the applicant areas in allocation to the prioritized aid centers. By changing these priorities, genetic algorithm operators produce many scenarios, such as constructing alternative warehouses or relief centers to discover the most affordable or comprehensive coverage for the impacted areas. A sample chromosome for a case study with k = 3 warehouses, j = 3 number of relief centers, and i = 7 service request areas is shown in Figure 3.
We need a decoding policy to solve this problem using specified decision variables from the provided chromosome in a significant and realistic manner. To achieve this, we begin with the service-requested sections, which make up the last portion of this chromosome. The decoding process is divided into two phases: the phase in which each district’s affected residents are assigned to relief centers, and the phase in which these centers are assigned to warehouses. The affected areas with the highest priority are chosen, and their residents are assigned to the relief centers with the highest priority on their ranking list in the first phase. This is performed following the sorting of the real numbers of all three strands of this chromosome and the determination of the priority of their components, as long as the capacity of the relief center is responsive. People from each district who require a type 1 service are first assigned to the relief centers with the highest priority because it is not known in advance which of the two services each relief center will offer. Unassigned members are kept on a list to be assigned to the relief center with the next priority since the capacity of the relief center restricts its ability to reach all impacted members in the chosen locations. For example, considering the given chromosome, if Relief Center 3 can accommodate 30 people for Service Type 1, and the affected population in the Priority Areas is 10, 15, 20, 5, 10, and 17, then all residents of Districts 5 and 1 and only 5 of the injured residents of District 2 will be assigned to Relief Center 3. As soon as Relief Center 3’s capacity is reached, the remaining 15 residents of District 2 and residents from other regions (with designated priority) will be sent to Relief Center 2 to the extent that its capacity permits. This process continues until every affected person is allocated to a relief center to receive type 1 assistance. After identifying and establishing relief centers offering type 1 services, the same procedure is followed for service type 2, selecting the remaining centers in the same priority order to deliver type 2 service to the areas in the same order as in the first stage. Once all applicants in the application regions have been assigned to receive a type 1 service, the relief centers offering type 1 services are identified, established, and deleted from the list. Similar steps are then followed for type 2 services. Until now, we have decided which relief centers will be used, what services they will each offer, and which relief centers will be assigned to the afflicted residents in each district (variables y s j and N s i j ).
Once the affected members from the request regions have been assigned to the relief centers, the quantity of demand for each product of the service provider’s relief center, s, associated with this product is calculated (equal to the total number of members assigned to the request areas to that center). The second phase has now started. Similar to the previous step, we will now assign the opened relief centers with the utmost priority to the warehouse with the maximum priority in the sorted list (so long as 90% of that warehouse’s available space capacity is devoted to storing and maintaining merchandise associated with any type of service rendered by the relief centers). Here, just two points require particular attention. The first is that a relief center may only be allocated to a warehouse if it is within its coverage area. If, for instance, Relief Center 3 is not within the range of Warehouse 3, the allocation procedure cannot be completed, and we proceed to Warehouse 1. Second, because each relief center may only be allocated to one warehouse, if the demand for a center’s supplies exceeds the warehouse’s capacity, that warehouse cannot be chosen to serve that center’s requirements, and we will move on to the warehouse with the next highest priority. The optimal order quantity for each warehouse, the maximum inventory levels in each warehouse, etc., may all be simply determined by assigning relief centers to the warehouses constructed under the set priority.
  • Step 2. Establishing the initial population
A set of chromosomes is produced as the starting population when an appropriate procedure for turning each solution into a problem into a chromosome has been specified. The number of members in this collection (nPop), which is often created at random, is typically influenced by the size of the chromosome. The initial selection population must be larger than the situation where the chromosomes have 16 genes, for instance, if the problem’s chromosomes contain 32 genes.
  • Step 3. Evaluation
The genetic algorithm’s ability to alternatively operate on the answer space (genotype) and the objective function space (phenotype) is one of its key characteristics. By decoding each chromosome in the genotype space and calculating its objective functions in this stage, a point in the phenotypic space will be assigned to each chromosome.
  • Step 4. Determining the rank
The number of times each chromosome is defeated is now calculated by comparing all the responses corresponding to the chromosomes in the phenotypic space. After conducting all of the pairwise comparisons between chromosomes, all of the responses are compiled into sets known as “Pareto fronts” based on the frequency of recessives so that the members in the first front will be an entirely unsurpassed set by the other members in the current population. This procedure continues in the same way in other categories until all the members in each front are assigned a rank based on the front’s number. The members of the second front are only defeated by the members of the first front on the same basis.
  • Step 5. Determining the crowding distance
This stage calculates the crowding distance (density) for each response in each category and establishes how close an answer should be to other answers in that category. The answer will have a longer crowding distance if it is situated in a calmer area. The average distance between two neighboring solutions (within one front) is determined for each objective function (m), and their aggregate is represented by di to estimate the crowding distance of a solution such as i.
d i = m = 1 N f m i + 1 f m i 1 f m m a x f m m i n
As shown in Figure 4, the quantity di is an estimation of a rectangle, the vertices of which are made up of the solutions that are closest to solution i. For a two-objective problem, the crowding distance of solution i, which is depicted in this figure with broken lines, may be noticed.
  • Step 6. Parent selection
The NSGA-II algorithm employs a binary tournament to choose the parent answer. In this approach, two members are randomly selected from each generation’s responses, and their responses are then compared. The answer with the lower rating will be selected when two answers are ranked against one another. If the rankings of the two answers are equal, the crowding distance, the second criterion, will be used as the tiebreaker, and the member with the greatest crowding distance will be regarded as the parent.
  • Step 7. Crossover
The first stage in performing the crossover is choosing two parents based on the previous step. Any of the algorithm operators used to generate new generations can be applied by using them on the relevant regions of the two chosen chromosomes. For example, consider the first part of both chromosomes (related to warehouses), the second part of both chromosomes (relief center section), and the part of the applicant’s regions.
  • Step 8. Evaluation
The generated offspring are evaluated using the crossover operator in this stage. To do this, the chromosomes of each child are first decoded, and then their respective objective functions are computed.
  • Step 9. Mutation
The genetic algorithm used to create the parents also includes the mutation operator, which causes the children to exhibit features not inherited from either of the parents. To avoid the algorithm’s early convergence to local optimum solutions, this operation helps in finding unknown or missing chromosomes in the population.
  • Step 10. Evaluation
The created children are evaluated using the mutation operator in this stage. The objective functions are determined for the children once their chromosomes have been decoded for this purpose.
  • Step 11. Integration
In this stage, the primary population is combined with the children produced by the crossover and mutation operators to create the bigger population known as Rt.
  • Step 12. Determining the rank
The number of times each chromosome is recessive is now calculated by comparing all Rt population members to one another in pairs. The rank of each chromosome and the number of the front in which it is placed will then be determined using this information.
  • Step 13. Determining the crowding distance
This step calculates the crowding distance for each member in the population Rt following what was indicated in step 5 and determines how close together the answers are.
  • Step 14. Sorting and deletion
Population sorting is completed once the main population and the children are integrated, and their crowding rank and distance are calculated. The members are then sorted according to their rank in ascending order. Accordingly, the answers having a lower rank will be positioned at a lower level. However, another sorting will be carried out among members whose ranks are equal based on the crowding distance. The answers with the greatest crowding distance are shown first in this manner.
Members are now chosen from the population Rt sorted population at the top to create the starting population (nPop). The remainder of the audience is dismissed. This is best illustrated in Figure 5.
  • Step 15. Analyzing the termination condition
The final step of the algorithm examines the final requirement for completion. If it is met, the algorithm stops; if not, it proceeds to step 6 once more. There are several approaches for the termination condition, such as repeating the algorithm after 100 execution steps or requiring a variation of less than two successive results [35].

5. Results and Model Solution

First, using the GAMS software win32, 25.1.2, the problem is written in small dimensions to properly and correctly solve the model. In addition, the LP-Metric method and Couenne solver have been employed in the system with AMD E1 1.5 GHZ CPU to precisely solve the single-objective model. After 100 iterations, the solution to this problem for the given case was found, and it took 5.516 s to reach the ideal value of 7.977992 × 10 0.01 . Considering our analysis of the GAMS win32, 25.1.2 instance, the first objective function is 11,775, and the second one is 0.0008998. In order, the first value represents the minimum cost of establishing relief centers, followed by the cost of building warehouses, the cost of transporting vehicles, and the second value is the cost of transporting the injured and reducing the cost of the lack of storage.
The model symbols and input parameters:
i = 6
j = 4
k = 3
s = 2
f j = [ 1000 ;   1500 ;   2000 ;   1500 ]
f k = [ 2000 ;   3500 ;   2500 ]
D k = 200 ;   100 ;   100
q s j = 60 60 30 60 75 75 70 75
S R F s = 1 1 1 1 1 1
μ = 10 10 10 10 10 10
σ = 5 5 5 5 5 5
R j k = 1 0 0 1 0 0 0 1 1 0 1 1
W s i = 5 10 5 10 10 15 10 15 15 10 20 15
Q s k = 10 10 10 10 10 10
φ = 2
ψ = 2
ρ = φ 1 0.95 + ξ ( 1 0.95 )
C 1 k j = 6 8 6 7 5 10 10 5 5 9 7 5
C 2 k j = 10 6 6 10 8 8 9 8 6 7 7 5
C i j = 8 9 6 8 9 6 5 8 5 10 6 6 8 9 8 7 7 5 6 5 7 6 8 8
The evolutionary algorithm with quadratic non-dominant ranking has been applied in MATLAB R2015b software with pseudo-code in Algorithm 1 to solve the model in various and large dimensions. The results are shown in Table 2 with various dimensions.
Algorithm 1. The NSGA II algorithm pseudo code.
1: Initial population: the number of population
2: Generate random population S
3: Evaluate object values
4: Assign rank
5: Generate children population for size S
6: For i = 1: Max do
7: For each parent and child S do
8:  Assign rank
9:  Generate sets of non-dominated solutions
10:  Cross over and mutation
11:  Loop based on existing solution to next generation
12: End For
13: Select point on the lower front with high distance
14: Generate next generation
15: End For
Two samples of the parameters for coverage radius and capacity have been solved in the range of −20% to 20% in this study to examine the impact of the parameters on the objective functions. It should be emphasized that these characteristics do not only serve as analytical tools; they may also be used to determine things like product importance coefficients, initial population, warehouse and distribution center capacity, etc. Furthermore, after modifying the parameters, we arrived at the findings shown below for a few parameters. Each type of population in need of type S service in a given area ranges from 500 to 2000 people; the radius of coverage is 10 to 100 km; the service level at each warehouse and distribution center ranges from 90% to 98%; the cost of transfers for each person ranges from $500 to $1000; and the cost of transfers for commodities ranges from $300 to $1000, etc. The results of the solution in various values are shown in Table 3 if the radius parameter of the kth warehouse cover is considered in the range of −20% to 20% and other parameters are assumed to be fixed.
Moreover, the parameter of the relief center’s capacity is considered and solved in the range of −20% to 20% in Table 4.

6. Discussion and Conclusions

Natural disasters claim thousands of lives and displace millions each year. Therefore, effective planning is crucial to deal with these events before they occur. These findings indicate that pre-disaster lateral transport planning, buyback mechanisms, multi-period optimization, proposed mitigation measures, and valuable services improve the efficiency of disaster response in terms of order, coverage, prevention cost, and capital and stock loss risk. Humanitarian logistics plays a vital role in preventing severe consequences during disasters, given the historical significance of human lives and the occurrence of numerous disasters resulting in serious injuries and deaths. With the growth of the population, industries, technology, and facilities since the emergence of humans, human activities have significantly disrupted nature. Examples include the excessive use of water causing ground undermining, leading to landslides and earthquakes, and the overuse of fossil fuels contributing to ozone layer degradation, increased drought, and other environmental issues. Additionally, human desires have been a root cause of wars and terrorist attacks throughout history, such as World Wars I and II, the ISIS invasion of Iraq, and the Corona epidemic.
This study analyzes the humanitarian logistics model in the response phase, emphasizing the importance of providing prompt relief to refugees. In addition to addressing location issues, the authors also tackle inventory management, considering two types of products for different relief centers. The study estimates consumption coefficients, precautionary storage, and inventory order points for two consumer commodity categories, determining the optimal order quantity. The second objective is to reduce shortages in established warehouses, aiming to minimize inventory shortages and service gaps for victims. The model incorporates advances in location and inventory, suggesting the use of drone navigation to identify optimal paths. Machine learning techniques are recommended to construct a demand prediction model based on severity, disaster type, and historical data. To address perishability concerns, this study suggests incorporating perishable inventory with time frames in the model. The inclusion of centers for gathering assistance from non-governmental organizations is proposed for a more comprehensive supply chain representation. Considering sensitivity analysis results, pre-disaster budgets significantly impact the disaster response performance. Therefore, financial planning and management can enhance operational efficiency. However, like other studies, this research has limitations, such as insufficient cooperation from some researchers in obtaining information and the absence of an official database for some required data, leading to reliance on expert assistance.

Author Contributions

Conceptualization, M.M.D.; methodology, M.M.D.; writing—review and editing, M.M.D. and A.P.C.; formal analysis, A.P.C. and P.G.; data curation, A.P.C.; project administration, P.G.; supervision, P.G.; visualization, P.G.; validation, D.J.; software, D.J.; investigation, D.J. All authors have read and agreed to the published version of the manuscript.

Funding

This research received no external funding.

Data Availability Statement

The data that support the findings of this study are available from the corresponding author, upon reasonable request.

Conflicts of Interest

The authors declare no conflicts of interest.

References

  1. Kani, S. Demography of natural disaster (in Persian). Popul. Quraterly 2018, 26, 155–180. [Google Scholar]
  2. Townsend. Risk Insurance in village India. Econometria 1994, 62, 539–591. [Google Scholar] [CrossRef]
  3. Tomasini, R.; Van, W. Humanitarian Logistics; Palgrave Machillan: London, UK, 2009. [Google Scholar] [CrossRef]
  4. Van Wassenhove, L. Humanitarian aid logistics: Supply chain management in high gear. J. Oper. Res. Soc. 2006, 57, 475–489. [Google Scholar] [CrossRef]
  5. Thomas, A.K. Fro Logistics to supply chain Management: The path forward in the humanitarian Sector. Fritz Inst. 2005, 15, 1–15. [Google Scholar]
  6. CRED Crunch Newsletter. Disaster in Year Review 2020: Global Trends and Perspectives. Reliefweb. Available online: https://reliefweb.int/report/world/cred-crunch-newsletter-issue-no-62-may-2021-disaster-year-review-2020-global-trends-and (accessed on 14 May 2021).
  7. Cozzolino, A. Humanitarian Logistics Cross-sector Cooperation in Disaster Relief Management; Springer: Berlin/Heidelberg, Germany, 2012. [Google Scholar] [CrossRef]
  8. Jaher, M.; Jensen, L.-M.; Listou, T. Theory development in humanitarian logistics: A framework and three cases. Manag. Res. News 2009, 32, 1008–1023. [Google Scholar] [CrossRef]
  9. Pérez-Galarce, F.; Canales, L.J.; Vergara, C.; Candia-Véjar, A. An optimization model for the location of disaster refuges. Socio-Econ. Plan. Sci. 2017, 59, 56–66. [Google Scholar] [CrossRef]
  10. Melo, M.; Nickel, S.; Saldanha-da-Gama, F. Facility location and supply chain management—A review. Eur. J. Oper. Res. 2009, 196, 401–412. [Google Scholar] [CrossRef]
  11. Zandbiglari, K.; Ameri, F.; Javadi, M. Capability Language Processing (CLP): Classification and Ranking of Manufacturing Suppliers Based on Unstructured Capability Data. In Proceedings of the International Design Engineering Technical Conferences and Computers and Information in Engineering Conference, Virtual, Online, 17–19 August 2021; American Society of Mechanical Engineers: New York, NY, USA, 2021; Volume 85376, p. V002T02A065. [Google Scholar]
  12. Tancrez, J.-S.; Lange, J.-C.; Semal, P. A location-inventory model for large three-level supply chains. Transp. Res. Part E Logist. Transp. Rev. 2012, 48, 485–502. [Google Scholar] [CrossRef]
  13. Diabat, A.; Richard, J.-P.P.; Codrington, C.W. A Lagrangian relaxation approach to simultaneous strategic and tactical planning in supply chain design. Ann. Oper. Res. 2011, 203, 55–80. [Google Scholar] [CrossRef]
  14. Diabat, A.; Dehghani, E.; Jabbarzadeh, A. Incorporating location and inventory decisions into a supply chain design problem with uncertain demands and lead times. J. Manuf. Syst. 2017, 43, 139–149. [Google Scholar] [CrossRef]
  15. Emami, A.; Hazrati, R.; Delshad, M.M.; Pouri, K.; Khasraghi, A.S.; Chobar, A.P. A novel mathematical model for emergency transfer point and facility location. J. Eng. Res. 2023, in press. [Google Scholar] [CrossRef]
  16. Kilic, F.; Kara, B.; Bozkaya, B. Locating temporary shelter areas after an earthquake: A case for Turkey. Eur. J. Oper. Res. 2015, 243, 323–332. [Google Scholar] [CrossRef]
  17. Espejo-Díaz, J.A.; Guerrero, W.J. A bi-objective model for the humanitarian aid distribution problem: Analyzing the trade-off between shortage and inventory at risk. In Proceedings of the Applied Computer Sciences in Engineering: 6th Workshop on Engineering Applications, WEA 2019, Santa Marta, Colombia, 16–18 October 2019; Proceedings 6. Springer International Publishing: Berlin/Heidelberg, Germany, 2019; pp. 752–763. [Google Scholar]
  18. Manopiniwes, W.; Irohara, T. Stochastic optimisation model for integrated decisions on relief supply chains: Preparedness for disaster response. Int. J. Prod. Res. 2017, 55, 979–996. [Google Scholar] [CrossRef]
  19. Ansari, M.; Borrero, J.S.; Lozano, L. Robust Minimum-Cost Flow Problems Under Multiple Ripple Effect Disruptions. INFORMS J. Comput. 2023, 35, 83–103. [Google Scholar] [CrossRef]
  20. Vahdani, B.; Soltani, M.; Yazdani, M.; Mousavi, S.M. A three level joint location-inventory problem with correlated demand, shortages and periodic review system: Robust meta-heuristics. Comput. Ind. Eng. 2017, 109, 113–129. [Google Scholar] [CrossRef]
  21. Demirbas, S.; Alp, E.M. Determination of equivalent warehouses in humanitarian logistics by reallocation of multiple item type inventories. Int. J. Disaster Risk Reduct. 2021, 66, 102603. [Google Scholar] [CrossRef]
  22. Yang, Y.; Yin, Y.; Wang, D.; Ignatius, J.; Cheng, T.; Dhamotharan, L. Distributionally robust multi-period loca-tion-allocation with multiple resources and capacity levels in humanitarian logistics. Eur. J. Oper. Res. 2023, 305, 1042–1062. [Google Scholar] [CrossRef]
  23. Liu, K.; Zhang, H.; Zhang, Z.-H. The efficiency, equity and effectiveness of location strategies in humanitarian logistics: A robust chance-constrained approach. Transp. Res. Part E Logist. Transp. Rev. 2021, 156, 102521. [Google Scholar] [CrossRef]
  24. Fuqua, D.; Hespeler, S. Commodity demand forecasting using modulated rank reduction for humanitarian logistics planning. Expert Syst. Appl. 2022, 206, 117753. [Google Scholar] [CrossRef]
  25. Stienen, V.; Wagenaar, J.; Hertog, D.D.; Fleuren, H. Optimal depot locations for humanitarian logistics service providers using robust optimization. Omega 2021, 104, 102494. [Google Scholar] [CrossRef]
  26. Chobar, A.P.; Adibi, M.A.; Kazemi, A. Multi-objective hub-spoke network design of perishable tourism products using combination machine learning and meta-heuristic algorithms. Environ. Dev. Sustain. 2022, 1–28. [Google Scholar] [CrossRef]
  27. Loree, N.; Aros-Vera, F. Points of distribution location and inventory management model for Post-Disaster Humanitarian Logistics. Transp. Res. Part E 2018, 116, 1–24. [Google Scholar] [CrossRef]
  28. Cotes, N.; Cantillo, V. Including deprivation costs in facility location models for humanitarian relief logistics. Socio-Econ. Plan. Sci. 2019, 65, 89–100. [Google Scholar] [CrossRef]
  29. Ghorbani, M.; Ramezanian, R. Integration of carrier selection and supplier selection problem in humanitarian logistics. Comput. Ind. Eng. 2020, 144, 106473. [Google Scholar] [CrossRef]
  30. Sheikholeslami, M.; Zarrinpoor, N. Designing an integrated humanitarian logistics network for the preparedness and response phases under uncertainty. Socio-Econ. Plan. Sci. 2023, 86, 101496. [Google Scholar] [CrossRef]
  31. Kawase, R.; Iryo, T. Optimal stochastic inventory-distribution strategy for damaged multi-echelon humanitarian logistics network. Eur. J. Oper. Res. 2023, 309, 616–633. [Google Scholar] [CrossRef]
  32. Roh, S.Y.; Seo, Y.J. The Pre-positioned Warehouse Location Selection for International Humanitarian Relief Logistics. Asian J. Shipp. Logist. 2018, 34, 297–307. [Google Scholar] [CrossRef]
  33. De, S.K. The goat search algorithms. Artif. Intell. Rev. 2023, 56, 8265–8301. [Google Scholar] [CrossRef]
  34. Boonmee, C.; Arimura, M.; Asada, M. Facility Location Optimization Model for Emergency Humanitarian Logistics. Int. J. Disaster Risk Reduct. 2017, 24, 485–498. [Google Scholar] [CrossRef]
  35. Yeh, C.T. An improved NSGA2 to solve a bi-objective optimization problem of multi-state electronic transaction network. Reliab. Eng. Syst. Saf. 2019, 191, 106578. [Google Scholar]
Figure 1. Three-level network of humanitarian logistics.
Logistics 08 00009 g001
Figure 3. A sample problem chromosome.
Logistics 08 00009 g003
Figure 4. The crowding distance for the answer i.
Logistics 08 00009 g004
Figure 5. Sorting and deletion in NSGA-II and NRGA algorithms.
Logistics 08 00009 g005
Table 1. Parameter definition.
NotationDescription
iThe set of demand points
j The set of relief centers
k The set of warehouses
S The set of services
q s j The capacity of relief center j for services s
q s k The space occupied by each product unit for service s in warehouse k ( m 3 )
R j k 1 if the relief center is inside the warehouse’s service area; otherwise, 0.
W s i Number of injured people, demand point i, needing service s
f j The fixed cost of establishing a relief jth center
f k The fixed cost of establishing a kth warehouse
C i j The cost of delivering the injured person from the ith demand point to the jth relief center
C s k j The cost of delivering service s-related commodities from warehouse k to jth relief center
D k s The demand from kth warehouse
D k s L T The demand in the time of product m delivery at kth warehouse D k s L T ~ N ( μ k s L T ;   σ k s L T )
Q k s The value of optimal order of product m in kth warehouse
S k Available volume of kth warehouse ( m 3 )
I k M a x Maximum inventory (inventory level) of kth warehouse
I k s M a x The maximum inventory (inventory level) of product m in kth warehouse
r k Reorder point of kth warehouse
S S k Precautionary storage of kth warehouse
S S s k Precautionary storage of the product m in kth warehouse
ρ k Loss caused by a lack of products in kth warehouse
γ k The importance factor of service type one in kth warehouse
α k The importance factor of service type two in kth warehouse
φ The cost of lacking product one in the warehouse
ψ The cost of lacking product two in the warehouse
VariableDescription
X j k If the established warehouse k serves deployed relief center j, then the value is 1, otherwise, it is zero.
y s j 1 if service s is offered by the established relief center; otherwise, zero.
L k 1 if warehouse k is established, otherwise zero.
N s i j The number of people with the ith demand points in need of service s assigned to the established jth relief center.
Z s k j The number of people with ith demand points in need of service s assigned to the established jth relief center.
Table 2. NSGA II output in various dimensions.
Number of Permutations (Ways to Reach the Answer)Z2Z1Number of ServicesNumber of WarehousesNumber of Relief CentersNumber of Demand Points# Sample Problem
1440.000899811,75523461
5600.012116,983247102
18000.104522,0362610153
60000.302638,65421015204
11,0500.49942,74121317255
Table 3. Analyzing the coverage radius parameter and its influence on the objective functions.
Changing Procedure of Z2Z2Changing Procedure of Z1Z1 R j k
Decreasing0.000401Increasing18,371−20%
Decreasing0.000621Increasing14,956−10%
Base0.0008998Base11,7750%
Increasing0.001256Decreasing852310%
Increasing0.005482Decreasing497120%
Table 4. Analyzing the capacity parameter of the relief center and its influence on the objective functions.
Changing Procedure of Z2Z2Changing Procedure of Z1Z1 q j s
Decreasing0.000392Decreasing6672−20%
Decreasing0.000601Decreasing9563−10%
Base0.0008998Base11,7750%
Increasing0.001658Increasing13,28710%
Increasing0.010975Increasing15,98620%
Disclaimer/Publisher’s Note: The statements, opinions and data contained in all publications are solely those of the individual author(s) and contributor(s) and not of MDPI and/or the editor(s). MDPI and/or the editor(s) disclaim responsibility for any injury to people or property resulting from any ideas, methods, instructions or products referred to in the content.

