
Selecting Indicators to Assess the Sustainability of Urban Freight Transport Using a Multi-Criteria Analysis

Abstract
:1. Introduction
- How important is the use of indicators in evaluating the sustainability of a transport system?
- Which indicators should be used for assessing urban freight transport sustainability?
- What are the sustainability dimensions associated with these indicators?
- Do we have a standard list of indicators?
- What is the methodological approach that can be employed to select sustainability indicators?
- Which indicators can provide a comprehensive overview of the freight transport system?
2. Literature Review
2.1. Existing Approaches
2.2. Methods Used in Selecting Indicators
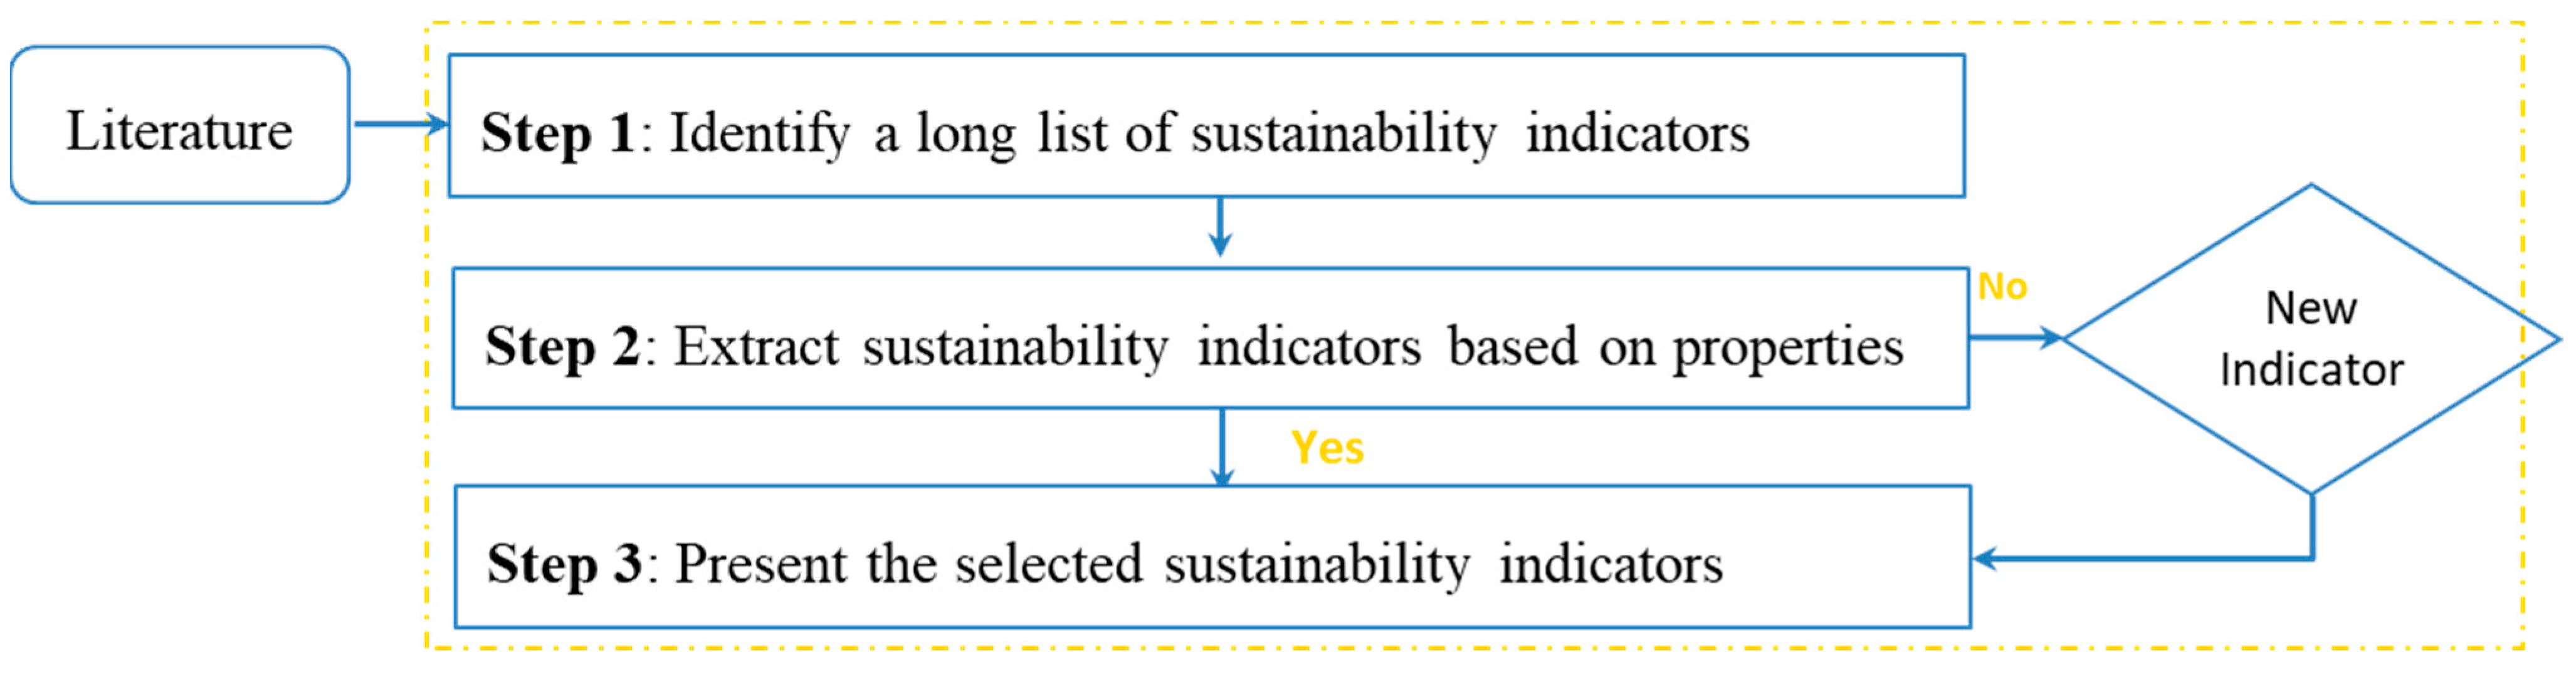
3. Methodology: Selecting Indicators of UFT
- Step 1 involves identifying a long list of indicators to assess UFT sustainability based on those introduced in the literature. These indicators are then categorized according to the sustainability dimensions selected in [27].
- Step 2 corresponds to selecting the most commonly used properties and extracting a reduced set of sustainability indicators.
- Step 3 consists of presenting in detail each selected sustainability indicator for the five dimensions above.
3.1. Long List of Sustainability Indicators
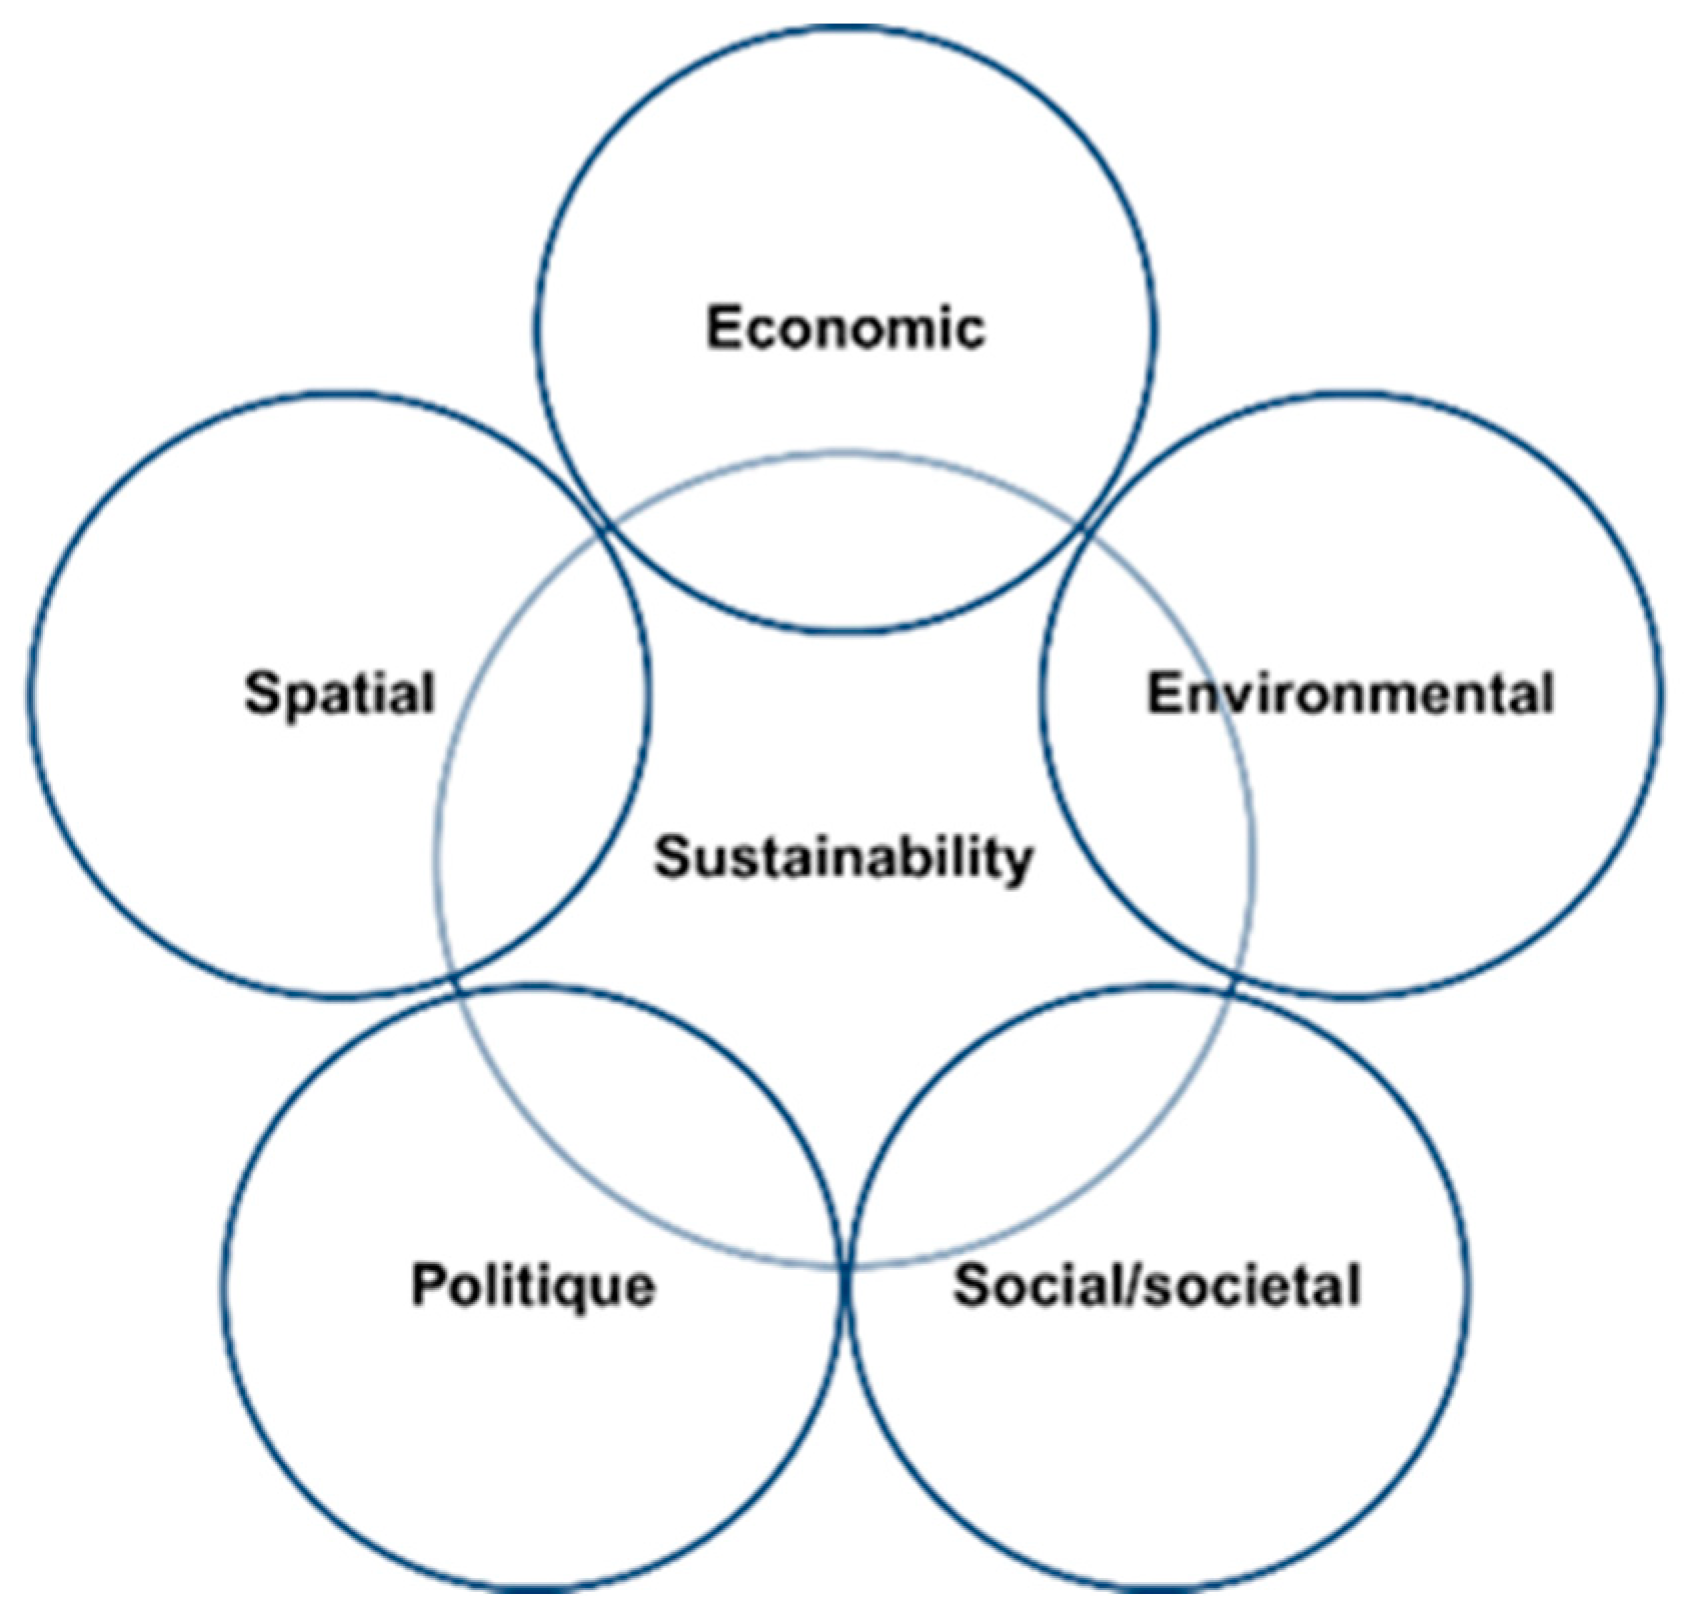
- The economic dimension is crucial for private actors seeking to maximize profit and for public actors aiming to minimize the investments granted to transport. This dimension should be considered to reduce UFT operational costs.
- The environmental dimension addresses the need to preserve the environment during UFT activities. It conserves resources, reduces pollution, and prevents climate change to preserve environmental integrity for present and future generations.
- The social/societal dimension is related to UFT safety conditions and concerns the value of human resources, their health, and satisfaction. This dimension considers safety and security measures.
- The political dimension represents the awareness of local authorities regarding sustainable transport. It refers to policies initiated to regulate freight transport to achieve sustainability in this sector.
- The spatial dimension is particularly important in the assessment of UFT to provide a reference framework for national and regional interventions and actions. This dimension introduces the perspective of a spatially equitable, efficient, and coherent territory.
3.2. Properties
- Achievability is crucial to obtaining the necessary information on the actual situation of an indicator at a reduced cost and in the shortest time. Indicators that are not achievable are scored “0”.
- The property of data availability ensures an efficient and rapid evaluation of a given indicator. Certain surveys and data collection processes should be conducted in some cases, especially when there is a lack of information about the indicator. The latter is scored “0” if data cannot be collected. An indicator that is scored “1” is either readily available for use as a census or requires simple models to collect information or conduct surveys.
- An indicator should be predictable to allow private and public actors to act quickly. The predictability of an indicator helps one to predict future situations and identify the appropriate interventions for achieving a sustainable UFT. An indicator is considered predictable if scored “1” and unpredictable if scored “0”.
- The fourth property concerns the relevance of an indicator to describing UFT. The irrelevance of an indicator provides erroneous interpretations and, subsequently, may lead to bad decisions. The relevant indicator is denoted by “1”.
- The fifth property concerns the understanding of an indicator. The easy understanding of an indicator facilitates its execution by freight transport actors. An indicator should provide clear information about the studied situation and the purpose of the study. An indicator is considered understandable if scored “1” and not understandable if scored “0”.
3.3. The Selected Sustainability Indicators
3.3.1. Economic Indicators
- Determine the Total Tons-Kilometers: Calculate the total distance in tons-kilometers for all modes of freight transport. This involves multiplying the weight of goods transported by the distance traveled for each mode.
- Calculate the Modal Split Percentage for Each Mode: For each mode of transport (road, rail, sea, air, etc.), calculate its percentage share of the total tons-kilometers value.
- Interpretation: The resulting modal split percentage for each mode will provide insights into the distribution of freight transport, indicating the proportion of total freight carried by each mode.
- Maximum Weight-Carrying Capacity: This is the maximum weight of goods that the vehicle is capable of transporting in a single load. This measurement is typically expressed in tons.
- Volume-Carrying Capacity: This represents the maximum volume of goods that the vehicle can accommodate in a single load. The measurement is often expressed in cubic meters or any other relevant volume unit.
- Loaded Vehicle Travel Rate: This expresses the percentage of the maximum load capacity utilized during transportation.
- Total Daily Congestion Kilometers: Measure the total distance of congestion during daily peak hours. This can be obtained by analyzing specific road segments where congestion is observed.
- Total Kilometers of Motorized Transport Lanes: Calculate the total length of all motorized transport lanes during the analysis period.
- Calculation of Average Kilometric Congestion: Divide the total daily congestion kilometers by the total kilometers of motorized transport lanes.
3.3.2. Environmental Indicators
3.3.3. Social/Societal Indicators
3.3.4. Political Indicators
3.3.5. Spatial Indicators
4. Research Implication
- The proposed approach empowers stakeholders in freight transport to effectively monitor the sustainability of UFT, thereby bolstering economic, environmental, social, political, and spatial sustainability.
- It enables stakeholders to assess the current state of UFT sustainability according to selected indicators.
- The developed indicators offer UFT companies a valuable tool for evaluating the sustainability of their operations.
- The study presents eighteen indicators aimed at enhancing the sustainability of UFT.
- The proposed approach assesses sustainability across five dimensions—economic, environmental, social/societal, political, and spatial—thereby making a noteworthy contribution to the current body of literature.
- The suggested indicators serve as a valuable reference for assessing the sustainability of UFT.
5. Conclusions
Author Contributions
Funding
Data Availability Statement
Conflicts of Interest
References
- Ayadi, H.; Hamani, N.; Kermad, L.; Benaissa, M. Novel Fuzzy Composite Indicators for Locating a Logistics Platform under Sustainability Perspectives. Sustainability 2021, 13, 3891. [Google Scholar] [CrossRef]
- Munier, N. Methodology to Select a Set of Urban Sustainability Indicators to Measure the State of the City, and Performance Assessment. Ecol. Indic. 2011, 11, 1020–1026. [Google Scholar] [CrossRef]
- Nardo, M.; Saisana, M.; Saltelli, A.; Tarantola, T. Tools for Composite Indicators Building|Semantic Scholar; European Commission: Rome, Italy, 2005; Volume 15.
- Gudmundsson, H.; Hall, R.P.; Marsden, G.; Zietsman, J. Sustainable Transportation: Indicators, Frameworks, and Performance Management; Springer Texts in Business and Economics; Springer: Berlin/Heidelberg, Germany, 2016; ISBN 978-3-662-46923-1. [Google Scholar]
- Filippi, F.; Nuzzolo, A.; Comi, A.; Site, P.D. Ex-Ante Assessment of Urban Freight Transport Policies. Procedia Soc. Behav. Sci. 2010, 2, 6332–6342. [Google Scholar] [CrossRef]
- Patier, D.; Browne, M. A Methodology for the Evaluation of Urban Logistics Innovations. Procedia Soc. Behav. Sci. 2010, 2, 6229–6241. [Google Scholar] [CrossRef]
- Russo, F.; Comi, A. A Classification of City Logistics Measures and Connected Impacts. Procedia Soc. Behav. Sci. 2010, 2, 6355–6365. [Google Scholar] [CrossRef]
- Russo, F.; Comi, A. A Model System for the Ex-Ante Assessment of City Logistics Measures. Res. Transp. Econ. 2011, 31, 81–87. [Google Scholar] [CrossRef]
- Melo, S.; Baptista, P. Evaluating the Impacts of Using Cargo Cycles on Urban Logistics: Integrating Traffic, Environmental and Operational Boundaries. Eur. Transp. Res. Rev. 2017, 9, 30. [Google Scholar] [CrossRef]
- Ayadi, H.; Hamani, N.; Benaissa, M.; Kermad, L. Indicators for Assessment Progress towards Urban Freight Transport Sustainability. Transp. Res. Procedia 2024, in press. Available online: https://easychair.org/publications/preprint/RzzM (accessed on 17 October 2023).
- Mihyeon Jeon, C.; Amekudzi, A. Addressing Sustainability in Transportation Systems: Definitions, Indicators, and Metrics. J. Infrastruct. Syst. 2005, 11, 31–50. [Google Scholar] [CrossRef]
- Litman, T. Developing Indicators for Comprehensive and Sustainable Transport Planning. Transp. Res. Rec. 2007, 2017, 10–15. [Google Scholar] [CrossRef]
- Yigitcanlar, T.; Dur, F. Developing a Sustainability Assessment Model: The Sustainable Infrastructure, Land-Use, Environment and Transport Model. Sustainability 2010, 2, 321–340. [Google Scholar] [CrossRef]
- Melo, S.; Costa, Á. Definition of a Set of Indicators to Evaluate the Performance of Urban Goods Distribution Initiatives. In City Distribution and Urban Freight Transport; Edward Elgar Publishing: Cheltenham, UK, 2011. [Google Scholar] [CrossRef]
- Morana, J.; Gonzalez-Feliu, J. A Sustainable Urban Logistics Dashboard from the Perspective of a Group of Operational Managers. Manag. Res. Rev. 2015, 38, 1068–1085. [Google Scholar] [CrossRef]
- Jain, D.; Tiwari, G. Sustainable Mobility Indicators for Indian Cities: Selection Methodology and Application. Ecol. Indic. 2017, 79, 310–322. [Google Scholar] [CrossRef]
- Ibadi, M.K. Developing a Standardized Sustainable Transportation Indicators Set. Eng. Sci. 2017, 25, 1779–1786. [Google Scholar]
- Nadi, P.A.; Murad, A. Review of Methods and Indicators in Sustainable Urban Transport Studies Overview from 2000 to 2016. Commun. Sci. Technol. 2017, 2. [Google Scholar] [CrossRef]
- Gonzalez-Feliu, J. Sustainability Evaluation of Green Urban Logistics Systems: Literature Overview and Proposed Framework. Green Initiat. Bus. Sustain. Value Creat. 2018, 103–134. [Google Scholar] [CrossRef]
- Rai, H.B.; Lier, T.V.; Meers, D.; Macharis, C. An Indicator Approach to Sustainable Urban Freight Transport. J. Urban. Int. Res. Placemaking Urban Sustain. 2018, 11, 81–102. [Google Scholar] [CrossRef]
- Gonzalez-Feliu, J. Urban logistics and spatial territorial intelligence indicators: State-of-the-art, typology and implications for Latin American cities. Interfases 2018, 11, 135–176. [Google Scholar] [CrossRef]
- Sdoukopoulos, A.; Pitsiava-Latinopoulou, M.; Basbas, S.; Papaioannou, P. Measuring Progress towards Transport Sustainability through Indicators: Analysis and Metrics of the Main Indicator Initiatives. Transp. Res. Part D Transp. Environ. 2019, 67, 316–333. [Google Scholar] [CrossRef]
- Yang, L.; van Dam, K.H.; Zhang, L. Developing Goals and Indicators for the Design of Sustainable and Integrated Transport Infrastructure and Urban Spaces. Sustainability 2020, 12, 9677. [Google Scholar] [CrossRef]
- Kraus, L.; Proff, H. Sustainable Urban Transportation Criteria and Measurement—A Systematic Literature Review. Sustainability 2021, 13, 7113. [Google Scholar] [CrossRef]
- Illahi, U.; Mir, M.S. Development of Indices for Sustainability of Transportation Systems: A Review of State-of-the-Art. Ecol. Indic. 2020, 118, 106760. [Google Scholar] [CrossRef]
- Reisi, M.; Aye, L.; Rajabifard, A.; Ngo, T. Transport Sustainability Index: Melbourne Case Study. Ecol. Indic. 2014, 43, 288–296. [Google Scholar] [CrossRef]
- Ayadi, H.; Hamani, N.; Benaissa, M.; Kermad, L. Conceptual Framework for Assessing Sustainability of Urban Freight Transport. IFAC-PapersOnLine 2022, 55, 251–256. [Google Scholar] [CrossRef]
- Ayadi, H.; Benaissa, M.; Hamani, N.; Kermad, L. Assessing sustainability of transport system through index: A state-of-the-art review. Sustainability, 2024; in press. [Google Scholar]
- Castillo, H.; Pitfield, D.E. ELASTIC—A Methodological Framework for Identifying and Selecting Sustainable Transport Indicators. Transp. Res. Part D Transp. Environ. 2010, 15, 179–188. [Google Scholar] [CrossRef]
- Rajak, S.; Parthiban, P.; Dhanalakshmi, R. Sustainable Transportation Systems Performance Evaluation Using Fuzzy Logic. Ecol. Indic. 2016, 71, 503–513. [Google Scholar] [CrossRef]
- Bandeira, R.A.M.; D’Agosto, M.A.; Ribeiro, S.K.; Bandeira, A.P.F.; Goes, G.V. A Fuzzy Multi-Criteria Model for Evaluating Sustainable Urban Freight Transportation Operations. J. Clean. Prod. 2018, 184, 727–739. [Google Scholar] [CrossRef]
- Pathak, D.K.; Thakur, L.S.; Rahman, S. Performance Evaluation Framework for Sustainable Freight Transportation Systems. Int. J. Prod. Res. 2019, 57, 6202–6222. [Google Scholar] [CrossRef]
- Yazdani, M.; Pamucar, D.; Chatterjee, P.; Chakraborty, S. Development of a Decision Support Framework for Sustainable Freight Transport System Evaluation Using Rough Numbers. Int. J. Prod. Res. 2020, 58, 4325–4351. [Google Scholar] [CrossRef]
- Hendiani, S.; Bagherpour, M. Development of Sustainability Index Using Z-Numbers: A New Possibilistic Hierarchical Model in the Context of Z-Information. Environ. Dev. Sustain. 2020, 22, 6077–6109. [Google Scholar] [CrossRef]
- Broughton, B.; Hampshire, J. Australian Council for Overseas Aid Bridging the Gap: A Guide to Monitoring and Evaluating Development Projects; ACFOA: Canberra, Australia, 1997; ISBN 978-0-909831-79-0. [Google Scholar]
- Joumard, R.; Gudmundsson, H. Indicators of Environmental Sustainability in Transport; INRETS: Lyngby, Denmark, 2010; p. 422. [Google Scholar]
- Haghshenas, H.; Vaziri, M. Urban Sustainable Transportation Indicators for Global Comparison. Ecol. Indic. 2012, 15, 115–121. [Google Scholar] [CrossRef]
- Spiekermann, K.; Wegener, M.; Urban, W. Evaluating Urban Sustainability Using Land-Use Transport Interaction Models. Eur. J. Transp. Infrastruct. Res. 2004, 4, 22. [Google Scholar] [CrossRef]
- Dale, V.H.; Beyeler, S.C. Challenges in the Development and Use of Ecological Indicators. Ecol. Indic. 2001, 1, 3–10. [Google Scholar] [CrossRef]
- Joumard, R.; Gudmundsson, H.; Folkeson, L. Framework for Assessing Indicators of Environmental Impacts in the Transport Sector. Transp. Res. Rec. 2011, 2242, 55–63. [Google Scholar] [CrossRef]
- Zito, P.; Salvo, G. Toward an Urban Transport Sustainability Index: An European Comparison. Eur. Transp. Res. Rev. 2011, 3, 179–195. [Google Scholar] [CrossRef]
- Shiau, T.-A.; Liu, J.-S. Developing an Indicator System for Local Governments to Evaluate Transport Sustainability Strategies. Ecol. Indic. 2013, 34, 361–371. [Google Scholar] [CrossRef]
- Dodman, D. Blaming Cities for Climate Change? An Analysis of Urban Greenhouse Gas Emissions Inventories. Environ. Urban. 2009, 21, 185–201. [Google Scholar] [CrossRef]
- Dobranskyte-Niskota, A.; Perujo, A.; Pregl, M. Indicators to Assess Sustainability of Transport Activities. Eur. Com. Jt. Res. Cent. 2007. [Google Scholar] [CrossRef]
- ISO-14001 ISO-ISO14000; Management Environnemental. ISO: Geneva, Switzerland, 2015. Available online: https://www.iso.org/fr/iso-14001-environmental-management.html (accessed on 25 March 2022).


| Reference | Dimensions | |||
|---|---|---|---|---|
| Economic | Environmental | Social/Societal | Others | |
| [11] | * | * | * | |
| [12] | * | * | * | |
| [14] | * | * | * | Mobility |
| [15] | * | * | * | |
| [18] | * | * | * | |
| [16] | * | * | * | Activity |
| [17] | * | * | * | |
| [21] | * | * | * | Spatial |
| [19] | * | * | * | |
| [20] | * | * | * | Political |
| [22] | * | * | * | |
| [23] | * | * | * | |
| [24] | * | * | * | |
| [27] | * | * | * | Spatial and political |
| Dimension | Indicator | [11] | [12] | [29] | [14] | [26] | [15] | [30] | [4] | [18] | [16] | [20] | [19] | [21] | [31] | [32] | [33] | [34] | [22] | [23] | [24] | |
| Traditional dimensions | Economic | Modal split | * | * | * | * | * | |||||||||||||||
| Loading rate | * | * | * | * | * | * | ||||||||||||||||
| Service rate | * | * | * | |||||||||||||||||||
| Congestion | * | * | * | * | * | * | ||||||||||||||||
| Congestion intensity (Road occupancy rate) | * | * | * | |||||||||||||||||||
| Length of congestion | * | * | ||||||||||||||||||||
| Off-peak system performance | * | |||||||||||||||||||||
| Volume of freight moved (Ton-km) | * | * | * | * | * | |||||||||||||||||
| Intermodal transport intensity (Ton-km) | * | * | ||||||||||||||||||||
| Road transport intensity (Ton-km) | * | * | * | * | ||||||||||||||||||
| Rail intensity (Ton-km) | * | * | * | |||||||||||||||||||
| Distance traveled (km) | * | * | * | * | ||||||||||||||||||
| Transport costs | * | * | * | * | * | * | ||||||||||||||||
| Logistics costs | * | * | ||||||||||||||||||||
| Operational costs | * | * | * | |||||||||||||||||||
| Land consumption for transportation infrastructure | * | * | * | * | * | |||||||||||||||||
| Investment in infrastructure | * | * | * | * | ||||||||||||||||||
| Number of loading and unloading facilities | * | * | * | * | ||||||||||||||||||
| Logistics reliability rate | * | * | * | |||||||||||||||||||
| Economic development: staff training | * | * | * | |||||||||||||||||||
| Financial viability | * | * | * | * | * | * | * | |||||||||||||||
| On-time service rate (%) | * | * | * | * | * | |||||||||||||||||
| Net margin (EUR, $, %) | * | * | ||||||||||||||||||||
| Internal rate of return | * | * | * | |||||||||||||||||||
| Costs | * | * | * | |||||||||||||||||||
| Economic growth | * | * | ||||||||||||||||||||
| Staff training costs | * | |||||||||||||||||||||
| Number of vehicles by type | * | * | * | * | * | * | * | |||||||||||||||
| Number of transport jobs | * | * | ||||||||||||||||||||
| Road occupancy time of stopped vehicles | * | * | * | |||||||||||||||||||
| Total transport time | * | * | ||||||||||||||||||||
| Environmental | GHG emissions | * | * | * | * | * | * | * | * | * | * | * | ||||||||||
| Air pollutants emissions (PM2.5, PM10, …) | * | * | * | * | * | * | * | |||||||||||||||
| PM2.5 (Particulate matter) | * | * | * | |||||||||||||||||||
| PM10 (Particulate matter) | * | * | * | * | ||||||||||||||||||
| O3 (Ozone) | * | * | ||||||||||||||||||||
| NOx (Nitrogen oxides) | * | * | * | * | * | |||||||||||||||||
| SOx (Sulfur oxides) | * | * | * | * | ||||||||||||||||||
| CO (Carbon monoxide) | * | |||||||||||||||||||||
| CO2 (Carbon dioxide) | * | * | * | * | ||||||||||||||||||
| N20 (Nitrous oxide) | * | |||||||||||||||||||||
| VOC (Volatile organic compounds) | * | * | * | * | ||||||||||||||||||
| CH4 (Atmospheric methane) | * | * | ||||||||||||||||||||
| NH3 (Ammonia) | * | |||||||||||||||||||||
| emissions | * | * | * | * | * | * | * | * | * | |||||||||||||
| Energy consumption | * | * | * | * | * | * | * | * | * | * | * | * | * | * | * | * | * | |||||
| Sustainable freight vehicles | * | * | ||||||||||||||||||||
| Climate changes | * | * | * | |||||||||||||||||||
| Consumption of renewable energy | * | * | * | * | * | * | * | * | * | |||||||||||||
| Impact on noise level | * | * | * | * | ||||||||||||||||||
| Depletion rate of natural resources (%) | * | * | * | |||||||||||||||||||
| Land consumption | * | * | * | * | ||||||||||||||||||
| Land use planning | * | |||||||||||||||||||||
| Vibration level | * | * | ||||||||||||||||||||
| Social/societal | Noise | * | * | * | * | * | * | * | * | * | * | * | ||||||||||
| Accidents | * | * | * | * | * | * | * | * | * | |||||||||||||
| Fatalities | * | * | * | * | * | * | * | * | * | * | ||||||||||||
| Injuries | * | * | * | * | * | * | * | * | * | |||||||||||||
| Freight transport personnel certification | ||||||||||||||||||||||
| Safety | * | * | * | * | * | |||||||||||||||||
| Congestion | * | * | * | * | * | |||||||||||||||||
| Average speed in the city | * | |||||||||||||||||||||
| Employee satisfaction rate | * | * | ||||||||||||||||||||
| Customer satisfaction rate | * | * | * | * | ||||||||||||||||||
| Job creation rate | * | * | * | * | ||||||||||||||||||
| Accessibility and connectivity | * | * | * | * | * | * | * | |||||||||||||||
| Equity | * | * | * | * | * | * | ||||||||||||||||
| Health and respiratory problems due to freight transportation | * | * | * | |||||||||||||||||||
| Quality of life | * | * | * | |||||||||||||||||||
| Use of information and communication technologies | * | * | ||||||||||||||||||||
| Stakeholder participation rate | * | |||||||||||||||||||||
| Health impact (Negative effect: perceived risks and hazards) | * | * | * | * | * | |||||||||||||||||
| Vehicle evaluation | * | |||||||||||||||||||||
| Mental accessibility | * | |||||||||||||||||||||
| Emerging dimensions | Political | Financial resources | * | |||||||||||||||||||
| Human resources | * | |||||||||||||||||||||
| Sustainable policies | * | |||||||||||||||||||||
| Sustainable business | * | |||||||||||||||||||||
| Spatial restriction | ||||||||||||||||||||||
| Temporal restriction | ||||||||||||||||||||||
| Spatial | Peripheral infrastructure capacity | * | ||||||||||||||||||||
| Nodal infrastructure capacity | * | |||||||||||||||||||||
| Accessibility | ||||||||||||||||||||||
| Property | Description | References |
|---|---|---|
| Achievability | An indicator is achievable at a reasonable cost using an appropriate collection method. | [22,35] |
| Contextuality | An indicator appropriate to the context of study combines the properties of transparency, interpretation, target relevance, and actionability. | [36] |
| Data availability | Data should be available or can be rendered using scientifically approved tools. | [22,29] |
| Independence | The indicators must be independent of each other. | [26,37] |
| Measurability | An indicator can be measured in a simple and understandable way providing valuable information on the sustainability of transport. | [16,29,35] |
| Opportunity | An indicator needs to be collected and reported at the right time to influence the decision-making process. | [4,29,35] |
| Practicality | A practical indicator addresses the properties of measurability, data availability, and ethical concerns. | [36] |
| Predictability | The predictability of indicator values is crucial to help transport actors’ current situation and propose good practices. | [38] |
| Relevance | An indicator should be adequately selected to achieve a pre-defined goal and should provide an overview about the studied situation considering relevant information. | [16,35,38] |
| Representation | A representational indicator combines the properties of validity, reliability, and sensitivity. | [36] |
| Sensitivity | An indicator must be sufficiently sensitive to write the purpose of the study. | [39,40] |
| Simplicity | An indicator should be related to the simple and specific conditions that the project seeks to change and be easily understood by transport actors. | [29,35,40] |
| Understanding | Understanding an indicator is important in facilitating discussions between experts and transport stakeholders. | [37,41] |
| Dimension | Indicator | |
|---|---|---|
| Economic | EC1 | Modal split |
| EC2 | Loading rate | |
| EC3 | Congestion | |
| Environmental | EN1 | GHG emissions |
| EN2 | Air pollutants emissions (PM2.5, PM10, NOx, …) | |
| EN3 | Energy consumption | |
| EN4 | Sustainable freight vehicles | |
| Social/societal | SO1 | Accidents |
| SO2 | Fatalities | |
| SO3 | Injuries | |
| SO4 | Noise | |
| SO5 | Freight transport personnel certification | |
| Political | PO1 | Financial resources |
| PO2 | Sustainable businesses | |
| PO3 | Spatial restriction | |
| PO4 | Temporal restriction | |
| Spatial | TE1 | Peripheral infrastructure capacity |
| TE2 | Nodal infrastructure capacity |
| Indicator | Definition | Objective | Unit | ||
|---|---|---|---|---|---|
| Economic | EC1 | Modal split | The share of each mode of freight transport in the total transport. | Improve mobility | Tons-Km |
| EC2 | Loading rate | The occupancy rate of freight transport vehicles and their loading capacities. | % | ||
| EC3 | Congestion | The average daily peak congestion per lane mile of the motorized transport. | Km/h |
| Indicator | Definition | Objective | Unit | ||
|---|---|---|---|---|---|
| Environmental | EN1 | GHG emissions | The amount of GHG emitted by freight vehicles. | Reduce pollutant emissions | kg CO2 eq. |
| EN2 | Air pollutants emissions (PM2.5, PM10, NOx, …) | The amount of pollutants (PM10, PM2.5 and NOx) emitted by freight vehicles. | kg PM10 eq. | ||
| EN3 | Energy consumption | The average amount of energy consumed by freight vehicles. | Improve energy efficiency | MJ/100 Km | |
| EN4 | Sustainable freight vehicles | The number of sustainable freight vehicles compared to that of non-sustainable vehicles. | % |
| Indicator | Definition | Objective | Unit | ||
|---|---|---|---|---|---|
| Social/societal | SO1 | Accidents | The number of traffic-related accidents in relation to the total number of accidents. | Improve the level of safety | Number of accidents |
| SO2 | Fatalities | The number of traffic-related fatalities in relation to the total number of inhabitants. | Mortality/inhabitants | ||
| SO3 | Injuries | The number of traffic-related injuries in relation to the total number of inhabitants. | Injured persons/inhabitants | ||
| SO4 | Noise | Freight vehicles within noise limits versus the total number of freight vehicles. | Reduce noise pollution | Db | |
| SO5 | Freight transport personnel certification | The number of certified freight transport personnel in relation to the total number of freight transport personnel. | Improve the level of security | % |
| Indicator | Definition | Objective | Unit | ||
|---|---|---|---|---|---|
| Political | PO1 | Financial resources | The budget of sustainable UFT projects compared with that of the total transport. | Ensure financial efficiency | % |
| PO2 | Sustainable businesses | The number of ISO 14001-certified companies compared with the total number of companies. | Move towards sustainable businesses | % | |
| PO3 | Spatial restriction | Compliance rate with spatial traffic and parking restrictions. | Improve the effectiveness of public the policies | % | |
| PO4 | Temporal restriction | Compliance rate with temporal traffic and parking restrictions. | % |
| Indicator | Definition | Objective | Unit | ||
|---|---|---|---|---|---|
| Spatial | TE1 | Peripheral infrastructure capacity | The percentage of the capacity and availability of peripheral infrastructures. | Ameliorate peripheral accessibility | % |
| TE2 | Nodal infrastructure capacity | The percentage of the capacity and availability of nodal infrastructures. | Enhance nodal accessibility | % |
Disclaimer/Publisher’s Note: The statements, opinions and data contained in all publications are solely those of the individual author(s) and contributor(s) and not of MDPI and/or the editor(s). MDPI and/or the editor(s) disclaim responsibility for any injury to people or property resulting from any ideas, methods, instructions or products referred to in the content. |
© 2024 by the authors. Licensee MDPI, Basel, Switzerland. This article is an open access article distributed under the terms and conditions of the Creative Commons Attribution (CC BY) license (https://creativecommons.org/licenses/by/4.0/).
Share and Cite
Ayadi, H.; Benaissa, M.; Hamani, N.; Kermad, L. Selecting Indicators to Assess the Sustainability of Urban Freight Transport Using a Multi-Criteria Analysis. Logistics 2024, 8, 12. https://doi.org/10.3390/logistics8010012
Ayadi H, Benaissa M, Hamani N, Kermad L. Selecting Indicators to Assess the Sustainability of Urban Freight Transport Using a Multi-Criteria Analysis. Logistics. 2024; 8(1):12. https://doi.org/10.3390/logistics8010012
Chicago/Turabian StyleAyadi, Hana, Mounir Benaissa, Nadia Hamani, and Lyes Kermad. 2024. "Selecting Indicators to Assess the Sustainability of Urban Freight Transport Using a Multi-Criteria Analysis" Logistics 8, no. 1: 12. https://doi.org/10.3390/logistics8010012