Article

The Role of Supply Chain Resilience on SMEs’ Performance: The Case of an Emerging Economy

by
Mohammed Awad Alshahrani
1,* and
Mohammad Asif Salam
2
1
Business Administration Department, College of Business, King Khalid University, Abha 62529, Saudi Arabia
2
Faculty of Economics and Administration, King Abdulaziz University, Jeddah 21589, Saudi Arabia
*
Author to whom correspondence should be addressed.
Logistics 2022, 6(3), 47; https://doi.org/10.3390/logistics6030047
Submission received: 14 June 2022 / Revised: 1 July 2022 / Accepted: 7 July 2022 / Published: 11 July 2022

Abstract

:
Existing studies have predominantly explored the influence of supply chain resilience on the performance of firms in the context of developed economies. This study highlights the need for SMEs to be prepared to tackle uncertainties in business operations. Background: Small and Medium Enterprises (SMEs) play a critical role in every economy, and limited studies have highlighted the significance of resilience in the firms. Therefore, this study aims to determine the impact of supply chain resilience on SMEs’ performance in Saudi Arabia based on three dimensions of resilience, namely agility, robustness, and flexibility. It aims to investigate how they relate to the dimensions of SMEs’ performance, namely production performance and market/sales performance. This study also investigates the overall impact of supply chain resilience as a construct on SMEs’ performance. Methods: This study employed a quantitative research design to answer the research questions. A self-administered questionnaire was used to collect data. The study was based on 255 samples of managers in SMEs from Saudi Arabia. The hypothesized model has been tested using the SPSS/Amos 26. Results: Based on the findings, it has been found that supply chain agility and flexibility had a significant positive relationship with SMEs’ production and marketing/sales performances. Supply chain robustness demonstrated a significant positive relationship with SMEs’ production performance but not their marketing/sales performances. Overall, there was a significant positive relationship between supply chain resilience and SMEs’ performance. Conclusions: This study contributes to the body of literature on supply chain resilience by expounding knowledge on aspects such as agility, flexibility, and robustness. The study enhances our understanding of the role of supply chain resilience on SMEs’ performance in an emerging economy context.

1. Introduction

The supply chain issues that affect the SMEs sector have become an increasingly important area of interest for academia and business globally [1], contributing to continuous changes in the business environment, the dynamics of globalization, rapid economic growth, and the spread of the global pandemic COVID-19 [2]. Businesses have attempted to improve their supply chains, remain competitive, and achieve higher performance. Whether reactively or proactively, coping with changes has been described by [3] as the essence of business management. To succeed in the era of substantial economic disruptions and turbulence in the current supply chain, meticulous market focus has led to strategies that lower the supply chain risks [4]. According to [5], firms with the most chance to succeed are those with the ability to rebuild themselves after encountering seemingly daunting market problems, commonly known as resilience. Firms characterized by resilience were able to survive the pandemic and its compounded effects. Ref. [1], it is noted that resilience is the supply chain’s ability to bounce back to normal operations after market turbulence.
The SME sector can apply three fundamental constructs of resilience to withstand the disruptions of the COVID-19 pandemic, namely agility, flexibility, and robustness. Agility entails the speed a supply chain takes to counter disturbances [5]. Supply chain agility is crucial in handling the current volatile market [2,6]. In the existing literature, agility scholars have highlighted agility as positively influencing the supply chain. The pandemic has also been a test for a firm’s flexibility [7]. According to [8], flexibility is an enterprise’s reactive response to build and balance supply and demand. Robustness refers to the proactiveness of a business in anticipation of a change before it happens. The authors of [9] found that robustness and agility were prominent in improving customer value in the supply chain. In the literature review, the researcher discusses the various constructs of resilience that impact firm performance, emphasizing small and medium enterprises (SMEs).

1.1. Problem Statement

Consequently, this study seeks to bridge the gap and assist the firms in managing the associated uncertainties with supply chain management operations. Furthermore, this study aids in creating a knowledge base for enhancing the understanding of the link between Supply Chain Resilience and firm performance [6]. Based on available evidence, the current paper is considered one of the earliest papers conducted in the field of supply chain resilience in the SME sector in the Gulf Cooperation Council countries. To address the above research gaps, this study is based on the following questions: How does supply chain resilience as an internal capability influence the SMEs’ performance in Saudi Arabia? How does agility affect SMEs’ performance? How does robustness affect SMEs’ performance? How does flexibility affect SMEs’ performance?
SMEs play a critical role in the global and domestic economy. As per Saudi Arabia’s Vision 2030, the SME sector in Saudi Arabia is projected to contribute approximately 35 percent of the Gross Domestic Product (GDP). The feasibility of this Vision 2030 has been threatened and is now dependent on how quickly the resilience of SMEs recovers. The General Authority of SMEs (2020) indicates that the pandemic adversely affected SMEs’ marketing, management, and operational performance. The impact on SMEs has led to cuts in employment. Though the government allocated $20 US billion in stimuli, long-term solutions are needed [10]. SMEs should be equipped with strategies such as resilience to help them survive and thrive. Surprisingly, a limited number of studies highlight the significance of resilience practices in firms.
Prior research into supply chain resilience has primarily concentrated on developed economies [11]. However, contemporary evidence suggests that developing economies suffer the most from supply chain resilience failures [6,12]. Furthermore, SMEs are more vulnerable to disruptions in the supply chain than large corporations [3,13]. This vulnerability is thought to be caused by a lack of sufficient resources (i.e., SMEs usually operate on a limited financial capacity) to tackle these disruptions [12,14,15] or a lack of enough preparation for supply chain issues [16]. Additionally, research into SMEs’ resilience practices in supply chains is limited [6,13,17]. SMEs play a critical role in the economy, and limited studies have highlighted the significance of resilience practices in the firms. As Saudi Arabia looks forward to transitioning into a global business hub as one of the major global economies, more studies in supply chain management are fundamental [18].

1.2. Based on These Research Questions, the Study Aims to Address Four Research Objectives

First, this study aims to determine the influence of Supply Chain Resilience on SMEs’ performance in Saudi Arabia. Secondly, it aims to determine the impact of Supply Chain Resilience (Agility) on SMEs (Production Performance and Market and Sales Performance). Thirdly, it aims to determine the impact of Supply Chain Resilience (Flexibility) on SMEs (Production Performance and Market and Sales Performance). Finally, it aims to determine the influence of Supply Chain Resilience (Robustness) on SMEs (Production Performance and Market and Sales Performance).
This paper focuses on SMEs in Saudi Arabia. The SMEs under investigation are those that hold between 6 and 49 employees from small enterprises and between 50 and 249 for medium enterprises, as stated by [19]. SMEs create direct employment for over 4.5 million individuals [10]. General Authority Statistics (GaStat) reports that SMEs generated a revenue of $44.5 US million by the end of 2018 [16]. Though SMEs in the nation had an increasing growth rate before 2019, the spread of COVID-19 led to the fall of many SMEs. The report also informs the choice of focus on SMEs in the National Industrial Development and Logistics Program. The report is under the pathway created by Vision 2030, whose delivery timeline is between 2021 and 2025 [1]. The report recognizes the salient role of the logistic sector in the Kingdom of Saudi Arabia and the GCC market. The current research aligns with the report’s spirit of empowering and creating enablers for the private sector, referring to most SMEs’ supply chain operations [20]. According to [21], SMEs make up 27.8 percent of all private companies and employ 60 percent of all employees in the private sector. The subsequent parts of this paper are organized as follows: Section 2 signifies the most relevant literature concerning the concepts under investigation; Section 3 illustrates the study methodology; then data analysis is offered in Section 4; after that, the results and discussion are in Section 5; Section 6 stipulates the implications of the study; limitation and future research are provided in Section 7, while Section 8 presents the conclusion of the paper.

2. Literature Review

Based on the findings of the available literature, this research uses the conceptual model presented in Figure 1. Supply Chain Resilience represents the independent variable through the three dimensions of agility, flexibility, and robustness. The dependent variable is the SMEs Performance. Under SME performance, the study explores production performance and market and sales performance dimensions.

2.1. Underlying Theory

This paper considers the role that resilience plays in the performance of SMEs. SMEs are managed, run, and sustained by the supply chain business managers’ hard work, capability, wealth, routines, and systems. Therefore, the dynamic capability theory has been chosen for this study. The initial definition of the concept of Supply Chain Resilience is the capability that enables firms to return quickly to normal operations following disruption [1,22,23]. It defines the concept as the ability of organizations to adapt to change and reorganize following a disturbance in supply chains. Firms that are able to persist and transform following a supply chain disturbance have the most effective Supply Chain Resilience [1,3].
The dynamic capabilities theoretical framework, introduced by [1], can be incorporated into the present study. The framework has gained popularity as a useful tool for explaining performance dynamics across firms [9,10]. The model integrates concepts and strategies that enable businesses to withstand turbulence created by an unstable market. Thus, the dynamic capability theory develops superior organizational performance and competitive advantages [24]. According to [25], dynamic capabilities involve organizations generating and modifying operating practices to achieve a sustainable competitive advantage [24]. The capability view focuses on constructing or encompassing firm resources to develop the firm’s capabilities, asking how organizations may contribute to creating sustainable human competencies at work [26]. According to [27], for SMEs to establish a competitive advantage, they must have superior resources and capabilities. However, a firm’s ability to deploy these resources or capabilities influences its performance and competitive advantage.

2.2. Supply Chain Resilience

Resilience is the ability of firms to bounce back to normal operations within a given range of time after market turbulence [1]. Supply Chain Resilience was initially termed as the capability to enhance a supply chain’s chance to bounce back when faced with disturbance [1] and is believed to have been borrowed from the field of mechanical engineering. According to [23], resilience as a multidisciplinary concept emerged from material science; it describes the characteristics of a material returning to its original shape after undergoing deformation. In a real-world application, this concept entails the properties of integrating, rearranging, and adapting available resources to respond to external environmental disturbances. The concept of resilience has been recognized in several disciplines, seen in literature domains such as psychology adversities recovery, management of risks and developing threats, and social and ecological vulnerabilities [28]. Holling is accredited as the scholar who first introduced the term to social sciences and differentiated it from the concept of stability (1973). In the context of firms, resilience denotes the capability of a system to withstand disruptions and maintain operations or the ability to bounce back after unplanned events [9]. Supply Chain Resilience is seen as the firm’s reactive responsiveness and recovery ability during unstable business environments.
A supply chain comprises the firm, the suppliers, consumers, and other engaged parties in its running. Within the modern social-ecological area, Supply Chain Resilience is viewed as the characteristic that brings about systematic change, adaptation, reorganization, and disruption handling [6]. However, the authors of [29] believe that the supply chain framework logistics capabilities define Supply Chain Resilience. These capabilities include the low cost of distribution, responsiveness, reliability, and delivery speed. However, researchers [30] have suggested that a supply chain’s responsibility is to develop managerial capabilities to prepare for unplanned business disruptions. The author refers to the flexibility of the logistic practices in the supply chain through reduced lead time, selecting and verifying suppliers, collaborations with reliable supplier networks, a culture of tackling risks, and various means of transportation of products. Many authors have stated that an enhanced supply chain resilience depends on the collaboration and diversification of suppliers to cope with unplanned business disruptions [9]. Having a wide selection of suppliers allows the firm to have resources to establish additional Supply Chain Resilience and create a swift production process that can make quick changes when there are disruptions.
According to [9], a strong culture of handling risks and a vast network of suppliers can be combined with using practices [30], such as using certified suppliers, splitting the manufacturing process, and entering into flexible contractual agreements. Another perspective, offered by [31] states that an efficiently running supply chain plans and puts in order its inventory to guarantee the availability of a product and ensure multiple routes of transportation of products. The concern with this kind of strategy is explained by [32] as having redundant stock, which creates higher expenses for the business. However, the extra resources in the inventory ensure a quick company comeback in the event of market interruptions.
Agility encompasses the speed at which a supply chain can counter disturbances [5,33]. A suitable supply chain should be able to bounce back in the shortest time possible after encountering disruptions. Based on the discussion in [5], Supply Chain Agility reflects the adaptability and flexibility of a business’s supply chain in a stock market full of hurdles. Ref. [1] postulated that Supply Chain Agility represents the dynamic capability that positively impacts an enterprise’s operational performance. That viewpoint is shared by [32], who added that agility requires applying market knowledge and a virtual corporation to seize profitable opportunities in a volatile environment.
The swiftness of a solid ability to act quickly after a disruption to market dynamics is a bigger percentage factored by the capabilities of the trading partners [6]. Therefore, agility, as a concept, has to be pushed beyond a mere firm to its supply chain operations. In a market full of unpredicted changes, agility is useful in enhancing firm responsiveness and effectiveness of the strategies used [33]. For SMEs, management should encourage employees to be vigilant and develop a culture of assessing business opportunities in the downstream and upstream supply chain, leading to the following hypotheses:
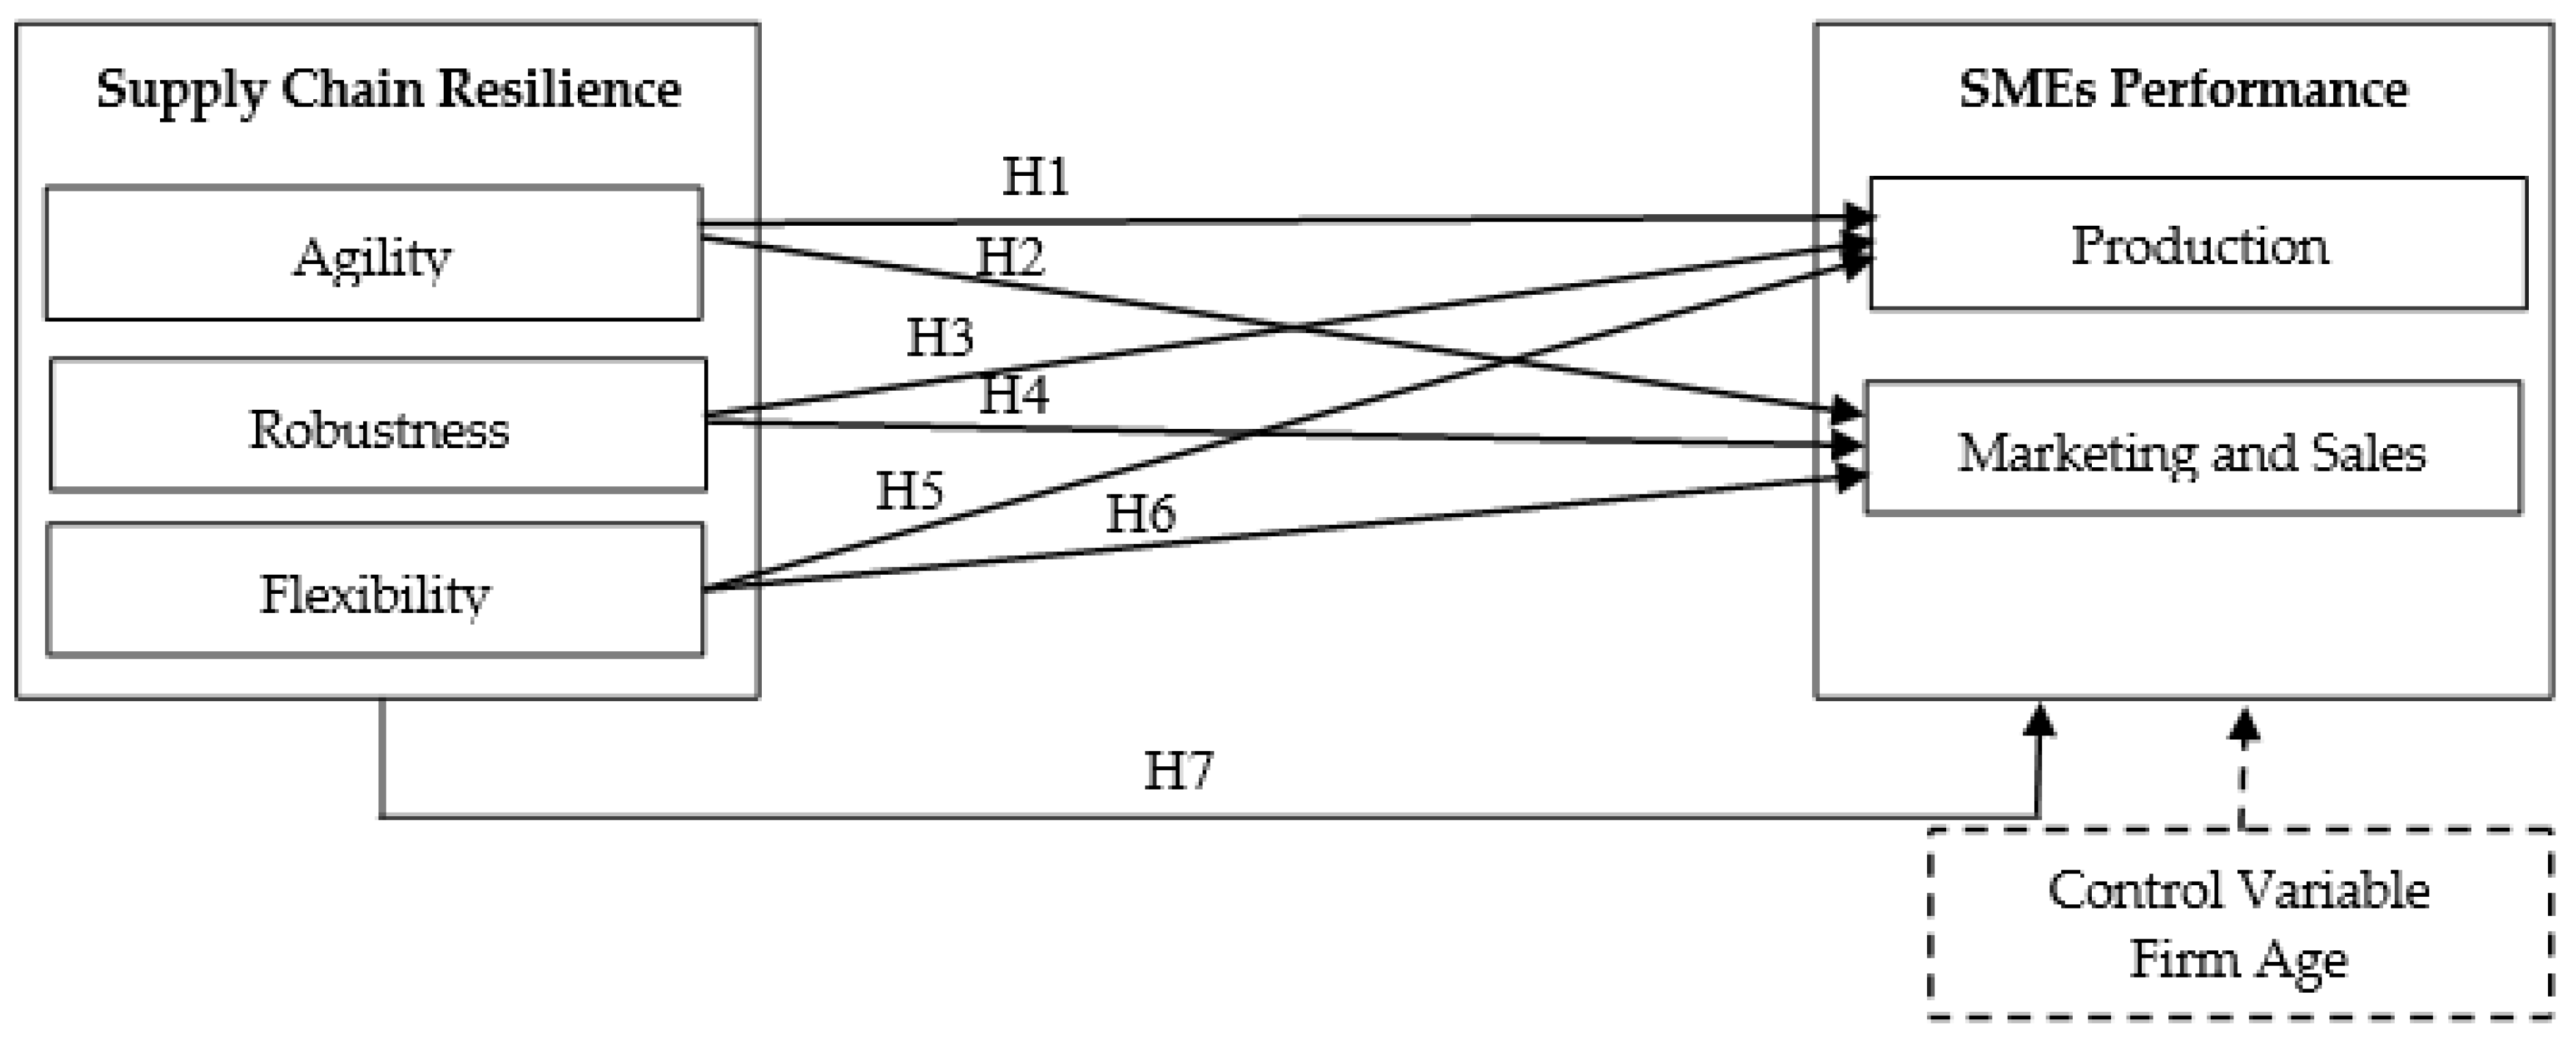
Hypothesis 1 (H1).
Supply Chain Agility has a positive relationship with the production performance of SMEs.
Hypothesis 2 (H2).
Supply Chain Agility has a positive relationship with the marketing and sales performance of a SMEs.
Having a diverse, reliable transportation network is echoed by [30], who suggested that capable firms execute a transportation fleet that ensures more effective control and less effort in re-planning. Large multinationals such as Coca-Cola, Atlanta, GA, Toyota, Japan, Proctor & Gamble, and Cincinnati, OH try to maintain operations despite internal or external disruptions [6]. This concept is called Supply Chain Robustness, where the firm carries with its supply chain process despite unplanned events. An example is given by [34], who document that, after the earthquake that hit Japan in 1995, a company was able to reorganize and restart production at most of its plants in a record time of less than a week. The supply chain ensured that the sales and marketing operations of the company resumed.
Robustness is a business’s ability to be proactive in anticipation of a change before it happens [3]. In [26], robustness is defined as the reliance on various suppliers instead of a single supplier and having a contingency of waiting suppliers in case of an emergency. A supply chain can remain effective in the future. It maintains performance before and after disruptions and is slow to act on noise factors. Similarly, ref. [6] added that, for modern firms, the robustness of the supply chain is witnessed in their ability to withstand internal and external disturbances and disruptions. Robustness in the supply chain can be examined under different risks, including catastrophic, supply-side, and demand-oriented risks [14]. Catastrophic risks are caused by natural environmental hazards, terrorist attacks, economic instability, civil unrest, and social-political instabilities [26]. Natural hazards could include flooding, droughts, hurricanes, earthquakes, and tsunamis. In most cases, the supply chain has a global influence; local issues can significantly impact the performance of the vast supply chain network. Supply-side links involve poorly executed logistical performance, substandard supply chain quality, product design changes, technological changes, capacity issues, and risks associated with firm suppliers. An example of this type of risk is the late delivery of resources. Demand-affiliated risks emanate from downstream supply chain activities [6]. These risks are seen in the physical distribution of the goods to the end consumer. There can be considerable differences between the actual and forecasted demand, issues in the operating warehouse, transportation issues, or poor coordination in the supply chain. Demand-side risks can lead to inefficient supply operations, obsolescence, and costly changes.
In the supply chain, the issues affecting robustness are created by the firm having few suppliers, as in single sourcing, supplier dependence, and customer dependence. Global sourcing is also vulnerable due to poor visibility, transparency, and heightened uncertainty. The most effective solution to these vulnerabilities has a well-executed supply chain robustness. Robustness can be achieved by creating greater customer accounts, improved responses, having redundant suppliers, increasing the firm inventory, and adding the firm’s capacity [32]. However, according to [26], robustness and resilience should be taken up as performance outcomes. This viewpoint borrows from the research-based view that suggests that the supply chain disruptions lead to the necessity to create supply chain resilience and robustness. Firms see the need to develop robustness due to the short- and long-term threats caused to the organizational performance by different market disruptions. As opposed to resilience, Supply Chain resilience is meant to mitigate the threats to performance functions, including market and production performance [9], leading to the following hypothesis:
Hypothesis 3 (H3).
Supply Chain Robustness has a positive relationship with the production performance of SMEs.
Hypothesis 4 (H4).
Supply Chain Robustness has a positive relationship with the marketing and sales performance of SMEs.
Flexibility is the reactive response that an enterprise needs in building and balancing its supply and demand [8]. Flexibility is the capability of the firm supply chain to change its possible options and differentiate the degree of variation in coping with different market conditions. In contrast, ref. [8] suggested that flexibility is the ability to quickly acclimatize to novel situations. With flexibility, a firm can survive market disruptions due to the ability to circumvent conditions that could hinder various operations [7]. An instance of Supply Chain Flexibility is seen in provisions. With flexibility, it is possible to change the source of materials or the channel for obtaining resources. The same goes for the management, or as it is called in [29], the execution of orders, in that administration should have a contingency plan when unexpected changes occur.
Ref. [26] found that the concept of flexibility goes hand-in-hand with agility. An example of this link is when the supply chain process is modularized, enabling actions such as using strategic resources, postponing production, using a flexible supply channel, switching between the norm of buying or making, using different modes of transport, and managing price and revenue. In a firm, the concept of flexibility can be put into place using tangible and intangible resources [7]. Financial resources are an example of resources that can be harnessed to absorb ups and downs in the market. Security stocks are also an effective way for a firm to absorb market disruptions. However, according to [1], the different sources of flexibility are essential to lowering costs and creating competitive advantages. In contrast, ref. [32] believed that the use of operational buffers for flexibility could cause redundancy. Redundancy is the viewpoint that companies can stack up stocks waiting for the unknown instead of mobilizing them for use. Based on this discussion, the following hypotheses are presented:
Hypothesis 5 (H5).
Supply Chain Flexibility has a positive association with the production of SMEs.
Hypothesis 6 (H6).
Supply Chain Flexibility has a positive association with the marketing and sales performance of SMEs.

2.3. Firm Performance

A firm is said to be made of various business functions, including market, sales, and production performance. A combination of these variables leads to general performance. The researcher recognizes that there are other functional areas, including research and development, human resource management, and financial management. The study follows [25]’s concept of primary and secondary functions making up a firm’s supply chain, focusing on production performance and market and sales performance (2001). According to [27], production, market, and sales are among the salient functional areas for many modern SMEs in the technological sector. Firms should not be looked at as a single entity but rather as a combination of the sum of various functional areas, i.e., market, sales, and production. This perspective is important in enabling managers to discern if the functional areas of their firm are performing differently from rival businesses. The value chain is used in differentiating various relationships among functional variables.
The value chain systematically reviews the different activities in a firm and how they correlate. The value chain system may impact marketing approaches used in the business on overall organizational performance. The study by [5] used a value chain to explore the relationship between firm performance and new product development practices. Scholars have examined the relationship between the market and sales practices on the overall firm performance. Effective and quality production function leads to more effective marketing, increasing sales [31]. Therefore, it is clear that the stated function is closely linked, leading to an internal value chain that affects the firm’s performance. Whether global or domestic, supply chain operations are regularly disrupted by both internal and external events [1]. Unforeseen events affecting most businesses include earthquakes, diseases like COVID-19, war, typhoons, and tsunamis [2,8]. Internal threats such as economic recessions are also devastating to SMEs’ overall performance and functionality [35]. Furthermore, new technologies, loss of customers, and the state of infrastructure threaten a firm’s sales, marketing, and output.
Supply chain success depends on the firm’s level of resilience and how it handles the threats. The issue is sensitive to SMEs due to the dynamics of the sector. Supply Chain Resilience practices enable firms to cope with quick changes through flexibility [7]. Agility and robustness enable the business to configure its market, sales, and production in a way that relies on creating competitive advantages over rivals. Ref. [36] argued that resilience can be created in a firm through robustness and agility. Moreover, ref. [37] added factors such as risk management, leadership, and innovation. Flexibility and redundancy created through robustness strategy have also been found by [7,38] to be advantageous to the movements of firms’ products and enhance the overall performance levels of a firm’s supply chain. This discussion leads to the following hypothesis being developed:
Hypothesis 7 (H7).
Supply Chain Resilience has a significant positive relationship with the performance of SMEs.

3. Methodology

3.1. Research Design

Research design plans guarantee that the researcher can perform the procedure without interruption [39], making it possible to avoid difficulties associated with data collection, analysis, and information gathering by developing a pre-planned study strategy [40]. The research process onion, developed by [40], was employed in this paper as a technique for the research methodology. In this study, the research philosophy is positivism, implying that the obtained data through scientific means are only considered credible and knowledgeable and isolated from the researcher [40]. Positivism further means that the future is the continuity of the events of the present and past, which can be predicted and controlled by finding determining patterns and regularities among them [41].

3.2. Method

This paper’s approach was deductive. In the deductive approach of theory development, mainly existing data and data obtained through observations are tested upon hypothesis generation. This research investigated the relationships among the variables and the validation of already existing hypotheses against the supplied variables [39,40]. The quantitative methodological option better suits this study’s positivism, aiming to uncover relationships and test hypotheses [42,43].
This study also used a survey research strategy as an applied survey strategy. The questionnaire as a data collection tool was utilized and it can elaborate relationships between factors and constructs trying to answer questions such as what, who, where, why, when, and how [40]. Moreover, this study employed a cross-sectional horizon, the most commonly used temporal range of which is cross-sectional. Further, this method is considered the most optimal option by social sciences researchers [44].

3.3. Sampling Design

For sampling population purposes and to distribute the questionnaires effectively, the researcher communicated with the supervisor of the SME department in the Chamber of Commerce, who distributed the questionnaires to enterprise owners or representatives, with notes for only one response from the organization. A simple random sample (SRS) was used for data collection, a randomly selected subset of a population [39]. With this probability sampling method, each population participant had an equal chance of being selected [40]. A random sample was selected from 345 workers in SMEs in Saudi Arabia, 255 of whom responded. The response rate was 74%, which was assumed as an appropriate percentage. According to [45], sample size can be taken to concern the number of questions used in an instrument to increase the effectiveness of the research. In addition, a typical sample size was used as SEMs use approximately 200 cases [46].

3.4. Measurement

The measurement developed for this study adapted all items from valid sources and trustworthy studies (see Appendix A). All items were scored using a five-point Likert scale, with a reply to choices from 1 (“strongly disagree”) to 5 (“strongly agree”). In detail, Supply Chain Resilience was measured with 15 items derived from [1,3,5] for flexibility, agility, and robustness. In addition, the company’s performance dimensions (production performance, market, and sales performance) were measured subjectively with eight items derived from [31]. For the control variable, the researcher used firms’ age since the age of the firm is one of the control variables that appears on a recurring basis in studies on family businesses [5,44].

4. Data Analysis

For the statistical analysis and description needed by the research, the researcher used SPSS/Amos 26.

4.1. Demographic Data

Table 1 presents the frequency distribution. In terms of gender, 67.4% of the sample were male, and 32.6% of the sample were female. In terms of age, 0.8% of the sample was from 18 to 25 years, 40% were from 26 to 35 years, 52.2% were from 36 to 45 years, and 7% were above 45 years. In terms of education level, 4.7% were high school certified, 15.7% were diploma holders, 43.9% of the sample had a bachelor’s degree, 26.3% of the sample held a master’s degree, and 9.4% were Ph.D. educated. In terms of experience in years, 32.5% had less than 5 years, 41.2% of the sample had less than 5 to 10 years, 23.1% had 10 to 15 years, and 3.1% had 15 years. In terms of the age of the firm, 30.6% of firms existed for less than 10 years, 38.0% of the firms were from 20 to 30 years old, 23.1% of the firms were from 30 to 40 years old, and 8.2% of the firms were more than 40 years old.

4.2. Descriptive Statistics

Based on Table 2, it is clear that Supply Chain Resilience has an average mean of 4.010 with a small variation coefficient of 0.169. Table 2 also shows that SMEs’ performance is approximately agreed on the mean (4.040) with a small variation coefficient of 0.163. Moreover, for Supply Chain Resilience, the skewness ranged from −0497 to −0.044, and kurtosis values ranged from −0.520 to 0.561. On the other hand, for SMEs’ performance, the skewness ranged from −0.374 to −0.076, and kurtosis values ranged from 0.534 to −0.697. Consequently, the skewness and kurtosis are within the acceptable range, as argued by [47,48], who stated that the data are normal if skewness is between −2 and +2 and kurtosis is between −7 and +7.

4.3. Factor Loadings

Table 3 presents the outcomes of the factor loadings. The result indicates a mutual relationship or relationships among each indicator with the composite (construct factor). Table 3 presents the results of the manifest items’ factor loadings, which all achieved factor loading above >0.5, as proposed by [47,49]. Only the F5 indicator was deleted due to irrespective loading.

4.4. Measurement Models’ Reliability and Validity

The reliability and validity of the reflective measurement models were analyzed, the process for which entails the evaluation of internal consistency, indicator reliability, multicollinearity, convergent validity, and discriminant validity.
Cronbach’s Alpha (CA) and Composite Reliability (CR) were used as internal consistency and indicator reliability measurements. As a rule of thumb, for reliable statistics, Cronbach’s alpha values should be >0.70, and composite reliability posits all values > 0.70, as recommended by [43,47]. A CA value greater than 0.70 posits that all items to measure a variable are strongly correlated based on split-half estimates [47,50]. CR appraises the degree to which a set of variables in a specific construct is present in their estimation of a construct. Based on Table 4, the recommended value of CA and CR is 0.7 and above, which is achieved here for all constructs as recommended by [43,49]. Therefore, the overall reliability of all variables is achieved as heterogeneous but similar items under each construct.
The average variance extracted (AVE) and the variance inflation factor (VIF) were utilized and are presented in Table 4. AVE was used to assess the convergent validity, determining the level at which a group of variables stands for one and the same construct [47], whereas VIF is used to observe a multicollinearity issue in the model [51]. AVE values are greater than 0.50, as recommended by [51,52]. VIF observes a multicollinearity issue in the model. Multicollinearity influences results adversely and leads to a biased conclusion. Table 5 shows that all VIF values are in the range 1–5, as suggested by [51].
Discriminant validity refers to the degree to which questions of a variable are strongly inter-correlated to its related questions, but the correlation with other variables’ items is weak [52]. Discriminant validity values of all constructs are less than convergent values in Table 5. Therefore, the results show satisfactory discriminant validity results.

4.5. Common Method Bias

Common method bias (CMB) occurs when variations in individual answers are caused by the measurement instrument rather than the results of the respondents [53]. One of the popular methods to test if CMB is of concern is Harman’s single factor score, which determines if the total variance for a single factor is less than 50%. If the variance is less than 50%, CMB does not affect data [54]. The common method bias for a single factor in Table 6 is less than 50%. Therefore, there is no issue of common method bias in this model.

4.6. Confirmatory Factor Analysis

Table 7 presents the results of model fitness, indicating an adequate fit for the SEM model based on the independent variable Supply Chain Resilience and dependent variable SMEs performance and satisfying the goodness of fit rules. All items were fitted to the valid path along with the GFI = 0.989 > 0.90 and CFI = 0.992 > 0.90, as suggested by [50] and RMSEA = 0.057 < 0.10, as suggested by [1,55]. Finally, the CMIN/DF value is 1.811 < 3.0 [46]. Consequently, the overall SEM model fits.

5. Results and Discussion

For the control variable, based on the results from the one-way ANOVA, it is observed that the control variable age of the firm shows that there is no significant difference in SMEs’ performance in terms of age of the firm based on the value of F statistics of 1.747, which is insignificant at a 5% level (Table 8).

5.1. Structural Equation Modeling

The main reason to use structural equation modeling is to represent causal relationships among the variables. Relationships represented by the structural equation modeling depict the hypotheses of the research, making it of particular importance [50]. Moreover, this tool helps to estimate the multiple and interrelated independence throughout the single analysis, and the following Figure 2 are SEM Model 1 and SEM Combined Model 2.

5.2. Hypothesis Testing

The path analysis in AMOS was performed for hypothesis testing. The following table (Table 9) presents the path analysis results.
For H1. “Supply Chain Agility has a positive relationship with the production performance of SMEs”. The findings suggest that supply chain agility has a positive relationship with the production performance of SMEs with a p-value of 0.00. This finding is in line with the previous hypothesis that agility has a significant positive relationship with a firm’s marketing and sales functions. When an operating market is full of unpredicted changes, agility is useful in enhancing firm responsiveness and the effectiveness of the strategies undertaken [14]. For SMEs, management should encourage employees to be vigilant and develop a culture of assessing business opportunities in the downstream and upstream supply chains [56].
For H2. “Supply Chain Agility has a positive relationship with the marketing and sales performance of SMEs”. The results indicate that agility has a significant positive relationship with a firm’s market and sales performance. The p-value of 0.00 indicates that agility is a key factor in the success or failure of the supply chain of an SME, denoting the importance of the speed at which an SME responds to the disturbances caused in the market. A number of studies support this result [1,5,32]. However, it has also been found that SMEs’ agile supply chain requires the firms to utilize market knowledge and virtual corporations to exploit opportunities in an uncertain market. Ref. [6] asserted that greater agility of the supply chain is reliant on a business having capable partners.
For H3. “Supply Chain Robustness has a positive relationship with the production performance of a SMEs”. The findings show that the Supply Chain Robustness and production performance relationship has a p-value of 0.04, indicating a significant positive relationship between the variables. Based on the reviewed literature, it is clear that a large number of researchers have made the same observation. In [9,38] it is agreed that robustness has a significant relationship with performance when the firm makes use of reliable suppliers useful as a contingency or emergency plan. For [57], robustness includes the ability to buffer risk in demand [6], and the ability to withstand internal and external disruptions and natural hazards [14].
For H4. “Supply Chain Robustness has a positive relationship with the marketing and sales performance of the SMEs”. As presented in the table of SEM coefficients, the researcher found that robustness and marketing and sales performance have a p-value of 0.215. It indicates that there is no significant relationship between these variables. The result of the current paper aligns with those of [6]. The researchers highlight that robustness is not always a good thing for businesses. It causes several risks to the supply chain section of the business.
These risks are seen in the physical distribution of goods to the end consumer. There may be significant differences between the actual and forecasted demand, issues in the operating warehouse, transportation issues, or poor coordination in the supply chain. The demand side risks may lead to inefficient supply operations, obsolescence, and costly changes, an example of which is having extra inventory in warehouses anticipating remaining afloat in times of internal and external disruptions. A change in the market demand or the replacement of a product with another can cause the materials stored in the warehouse as strategic robustness to become waste due to being outdated.
Supply Chain Robustness is an aspect that [14] believed most SMEs fail to understand. Firms tend to take robustness as a static concept, which leads to the implication of a system whose operations remain unchanged regardless of interruptions. However, robustness requires changes in the firm business structure and units to maintain functionality. Many SMEs use second-choice suppliers as a robust mechanism. Ref. [14] discussed that this problem is because the use of the second supplier leads to increased direct and indirect costs to the business. However, the choice aids in responsive switching of suppliers during times of market disruptions [5]. However, not all existing studies support these results. For instance, ref. [9] asserted that robustness is significant in helping businesses conduct operations even when disruptions exist [9], such as natural calamities, supply-side, and demand-oriented risks. It was added by [6] that, for modern firms, the robustness of the supply chain is key to organizational performance as it assists in withstanding internal and external disturbances and disruptions.
For H5. “Supply Chain Flexibility has a positive association with the marketing and sales performance of SMEs”. The results indicate that the relationship between flexibility and marketing and sales performance has a p-value of 0.029. This value supports the hypothesis that there is a positive relationship between flexibility and the performance of SMEs. Though different researchers have differences in explaining what flexibility is, there is a general consensus that it is a source of competitive advantage [29] as well as lowering the cost of production [1] for SMEs. It is argued by [9] that agility is the contingency plan for a business when circumstances in the market cause unexpected business operations. This plan could include creating new marketing and sales avenues for SMEs.
For H6. “Supply Chain Flexibility has a positive association with the production of SMEs”. The p-value of 0.00 indicates a significant positive relationship between Supply Chain Flexibility and a firm’s production function. In a market like Saudi Arabia, business flexibility was seen during the COVID-19 pandemic in the form of businesses that were flexible enough to shift their operations and maintain production under strict government and health restrictions. It is agreed in [8] that flexibility plays a critical role in enabling supply chains to acclimatize and adapt to the new order of business. However, according to [32], flexibility has a negative relationship with SMEs’ sales and marketing performance. The researcher believes that using operational buffers for flexibility may cause redundancy. Redundancy is the viewpoint that companies can stack up stock waiting for the unknown instead of mobilizing them for use. This point of view is supported by [58] by noting that flexibility negates the need for resilience in a business due to the use of strategies that alter the culture and identity of a business due to changes with the effort to be flexible.
For H7. “Supply Chain Resilience has a significant positive relationship with the performance of SMEs”. The study results show that the relationship between Supply Chain Resilience and performance has a p-value of 0.00. This supports the hypothesis that there is a significant positive relationship between supply chain resilience and the performance of SMEs in Saudi Arabia. Therefore, the study results align with Nikookar & Yanadori’s definition of the supply chain as the improved chances of a firm to bounce back to operations when confronted by various market disturbances. The COVID-19 pandemic has brought about such disturbances. The factors leading to this survival are varied, but resilience has been paramount. Extending the idea of resilience, ref. [6] mentions that it is characterized by disruptions, reorganization, adaptation, and systematic change.

6. Implications

6.1. Theoretical Implications

In Saudi Arabia, SMEs have showcased resilience by lowering the costs of distribution and improving delivery speed and reliability. Supporting this notion, ref. [30] argues that a resilient supply chain allows firms to develop managerial capabilities to handle unplanned business disruptions. Logistic functions are managed so that there is a reduction in lead time, all suppliers are verified before selection, and the transportation network is robust and reliable [9]. The flexibility of having a contingent supplier offers SMEs the advantage of handling unexpected changes in the supply chain inputs. Ref. [30] agreed that robust fleet management systems improve a firm’s resilience. SMEs able to restart and maintain their supply chain operations in the face of COVID-19 were those that implemented most of the things that make up resilience. Ref. [36] argue that resilience can be created in a firm through robustness and agility. According to [26], Supply Chain Resilience has a significant positive relationship with customer demand, which shows that supply chain resilience benefits marketing and the short- and long-term performance of an SME [9].
As indicated by both the literature review and the study findings, resilience is becoming increasingly important in the running and growth of SMEs in the contemporary business market. The current research aims to contribute to the definition of Supply Chain Resilience by properly explaining the various aspects and practices leading to resilience, including robustness, agility, and flexibility [5]. The research contributes to the knowledge that SMEs in Saudi Arabia should use robustness to enhance production performance and not sales and marketing performance. The research also conducted a vast literature review, which contributes to further research on the identified research gap.

6.2. Practical Implications

The research findings are expected to offer practical implications in the supply chain controlled by SMEs. In this light, the research found that, while it is important that a business is able to withstand and survive market turbulence, it should do so under reasonable costs [14]. The researchers anticipate that supply chain operators recognize that robustness leads to higher costs in the marketing and sales function [5]. The anecdotal evidence suggests that the Saudi Arabian SMEs are agile, as well as flexible to adapt when faced with disruption in their supply chain. These SMEs are nimble and quick to learn to adjust their marketing, sales, and production activities depending on the market situation. It has been observed during the recent COVID-19 pandemic lockdowns that many of these SMEs never had an online presence. However, as soon as they were struck by the pandemic-related disruptions, these SMEs quickly turned around by learning and creating an online presence and became vibrantly visible to their target market and beyond. Furthermore, by exploring how businesses can boost their performance by withstanding adversity and workplace challenges, the study offers significant implications for SMEs’ practical approach to challenges while enhancing their performance. For example, when faced with global pandemics like COVID-19 that disrupt the global supply chain, the study offers a pathway for SMEs to bounce back to business while maintaining a high performance during that time. Lowering the costs of distribution and improving delivery speed and reliability is an example of a practical approach to demonstrate resilience in the supply chain [14].

7. Limitations and Future Research

While this research aids in filling a research gap on the influence of resilience on performance, further studies are required. The limitations also create a space for future research to cover. Since the current research is a quantitative study, further studies should be conducted using mixed methods, which will aid in gaining in-depth data and various perceptions. The researcher suggests conducting a mixed-method study that involves interviews with managers to obtain a more comprehensive understanding of how the organizations deal with turbulence and how resilience helps. Furthermore, since the present study is limited to the context for SME context, future research projects should collect empirical data from more companies and different industrial sectors to determine if the findings vary across industries.

8. Conclusions

The main aim of the current research was to determine the influence of supply chain resilience on SMEs’ performance in Saudi Arabia. The study results show a significant positive relationship between resilience and performance, except for one hypothesis not supported. The elements of resilience in the study include agility, robustness, and flexibility. Agility and flexibility have a significant positive relationship with SMEs’ sales and marketing performance functions. Agility aids in a swift change in the operations to support product marketing and sales. Flexibility enables the business management to stay prepared to handle any business operations caused by unplanned business disruptions. However, the robustness variable does not support the resilience of the SMEs in Saudi Arabia. Having the extra inventory, for example, requires higher costs and extra time for business operations. SMEs may also face the risk of being associated with having redundant and obsolete products when implementing a robustness strategy. However, looking through the lens of production, robustness has a significant positive role because it enables the supply operation to continue even in times of scarcity in the market. In addition, robustness offers SMEs the absorption of internal and external disruptions.

Author Contributions

Conceptualization, M.A.A. and M.A.S.; Data curation, M.A.A.; Formal analysis, M.A.A.; Investigation, M.A.A.; Methodology, M.A.A.; Project administration, M.A.A.; Supervision, M.A.S.; Validation, M.A.A.; Visualization, M.A.A.; Writing – original draft, M.A.A.; Writing – review & editing, M.A.S. All authors have read and agreed to the published version of the manuscript.

Funding

This Research received no external funding.

Conflicts of Interest

The authors declare no conflict of interest.

Appendix A

Table A1. Questionnaire Development.
ConstructCodeQuestionSource
FlexibilityF1It is possible to switch the purchase of items from one supplier to another[1]
F2It is possible to change the quantity of the supplier’s order
F3Different modes of transportation are available in delivering products to the customers
F4Production capacity is sufficient to accommodate an increase in demand
F5Overtime or temporary worker is possible to cope with short term demand fluctuation
F6Most suppliers are capable of producing a small quantity due to relatively low setup costs
AgilityA1We reconfigure supply chain resources to respond to the sudden changes in supply/demand[5]
A2We adapt supply chain processes to reduce lead time
A3We adjust supply chain processes to increase (the ratio of) in time delivery
A4We streamline supply chain processes to reduce non-value-added activities
A5We adapt supply chain processes to reduce new product development
RobustnessTo what extent do these statements apply to your supply chain?[3]
R1For a long time, our supply chain retains the same stable situation as it had before changed occur
R2When changes occur, our supply chain grants us much time to consider a reasonable reaction
R3Without adaptations being necessary, our supply chain performs well over a wide variety of possible
R4For a long time, our supply chain is able to carry out its functions despite some damage done to it
Marketing & sales performanceHow does your firm compare to competitors with regard to the following aspects of production?[31]
M1Average market share growth
M2Average sales volume (units) growth
M3Average turnover growth
Production performanceP1Percentage of defect
P2Cost per operation hour
P3Capacity utilization
P4Range of products and services
P5Utilization of economic order quantity

References

  1. Nikookar, E.; Yanadori, Y. Preparing supply chain for the next disruption beyond COVID-19: Managerial antecedents of supply chain resilience. Int. J. Oper. Prod. Manag. 2021, 42, 59–90. [Google Scholar] [CrossRef]
  2. Kiers, J.; Seinhorst, J.; Zwanenburg, M.; Stek, K. Which Strategies and Corresponding Competences Are Needed to Improve Supply Chain Resilience: A COVID-19 Based Review. Logistics 2022, 6, 12. [Google Scholar] [CrossRef]
  3. Wieland, A.; Wallenburg, C.M. Dealing with supply chain risks. Int. J. Phys. Distrib. Logist. Manag. 2012, 42, 887–905. [Google Scholar] [CrossRef] [Green Version]
  4. Chen, J.; Zhao, X.; Zhou, Y. A periodic-review inventory system with a capacitated backup supplier for mitigating supply disruptions. Eur. J. Oper. Res. 2011, 219, 312. [Google Scholar] [CrossRef]
  5. Mubarik, M.S.; Bontis, N.; Mubarik, M.; Mahmood, T. Intellectual capital and supply chain resilience. J. Intellect. Cap. 2021, 23, 713–738. [Google Scholar] [CrossRef]
  6. Bakshi, N.; Kleindorfer, P. Co-opetition and Investment for Supply-Chain Resilience. Prod. Oper. Manag. 2009, 18, 583–603. [Google Scholar] [CrossRef]
  7. Olivares-Aguila, J.; Vital-Soto, A. Supply Chain Resilience Roadmaps for Major Disruptions. Logistics 2021, 5, 78. [Google Scholar] [CrossRef]
  8. Siagian, H.; Tarigan, Z.; Jie, F. Supply Chain Integration Enables Resilience, Flexibility, and Innovation to Improve Business Performance in COVID-19 Era. Sustainability 2021, 13, 4669. [Google Scholar] [CrossRef]
  9. Abeysekara, N.; Wang, H.; Kuruppuarachchi, D. Effect of supply-chain resilience on firm performance and competitive advantage. Bus. Process Manag. J. 2019, 25, 1673–1695. [Google Scholar] [CrossRef]
  10. Al-Hanawi, M.K. Socioeconomic determinants and inequalities in the prevalence of non-communicable diseases in Saudi Arabia. Int. J. Equity Health 2021, 20, 174. [Google Scholar] [CrossRef] [PubMed]
  11. Tukamuhabwa, B.R.; Stevenson, M.; Busby, J.; Zorzini, M. Supply chain resilience: Definition, review and theoretical foundations for further study. Int. J. Prod. Res. 2015, 53, 5592–5623. [Google Scholar] [CrossRef]
  12. Lopes, J.M.; Gomes, S.; Mané, L. Developing Knowledge of Supply Chain Resilience in Less-Developed Countries in the Pandemic Age. Logistics 2022, 6, 3. [Google Scholar] [CrossRef]
  13. Thun, J.-H.; Drüke, M.; Hoenig, D. Managing uncertainty—An empirical analysis of supply chain risk management in small and medium-sized enterprises. Int. J. Prod. Res. 2011, 49, 5511–5525. [Google Scholar] [CrossRef]
  14. Ji, L.; Yuan, C.; Feng, T.; Wang, C. Achieving the environmental profits of green supplier integration: The roles of supply chain resilience and knowledge combination. Sustain. Dev. 2020, 28, 978–989. [Google Scholar] [CrossRef]
  15. Finch, P. Supply chain risk management. Supply Chain Manag. 2004, 9, 183–196. [Google Scholar] [CrossRef]
  16. Wedawatta, G.; Ingirige, B.; Amaratunga, D. Building Up Resilienc E of Construction Sector Smes and Their Supply Chains to Extreme Weather Events. Int. J. Strat. Prop. Manag. 2010, 14, 362–375. [Google Scholar] [CrossRef] [Green Version]
  17. Sullivan-Taylor, B.; Branicki, L. Creating resilient SMEs: Why one size might not fit all. Int. J. Prod. Res. 2011, 49, 5565–5579. [Google Scholar] [CrossRef]
  18. Al Naimi, M.; Faisal, M.N.; Sobh, R.; Uddin, S.F. Antecedents and consequences of supply chain resilience and reconfiguration: An empirical study in an emerging economy. J. Enterp. Inf. Manag. 2020, 34, 1722–1745. [Google Scholar] [CrossRef]
  19. General Authority for Statistics. Small and Medium-Sized Establishments Contribution in the Private Sector Third Quarter. 2019; Volume 9, pp. 1–5. Available online: https://www.stats.gov.sa/sites/default/files/SmallandMedium-SizedEstablishmentsContributioninthePrivateSectorQ3%2C2019EN.pdf (accessed on 11 April 2022).
  20. Althaqafi, T. Determinants influencing the supply chain performance in Saudi Arabia. Uncertain Supply Chain Manag. 2021, 9, 187–194. [Google Scholar] [CrossRef]
  21. Alhawal, H.M.; Nurunnabi, M.; Al-Yousef, N. The Impact of COVID-19 on SME in Saudi Arabia: A Large-Scale Survey. White Pap. 2020, 2, 32. Available online: https://www.monshaat.gov.sa/ (accessed on 25 March 2022).
  22. Wagner, S.M.; Bode, C. An Empirical Examination of Supply Chain Performance along Several Dimensions of Risk. J. Bus. Logist. 2008, 29, 307–325. [Google Scholar] [CrossRef]
  23. Ming, L.Y.; Omain, S.Z.B.; Kowang, T.O. Supply Chain Resilience: A Review and Research Direction. Int. J. Acad. Res. Bus. Soc. Sci. 2021, 11, 2591–2603. [Google Scholar] [CrossRef]
  24. Grima, S.; Gonz, D.; Thalassinos, E. The impact of COVID-19 on Malta and it’s economy and sustainable strategies. J. Corp. Gover. Insur. Risk. Manag. 2020, 7, 53–73. [Google Scholar] [CrossRef]
  25. Piya, S.; Shamsuzzoha, A.; Khadem, M. Analysis of supply chain resilience drivers in oil and gas industries during the COVID-19 pandemic using an integrated approach. Appl. Soft. Comput. 2022, 121, 108756. [Google Scholar] [CrossRef] [PubMed]
  26. Brandon-Jones, E.; Squire, B.; Autry, C.W.; Petersen, K.J. A Contingent Resource-Based Perspective of Supply Chain Resilience and Robustness. J. Supply Chain Manag. 2014, 50, 55–73. [Google Scholar] [CrossRef] [Green Version]
  27. Matthyssens, P.; Johnston, W.J. Marketing and sales: Optimization of a neglected relationship. J. Bus. Ind. Mark. 2006, 21, 338–345. [Google Scholar] [CrossRef]
  28. Pettit, T.J.; Croxton, K.L.; Fiksel, J. The Evolution of Resilience in Supply Chain Management: A Retrospective on Ensuring Supply Chain Resilience. J. Bus. Logist. 2019, 40, 56–65. [Google Scholar] [CrossRef]
  29. Bevilacqua, M.; Ciarapica, F.; Marcucci, G. Supply Chain Resilience research trends: A literature overview. Elsevier 2019, 52, 2821–2826. [Google Scholar] [CrossRef]
  30. Zhang, D.; Dadkhah, P.; Ekwall, D. How robustness and resilience support security business against antagonistic threats in transport network. J. Transp. Secur. 2011, 4, 201–219. [Google Scholar] [CrossRef]
  31. Rezaei, J.; Ortt, R. Entrepreneurial orientation and firm performance: The mediating role of functional performances. Manag. Res. Rev. 2018, 41, 2040–8269. [Google Scholar] [CrossRef] [Green Version]
  32. Gružauskas, V.; Vilkas, M. Managing capabilities for supply chain resilience through it integration. Econ. Busin. 2017, 31, 30–43. [Google Scholar] [CrossRef] [Green Version]
  33. Ferreira, C.; Cardoso, C.; Travassos, M.; Paiva, M.; Pestana, M.; Lopes, J.; Oliveira, M. Disorders, Vulnerabilities and Resilience in the Supply Chain in Pandemic Times. Logistics 2021, 5, 48. [Google Scholar] [CrossRef]
  34. Fujita, M.; Hamaguchi, N.; Kameyama, Y. Spatial Economics for Building Back Better: The Japanese Experience; Springer Nature Singapore Pte Ltd.: Singapore, 2021; ISBN 978-981-16-4950-9. [Google Scholar]
  35. Brusset, X.; Teller, C. Supply chain capabilities, risks, and resilience. Int. J. Prod. Econ. 2017, 184, 59–68. [Google Scholar] [CrossRef]
  36. Bouaziz, F.; Hachicha, Z.S. Strategic human resource management practices and organizational resilience. J. Manag. Dev. 2018, 37, 537–551. [Google Scholar] [CrossRef]
  37. Sabahi, S.; Parast, M.M. Firm innovation and supply chain resilience: A dynamic capability perspective. Int. J. Logist. Res. Appl. 2020, 23, 254–269. [Google Scholar] [CrossRef]
  38. Mackay, J.; Munoz, A.; Pepper, M. Conceptualising redundancy and flexibility towards supply chain robustness and resilience. J. Risk Res. 2019, 23, 1541–1561. [Google Scholar] [CrossRef]
  39. Bryman, A. Social Research Methods, 4th ed.; Oxford University Press: Cambridge, UK, 2012. [Google Scholar]
  40. Saunders, M.N.K.; Lewis, P.; Thornhill, A. Research Methods for Business Students, 8th ed.; Pearson Education: London, UK, 2019; Chapter 4; ISBN 978-129-220-878-7. [Google Scholar]
  41. Guilbault, G.G.; Hjelm, M. Nomenclature for automated and mechanised analysis (Recommendations 1989). Pure Appl. Chem. 1989, 61, 1657–1664. [Google Scholar] [CrossRef]
  42. Salvato, C.; Vassolo, R. The sources of dynamism in dynamic capabilities. Strat. Manag. J. 2017, 39, 1728–1752. [Google Scholar] [CrossRef]
  43. Hair, J.F., Jr.; Black, W.C.; Anderson, R.E. Multivariate Data Analysis, 8th ed.; Cengage Learning EMEA: Hampshire, UK, 2018; ISBN 978-1-4737-5654-0. [Google Scholar]
  44. Holling, C.S. Resilience and Stability of Ecological Systems. Annu. Rev. Ecol. Syst. 1973, 4, 1–23. [Google Scholar] [CrossRef] [Green Version]
  45. Smith, S.; Zhanga, Y.; Jenkinson, M.; Chenab, J.; Matthews, P.M.; Federico, A.; de Stefano, N. Accurate, Robust, and Automated Longitudinal and Cross-Sectional Brain Change Analysis. NeuroImage 2002, 17, 479–489. [Google Scholar] [CrossRef] [Green Version]
  46. Kline, R.B. Response to Leslie Hayduk’s review of principles and practice of structural equation modeling. Can. Stud. Popul. 2018, 45, 188–195. [Google Scholar] [CrossRef]
  47. Hair, J.F.; Ringle, C.M.; Gudergan, S.P.; Fischer, A.; Nitzl, C.; Menictas, C. Partial least squares structural equation modeling-based discrete choice modeling: An illustration in modeling retailer choice. Bus. Res. 2018, 12, 115–142. [Google Scholar] [CrossRef] [Green Version]
  48. Byrne, B.M. Structural Equational Modeling with AMOS Blue Book; Routledge: New York, NY, USA, 2010; ISBN 978-080-586-372-7. [Google Scholar]
  49. Henseler, J.; Ringle, C.M.; Sinkovics, R.R. The use of partial least squares path modeling in international marketing. Adv. Int. Mark. 2009, 20, 277–319. [Google Scholar] [CrossRef] [Green Version]
  50. Mueller, R.O.; Hancock, G.R. Best Practices in Structural Equation Modeling. In Best Practices in Quantitative Methods; SAGE Publications: Thousand Oaks, CA, USA, 2008; pp. 488–510. [Google Scholar]
  51. O’Brien, R.M. A Caution Regarding Rules of Thumb for Variance Inflation Factors. Qual. Quant. 2007, 41, 673–690. [Google Scholar] [CrossRef]
  52. Fornell, C.; Larcker, D.F. SEM with Unobservable Variables and Measurement Error: Algebra and Statistics. J. Mark. Res. 1981, 18, 1–16. [Google Scholar] [CrossRef]
  53. Podsakoff, P.M.; MacKenzie, S.B.; Podsakoff, N.P. Sources of method bias in social science research and recommendations on how to control it. Annu. Rev. Psychol. 2012, 63, 539–569. [Google Scholar] [CrossRef] [Green Version]
  54. Jordan, P.J.; Troth, A.C. Common method bias in applied settings: The dilemma of researching in organizations. Aust. J. Manag. 2020, 45, 3–14. [Google Scholar] [CrossRef]
  55. Rawdhan, A.A. Access to finance by Saudi SMEs. Jcironline Com. 2021, 4, 1–9. [Google Scholar]
  56. Benzidia, S.; Makaoui, N. Improving SMEs performance through supply chain flexibility and market agility: IT orchestration perspective. Supply Chain Forum Int. J. 2020, 21, 173–184. [Google Scholar] [CrossRef]
  57. Fainshmidt, S.; Wenger, L.; Pezeshkan, A.; Mallon, M.R. When do Dynamic Capabilities Lead to Competitive Advantage? The Importance of Strategic Fit. J. Manag. Stud. 2018, 56, 758–787. [Google Scholar] [CrossRef]
  58. Kamalahmadi, M.; Shekarian, M.; Parast, M.M. The impact of flexibility and redundancy on improving supply chain resilience to disruptions. Int. J. Prod. Res. 2021, 60, 1992–2020. [Google Scholar] [CrossRef]
Figure 1. Conceptual model.
Logistics 06 00047 g001
Figure 2. Structural Equation Modeling 1 and 2.
Logistics 06 00047 g002
Table 1. Demographic data of respondents.
VariableFrequencyPercent
GenderMale17267.4
Female8332.6
Age18–2520.80
26–3510240.0
36–4513352.2
Above 45187.0
EducationHigh school124.7
Diploma4015.7
Bachelor11243.9
Master6726.3
PhD249.4
Experience YearsLess than five years8332.5
Five to 10 years10541.2
10 to 15 years5923.1
Over 15 years83.1
Firm ageLess than 10 years7830.6
10 to 20 years9738
20 to 30 years5923.1
Over 30 years218.2
Table 2. Descriptive Statistics.
StatementMeanS.DC.V.SkewnessKurtosis
Agility
We reconfigure supply chain resources to respond to the sudden changes in supply/demand4.0710.7280.179−0.4790.075
We adapt supply chain processes to reduce lead time3.9200.7170.183−0.264−0.122
We adjust supply chain processes to increase (the ratio of) in time delivery4.0120.6370.159−0.3790.495
We streamline supply chain processes to reduce non-value-added activities4.0160.6760.168−0.4050.404
We adapt supply chain processes to reduce new product development3.9800.6360.160−0.1680.057
Robustness
To what extent do these statements apply to your supply chain?
For a long time, our supply chain retains the same stable situation as it had before changes occur3.8780.7240.187−0.250−0.142
When changes occur, our supply chain grants us much time to consider a reasonable reaction3.9060.7260.186−0.291−0.094
Without adaptations being necessary, our supply chain performs well over a wide variety of possible3.9920.6930.174−0.4900.561
For a long time, our supply chain can carry out its functions despite some damage done to it4.0490.6980.172−0.4920.410
Flexibility
It is possible to switch the purchase of items from one supplier to another3.9780.6640.167−0.144−0.247
It is possible to change the quantity of the supplier’s order4.0820.6500.159−0.2550.003
Different modes of transportation are available in delivering products to the customers4.0590.6280.155−0.044−0.453
Production capacity is sufficient to accommodate an increase in demand4.1030.6620.161−0.114−0.520
Overtime or temporary worker is possible to cope with short term demand fluctuation4.1020.6130.149−0.059−0.363
Most suppliers are capable of producing a small quantity due to relatively low setup costs4.0100.7050.176−0.290−0.179
Total Average4.0100.6770.169−0.2740.019
Marketing & Sales Performance
How does your firm compare to competitors with regard to the following aspects of production?
Average market share growth3.9710.6460.163−0.2430.193
Average sales volume (units) growth3.9550.6630.168−0.2820.192
Average turnover growth4.0670.6870.169−0.3740.534
Production Performance
Percentage of defect4.0510.6290.155−0.134−0.113
Cost per operation hour4.0820.6560.161−0.171−0.367
Capacity utilization4.0630.6740.166−0.153−0.533
Range of products and services4.0710.6600.162−0.076−0.697
Utilization of economic order quantity4.0610.6650.164−0.154−0.451
Total Average4.0400.6600.163−0.235−0.030
Table 3. Factor loadings.
VariablesItemsFactor Loading
AgilityA10.682
A20.715
A30.711
A40.732
A50.623
RobustnessR10.798
R20.812
R30.626
R40.599
FlexibilityF10.689
F20.713
F30.562
F40.701
F5Removed
F60.579
Marketing & Sales PerformanceM10.754
M20.814
M30.768
Production PerformanceP10.635
P20.745
P30.718
P40.592
P50.660
Table 4. Convergent Validity.
VariableCACRAVEVIF
Agility0.7640.8460.5261.601
Robustness0.7130.8150.5281.333
Flexibility0.7040.8920.6262.104
Marketing & Sales Performance0.7030.7960.5713.063
Production Performance0.7120.8560.5471.180
N = 255; CA = Cronbach Alpha; CR = Composite reliability, AVE = Average variance extracted; VIF = Variance inflation factor.
Table 5. Discriminant Validity.
Variables12345
Agility0.727
Robustness0.6210.725
Flexibility0.3380.5980.791
Market & Sales Performance0.5810.6350.5550.756
Production Performance0.3210.4210.2340.4530.740
Source: Survey data (N = 255).
Table 6. Common Method Bias.
Total Variance Explained
ComponentInitial EigenvaluesExtraction Sums of Squared Loadings
Total% of VarianceCumulative %Total% of VarianceCumulative %
16.08927.67727.6776.08927.67727.677
21.9698.94936.626
31.8138.24044.865
41.6577.53452.399
51.2675.76058.159
61.2415.64363.802
70.9294.22468.026
80.9084.12672.152
90.8053.65775.810
100.6382.90078.710
110.6262.84681.556
120.5822.64684.203
130.5602.54686.748
140.5322.41989.168
150.4872.21491.382
160.4582.08093.462
170.3951.79695.258
180.3631.65196.909
190.3271.48598.394
200.1820.82699.221
210.1260.57299.793
220.0460.207100.000
Extraction method: Principal component analysis
Table 7. Fitting Index of SEM Model.
IndexGoodness of Fit RuleModel
Goodness of Fit (GFI)>0.900.989
Comparative Fit Index (CFI)>0.900.992
Root Mean Square Error of Approximation (RMSEA)<0.100.057
CMIN/DF<51.811
Table 8. One-way ANOVA Age of Firm and SMEs Performance SEMs.
Sum of SquaresDFMean SquareFSig.
Between Groups0.80530.2681.7470.158
Within Groups38.5422510.154
Total39.347254
Table 9. SEM Path Coefficients.
Path CoefficientsS.CS.E.C.R.p-ValueResult
H1Agility > Production Performance0.2290.0533.8550.000Supported
H2Agility > Marketing/Sales Performance0.3520.1153.2970.000Supported
H3Robustness > Production Performance0.1590.0532.8790.004Supported
H4Robustness > Marketing/Sales Performance−0.1190.111−1.2400.215Not Supported
H5Flexibility > Production Performance0.9120.1995.7560.000Supported
H6Flexibility > Marketing/Sales Performance0.2060.1432.1830.029Supported
H7Supply Chain Resilience > SEMs Performance1.2320.1335.7430.000Supported
Publisher’s Note: MDPI stays neutral with regard to jurisdictional claims in published maps and institutional affiliations.

