
Untargeted Lipidomics and Chemometric Tools for the Characterization and Discrimination of Irradiated Camembert Cheese Analyzed by UHPLC-Q-Orbitrap-MS
 ,
, 
Abstract
:
1. Introduction
2. Materials and Methods
2.1. Chemicals and Working Standard Solutions
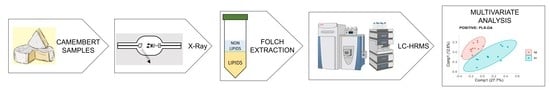
2.2. X-ray Irradiation Treatment
2.3. Sample Extraction
2.4. Untargeted Analysis
2.5. Statistical Analysis
Diagnostic Statistics
3. Results and Discussion
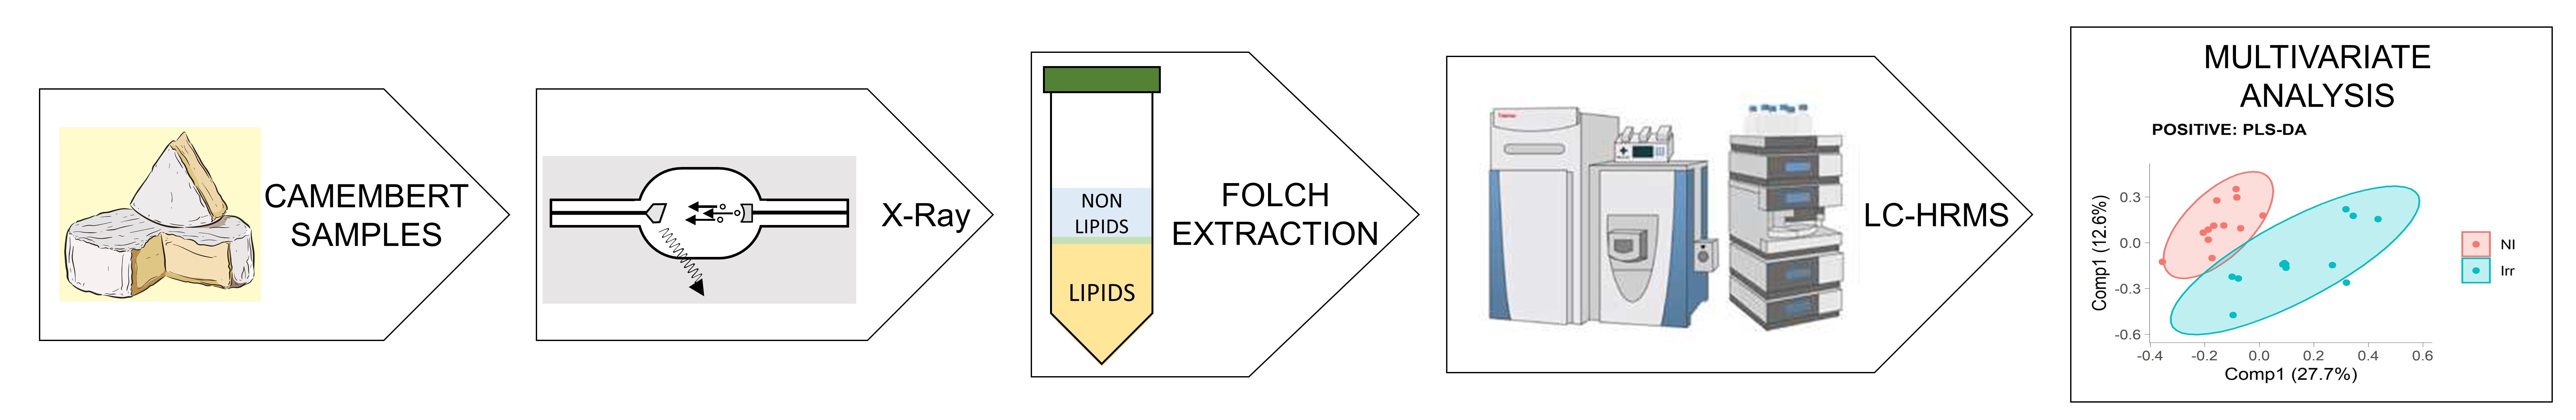
3.1. Lipid Identification and Characterization
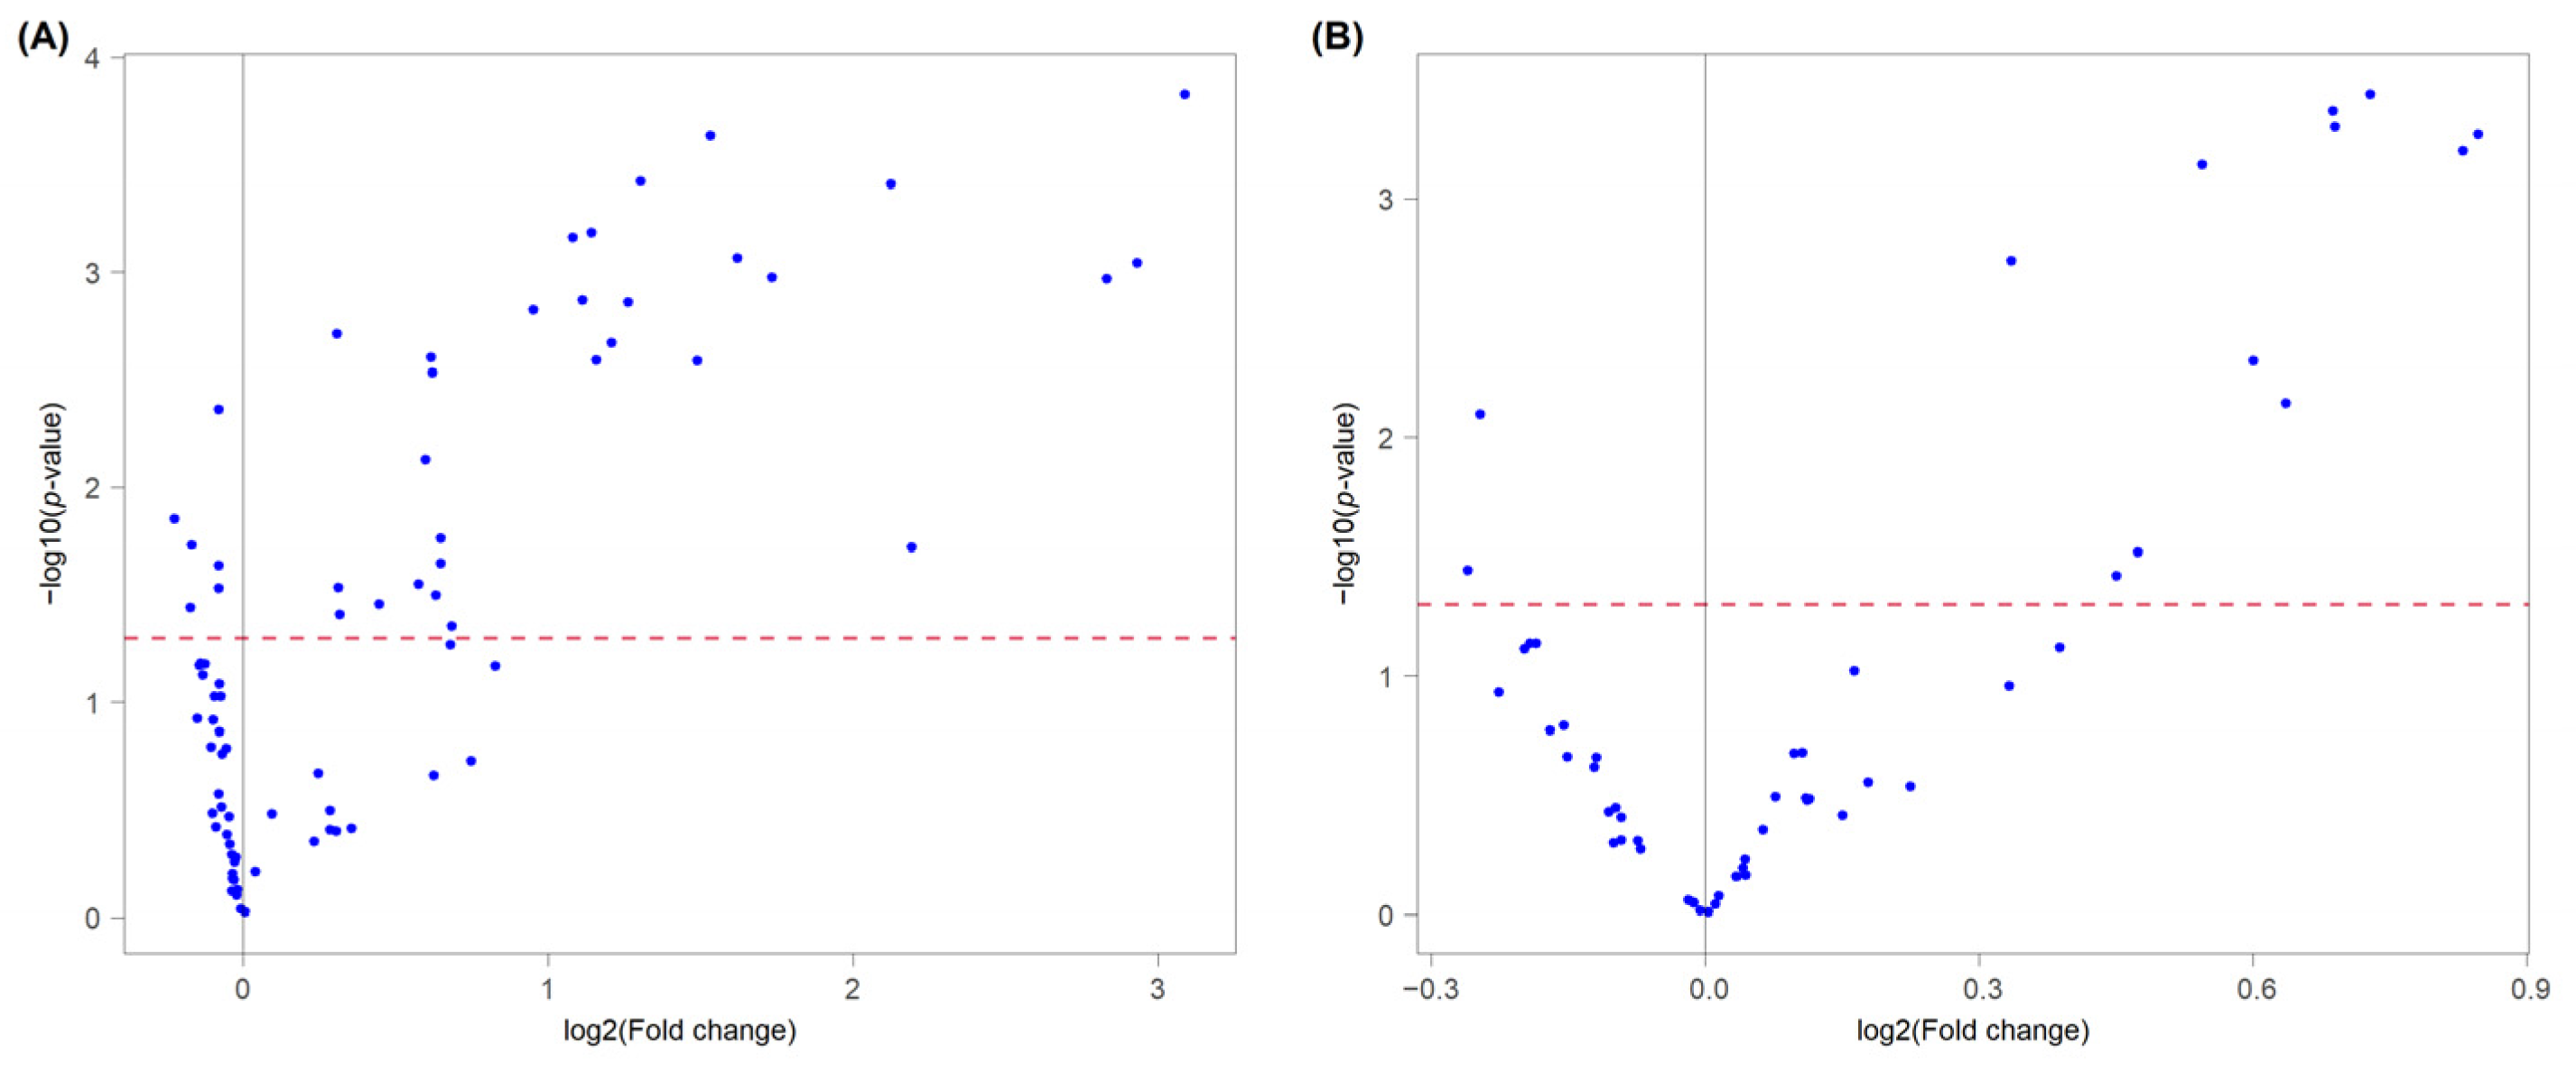
Oxidized Lipids
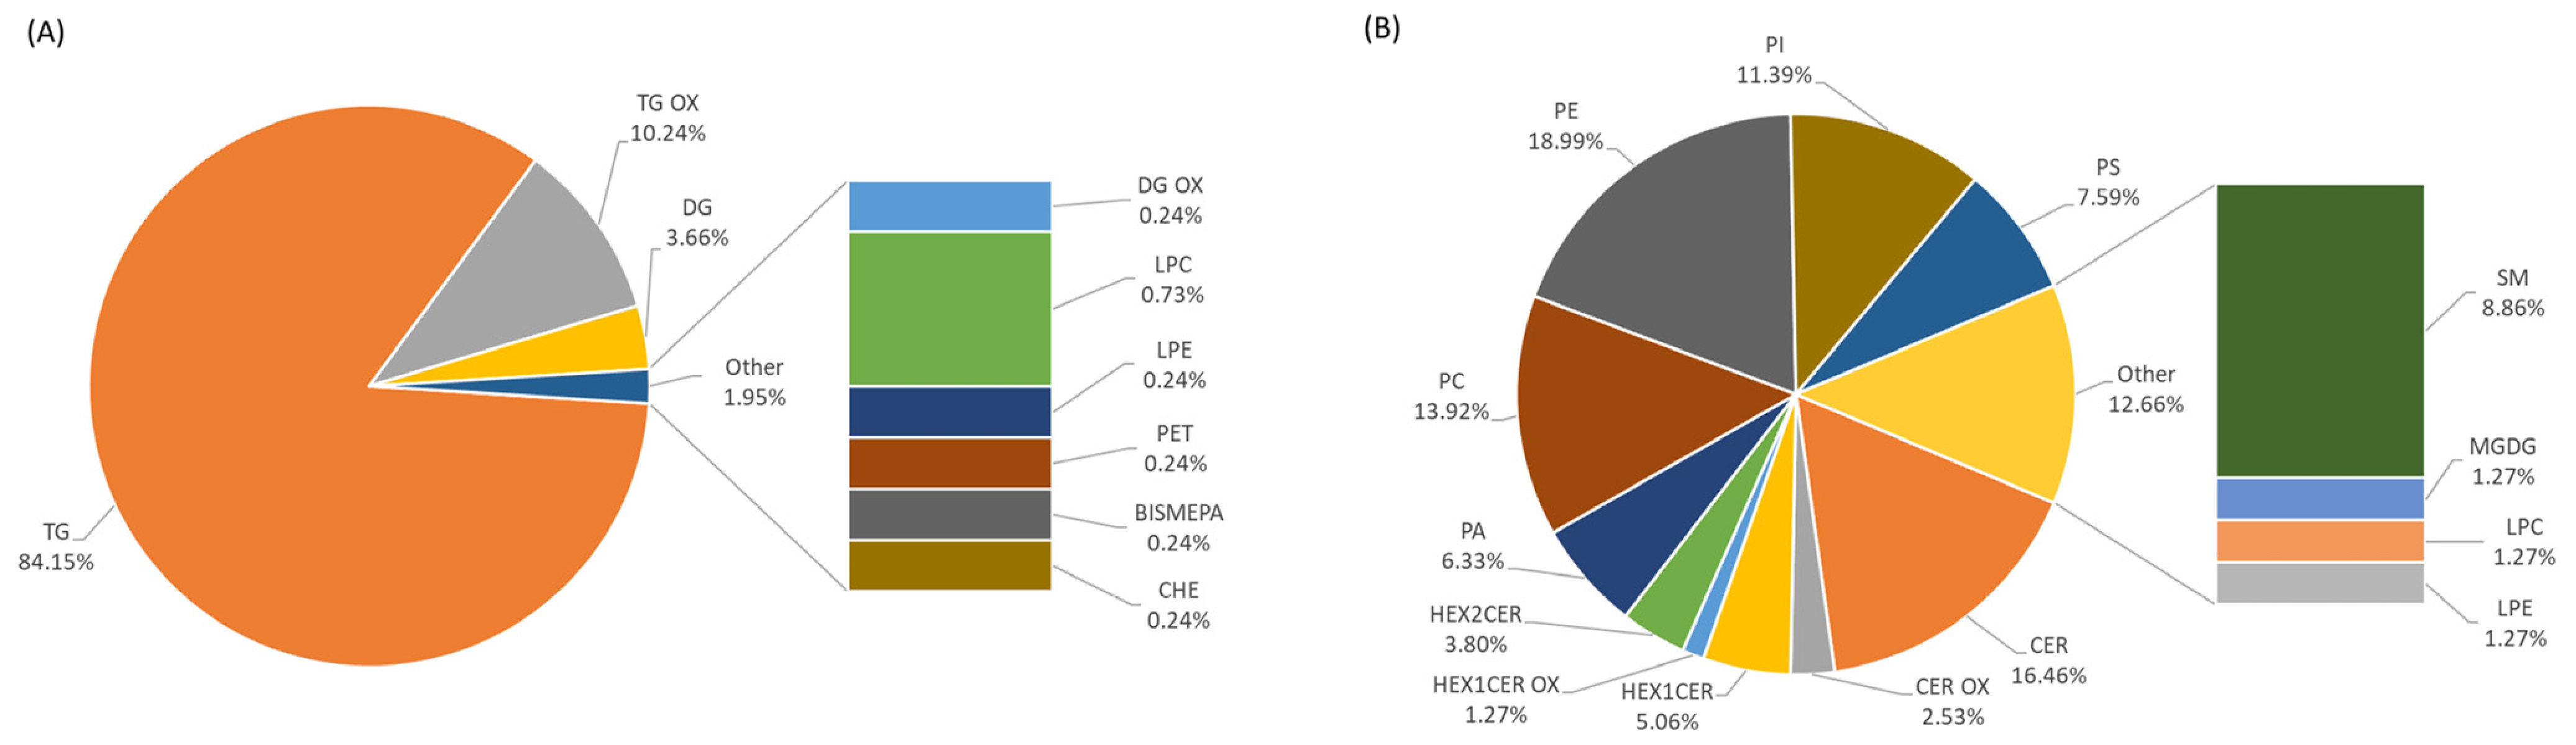
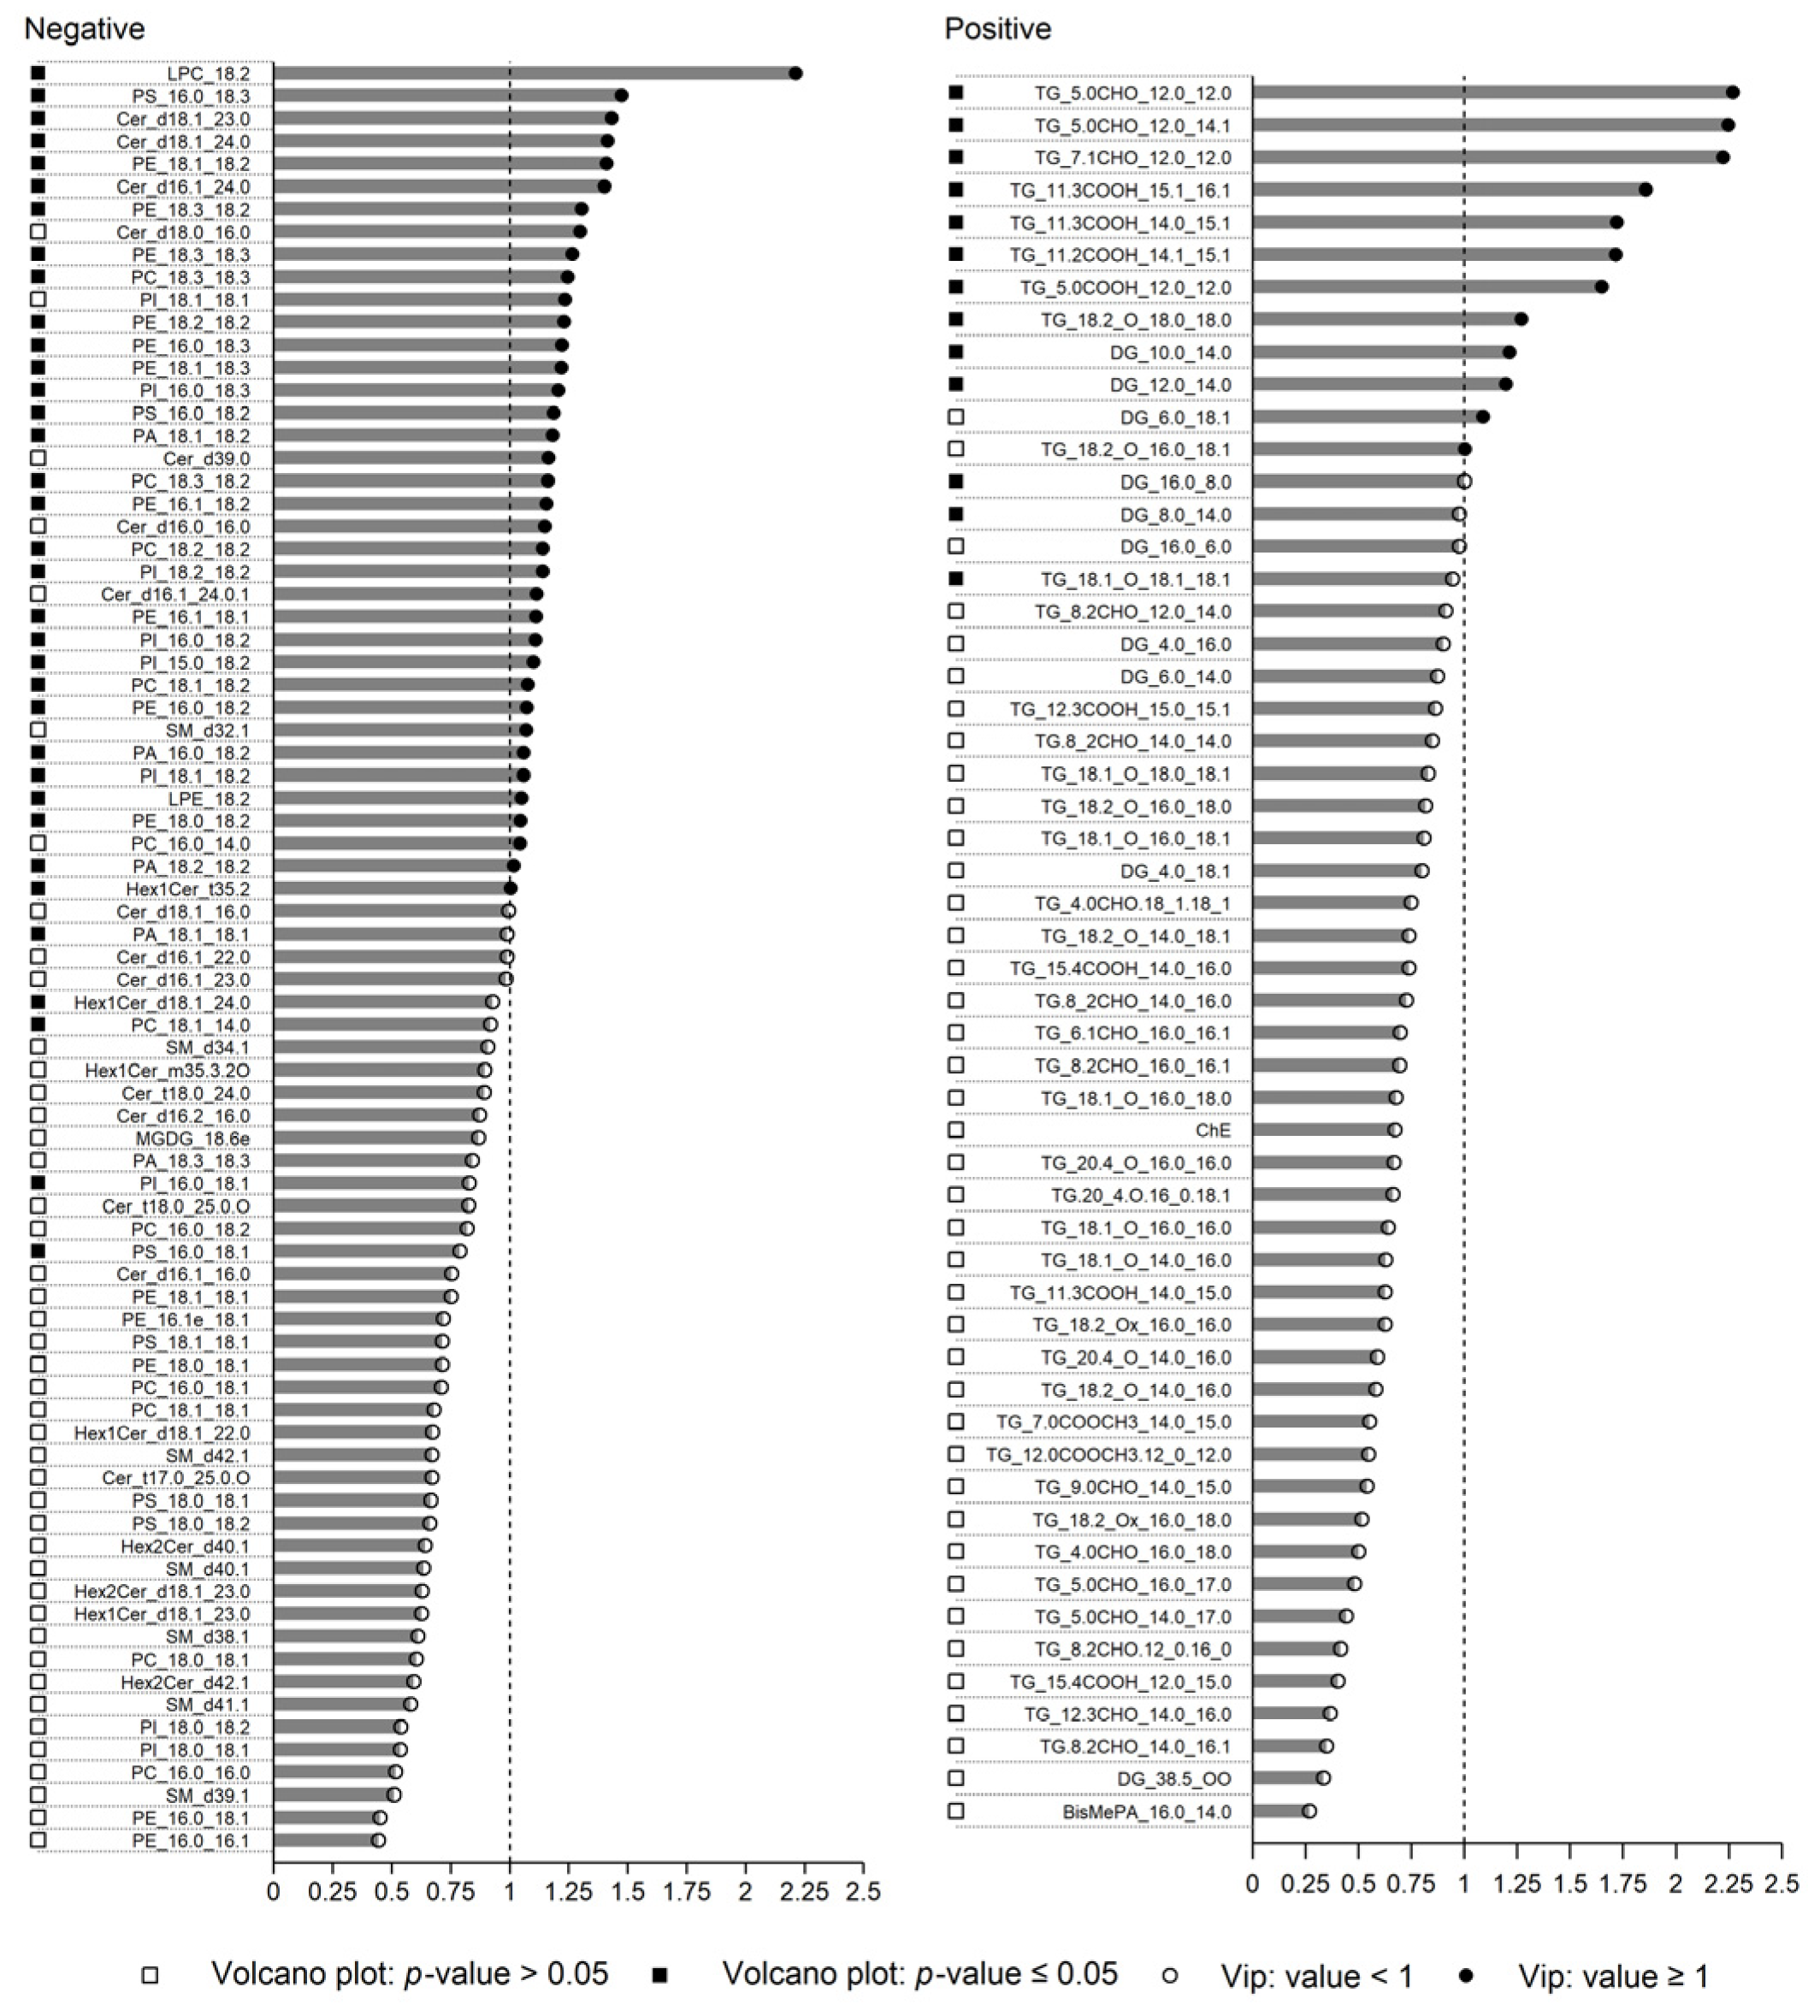
3.2. Chemometrics
3.2.1. Data Exploration
3.2.2. PLS-DA Elaboration
Data Pre-Processing
PLS-DA in Double Cross-Validation
Bootstrap
Stratified Random Subsampling
Kennard–Stone Sampling
3.2.3. LDA Elaboration
3.2.4. Permutation Test
4. Conclusions
Author Contributions
Funding
Data Availability Statement
Acknowledgments
Conflicts of Interest
References
- Leclercq-Perlat, M.-N. Cheese|Camembert, Brie, and Related Varieties. In Encyclopedia of Dairy Sciences, 2nd ed.; Fuquay, J.W., Ed.; Academic Press: San Diego, CA, USA, 2011; pp. 773–782. [Google Scholar] [CrossRef]
- Chen, X.; Gu, Z.; Peng, Y.; Quek, S.Y. What happens to commercial camembert cheese under packaging? Unveiling biochemical changes by untargeted and targeted metabolomic approaches. Food Chem. 2022, 383, 132437. [Google Scholar] [CrossRef]
- Batty, D.; Waite-Cusic, J.G.; Meunier-Goddik, L. Influence of cheese-making recipes on the composition and characteristics of Camembert-type cheese. J. Dairy Sci. 2019, 102, 164–176. [Google Scholar] [CrossRef] [PubMed]
- Fox, P.F.; Uniacke-Lowe, T.; McSweeney, P.L.H.; O’Mahony, J.A. Dairy Chemistry and Biochemistry; Springer International Publishing: Cham, Switzerland, 2015; ISBN 9783319148915. [Google Scholar]
- European Commission. Commission Regulation (EC) No 2073/2005 of 15 November 2005 on microbiological criteria for foodstuffs. Off. J. Eur. Union 2005, L 338, 1–26. [Google Scholar]
- Velasco, R.; Ordóñez, J.A. Use of E-beam radiation to eliminate Listeria Monocytogenes from surface mould cheese. Int. Microbiol. 2015, 18, 33–40. [Google Scholar] [CrossRef]
- Gkerekou, M.A.; Adam, L.A.; Papakostas, G.K.; Skandamis, P.N. Studying the effect of oxygen availability and matrix structure on population density and inter-strain interactions of Listeria Monocytogenes in different dairy model systems. Food Res. Int. 2022, 156, 111118. [Google Scholar] [CrossRef] [PubMed]
- Galli, B.D.; Martin, J.G.P.; da Silva, P.P.M.; Porto, E.; Spoto, M.H.F. Sensory quality of Camembert-type cheese: Relationship between starter cultures and ripening molds. Int. J. Food Microbiol. 2016, 234, 71–75. [Google Scholar] [CrossRef]
- Campaniello, M.; Marchesani, G.; Zianni, R.; Tarallo, M.; Mangiacotti, M.; Chiaravalle, A.E. Validation of an alternative method for the identification of 2-dodecylcyclebutanone (2-DCB) of irradiated meats by solid-phase microextraction (SPME) gas chromatography–mass spectrometry (GC-MS). Int. J. Food Sci. Technol. 2020, 55, 961–969. [Google Scholar] [CrossRef]
- Lacivita, V.; Mentana, A.; Centonze, D.; Chiaravalle, E.; Zambrini, V.A.; Conte, A.; Del Nobile, M.A. Study of X-Ray irradiation applied to fresh dairy cheese. LWT 2019, 103, 186–191. [Google Scholar] [CrossRef]
- Zianni, R.; Mentana, A.; Campaniello, M.; Chiappinelli, A.; Tomaiuolo, M.; Chiaravalle, A.E.; Marchesani, G. An investigation using a validated method based on HS-SPME-GC-MS detection for the determination of 2-dodecylcyclobutanone and 2-tetradecylcyclobutanone in X-ray irradiated dairy products. LWT 2022, 153, 112466. [Google Scholar] [CrossRef]
- Scientific Opinion on the efficacy and microbiological safety of irradiation of food. EFSA J. 2011, 9, 2103. [CrossRef]
- Patterson, M.F. The potential for food irradiation. Lett. Appl. Microbiol. 1990, 11, 55–61. [Google Scholar] [CrossRef]
- Mentana, A.; Zianni, R.; Campaniello, M.; Tomaiuolo, M.; Chiappinelli, A.; Iammarino, M.; Nardelli, V. Optimizing accelerated solvent extraction combined with liquid chromatography-Orbitrap mass spectrometry for efficient lipid profile characterization of mozzarella cheese. Food Chem. 2022, 394, 133542. [Google Scholar] [CrossRef]
- Chiesa, L.M.; Di Cesare, F.; Mosconi, G.; Pavlovic, R.; Campaniello, M.; Tomaiuolo, M.; Mangiacotti, M.; Chiaravalle, E.; Panseri, S. Lipidomics profile of irradiated ground meat to support food safety. Food Chem. 2022, 375, 131700. [Google Scholar] [CrossRef]
- Cajka, T.; Fiehn, O. Toward Merging Untargeted and Targeted Methods in Mass Spectrometry-Based Metabolomics and Lipidomics. Anal. Chem. 2016, 88, 524–545. [Google Scholar] [CrossRef] [PubMed]
- Wu, Z.; Bagarolo, G.I.; Thoröe-Boveleth, S.; Jankowski, J. “Lipidomics”: Mass spectrometric and chemometric analyses of lipids. Adv. Drug Deliv. Rev. 2020, 159, 294–307. [Google Scholar] [CrossRef]
- Checa, A.; Bedia, C.; Jaumot, J. Lipidomic data analysis: Tutorial, practical guidelines and applications. Anal. Chim. Acta 2015, 885, 1–16. [Google Scholar] [CrossRef]
- Kharbach, M.; Marmouzi, I.; El Jemli, M.; Bouklouze, A.; Vander Heyden, Y. Recent advances in untargeted and targeted approaches applied in herbal-extracts and essential-oils fingerprinting—A review. J. Pharm. Biomed. Anal. 2020, 177, 112849. [Google Scholar] [CrossRef]
- Zianni, R.; Mentana, A.; Tomaiuolo, M.; Campaniello, M.; Iammarino, M.; Centonze, D.; Palermo, C. Volatolomic approach by HS-SPME/GC–MS and chemometric evaluations for the discrimination of X-ray irradiated mozzarella cheese. Food Chem. 2023, 423, 136239. [Google Scholar] [CrossRef] [PubMed]
- Folch, J.; Lees, M.; Sloane Stanley, G.H. A simple method for the isolation and purification of total lipides from animal tissues. J. Biol. Chem. 1957, 226, 497–509. [Google Scholar] [CrossRef]
- Dudzik, D.; Barbas-Bernardos, C.; García, A.; Barbas, C. Quality assurance procedures for mass spectrometry untargeted metabolomics. A Review. J. Pharm. Biomed. Anal. 2018, 147, 149–173. [Google Scholar] [CrossRef]
- Broadhurst, D.; Goodacre, R.; Reinke, S.N.; Kuligowski, J.; Wilson, I.D.; Lewis, M.R.; Dunn, W.B. Guidelines and considerations for the use of system suitability and quality control samples in mass spectrometry assays applied in untargeted clinical metabolomic studies. Metabolomics 2018, 14, 72. [Google Scholar] [CrossRef] [PubMed]
- Breitkopf, S.B.; Ricoult, S.J.H.; Yuan, M.; Xu, Y.; Peake, D.A.; Manning, B.D.; Asara, J.M. A relative quantitative positive/negative ion switching method for untargeted lipidomics via high resolution LC-MS/MS from any biological source. Metabolomics 2017, 13, 30. [Google Scholar] [CrossRef] [PubMed]
- Kucheryavskiy, S. mdatools—R package for chemometrics. Chemometr Intell Lab Syst. 2020, 198, 103937. [Google Scholar] [CrossRef]
- Westerhuis, J.A.; van Velzen, E.J.J.; Hoefsloot, H.C.J.; Smilde, A.K. Discriminant Q2 (DQ2) for improved discrimination in PLSDA models. Metabolomics 2008, 4, 293–296. [Google Scholar] [CrossRef]
- Fawcett, T. ROC Graphs: Notes and Practical Considerations for Data Mining Researchers; Hewlett-Packard Company: Palo Alto, CA, USA, 2003; 28p. [Google Scholar]
- Chemometric Analysis to Support Untargeted Lipidomics for Characterization of Irradiated and Not Irradiated Camembert Cheese; Mendeley Data: London, UK, 2022; V1. [CrossRef]
- Reis, A.; Spickett, C.M. Chemistry of phospholipid oxidation. Biochim. Biophys. Acta -Biomembr. 2012, 1818, 2374–2387. [Google Scholar] [CrossRef]
- Ghnimi, S.; Budilarto, E.; Kamal-Eldin, A. The New Paradigm for Lipid Oxidation and Insights to Microencapsulation of Omega-3 Fatty Acids. Compr. Rev. Food Sci. Food Saf. 2017, 16, 1206–1218. [Google Scholar] [CrossRef]
- Domínguez, R.; Pateiro, M.; Gagaoua, M.; Barba, F.J.; Zhang, W.; Lorenzo, J.M. A Comprehensive Review on Lipid Oxidation in Meat and Meat Products. Antioxidants 2019, 8, 429. [Google Scholar] [CrossRef]
- Schaich, K.M. Thinking outside the classical chain reaction box of lipid oxidation. Lipid Technol. 2012, 24, 55–58. [Google Scholar] [CrossRef]
- Striesow, J.; Lackmann, J.-W.; Ni, Z.; Wenske, S.; Weltmann, K.-D.; Fedorova, M.; Von Woedtke, T.; Wende, K. Oxidative modification of skin lipids by cold atmospheric plasma (CAP): A standardizable approach using RP-LC/MS2 and DI-ESI/MS2. Chem. Phys. Lipids 2020, 226, 104786. [Google Scholar] [CrossRef]
- Szymańska, E.; Saccenti, E.; Smilde, A.K.; Westerhuis, J.A. Double-check: Validation of diagnostic statistics for PLS-DA models in metabolomics studies. Metabolomics 2012, 8, 3–16. [Google Scholar] [CrossRef]
- Andersen, C.M.; Bro, R. Variable selection in regression-a tutorial. J. Chemom. 2010, 24, 728–737. [Google Scholar] [CrossRef]
- Zhang, D.; Zhao, L.; Wang, W.; Wang, Q.; Liu, J.; Wang, Y.; Liu, H.; Shang, B.; Duan, X.; Sun, H. Lipidomics reveals the changes in non-starch and starch lipids of rice (Oryza sativa L.) during storage. J. Food Compos. Anal. 2022, 105, 104205. [Google Scholar] [CrossRef]
- Liu, Z.; Li, C.; Pryce, J.; Rochfort, S. Comprehensive characterization of bovine milk lipids: Phospholipids, sphingolipids, glycolipids, and ceramides. J. Agric. Food Chem. 2020, 68, 6726–6738. [Google Scholar] [CrossRef] [PubMed]
- Smit, S.; van Breemen, M.J.; Hoefsloot, H.C.J.; Smilde, A.K.; Aerts, J.M.F.G.; de Koster, C.G. Assessing the statistical validity of proteomics based biomarkers. Anal. Chim. Acta 2007, 592, 210–217. [Google Scholar] [CrossRef]
- Mahmood, Z.; Khan, S. On the Use of K-Fold Cross-Validation to Choose Cutoff Values and Assess the Performance of Predictive Models in Stepwise Regression. Int J Biostat. 2009, 5, 25. [Google Scholar] [CrossRef]
- Rodríguez-Pérez, R.; Fernández, L.; Marco, S. Overoptimism in cross-validation when using partial least squares-discriminant analysis for omics data: A systematic study. Anal. Bioanal. Chem. 2018, 410, 5981–5992. [Google Scholar] [CrossRef] [PubMed]
- Kennard, R.W.; Stone, L.A. Computer Aided Design of Experiments. Technometrics 1969, 11, 137–148. [Google Scholar] [CrossRef]


| Operating Chromatographic Conditions | MS Setting | Data Processing LipidsearchTM Software | |||
|---|---|---|---|---|---|
| Sample temperature | 18 °C | Scan range (m/z) | 150–2000 | Search parameters | |
| Column and security guard column | Accucore C30 column (150 × 2.1 mm 2.6 µm column, Thermo) with a security guard column ULTRA Cartridges UHPLC wide-pore C18 (AJ0-8769, 2 × 4.6 mm ID, with sub-2 m particles, Phenomenex) | Full scan resolution (FWHM) | 70,000 | Search Class | ALL Lipids |
| Ions | +H; +NH4; +Na; +(CH3CH2)3NH; +(CH3)2NH2; +H−H2O; +H−2H2O; +2H (+) −H; +HCOO; +CH3COO; −2H; −CH3 (−) | ||||
| Inject Volume | 2 µL (+); 4 µL (−) | Multiple data-dependent (dd-MS2) scan resolution (FWHM) | 17,500 | Identification | Precursor tolerance: 5.0 (+); 8.0 (−) ppm |
| Product tolerance: 8.0 (+); 10.0 (−) ppm | |||||
| m-Score threshold: 5.0 | |||||
| Database: General; HCD; Oxid. GPL; labelled GPL, GL, SP, ChE | |||||
| Phase A | ACN/H2O (60:40, v/v), 10 mM NH4HCO2 and 0.1% HCO2H | Search Filters | Top rank filter | ||
| Main node filter: all isomer peak | |||||
| FA priority | |||||
| ID quality filter: A, B, C D | |||||
| Phase B | IPA/ACN (90:10, v/v), 10 mM NH4HCO2 and 0.1% HCO2H | Spray voltage (kV) | 3.4 (+); 3.3 (−) | Alignment Parameters | |
| Flow rate | 270 µL min−1 | Capillary temperature (°C) | 290 | Search Type | Product |
| Elution gradient | Auxiliary gas heater (°C) | 290 | Exp Type | LC-MS | |
| Time (min) | Percentage of B (%) | Sheath gas (Arb) | 32 | Normalize type | None |
| 0 | 25 | Auxiliary gas (Arb) | 8 | Alignment method | Mean |
| 4.0 | 43 | Sweep gas (Arb) | 0 | R.T. Tolerance | 0.1 |
| 4.1 | 55 | S-lens RF level | 50 | Calculate unassigned peak area | On |
| 12.0 | 65 | AGC Target | 1e6 | Top rank filter | On |
| 18.0 | 85 | Stepped normalized collision energy | 20, 30 (+); 25, 40 (−) | Main node filter | Main isomer peak |
| 20.0 | 100 | Maximum Injection time (ms) | 50 | m-score Threshold | 5.0 |
| 26.0 | 100 | AGC target for dd-MS2 | 2e5 | c-score Threshold | 2.0 |
| 26.5 | 30 | Maximum Injection time (ms) for dd-MS2 | 80 | ID Quality filter | [A, B, C, D] |
| 28.0 | 25 | Precursor isolation window | 1.2 m/z | ||
| 32.5 | 25 | Dynamic exclusion (s) | 2.5 (+), 3 (−) | ||
| Potential Lipid Markers | CAM_NI * | CAM_IRR * | Model |
|---|---|---|---|
| Negative | |||
| Cer (d16:1_24:0) | 21.60 ± 2.04 | 24.30 ± 3.05 | PLS-DA |
| Cer (d18:1_23:0) | 43.70 ± 2.42 | 46.20 ± 2.69 | PLS-DA |
| Cer (d18:1_24:0) | 41.60 ± 1.92 | 43.90 ± 1.89 | PLS-DA |
| Hex1Cer (t35:2) | 82.00 ± 34.00 | 51.10 ± 39.10 | PLS-DA |
| LPC (18:2) | 16.20 ± 17.50 | 3.54 ± 2.80 | PLS-DA |
| LPE (18:2) | 35.60 ± 22.10 | 12.70 ± 10.30 | PLS-DA |
| PA (16:0_18:2) | 190.00 ± 33.90 | 121.00 ± 87.00 | PLS-DA |
| PA (18:2_18:2) | 96.50 ± 19.30 | 62.30 ± 46.40 | PLS-DA |
| PA (18:1_18:2) | 130.00 ± 25.30 | 83.10 ± 56.20 | PLS-DA |
| PC (18:3_18:3) | 22.40 ± 17.20 | 3.15 ± 3.02 | PLS-DA/LDA |
| PC (18:3_18:2) | 74.40 ± 45.70 | 22.30 ± 18.30 | PLS-DA/LDA |
| PC (18:2_18:2) | 276.00 ± 139.00 | 119.00 ± 88.20 | PLS-DA |
| PC (18:1_18:2) | 127.00 ± 37.30 | 82.70 ± 29.30 | PLS-DA |
| PE (16:1_18:2) | 24.90 ± 10.80 | 11.80 ± 5.29 | PLS-DA/LDA |
| PE (16:0_18:3) | 38.30 ± 20.60 | 16.00 ± 4.55 | PLS-DA/LDA |
| PE (16:1_18:1) | 52.70 ± 14.80 | 42.30 ± 9.12 | PLS-DA |
| PE (16:0_18:2) | 273.00 ± 91.20 | 178.00 ± 50.00 | PLS-DA |
| PE (18:3_18:3) | 11.40 ± 8.65 | 1.49 ± 1.31 | PLS-DA/LDA |
| PE (18:3_18:2) | 43.00 ± 26.30 | 9.87 ± 7.16 | PLS-DA/LDA |
| PE (18:2_18:2) | 146.00 ± 70.30 | 50.50 ± 34.00 | PLS-DA/LDA |
| PE (18:1_18:3) | 45.20 ± 20.40 | 23.40 ± 2.80 | PLS-DA |
| PE (18:1_18:2) | 204.00 ± 36.30 | 165.00 ± 17.20 | PLS-DA |
| PE (18:0_18:2) | 145.00 ± 19.00 | 169.00 ± 26.00 | PLS-DA |
| PI (15:0_18:2) | 12.90 ± 6.14 | 5.77 ± 4.59 | PLS-DA |
| PI (16:0_18:3) | 14.70 ± 8.40 | 4.76 ± 3.78 | PLS-DA/LDA |
| PI (16:0_18:2) | 287.00 ± 121.00 | 133.00 ± 95.60 | PLS-DA/LDA |
| PI (18:2_18:2) | 23.50 ± 8.64 | 10.60 ± 8.08 | PLS-DA/LDA |
| PI (18:1_18:2) | 25.30 ± 8.74 | 16.70 ± 6.13 | PLS-DA |
| PS (16:0_18:3) | 16.00 ± 10.10 | 1.88 ± 0.98 | PLS-DA/LDA |
| PS (16:0_18:2) | 123.00 ± 55.80 | 49.80 ± 29.70 | PLS-DA/LDA |
| Positive | |||
| DG (8:0_14:0) | 102.00 ± 23.10 | 73.30 ± 35.30 | LDA |
| DG (10:0_14:0) | 135.00 ± 26.10 | 89.10 ± 42.30 | PLS-DA/LDA |
| DG (12:0_14:0) | 151.00 ± 33.00 | 96.90 ± 52.00 | PLS-DA/LDA |
| TG (11:2COOH_14:1_15:1) | 279.00 ± 70.90 | 173.00 ± 50.30 | PLS-DA/LDA |
| TG (11:3COOH_14:0_15:1) | 278.00 ± 72.80 | 172.00 ± 48.50 | PLS-DA/LDA |
| TG (11:3COOH_15:1_16:1) | 200.00 ± 25.90 | 158.00 ± 30.90 | PLS-DA/LDA |
| TG (18:1+O_18:1_18:1) | 796.00 ± 158.00 | 953.00 ± 185.00 | LDA |
| TG (18:2+O_18:0_18:0) | 1080.00 ± 196.00 | 1280.00 ± 130.00 | PLS-DA/LDA |
| TG (5:0CHO_12:0_12:0) | 214.00 ± 57.20 | 129.00 ± 36.30 | PLS-DA/LDA |
| TG (5:0CHO_12:0_14:1) | 72.60 ± 23.10 | 40.30 ± 12.20 | PLS-DA/LDA |
| TG (5:0COOH_12:0_12:0) | 35.60 ± 4.06 | 24.40 ± 8.35 | PLS-DA/LDA |
| TG (7:1CHO_12:0_12:0) | 70.50 ± 22.40 | 39.60 ± 12.60 | PLS-DA/LDA |
| Double Cross-Validation | Bootstrap | Stratified Random Subsampling | Stratified Kennard–Stone Sampling | Kennard–Stone Sampling | |
|---|---|---|---|---|---|
| Negative | |||||
| RMSECV | 0.288 | 0.407 | 0.287 | 0.164 | 0.088 |
| Q2 | 0.916 | 0.833 | 0.916 | 0.973 | 0.986 |
| DQ2 | 0.940 | 0.926 | 0.944 | 1 | 0.991 |
| Sensitivity | 1 | 0.995 | 0.999 | 1 | 1 |
| Specificity | 0.999 | 0.989 | 0.996 | 1 | 1 |
| Accuracy | 0.998 | 0.992 | 0.998 | 1 | 1 |
| Positive | |||||
| RMSECV | 0.465 | 0.471 | 0.412 | 0.500 | 0.323 |
| Q2 | 0.781 | 0.778 | 0.830 | 0.750 | 0.895 |
| DQ2 | 0.845 | 0.861 | 0.890 | 0.751 | 0.909 |
| Sensitivity | 0.976 | 0.986 | 0.997 | 1 | 1 |
| Specificity | 0.982 | 0.990 | 1 | 1 | 1 |
| Accuracy | 0.988 | 0.988 | 0.999 | 1 | 1 |
Disclaimer/Publisher’s Note: The statements, opinions and data contained in all publications are solely those of the individual author(s) and contributor(s) and not of MDPI and/or the editor(s). MDPI and/or the editor(s) disclaim responsibility for any injury to people or property resulting from any ideas, methods, instructions or products referred to in the content. |
© 2023 by the authors. Licensee MDPI, Basel, Switzerland. This article is an open access article distributed under the terms and conditions of the Creative Commons Attribution (CC BY) license (https://creativecommons.org/licenses/by/4.0/).
Share and Cite
Tomaiuolo, M.; Nardelli, V.; Mentana, A.; Campaniello, M.; Zianni, R.; Iammarino, M. Untargeted Lipidomics and Chemometric Tools for the Characterization and Discrimination of Irradiated Camembert Cheese Analyzed by UHPLC-Q-Orbitrap-MS. Foods 2023, 12, 2198. https://doi.org/10.3390/foods12112198
Tomaiuolo M, Nardelli V, Mentana A, Campaniello M, Zianni R, Iammarino M. Untargeted Lipidomics and Chemometric Tools for the Characterization and Discrimination of Irradiated Camembert Cheese Analyzed by UHPLC-Q-Orbitrap-MS. Foods. 2023; 12(11):2198. https://doi.org/10.3390/foods12112198
Chicago/Turabian StyleTomaiuolo, Michele, Valeria Nardelli, Annalisa Mentana, Maria Campaniello, Rosalia Zianni, and Marco Iammarino. 2023. "Untargeted Lipidomics and Chemometric Tools for the Characterization and Discrimination of Irradiated Camembert Cheese Analyzed by UHPLC-Q-Orbitrap-MS" Foods 12, no. 11: 2198. https://doi.org/10.3390/foods12112198