
Nutritive Value of 11 Bee Pollen Samples from Major Floral Sources in Taiwan


Abstract
:
1. Introduction
2. Materials and Methods
2.1. Bee Pollen Sample Collection
2.2. Proximate Analysis of Bee Pollen
2.3. Sugar Analysis
2.4. Amino Acid Analysis
2.5. Fatty Acid Analysis
2.6. Statistical Analysis
3. Results and Discussion
3.1. Bee Pollen Samples
3.2. Proximate Analysis of Bee Pollen
3.3. Sugar Analysis of Bee Pollen
3.4. Amino Acid Analysis
3.5. Fatty Acid Analysis
4. Conclusions
Supplementary Materials
Author Contributions
Funding
Institutional Review Board Statement
Informed Consent Statement
Data Availability Statement
Acknowledgments
Conflicts of Interest
References
- Komosinska-Vassev, K.; Olczyk, P.; Kazmierczak, J.; Mencner, L.; Olczyk, K. Bee pollen: Chemical composition and therapeutic application. Evid. Based Complement. Alternat. Med. 2015, 2015, 297425–297431. [Google Scholar] [CrossRef] [Green Version]
- Kurek-Górecka, A.; Górecki, M.; Rzepecka-Stojko, A.; Balwierz, R.; Stojko, J. Bee products in dermatology and skin care. Molecules 2020, 25, 556. [Google Scholar] [CrossRef] [Green Version]
- Thakur, M.; Nanda, V. Composition and functionality of bee pollen: A review. Trends Food Sci. Technol. 2020, 98, 82–106. [Google Scholar] [CrossRef]
- Abdelnour, S.A.; Abd El-Hack, M.E.; Alagawany, M.; Farag, M.R.; Elnesr, S.S. Beneficial impacts of bee pollen in animal production, reproduction and health. J. Anim. Physiol. Anim. Nutr. 2019, 103, 477–484. [Google Scholar] [CrossRef] [PubMed]
- Al-Kahtani, S.N.; Taha, E.-K.; Khan, K.A.; Ansari, M.J.; Farag, S.A.; Shawer, D.M.B.; Elnabawy, E.-S.M. Effect of harvest season on the nutritional value of bee pollen protein. PLoS ONE 2021, 15, e0241393. [Google Scholar] [CrossRef]
- Serra Bonvehí, J.; Escolà Jordà, R. Nutrient composition and microbiological quality of honeybee-collected pollen in Spain. J. Agric. Food Chem. 1997, 45, 725–732. [Google Scholar] [CrossRef]
- Estevinho, L.M.; Rodrigues, S.; Pereira, A.P.; Feás, X. Portuguese bee pollen: Palynological study, nutritional and microbiological evaluation. Int. J. Food Sci. Technol. 2012, 47, 429–435. [Google Scholar] [CrossRef]
- Human, H.; Nicolson, S.W. Nutritional content of fresh, bee-collected and stored pollen of Aloe greatheadii var. davyana (Asphodelaceae). Phytochemistry 2006, 67, 1486–1492. [Google Scholar] [CrossRef] [Green Version]
- Martins, M.C.; Morgano, M.A.; Vicente, E.; Baggio, S.R.; Rodriguez-Amaya, D.B. Physicochemical composition of bee pollen from eleven Brazilian states. J. Apic. Res. 2011, 55, 107–116. [Google Scholar]
- Modro, A.F.; Silva, I.C.; Luz, C.F. Analysis of pollen load based on color, physicochemical composition and botanical source. An. Acad. Bras. Cienc. 2009, 81, 281–285. [Google Scholar] [CrossRef] [Green Version]
- Schulte, F.; Lingott, J.; Panne, U.; Kneipp, J. Chemical characterization and classification of pollen. Anal. Chem. 2008, 80, 9551–9556. [Google Scholar] [CrossRef] [PubMed]
- Campos, M.G.R.; Bogdanov, S.; de Almeida-Muradian, L.B.; Szczesna, T.; Mancebo, Y.; Frigerio, C.; Ferreira, F. Pollen composition and standardisation of analytical methods. J. Apic. Res. 2008, 47, 154–161. [Google Scholar] [CrossRef]
- Roulston, T.H.; Cane, J.H. Pollen nutritional content and digestibility for animals. Plant. Syst. Evol. 2000, 222, 187–209. [Google Scholar] [CrossRef]
- Somerville, D.C. Nutritional Value of Bee Collected Pollens; NSW Agriculture: Goulburn, Australia, 2001. [Google Scholar]
- Liolios, V.; Tananaki, C.; Dimou, M.; Kanelis, D.; Goras, G.; Karazafiris, E.; Thrasyvoulou, A. Ranking pollen from bee plants according to their protein contribution to honey bees. J. Apic. Res. 2016, 54, 582–592. [Google Scholar] [CrossRef]
- Yang, K.; Wu, D.; Ye, X.; Liu, D.; Chen, J.; Sun, P. Characterization of chemical composition of bee pollen in China. J. Agric. Food Chem. 2013, 61, 708–718. [Google Scholar] [CrossRef] [PubMed]
- Aylanc, V.; Tomás, A.; Russo-Almeida, P.; Falcão, S.I.; Vilas-Boas, M. Assessment of bioactive compounds under simulated gastrointestinal digestion of bee pollen and bee bread: Bioaccessibility and antioxidant activity. Antioxidants 2021, 10, 651. [Google Scholar] [CrossRef]
- Di Pasquale, G.; Salignon, M.; Le Conte, Y.; Belzunces, L.P.; Decourtye, A.; Kretzschmar, A.; Suchail, S.; Brunet, J.L.; Alaux, C. Influence of pollen nutrition on honey bee health: Do pollen quality and diversity matter? PLoS ONE 2013, 8, e72016. [Google Scholar] [CrossRef] [Green Version]
- Margaoan, R.; Strant, M.; Varadi, A.; Topal, E.; Yucel, B.; Cornea-Cipcigan, M.; Campos, M.G.; Vodnar, D.C. Bee collected pollen and bee bread: Bioactive constituents and health benefits. Antioxidants 2019, 8, 568. [Google Scholar] [CrossRef] [Green Version]
- Taha, E.-K.A.; Al-Kahtani, S.; Taha, R. Protein content and amino acids composition of bee-pollens from major floral sources in Al-Ahsa, eastern Saudi Arabia. Saudi J. Biol. Sci. 2019, 26, 232–237. [Google Scholar] [CrossRef]
- Somerville, D.C.; Nicol, H.I. Crude protein and amino acid composition of honey bee-collected pollen pellets from south-east Australia and a note on laboratory disparity. Aust. J. Exp. Agric. 2006, 46, 141–150. [Google Scholar] [CrossRef]
- Nicolson, S.; Human, H. Chemical composition of the low quality pollen of sunflower (Helianthus annuus, Asteraceae). Apidologie 2012, 44, 144–152. [Google Scholar] [CrossRef] [Green Version]
- Hendriksma, H.P.; Pachow, C.D.; Nieh, J.C. Effects of essential amino acid supplementation to promote honey bee gland and muscle development in cages and colonies. J. Insect Physiol. 2019, 117, 103906. [Google Scholar] [CrossRef] [PubMed] [Green Version]
- De Groot, A.P. Protein and amino acid requirements of the honeybee (Apis mellifica L.). Physiologia Comparata et Oecologia 1953, 3, 197–285. [Google Scholar] [CrossRef]
- FAO/WHO/UNU. Protein and Amino Acid Requirements in Human Nutrition: Report of an FAO/WHO/UNU Expert Consultation; WHO Technical Report Series. No. 935; World Health Organization: Geneva, Switzerland, 2007. [Google Scholar]
- Manning, R. Fatty acids in pollen: A review of their importance for honey bees. Bee World 2001, 82, 60–75. [Google Scholar] [CrossRef]
- Manning, R. Fatty Acid Composition of Pollen and the Effect of Two Dominant Fatty Acids (Linoleic and Oleic) in Pollen and Flour Diets on Longevity and Nutritional Composition of Honey Bees (Apis mellifera). Ph.D. Thesis, Murdoch University, Perth, Australia, 2006. [Google Scholar]
- Arien, Y.; Dag, A.; Zarchin, S.; Masci, T.; Shafir, S. Omega-3 deficiency impairs honey bee learning. Proc. Natl. Acad. Sci. USA 2015, 112, 15761–15766. [Google Scholar] [CrossRef] [Green Version]
- Arien, Y.; Dag, A.; Shafir, S. Omega-6:3 ratio more than absolute lipid level in diet affects associative learning in honey bees. Front. Psychol. 2018, 9, 1001–1008. [Google Scholar] [CrossRef] [PubMed] [Green Version]
- Arien, Y.; Dag, A.; Yona, S.; Tietel, Z.; Lapidot Cohen, T.; Shafir, S. Effect of diet lipids and omega-6:3 ratio on honey bee brood development, adult survival and body composition. J. Insect Physiol. 2020, 124, 104074. [Google Scholar] [CrossRef]
- Ma, L.; Wang, Y.; Hang, X.; Wang, H.; Yang, W.; Xu, B. Nutritional effect of alpha-linolenic acid on honey bee colony development (Apis Mellifera L.). J. Apic. Res. 2015, 59, 63–72. [Google Scholar] [CrossRef] [Green Version]
- Lipiński, Z. Honey Bee Nutrition and Feeding; Zbigniew Lipiński: Olsztyn, Poland, 2019. [Google Scholar]
- An, J.K.; Ho, K.K.; Chen, Y.W. Apiculture; National Institute for Compilation and Translation: Taipei, Taiwan, 2004. [Google Scholar]
- Lu, M.-C. Beekeeping on Taiwan island. In Asian Beekeeping in the 21st Century; Chantawannakul, P., Williams, G., Neumann, P., Eds.; Springer: Singapore, 2018. [Google Scholar]
- Huang, T.C. Pollen Flora of Taiwan; National Taiwan Univ: Taipei, Taiwan, 1972. [Google Scholar]
- Kress, W.J.; Erickson, D.L. A two-locus global DNA barcode for land plants: The coding rbcL gene complements the non-coding trnH-psbA spacer region. PLoS ONE 2007, 2, e508. [Google Scholar] [CrossRef] [Green Version]
- de Vere, N.; Rich, T.C.G.; Ford, C.R.; Trinder, S.A.; Long, C.; Moore, C.W.; Satterthwaite, D.; Davies, H.; Allainguillaume, J.; Ronca, S.; et al. DNA barcoding the native flowering plants and conifers of Wales. PLoS ONE 2012, 7, e37945. [Google Scholar] [CrossRef] [Green Version]
- Sang, T.; Crawford, D.J.; Stuessy, T.F. Chloroplast DNA phylogeny, reticulate evolution, and biogeography of Paeonia (Paeoniaceae). Am. J. Bot. 1997, 84, 1120–1136. [Google Scholar] [CrossRef] [PubMed] [Green Version]
- Ford, C.S.; Ayres, K.L.; Toomey, N.; Haider, N.; van Alpen Stahl, J.; Kelly, L.J.; Wikströmn, N.; Hollingsworth, P.M.; Duff, R.J.; Hoot, S.B.; et al. Selection of candidate DNA barcoding regions for use on land plants. Bot. J. Linn. Soc. 2009, 159, 1–11. [Google Scholar] [CrossRef] [Green Version]
- Bureau of Standards, M.a.I. Method of Test for Moisture in Food, CNS 5033 N6114; Bureau of Standards, Metrology and Inspection, Ministry of Economic Affairs, R.O.C.: Taipei, Taiwan, 1984. [Google Scholar]
- Bureau of Standards, M.a.I. Method of Test for Crude Protein in Food, CNS 5035 N6116; Bureau of Standards, Metrology and Inspection, Ministry of Economic Affairs, R.O.C.: Taipei, Taiwan, 1986. [Google Scholar]
- Bureau of Standards, M.a.I. Method of Test for Crude Fat in Food, CNS 5036 N6117; Bureau of Standards, Metrology and Inspection, Ministry of Economic Affairs, R.O.C.: Taipei, Taiwan, 1984. [Google Scholar]
- Bureau of Standards, M.a.I. Method of Test for Ash in Food, CNS 5034 N6115; Bureau of Standards, Metrology and Inspection, Ministry of Economic Affairs, R.O.C.: Taipei, Taiwan, 1984. [Google Scholar]
- Sánchez-Peña, M.J.; Márquez-Sandoval, F.; Ramírez-Anguiano, A.C.; Velasco-Ramírez, S.F.; Macedo-Ojeda, G.; González-Ortiz, L.J. Calculating the metabolizable energy of macronutrients: A critical review of Atwater’s results. Nutr. Rev. 2017, 75, 37–48. [Google Scholar] [CrossRef] [PubMed]
- Yang, J.; Liu, J.S.; Cai, J.B.; Zhu, X.L.; Gao, Y.; Su, Q.D. Analysis of carbohydrates in tobacco extract by high performance liquid chromatography with evaporative light scattering detector. Chin. J. Anal. Chem. 2005, 33, 1596–1598. [Google Scholar]
- Taiwan Food and Drug Administration; Ministry of Health and Welfare. Method of Test for Sugars in Foods, TFDAO0022.01. 2015. Available online: https://www.fda.gov.tw/tc/includes/GetFile.ashx?id=f636694191568598678 (accessed on 19 September 2021).
- Simpson, R.J.; Neuberger, M.R.; Liu, T.Y. Complete amino acid analysis of proteins from a single hydrolysate. J. Biol. Chem. 1976, 251, 1936–1940. [Google Scholar] [CrossRef]
- Mitchell, H.H.; Block, R.J. Some relationships between the amino acid contents of proteins and their nutritive values for the rat. J. Biol. Chem. 1946, 163, 599–620. [Google Scholar] [CrossRef]
- Bell, S.J.; Bistrian, B.R.; Ainsley, B.M.; Manji, N.; Lewis, E.J.; Joyce, C.; Blackburn, G.L. A chemical score to evaluate the protein quality of commercial parenteral and enteral formulas: Emphasis on formulas for patients with liver failure. J. Am. Diet. Assoc. 1991, 91, 586–599. [Google Scholar] [CrossRef]
- Lepage, G.; Roy, C.C. Direct transesterification of all classes of lipids in a one-step reaction. J. Lipid Res. 1986, 27, 114–120. [Google Scholar] [CrossRef]
- World Health Organization. Global Protocol for Measuring Fatty Acid Profiles of Foods, with Emphasis on Monitoring Trans-Fatty Acids Originating from Partially Hydrogenated Oils. 2020. Available online: https://apps.who.int/iris/handle/10665/338049 (accessed on 19 September 2021).
- Taiwan Food and Drug Administration; Ministry of Health and Welfare. Method of Test for Fatty Acids in Food, MOHWO0014.00. 2013. Available online: https://www.fda.gov.tw/tc/includes/GetFile.ashx?id=f636694178068470422 (accessed on 19 September 2021).
- Szczęsna, T. Protein content and amino acids compositon of bee-collected pollen originating from Poland, South Korea and China. J. Apic. Sci. 2006, 50, 91–99. [Google Scholar]
- Ghosh, S.; Jung, C. Nutritional value of bee-collected pollens of hardy kiwi, Actinidia arguta (Actinidiaceae) and oak, Quercus sp. (Fagaceae). J. Asia Pac. Entomol. 2017, 20, 245–251. [Google Scholar] [CrossRef]
- Thakur, M.; Nanda, V. Assessment of physico-chemical properties, fatty acid, amino acid and mineral profile of bee pollen from India with a multivariate perspective. J. Food Nutr. Res. 2018, 57, 328–340. [Google Scholar]
- De-Melo, A.A.M.; Estevinho, L.M.; Moreira, M.M.; Delerue-Matos, C.; Freitas, A.d.S.d.; Barth, O.M.; Almeida-Muradian, L.B.d. A multivariate approach based on physicochemical parameters and biological potential for the botanical and geographical discrimination of Brazilian bee pollen. Food Biosci. 2018, 25, 91–110. [Google Scholar] [CrossRef] [Green Version]
- Höcherl, N.; Siede, R.; Illies, I.; Gätschenberger, H.; Tautz, J. Evaluation of the nutritive value of maize for honey bees. J. Insect Physiol. 2012, 58, 278–285. [Google Scholar] [CrossRef] [PubMed]
- Khider, M.; Elbanna, K.; Mahmoud, A.; Owayss, A.A. Egyptian honeybee pollen as antimicrobial, antioxidant agents, and dietary food supplements. Food Sci. Biotechnol. 2013, 22, 1–9. [Google Scholar] [CrossRef]
- Nogueira, C.; Iglesias, A.; Feás, X.; Estevinho, L.M. Commercial bee pollen with different geographical origins: A comprehensive approach. Int. J. Mol. Sci. 2012, 13, 11173–11187. [Google Scholar] [CrossRef]
- Liolios, V.; Tananaki, C.; Papaioannou, A.; Kanelis, D.; Rodopoulou, M.-A.; Argena, N. Mineral content in monofloral bee pollen: Investigation of the effect of the botanical and geographical origin. J. Food Meas. Charact. 2019, 13, 1674–1682. [Google Scholar] [CrossRef]
- Kang, J.X.; Liu, A. The role of the tissue omega-6/omega-3 fatty acid ratio in regulating tumor angiogenesis. Cancer Metastasis Rev. 2013, 32, 201–210. [Google Scholar] [CrossRef]
- Saini, R.K.; Keum, Y.-S. Omega-3 and omega-6 polyunsaturated fatty acids: Dietary sources, metabolism, and significance—A review. Life Sci. 2018, 203, 255–267. [Google Scholar] [CrossRef]
- Glick, N.R.; Fischer, M.H. The role of essential fatty acids in human health. Evid.-Based Complement. Altern. Med. 2013, 18, 268–289. [Google Scholar] [CrossRef]
- Plettner, E.; Slessor, K.N.; Winston, M.L.; Oliver, J.E. Caste-selective pheromone biosynthesis in honeybees. Science 1996, 271, 1851–1853. [Google Scholar] [CrossRef]
- Wu, Y.; Zheng, H.; Corona, M.; Pirk, C.; Meng, F.; Zheng, Y.; Hu, F. Comparative transcriptome analysis on the synthesis pathway of honey bee (Apis mellifera) mandibular gland secretions. Sci. Rep. 2017, 7, 4530–4540. [Google Scholar] [CrossRef] [PubMed]
- Sales-Campos, H.; Souza, P.R.; Peghini, B.C.; da Silva, J.S.; Cardoso, C.R. An overview of the modulatory effects of oleic acid in health and disease. Mini Rev. Med. Chem. 2013, 13, 201–210. [Google Scholar] [CrossRef] [PubMed]
- Carta, G.; Murru, E.; Banni, S.; Manca, C. Palmitic Acid: Physiological Role, Metabolism and Nutritional Implications. Front. Physiol. 2017, 8, 902. [Google Scholar] [CrossRef] [Green Version]
- Senyilmaz-Tiebe, D.; Pfaff, D.H.; Virtue, S.; Schwarz, K.V.; Fleming, T.; Altamura, S.; Muckenthaler, M.U.; Okun, J.G.; Vidal-Puig, A.; Nawroth, P.; et al. Dietary stearic acid regulates mitochondria in vivo in humans. Nat. Commun. 2018, 9, 3129. [Google Scholar] [CrossRef] [PubMed]


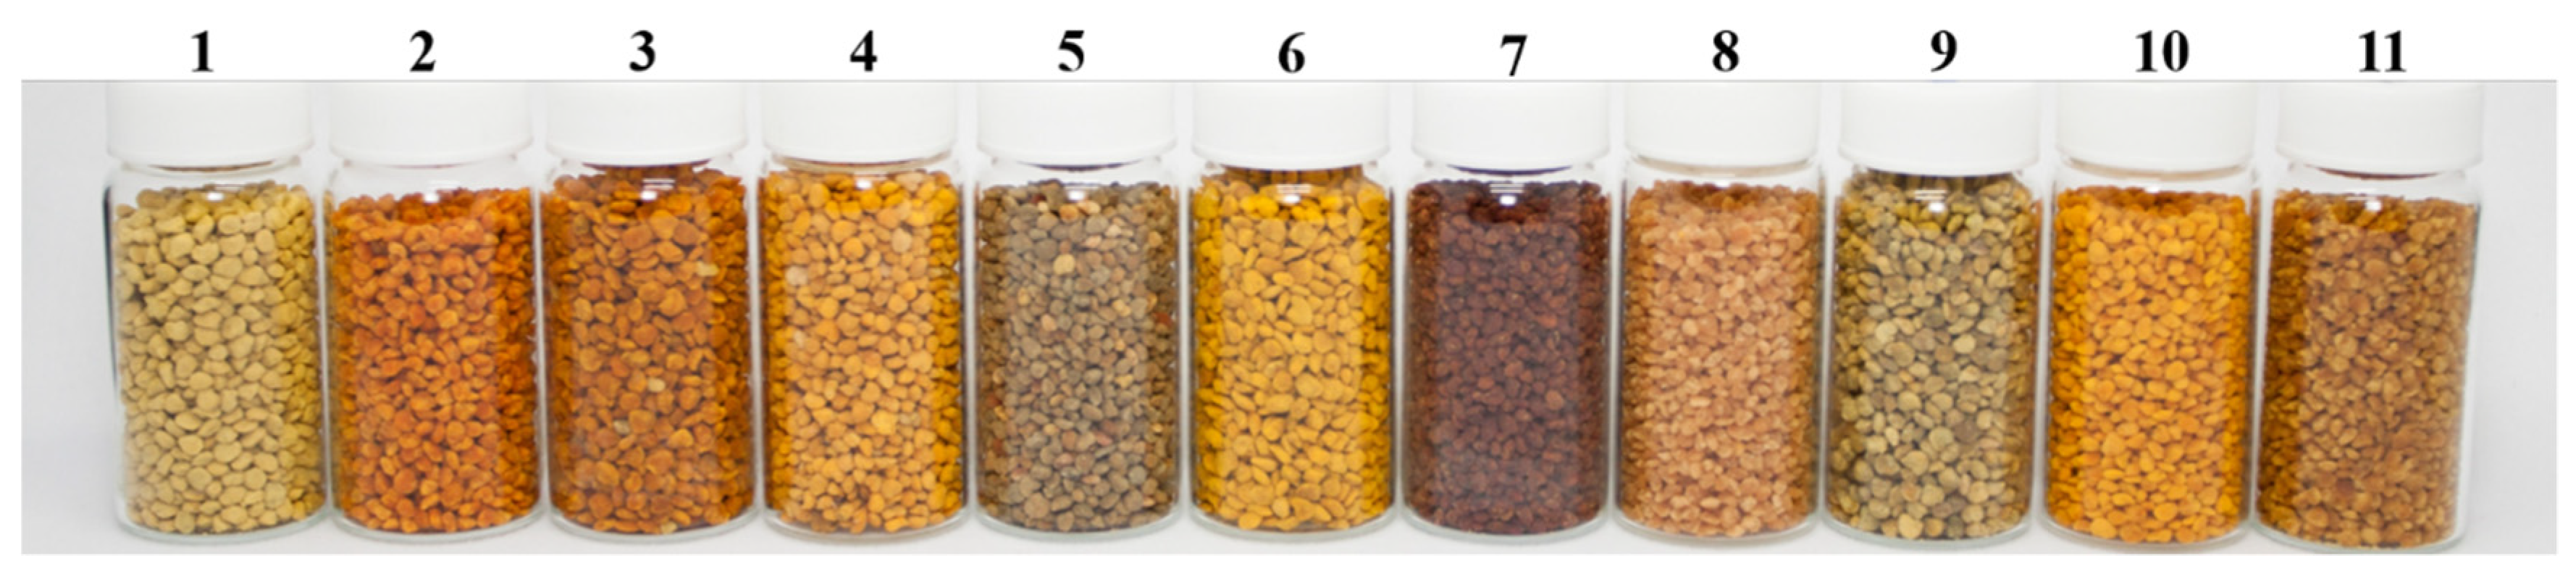
| Item | Species | Common Name | Foodstuff | Cultivation | Characteristic | Bloom Time |
|---|---|---|---|---|---|---|
| 1 | Brassica napus | Rape | Non-crop | Cultivate | Herbaceous | Dec.–Jan. † |
| 2 | Bidens pilosa var. radiata | Beggartick | Non-crop | Wild | Herbaceous | Jan.–Dec. |
| 3 | Camellia sinensis | Tea tree | Crop | Cultivate | Woody | Oct.–May |
| 4 | Fraxinus griffithii | Evergreen ash | Non-crop | Wild | Woody | May–Jun. |
| 5 | Prunus mume | Japanese apricot | Crop | Cultivate | Woody | Jan. |
| 6 | Rhus chinensis var. roxburghii | Nutgall tree | Non-crop | Wild | Woody | Sep.–Oct. |
| 7 | Bombax ceiba | Red cotton tree | Non-crop | Cultivate | Woody | Mar.–Apr. |
| 8 | Hylocereus costaricensis | Pitaya | Crop | Cultivate | Herbaceous | Apr.–Oct. |
| 9 | Liquidambar formosana | Formosan gum | Non-crop | Cultivate/wild | Woody | Mar.–Apr. |
| 10 | Nelumbo nucifera | Lotus | Crop | Cultivate | Herbaceous | May–Jun. |
| 11 | Zea mays | Corn | Crop | Cultivate | Herbaceous | Dec.–Jan. † |
| Component | Each Pollen Sample from Three Places | Each Pollen Sample from Single Place | Average | |||||||||
|---|---|---|---|---|---|---|---|---|---|---|---|---|
| Bn | Bp | Cs | Fg | Pm | Rc | Bc | Hc | Lf | Nn | Zm | ||
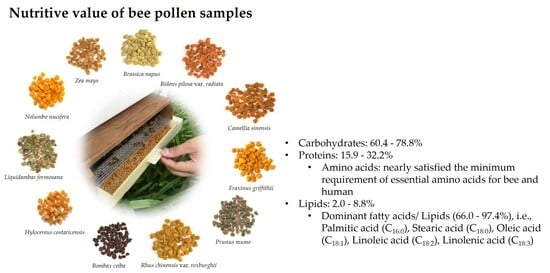
| Carbohydrate | 62.6 ± 2.3 b | 78.8 ± 1.0 a | 63.7 ± 3.8 ab | 73.0 ± 1.2 ab | 64.9 ± 3.0 ab | 67.4 ± 0.9 ab | 60.4 | 60.9 | 74.8 | 71.8 | 78.1 | 68.6 |
| Protein | 27.2 ±1.3 ns | 16.4 ± 0.5 ns | 29.9 ± 3.4 ns | 20.8 ± 0.9 ns | 28.3 ± 2.8 ns | 27.0 ± 0.7 ns | 32.2 | 27.8 | 15.9 | 18.4 | 17.2 | 24.4 |
| Lipid | 7.1 ± 1.1 a | 3.2 ± 0.6 ab | 3.1 ± 0.3 ab | 4.1 ± 0.5 ab | 3.6 ± 0.2 ab | 2.0 ± 0.1 b | 4.2 | 8.8 | 7.0 | 5.3 | 2.8 | 4.2 |
| Ash | 3.1 ± 0.2 ab | 1.7 ± 0.1 b | 3.2 ± 0.2 ab | 2.0 ± 0.1 ab | 3.2 ± 0.2 ab | 3.5 ± 0.1 a | 3.2 | 2.5 | 2.3 | 4.5 | 2.0 | 2.8 |
| Energy ‡ | 476.1 | 445.1 | 459.3 | 455.1 | 459.8 | 448.4 | 468.6 | 488.6 | 461.6 | 447.6 | 443.4 | 458.3 |
| Water content £ | 20.7 ± 1.2 | 19.2 ± 2.0 | 22.2 ± 0.7 | 12.8 ¤ | 20.4 ¤ | 19.4 ¤ | 18.2 | 19.5 | 18.3 | 5.3 | 21.9 | 19.0 |
| Sugar | Each Pollen Sample from Three Places | Each Pollen Sample from Single Place | Average | |||||||||
|---|---|---|---|---|---|---|---|---|---|---|---|---|
| Bn | Bp | Cs | Fg | Pm | Rc | Bc | Hc | Lf | Nn | Zm | ||
| Total sugar ‡ | 33.1 ± 4.1 ns | 43.6 ± 2.5 ns | 32.1 ± 6.2 ns | 43.6 ± 5.5 ns | 33.9 ± 3.0 ns | 32.6 ± 0.8 ns | 39.3 | 25.2 | 44.8 | 44.7 | 34.0 | 36.7 |
| Sucrose | 1.2 ± 0.8 ns | 2.0 ± 0.5 ns | 0.7 ± 0.4 ns | 5.5 ± 0.9 ns | 1.0 ± 0.7 ns | 2.8 ± 3.3 ¤ | 5.2 | ND ¥ | 6.2 | 5.5 | ND | 2.5 |
| Glucose | 11.9 ± 3.0 ab | 18.6 ± 1.5 a | 10.3 ± 2.7 ab | 16.8 ± 1.5 ab | 12.6 ± 1.8 ab | 10.2 ± 0.6 b | 14.7 | 8.7 | 16.3 | 17.3 | 13.9 | 13.6 |
| Fructose | 18.8 ± 1.4 ns | 17.8 ± 0.8 ns | 18.9 ± 1.9 ns | 20.3 ± 3.0 ns | 18.2 ± 1.6 ns | 18.4 ± 2.3 ns | 18.8 | 15.7 | 20.5 | 20.7 | 18.3 | 18.8 |
| S+G+F | 31.9 | 38.4 | 29.9 | 42.5 | 31.8 | 31.5 | 38.7 | 24.4 | 43.0 | 43.5 | 32.2 | 34.8 |
| (S+G+F)/T £ (%) | 96.6 | 88.0 | 93.0 | 97.6 | 94.0 | 96.7 | 98.6 | 97.1 | 95.9 | 97.3 | 94.8 | 94.9 |
| Amino Acid | Each Pollen Sample from Three Places | Each Pollen Sample from Single Place | Average | |||||||||
|---|---|---|---|---|---|---|---|---|---|---|---|---|
| Bn | Bp | Cs | Fg | Pm | Rc | Bc | Hc | Lf | Nn | Zm | ||
| EAA ‡ | ||||||||||||
| Arginine | 1.30 ± 0.12 ab | 0.57 ± 0.05 b | 1.36 ± 0.13 a | 0.91 ± 0.03 ab | 1.23 ± 0.14 ab | 1.05 ± 0.06 ab | 1.45 | 1.40 | 1.02 | 0.94 | 0.74 | 1.08 |
| Histidine | 0.46 ± 0.14 ns | 0.73 ± 0.07 ns | 0.74 ± 0.17 ns | 0.67 ± 0.24 ns | 0.58 ± 0.13 ns | 0.54 ± 0.06 ns | 0.80 | 0.61 | 0.16 | 0.50 | 0.30 | 0.59 |
| Isoleucine | 1.21 ± 0.11 ab | 0.69 ± 0.06 b | 1.36 ± 0.24 a | 0.95 ± 0.04 ab | 1.15 ± 0.20 ab | 1.12 ± 0.04 ab | 1.50 | 1.50 | 0.69 | 0.96 | 0.67 | 1.08 |
| Leucine | 1.82 ± 0.15 ab | 1.06 ± 0.08 b | 2.07 ± 0.28 a | 1.42 ± 0.06 ab | 1.77 ± 0.30 ab | 1.69 ± 0.06 ab | 2.05 | 2.12 | 1.24 | 1.34 | 1.03 | 1.62 |
| Lysine | 1.91 ± 0.25 a | 1.00 ± 0.10 b | 1.76 ± 0.18 ab | 1.21 ± 0.11 ab | 1.61 ± 0.32 ab | 1.66 ± 0.13 ab | 1.81 | 2.05 | 1.25 | 1.28 | 1.00 | 1.51 |
| Methionine | 0.35 ± 0.05 ns | 0.21 ± 0.14 ns | 0.40 ± 0.06 ns | 0.29 ± 0.22 ns | 0.28 ± 0.12 ns | 0.35 ± 0.16 ns | 0.48 | 0.46 | 0.26 | 0.28 | 0.12 | 0.32 |
| Phenylalanine | 1.11 ± 0.17 ns | 0.80 ± 0.12 ns | 1.32 ± 0.24 ns | 0.89 ± 0.05 ns | 1.14 ± 0.25 ns | 1.13 ± 0.09 ns | 1.29 | 1.38 | 0.58 | 0.79 | 0.58 | 1.03 |
| Threonine | 1.06 ± 0.08 ns | 0.57 ± 0.06 ns | 1.07 ± 0.12 ns | 0.76 ± 0.07 ns | 0.99 ± 0.16 ns | 0.96 ± 0.06 ns | 1.19 | 1.12 | 0.51 | 0.73 | 0.63 | 0.89 |
| Tryptophan | 0.28 ± 0.04 ns | 0.18 ± 0.07 ns | 0.30 ± 0.01 ns | 0.13 ± 0.07 ns | 0.22 ± 0.05 ns | 0.51 ± 0.39 ns | 0.20 | 0.35 | 0.09 | 0.14 | 0.10 | 0.25 |
| Valine | 1.31 ± 0.04 ab | 0.84 ± 0.08 b | 1.56 ± 0.15 a | 1.10 ± 0.04 ab | 1.44 ± 0.18 ab | 1.34 ± 0.08 ab | 1.79 | 1.85 | 0.29 | 1.08 | 0.99 | 1.25 |
| Total EAA | 10.81 ± 0.61 | 6.66 ± 0.61 | 11.96 ± 1.41 | 8.33 ± 0.65 | 10.40 ± 1.79 | 10.35 ± 0.88 | 12.58 | 12.84 | 6.09 | 8.04 | 6.17 | 9.62 |
| NEAA £ | ||||||||||||
| Alanine | 1.42 ± 0.09 ab | 0.88 ± 0.07 b | 1.60 ± 0.20 a | 1.11 ± 0.04 ab | 1.45 ± 0.21 ab | 1.30 ± 0.08 ab | 1.56 | 1.73 | 0.66 | 1.00 | 0.99 | 1.27 |
| Aspartic acid | 2.56 ± 0.22 ab | 1.45 ± 0.10 b | 2.70 ± 0.30 ab | 2.64 ± 0.12 ab | 3.14 ± 0.50 a | 2.43 ± 0.24 ab | 3.24 | 3.19 | 1.68 | 2.31 | 1.57 | 2.47 |
| Cystine | 0.37 ± 0.04 a | 0.69 ± 0.87 ¥ | 0.24 ± 0.11 ab | 0.12 ± 0.04 b | 0.26 ± 0.27 ¥ | 0.18 ± 0.03 ab | 0.14 | 0.29 | 0.21 | 0.03 | 0.15 | 0.28 |
| Glutamic acid | 2.64 ± 0.16 ab | 1.46 ± 0.15 b | 3.04 ± 0.35 a | 2.08 ± 0.09 ab | 2.88 ± 0.43 ab | 2.74 ± 0.18 ab | 3.33 | 3.48 | 1.73 | 2.16 | 1.64 | 2.47 |
| Glycine | 1.21 ± 0.09 ab | 0.73 ± 0.05 b | 1.31 ± 0.16 a | 0.95 ± 0.06 ab | 1.19 ± 0.14 ab | 1.14 ± 0.07 ab | 1.42 | 1.31 | 0.58 | 0.82 | 0.78 | 1.06 |
| Proline | 1.24 ± 0.12 ab | 0.63 ± 0.10 b | 2.31 ± 0.76 ab | 1.09 ± 0.18 ab | 2.47 ± 0.29 ab | 3.35 ± 0.86 a | 1.73 | 0.98 | 0.75 | 0.55 | 1.99 | 1.70 |
| Serine | 1.10 ± 0.05 ab | 0.63 ± 0.11 b | 1.22 ± 0.12 a | 0.88 ± 0.07 ab | 1.03 ± 0.22 ab | 1.02 ± 0.10 ab | 1.19 | 1.07 | 0.58 | 0.80 | 0.70 | 0.96 |
| Tyrosine | 0.57 ± 0.07 ns | 0.35 ± 0.04 ns | 0.65 ± 0.05 ns | 0.51 ± 0.12 ns | 0.64 ± 0.12 ns | 0.64 ± 0.14 ns | 0.73 | 0.65 | 0.18 | 0.56 | 0.37 | 0.55 |
| Total NEAA | 11.10 ± 0.57 | 6.81 ± 0.49 | 13.07 ± 1.74 | 9.37 ± 0.46 | 13.05 ± 1.6 | 12.80 ± 0.37 | 13.34 | 12.70 | 6.36 | 8.24 | 8.20 | 10.76 |
| TAA ¤ | 21.91 ± 1.17 | 13.47 ± 0.37 | 25.02 ± 3.11 | 17.71 ± 1.11 | 23.46 ± 3.39 | 23.15 ± 1.21 | 25.91 | 25.54 | 12.45 | 16.27 | 14.37 | 20.38 |
| TEAA/TAA (%) | 49.34 ± 0.20 | 49.39 ± 3.88 | 47.80 ± 0.99 | 47.04 ± 0.74 | 44.24 ± 1.16 | 44.66 ± 1.57 | 48.53 | 50.27 | 48.90 | 49.39 | 42.96 | 47.28 |
| Fatty Acid | Each Pollen Sample from Three Places | Each Pollen Sample from Single Place | Average | |||||||||
|---|---|---|---|---|---|---|---|---|---|---|---|---|
| Bn | Bp | Cs | Fg | Pm | Rc | Bc | Hc | Lf | Nn | Zm | ||
| DFA ‡ | ||||||||||||
| Palmitic acid; C16:0 | 19.42 ± 2.54 ab | 18.34 ± 0.93 ab | 25.45 ± 2.36 a | 10.06 ± 4.33 b | 14.02 ± 1.99 ab | 15.64 ± 2.50 ab | 14.56 | 25.74 | 23.40 | 56.00 | 38.44 | 20.30 |
| Stearic acid; C18:0 | 5.70 ± 0.67 ab | 10.25 ± 1.26 a | 3.65 ± 0.23 ab | 9.54 ± 6.50 ab | 1.84 ± 0.30 b | 2.79 ± 0.52 ab | 1.83 | 1.88 | 2.35 | 3.00 | 1.30 | 4.85 |
| Oleic acid; C18:1 | 10.55 ± 1.25 ab | 6.30 ± 2.52 b | 13.17 ± 3.51 ab | 47.50 ± 11.18 a | 11.68 ± 0.69 ab | 25.63 ± 4.23 ab | 19.19 | 4.26 | 26.62 | 17.00 | 7.95 | 18.24 |
| Linoleic acid; C18:2 | 5.15 ± 0.3 b | 12.24 ± 0.23 ab | 6.01 ± 0.31 ab | 8.50 ± 8.99 ¤ | 34.61 ± 1.62 a | 12.08 ± 2.16 ab | 31.00 | 14.10 | 37.20 | 9.00 | 8.58 | 14.59 |
| Linolenic acid; C18:3 | 38.43 ± 3.36 a | 18.84 ± 3.22 ab | 29.68 ± 6.20 ab | 5.55 ± 2.16 b | 21.64 ± 1.72 ab | 22.30 ± 5.48 ab | 16.50 | 45.60 | 7.90 | 10.00 | 33.21 | 22.72 |
| Total DFA | 79.25 ± 4.97 | 65.96 ± 1.44 | 77.96 ± 3.11 | 81.14 ± 11.88 | 83.79 ± 4.24 | 78.43 ± 5.43 | 83.10 | 91.58 | 97.44 | 95.00 | 89.48 | 80.70 |
| NDFA £ | ||||||||||||
| Caproic acid; C6:0 | 0.37 ± 0.07 ab | 7.27 ± 0.36 a | ND ¥ | ND | 0.14 ± 0.12 ab | 0.07 ± 0.06 b | ND | ND | ND | ND | 0.17 | 1.03 |
| Myristic acid; C14:0 | 6.45 ± 0.90 a | 2.37 ± 0.18 ab | 0.78 ± 0.14 ab | 1.19 ± 0.94 ab | 0.39 ± 0.29 b | 0.63 ± 0.18 ab | 0.41 | 0.97 | 0.14 | 1.00 | 0.20 | 1.66 |
| Pentadecanoic acid; C15:0 | 0.10 ± 0.02 ns | 0.21 ± 0.02 ns | ND | ND | 5.15 ± 4.47 ns | 0.09 ± 0.08 ns | ND | ND | 0.03 | ND | 0.07 | 0.73 |
| Arachidic acid; C20:0 | 1.67 ± 1.30 ns | ND | ND | 0.65 ± 0.09 ns | 1.13 ± 0.98 ns | 2.04 ± 1.86 ns | 0.38 | 0.81 | ND | ND | ND | 0.77 |
| Eicosenoic acid; C20:1 | 0.27 ± 0.20 b | 1.63 ± 0.12 ab | 0.97 ± 0.06 ab | 2.72 ± 1.43 a | 0.56 ± 0.24 ab | 0.79 ± 0.34 ab | 1.33 | ND | 0.19 | ND | 0.12 | 0.98 |
| Eicosadienoic acid; C20:2 | 0.20 ± 0.03 b | 12.46 ± 0.65 a | 0.32 ± 0.20 ab | ND | 0.33 ± 0.18 ab | 0.73 ± 0.29 ab | 0.18 | 0.22 | 0.08 | ND | 0.96 | 1.89 |
| Eicosatrienoic acid; C20:3 | 0.31 ± 0.07 ns | ND | ND | ND | 1.79 ± 1.55 ns | ND | 0.34 | ND | 0.24 | 1.00 | 0.32 | 0.36 |
| Behenic acid; C22:0 | 0.23 ± 0.16 ns | 0.66 ± 0.58 ns | 5.87 ± 5.20 ns | 0.29 ± 0.03 ns | ND | 0.98 ± 0.92 ns | 0.35 | 1.03 | ND | ND | 0.15 | 1.11 |
| Erucic acid; C22:1 | 0.12 ± 0.03 ns | 0.16 ± 0.15 ns | ND | ND | ND | 0.27 ± 0.15 ns | 2.38 | 0.15 | 0.06 | ND | 0.11 | 0.19 |
| Lignoceric acid; C24:0 | 0.33 ± 0.12 b | 1.01 ± 0.13 ab | 3.64 ± 0.18 a | 0.26 ± 0.12 b | 1.18 ± 0.21 ab | 1.62 ± 0.32 ab | 0.52 | 1.78 | 0.10 | 1.00 | 0.40 | 1.21 |
| Nervonic acid; C24:1 | 0.90 ± 0.21 ab | 0.51 ± 0.03 b | 1.81 ± 0.68 a | ND | ND | ND | 0.46 | ND | 0.20 | ND | 0.07 | 0.45 |
| Total NDFA | 10.94 ± 0.78 | 27.03 ± 1.66 | 18.28 ± 3.17 | 6.68 ± 4.39 | 12.18 ± 4.02 | 7.81 ± 2.68 | 6.35 | 4.96 | 1.04 | 3.00 | 2.57 | 10.38 |
| Total DFA + NDFA | 90.18 ± 5.04 | 92.99 ± 0.25 | 96.25 ± 0.14 | 87.83 ± 7.50 | 95.97 ± 0.81 | 86.25 ± 5.22 | 89.45 | 96.54 | 98.48 | 98.00 | 92.05 | 91.09 |
Publisher’s Note: MDPI stays neutral with regard to jurisdictional claims in published maps and institutional affiliations. |
© 2021 by the authors. Licensee MDPI, Basel, Switzerland. This article is an open access article distributed under the terms and conditions of the Creative Commons Attribution (CC BY) license (https://creativecommons.org/licenses/by/4.0/).
Share and Cite
Hsu, P.-S.; Wu, T.-H.; Huang, M.-Y.; Wang, D.-Y.; Wu, M.-C. Nutritive Value of 11 Bee Pollen Samples from Major Floral Sources in Taiwan. Foods 2021, 10, 2229. https://doi.org/10.3390/foods10092229
Hsu P-S, Wu T-H, Huang M-Y, Wang D-Y, Wu M-C. Nutritive Value of 11 Bee Pollen Samples from Major Floral Sources in Taiwan. Foods. 2021; 10(9):2229. https://doi.org/10.3390/foods10092229
Chicago/Turabian StyleHsu, Pei-Shou, Tzu-Hsien Wu, Meng-Yuan Huang, Dun-Yan Wang, and Ming-Cheng Wu. 2021. "Nutritive Value of 11 Bee Pollen Samples from Major Floral Sources in Taiwan" Foods 10, no. 9: 2229. https://doi.org/10.3390/foods10092229