
Extraction of Phenolic Compounds with Antioxidant Activity from Strawberries: Modelling with Artificial Neural Networks (ANNs)

 , , , and
Abstract
:
1. Introduction
2. Materials and Methods
2.1. Sample Preparation and Extraction Methodology
2.2. Chemical Analyses
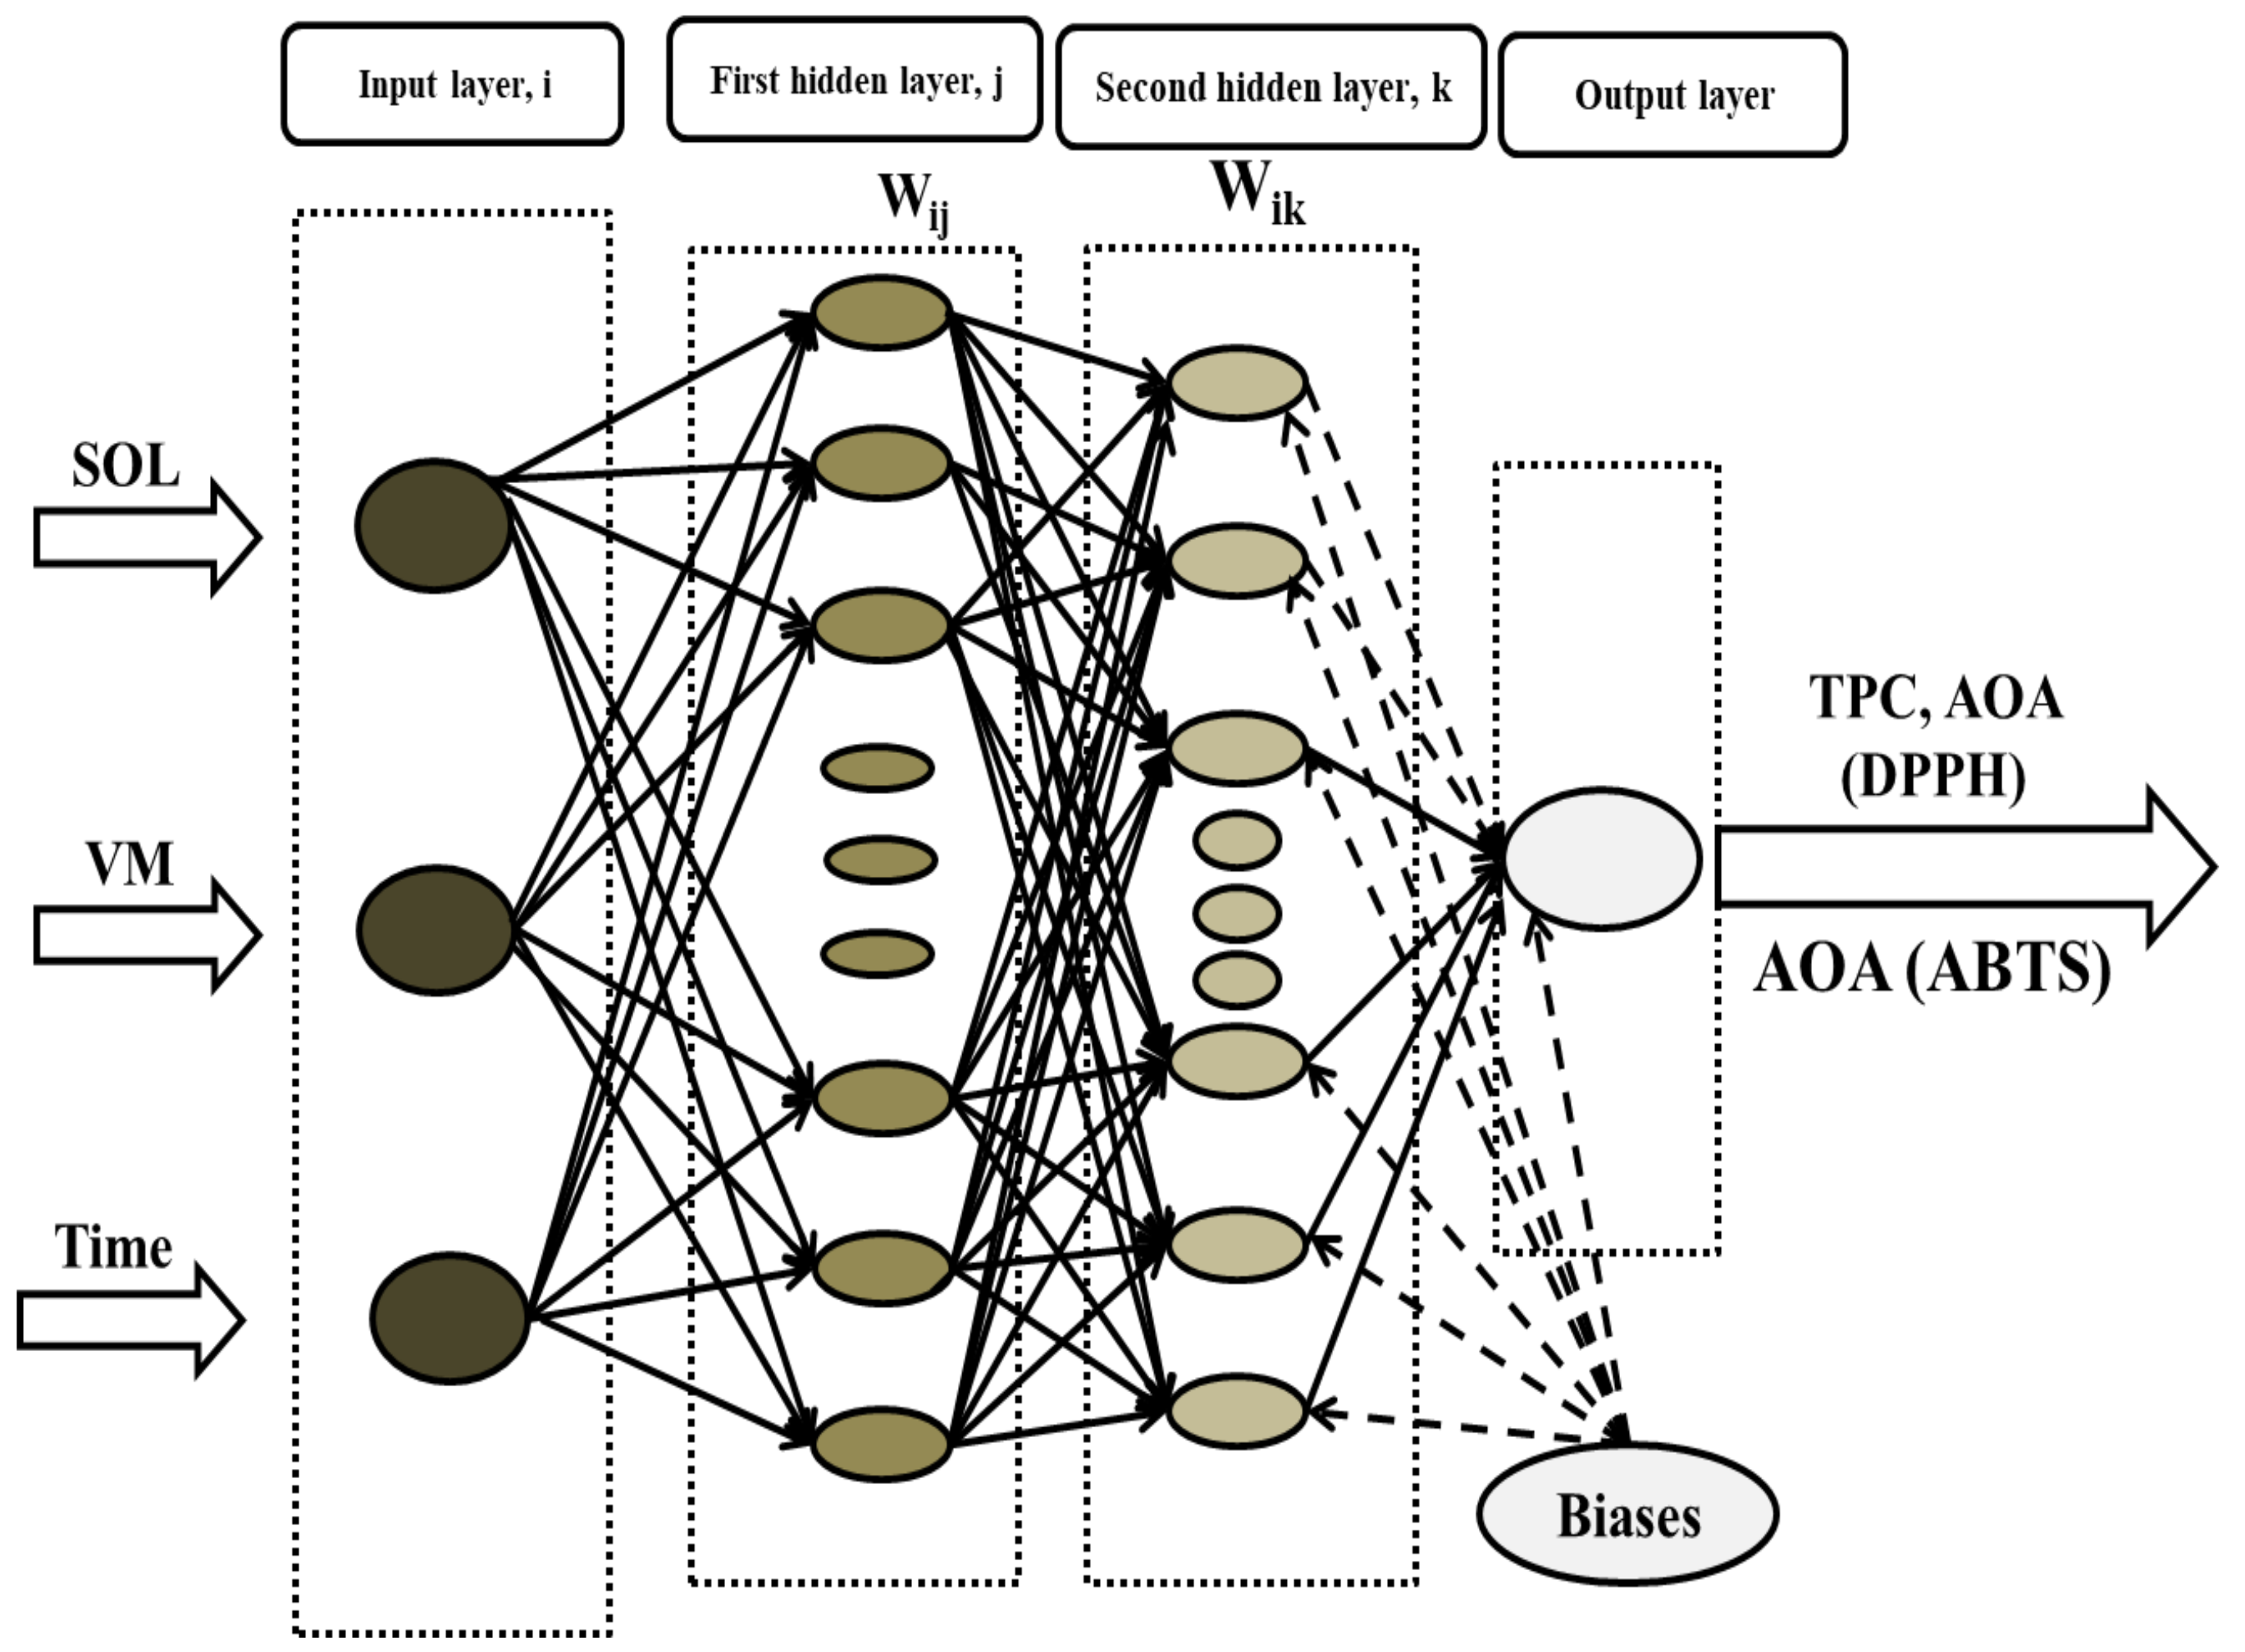
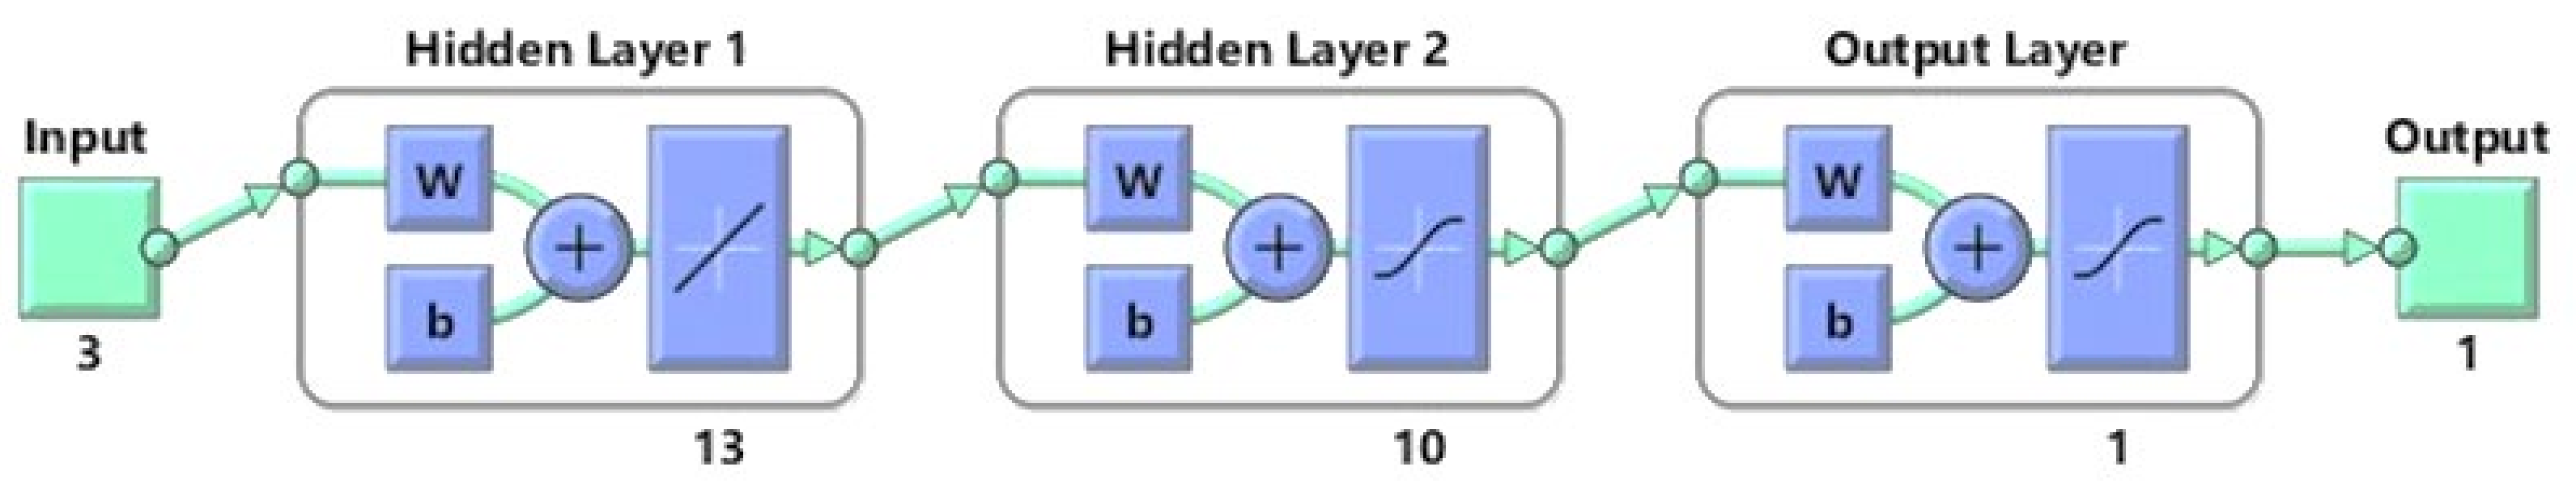
2.3. ANN Based Modelling
2.4. Data Normalization and Error Evaluation
3. Results and Discussion
3.1. Experimental Results
3.2. ANN Modelling for Prediction of TPC
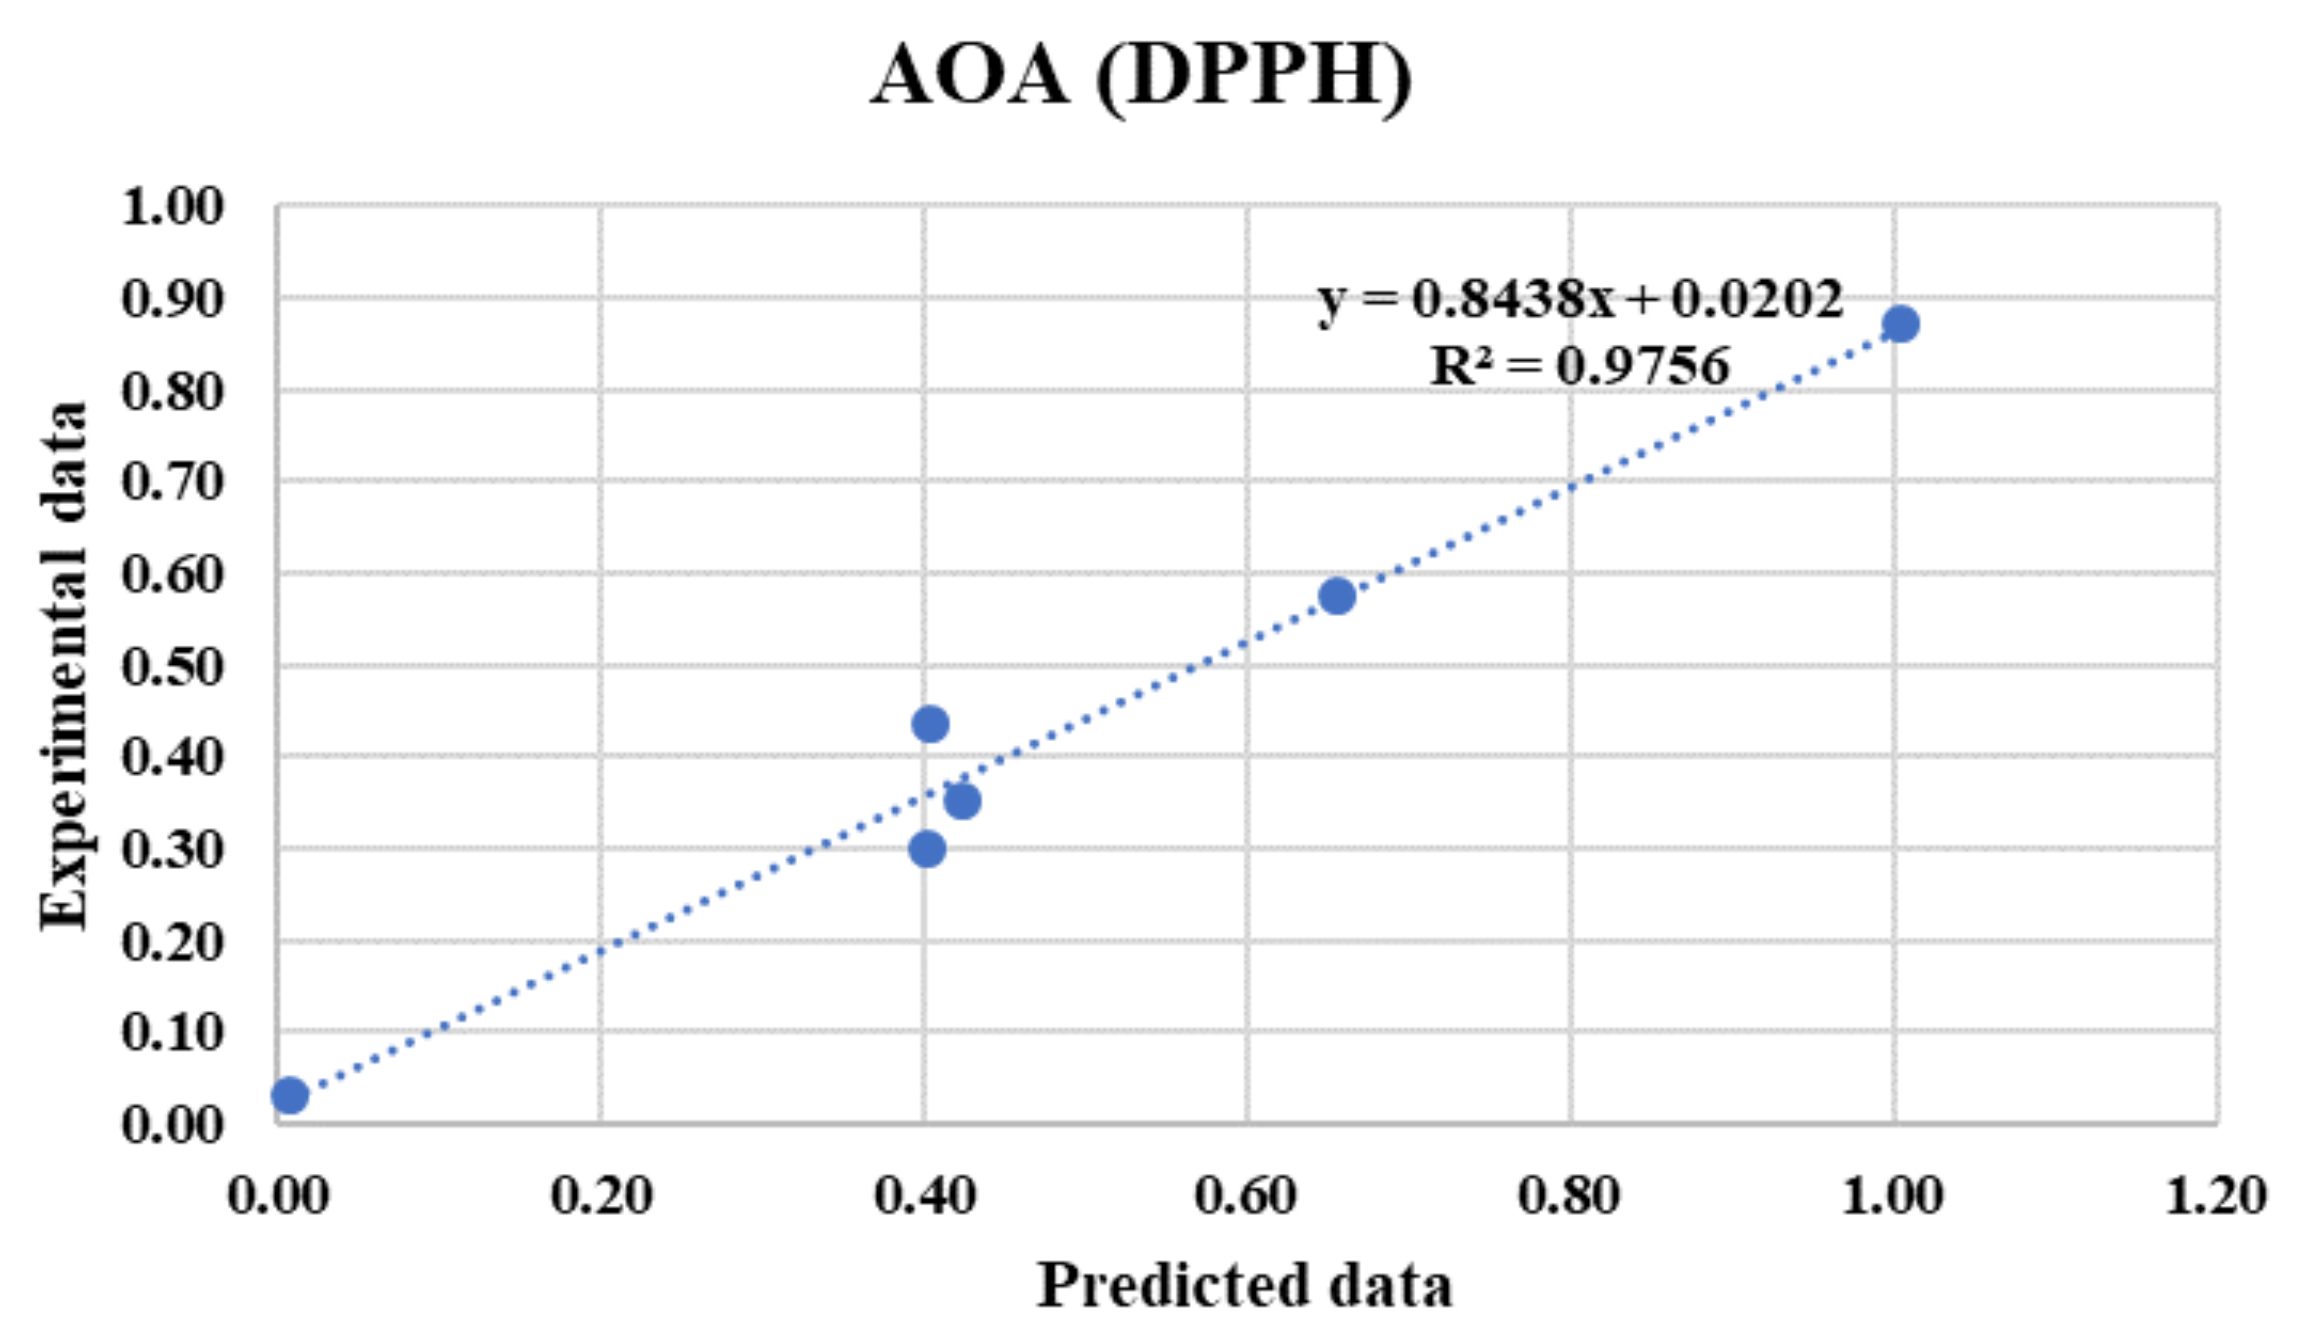
3.3. ANN Modelling for Prediction of AOA (DPPH)
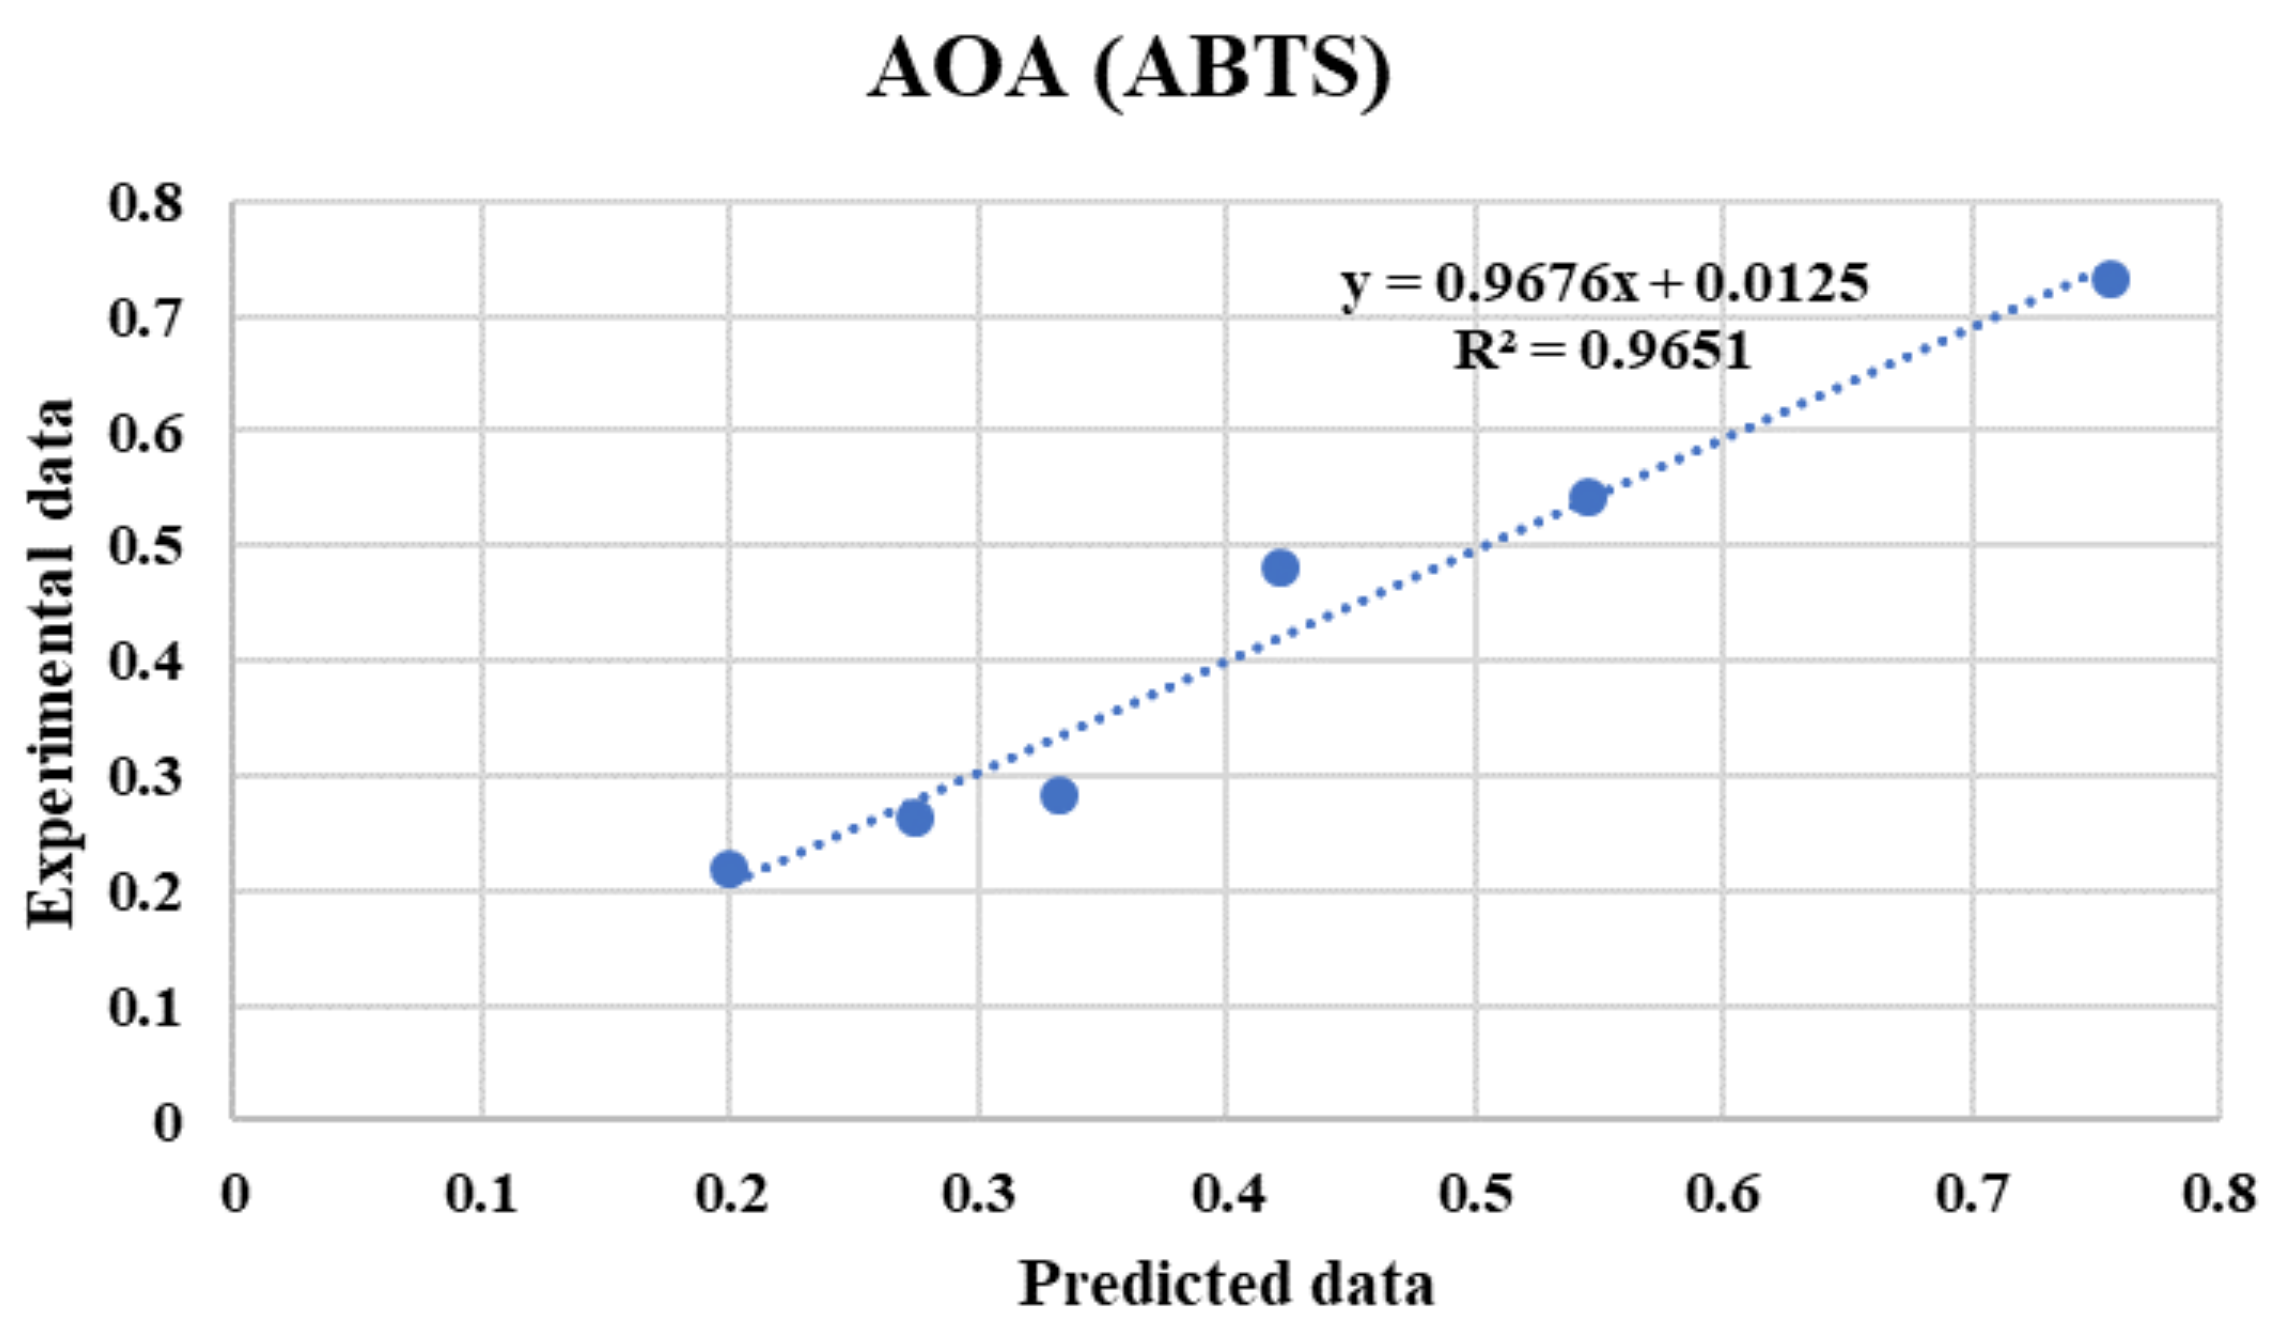
3.4. ANN Modelling for Prediction of AOA (ABTS)
4. Conclusions
Author Contributions
Funding
Institutional Review Board Statement
Informed Consent Statement
Data Availability Statement
Acknowledgments
Conflicts of Interest
References
- Rodríguez-Gutiérrez, G.; Cardoso, J.C.; Rubio-Senent, F.; Serrano, A.; Borja, R.; Fernández-Bolaños, J.; Fermoso, F.G. Thermally-Treated Strawberry Extrudate: A Rich Source of Antioxidant Phenols and Sugars. Innov. Food Sci. Emerg. Technol. 2019, 51, 186–193. [Google Scholar] [CrossRef] [Green Version]
- Aaby, K.; Skrede, G.; Wrolstad, R.E. Phenolic Composition and Antioxidant Activities in Flesh and Achenes of Strawberries (Fragaria Ananassa). J. Agric. Food Chem. 2005, 53, 4032–4040. [Google Scholar] [CrossRef] [PubMed]
- Guiné, R.; Correia, P.; Ferrão, A.C.; Gonçalves, F.; Lerat, C.; El-Idrissi, T.; Rodrigo, E. Evaluation of Phenolic and Antioxidant Properties of Strawberry as a Function of Extraction Conditions. Braz J. Food Technol. 2020, 23, 1–11. [Google Scholar] [CrossRef]
- Giongo, L.; Poncetta, P.; Loretti, P.; Costa, F. Texture Profiling of Blueberries (Vaccinium spp.) during Fruit Development, Ripening and Storage. Postharvest Biol. Tech. 2013, 76, 34–39. [Google Scholar] [CrossRef]
- Giampieri, F.; Tulipani, S.; Alvarez-Suarez, J.M.; Quiles, J.L.; Mezzetti, B.; Battino, M. The Strawberry: Composition, Nutritional Quality, and Impact on Human Health. Nutrition 2012, 28, 9–19. [Google Scholar] [CrossRef]
- Milivojević, J.; Rakonjac, V.; Akšić, M.F.; Pristov, J.B.; Maksimović, V. Classification and Fingerprinting of Different Berries Based on Biochemical Profiling and Antioxidant Capacity. Pesq. Agropec. Bras. 2013, 48, 1285–1294. [Google Scholar] [CrossRef] [Green Version]
- Chu, Y.-F.; Sun, J.; Wu, X.; Liu, R.H. Antioxidant and Antiproliferative Activities of Common Vegetables. J. Agric. Food Chem. 2002, 50, 6910–6916. [Google Scholar] [CrossRef] [PubMed]
- Vauzour, D.; Vafeiadou, K.; Rendeiro, C.; Corona, G.; Spencer, J.P.E. The Inhibitory Effects of Berry-Derived Flavonoids against Neurodegenerative Processes. J. Berry Res. 2010, 1, 45–52. [Google Scholar] [CrossRef] [Green Version]
- Johnsen, S.P.; Overvad, K.; Stripp, C.; Tjønneland, A.; Husted, S.E.; Sørensen, H.T. Intake of Fruit and Vegetables and the Risk of Ischemic Stroke in a Cohort of Danish Men and Women. Am. J. Clin. Nutr. 2003, 78, 57–64. [Google Scholar] [CrossRef] [PubMed]
- Guiné, R.P.F. The Use of Artificial Neural Networks (ANN) in Food Process Engineering. Int. J. Food Eng. 2019, 5, 15–21. [Google Scholar] [CrossRef]
- Lapornik, B.; Prošek, M.; Golc Wondra, A. Comparison of Extracts Prepared from Plant By-Products Using Different Solvents and Extraction Time. J. Food Eng. 2005, 71, 214–222. [Google Scholar] [CrossRef]
- Azmir, J.; Zaidul, I.S.M.; Rahman, M.M.; Sharif, K.M.; Mohamed, A.; Sahena, F.; Jahurul, M.H.A.; Ghafoor, K.; Norulaini, N.A.N.; Omar, A.K.M. Techniques for Extraction of Bioactive Compounds from Plant Materials: A Review. J. Food Eng. 2013, 117, 426–436. [Google Scholar] [CrossRef]
- Ballesteros, L.F.; Teixeira, J.A.; Mussatto, S.I. Selection of the Solvent and Extraction Conditions for Maximum Recovery of Antioxidant Phenolic Compounds from Coffee Silverskin. Food Bioprocess. Technol. 2014, 7, 1322–1332. [Google Scholar] [CrossRef] [Green Version]
- Naczk, M.; Shahidi, F. Extraction and Analysis of Phenolics in Food. J. Chromatogr. A 2004, 1054, 95–111. [Google Scholar] [CrossRef]
- Serrano, D.; Golpour, I.; Sánchez-Delgado, S. Predicting the Effect of Bed Materials in Bubbling Fluidized Bed Gasification Using Artificial Neural Networks (ANNs) Modeling Approach. Fuel 2020, 266, 1–6. [Google Scholar] [CrossRef]
- Golpour, I.; Chayjan, R.A.; Parian, J.A.; Khazaei, J. Prediction of Paddy Moisture Content during Thin La Yer Drying Using Machine Vision and Artificial Neural Networks. J. Agr. Sci. Tech. 2015, 17, 287–298. [Google Scholar]
- Golpour, I.; Kaveh, M.; Chayjan, R.A.; Guiné, R.P.F. Optimization of Infrared-Convective Drying of White Mulberry Fruit Using Response Surface Methodology and Development of a Predictive Model through Artificial Neural Network. Int. J. Fruit Sci. 2020, 20, S1015–S1035. [Google Scholar] [CrossRef]
- Guiné, R.P.F.; Barroca, M.J.; Gonçalves, F.J.; Alves, M.; Oliveira, S.; Mendes, M. Artificial Neural Network Modelling of the Antioxidant Activity and Phenolic Compounds of Bananas Submitted to Different Drying Treatments. Food Chem. 2015, 168, 454–459. [Google Scholar] [CrossRef] [PubMed]
- Cimpoiu, C.; Cristea, V.-M.; Hosu, A.; Sandru, M.; Seserman, L. Antioxidant Activity Prediction and Classification of Some Teas Using Artificial Neural Networks. Food Chem. 2011, 127, 1323–1328. [Google Scholar] [CrossRef]
- Cabrera, Á.C.; Prieto, J. Application of Artificial Neural Networks to the Prediction of the Antioxidant Activity of Essential Oils in Two Experimental in Vitro Models. Food Chem. 2010, 118, 141–146. [Google Scholar] [CrossRef]
- Kovačević, S.Z.; Tepić, A.N.; Jevrić, L.R.; Podunavac-Kuzmanović, S.O.; Vidović, S.S.; Šumić, Z.M.; Ilin, Ž.M. Chemometric Guidelines for Selection of Cultivation Conditions Influencing the Antioxidant Potential of Beetroot Extracts. Comput. Electron. Agric. 2015, 118, 332–339. [Google Scholar] [CrossRef]
- Gutés, A.; Céspedes, F.; Alegret, S.; del Valle, M. Determination of Phenolic Compounds by a Polyphenol Oxidase Amperometric Biosensor and Artificial Neural Network Analysis. Biosens. Bioelectron. 2005, 20, 1668–1673. [Google Scholar] [CrossRef]
- Gonçalves, F.J.; Rocha, S.M.; Coimbra, M.A. Study of the Retention Capacity of Anthocyanins by Wine Polymeric Material. Food Chem. 2012, 134, 957–963. [Google Scholar] [CrossRef] [PubMed]
- Santos, S.C.R.V.L.; Guiné, R.P.F.; Barros, A. Effect of Drying Temperatures on the Phenolic Composition and Antioxidant Activity of Pears of Rocha Variety (Pyrus communis L.). Food Meas. 2014, 8, 105–112. [Google Scholar] [CrossRef]
- Guiné, R.P.F.; Soutinho, S.M.A.; Gonçalves, F.J. Phenolic Compounds and Antioxidant Activity in Red Fruits Produced in Organic Farming. Croat. J. Food Sci. Technol. 2014, 6, 15–26. [Google Scholar]
- Guiné, R.; Gonçalves, C.; Matos, S.; Gonçalves, F.; Costa, D.V.T.A.; Mendes, M. Modeling Through Artificial Neural Networks of the Phenolic Compounds and Antioxidant Activity of Blueberries. Iran. J. Chem. Chem. Eng. 2018, 37, 193–212. [Google Scholar] [CrossRef]
- Guiné, R.P.F.; Correia, P.M.R.; Correia, A.C.; Goncalves, F.; Brito, M.F.S.; Ribeiro, J.R.P. Effect of Drying Temperature on the Physical-Chemical and Sensorial Properties of Eggplant (Solanum melongena L.). Curr. Nutr. Food Sci. 2018, 14, 28–39. [Google Scholar] [CrossRef]
- Kaveh, M.; Rasooli Sharabiani, V.; Amiri Chayjan, R.; Taghinezhad, E.; Abbaspour-Gilandeh, Y.; Golpour, I. ANFIS and ANNs Model for Prediction of Moisture Diffusivity and Specific Energy Consumption Potato, Garlic and Cantaloupe Drying under Convective Hot Air Dryer. Inf. Process. Agric. 2018, 5, 372–387. [Google Scholar] [CrossRef]
- Kaveh, M.; Chayjan, R.A.; Golpour, I.; Poncet, S.; Seirafi, F.; Khezri, B. Evaluation of Exergy Performance and Onion Drying Properties in a Multi-Stage Semi-Industrial Continuous Dryer: Artificial Neural Networks (ANNs) and ANFIS Models. Food Bioprod. Process. 2021, 127, 58–76. [Google Scholar] [CrossRef]
- Taghinezhad, E.; Kaveh, M.; Jahanbakhshi, A.; Golpour, I. Use of Artificial Intelligence for the Estimation of Effective Moisture Diffusivity, Specific Energy Consumption, Color and Shrinkage in Quince Drying. J. Food Process. Eng. 2020, 43, e13358. [Google Scholar] [CrossRef]
- Guedes, A.R.; de Souza, A.R.C.; Turola Barbi, R.C.; Nottar Escobar, E.L.; Zanoello, É.F.; Corazza, M.L. Extraction of Synadenium Grantii Hook f. Using Conventional Solvents and Supercritical CO2 + Ethanol. J. Supercrit. Fluids 2020, 160, 104796. [Google Scholar] [CrossRef]
- Oliveira, A.P.; Baptista, P.; Andrade, P.B.; Martins, F.; Pereira, J.A.; Silva, B.M.; Valentão, P. Characterization of Ficus Carica L. Cultivars by DNA and Secondary Metabolite Analysis: Is Genetic Diversity Reflected in the Chemical Composition? Food Res. Int. 2012, 49, 710–719. [Google Scholar] [CrossRef]
- Kristianto, Y.; Wignyanto, W.; Argo, B.D.; Santoso, I. Antioxidant Increase by Response Surface Optimization and Bayesian Neural Network Modelling of Pumpkin (Cucurbita Moschata Duch) Freezing. Food Res. 2021, 5, 73–82. [Google Scholar] [CrossRef]
- Baykal, H.; Yildirim, H.K. Application of Artificial Neural Networks (ANNs) in Wine Technology. Crit. Rev. Food Sci. Nutr. 2013, 53, 415–421. [Google Scholar] [CrossRef] [PubMed]
- Eftekhari, M.; Yadollahi, A.; Ahmadi, H.; Shojaeiyan, A.; Ayyari, M. Development of an Artificial Neural Network as a Tool for Predicting the Targeted Phenolic Profile of Grapevine (Vitis Vinifera) Foliar Wastes. Front. Plant. Sci 2018, 9, 837. [Google Scholar] [CrossRef] [PubMed]
- Burden, F.; Winkler, D. Bayesian Regularization of Neural Networks. In Artificial Neural Networks: Methods and Applications; Livingstone, D.J., Ed.; Methods in Molecular BiologyTM; Humana Press: Totowa, NJ, USA, 2009; pp. 23–42. [Google Scholar]
- Beale, M.; Hagan, M.; Demuth, H. Neural Network ToolboxTM User’s Guide; The MathWorks Inc.: Natick, MA, USA, 2012; pp. 29–794. [Google Scholar]
- Hosu, A.; Cristea, V.; Cimpoiu, C. Analysis of Total Phenolic, Flavonoids, Anthocyanins and Tannins Content in Romanian Red Wines: Prediction of Antioxidant Activities and Classification of Wines Using Artificial Neural Networks. Food Chem. 2014, 150, 113–118. [Google Scholar] [CrossRef]


| Input Variables to the ANNs (Units) | Range | Output Variables for the ANNs (Units) | Range |
|---|---|---|---|
| Time (min) | 20–60 | Total phenolic compounds (TPC) (mg GAE/g) | 1.066–1.550 |
| Volume/Mass ratio (mL/g) | 6–12 | Antioxidant activity (AOA-DPPH) (mg TE/g) | 0.904–1.656 |
| Solvent (%) | 40–100 | Antioxidant activity (AOA-ABTS) (mg TE/g) | 1.446–4.352 |
| No | Particulars | Specifications |
|---|---|---|
| 1 | Network type | Feed-Forward Backpropagation (FFBP) Cascade-Forward Backpropagation (CFBP) |
| 2 | Training function or Training algorithm | Levenberg-Marquardt (LM) backpropagation (TRAINLM) Bayesian regulation (BR) backpropagation (TRAINBR) |
| 3 | Adaption learning function | Gradient Descent with Momentum Weight and Bias (LEARNGDM) |
| 4 | Performance function | Mean Square Error (MSE) |
| 5 | Transfer functions | Hyperbolic Tangent Sigmoid (TANSIG) Logarithmic sigmoid (LOGSIG) Linear (PURELIN) |
| 6 | Data division | Random (Dividerand) |
| 7 | Number of input layer units | 3 |
| 8 | Number of output layer units | 1 |
| 9 | Number of hidden layers | 1 and 2 |
| 10 | Number of hidden layer neurons | Iterative |
| 11 | Number of epochs (Learning cycle) | 1000 iterations for Levenberg-Marquardt (LM); 2000 iterations for Bayesian regulation (BR) |
| Time (min) | Volume/Mass Ratio (mL/g) | Conc. Solvent (%) | TPC (mg GAE/g) | AOA-DPPH (mg TE/g) | AOA-ABTS (mg TE/g) |
|---|---|---|---|---|---|
| 40.0 | 9.0 | 70.0 | 1.318 ± 0.105 | 1.182 ± 0.161 | 2.858 ± 0.719 |
| 20.0 | 9.0 | 70.0 | 1.240 ± 0.029 | 1.188 ± 0.070 | 3.368 ± 0.042 |
| 60.0 | 9.0 | 70.0 | 1.293 ± 0.039 | 1.251 ± 0.009 | 2.070 ± 0.041 |
| 40.0 | 6.0 | 70.0 | 1.457 ± 0.036 | 1.297 ± 0.071 | 2.401 ± 0.004 |
| 40.0 | 12.0 | 70.0 | 1.494 ± 0.072 | 1.201 ± 0.072 | 3.036 ± 0.129 |
| 40.0 | 9.0 | 40.0 | 1.146 ± 0.068 | 1.187 ± 0.084 | 2.277 ± 0.174 |
| 40.0 | 9.0 | 100.0 | 1.446 ± 0.021 | 1.271 ± 0.029 | 1.686 ± 0.156 |
| Network | Training Algorithm | Threshold Function | Topology | Epoch | R2 | MSE |
|---|---|---|---|---|---|---|
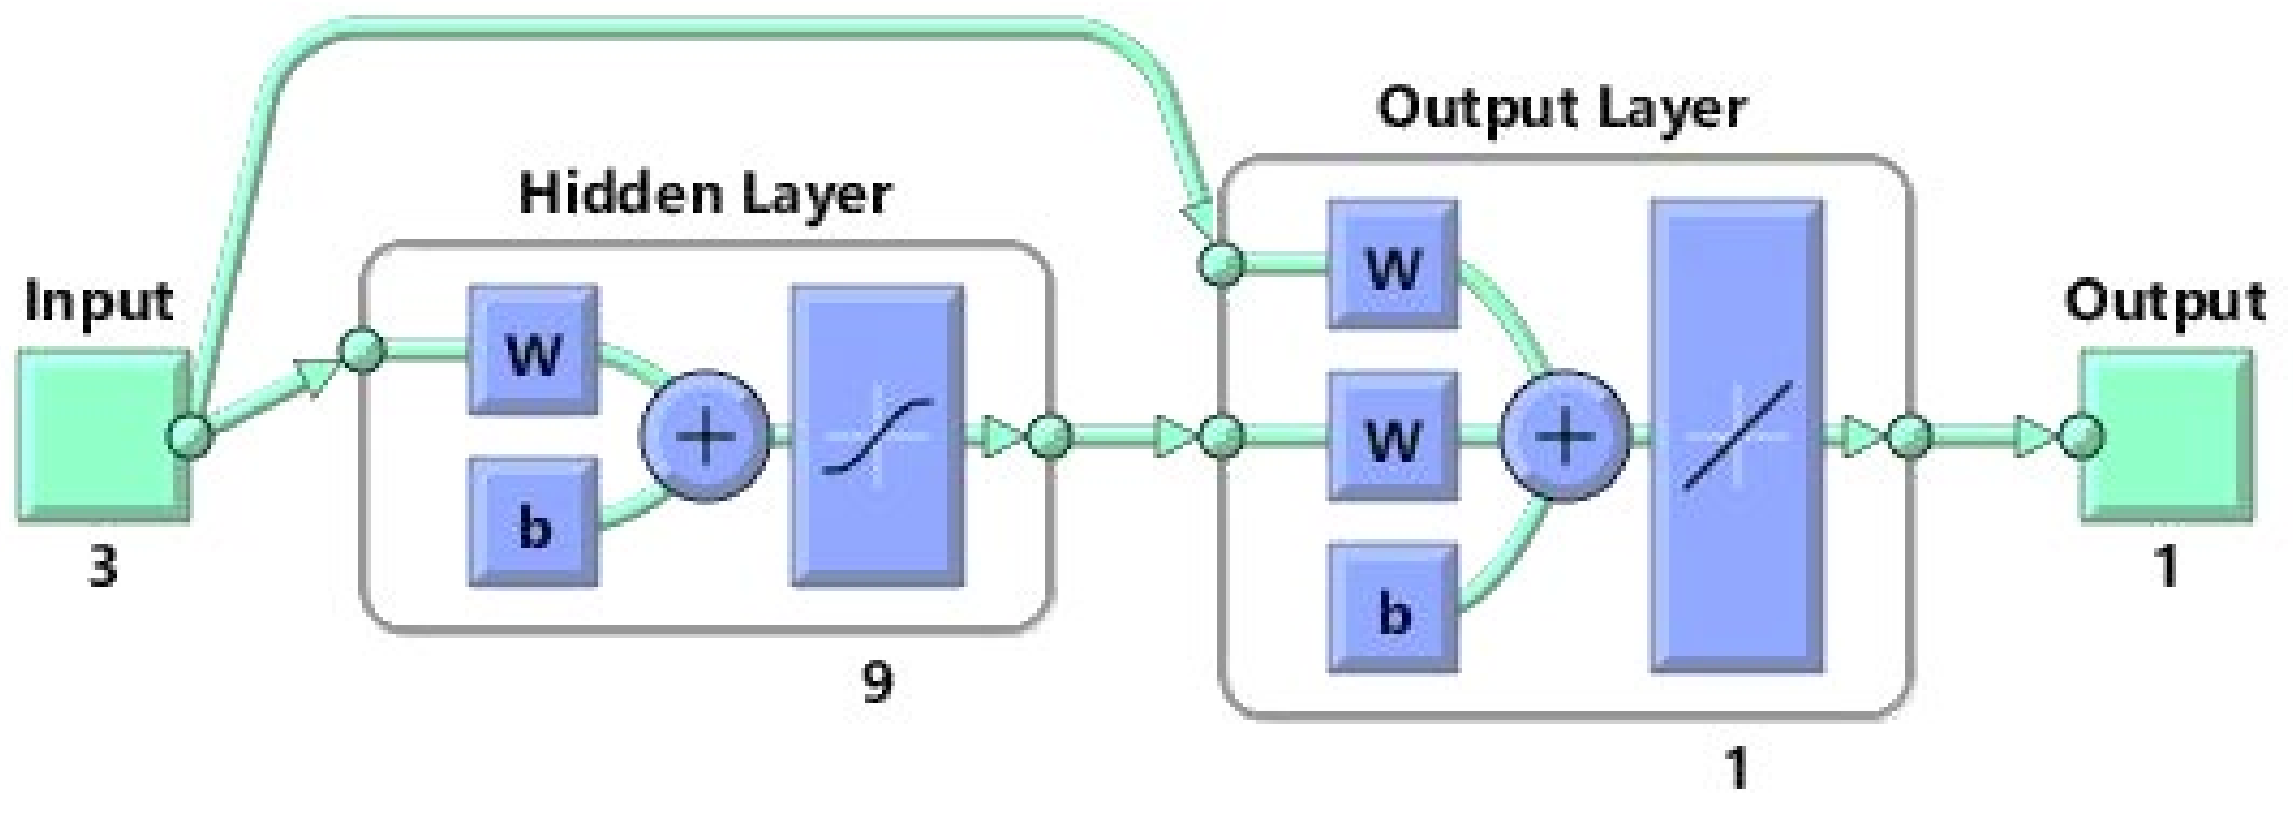
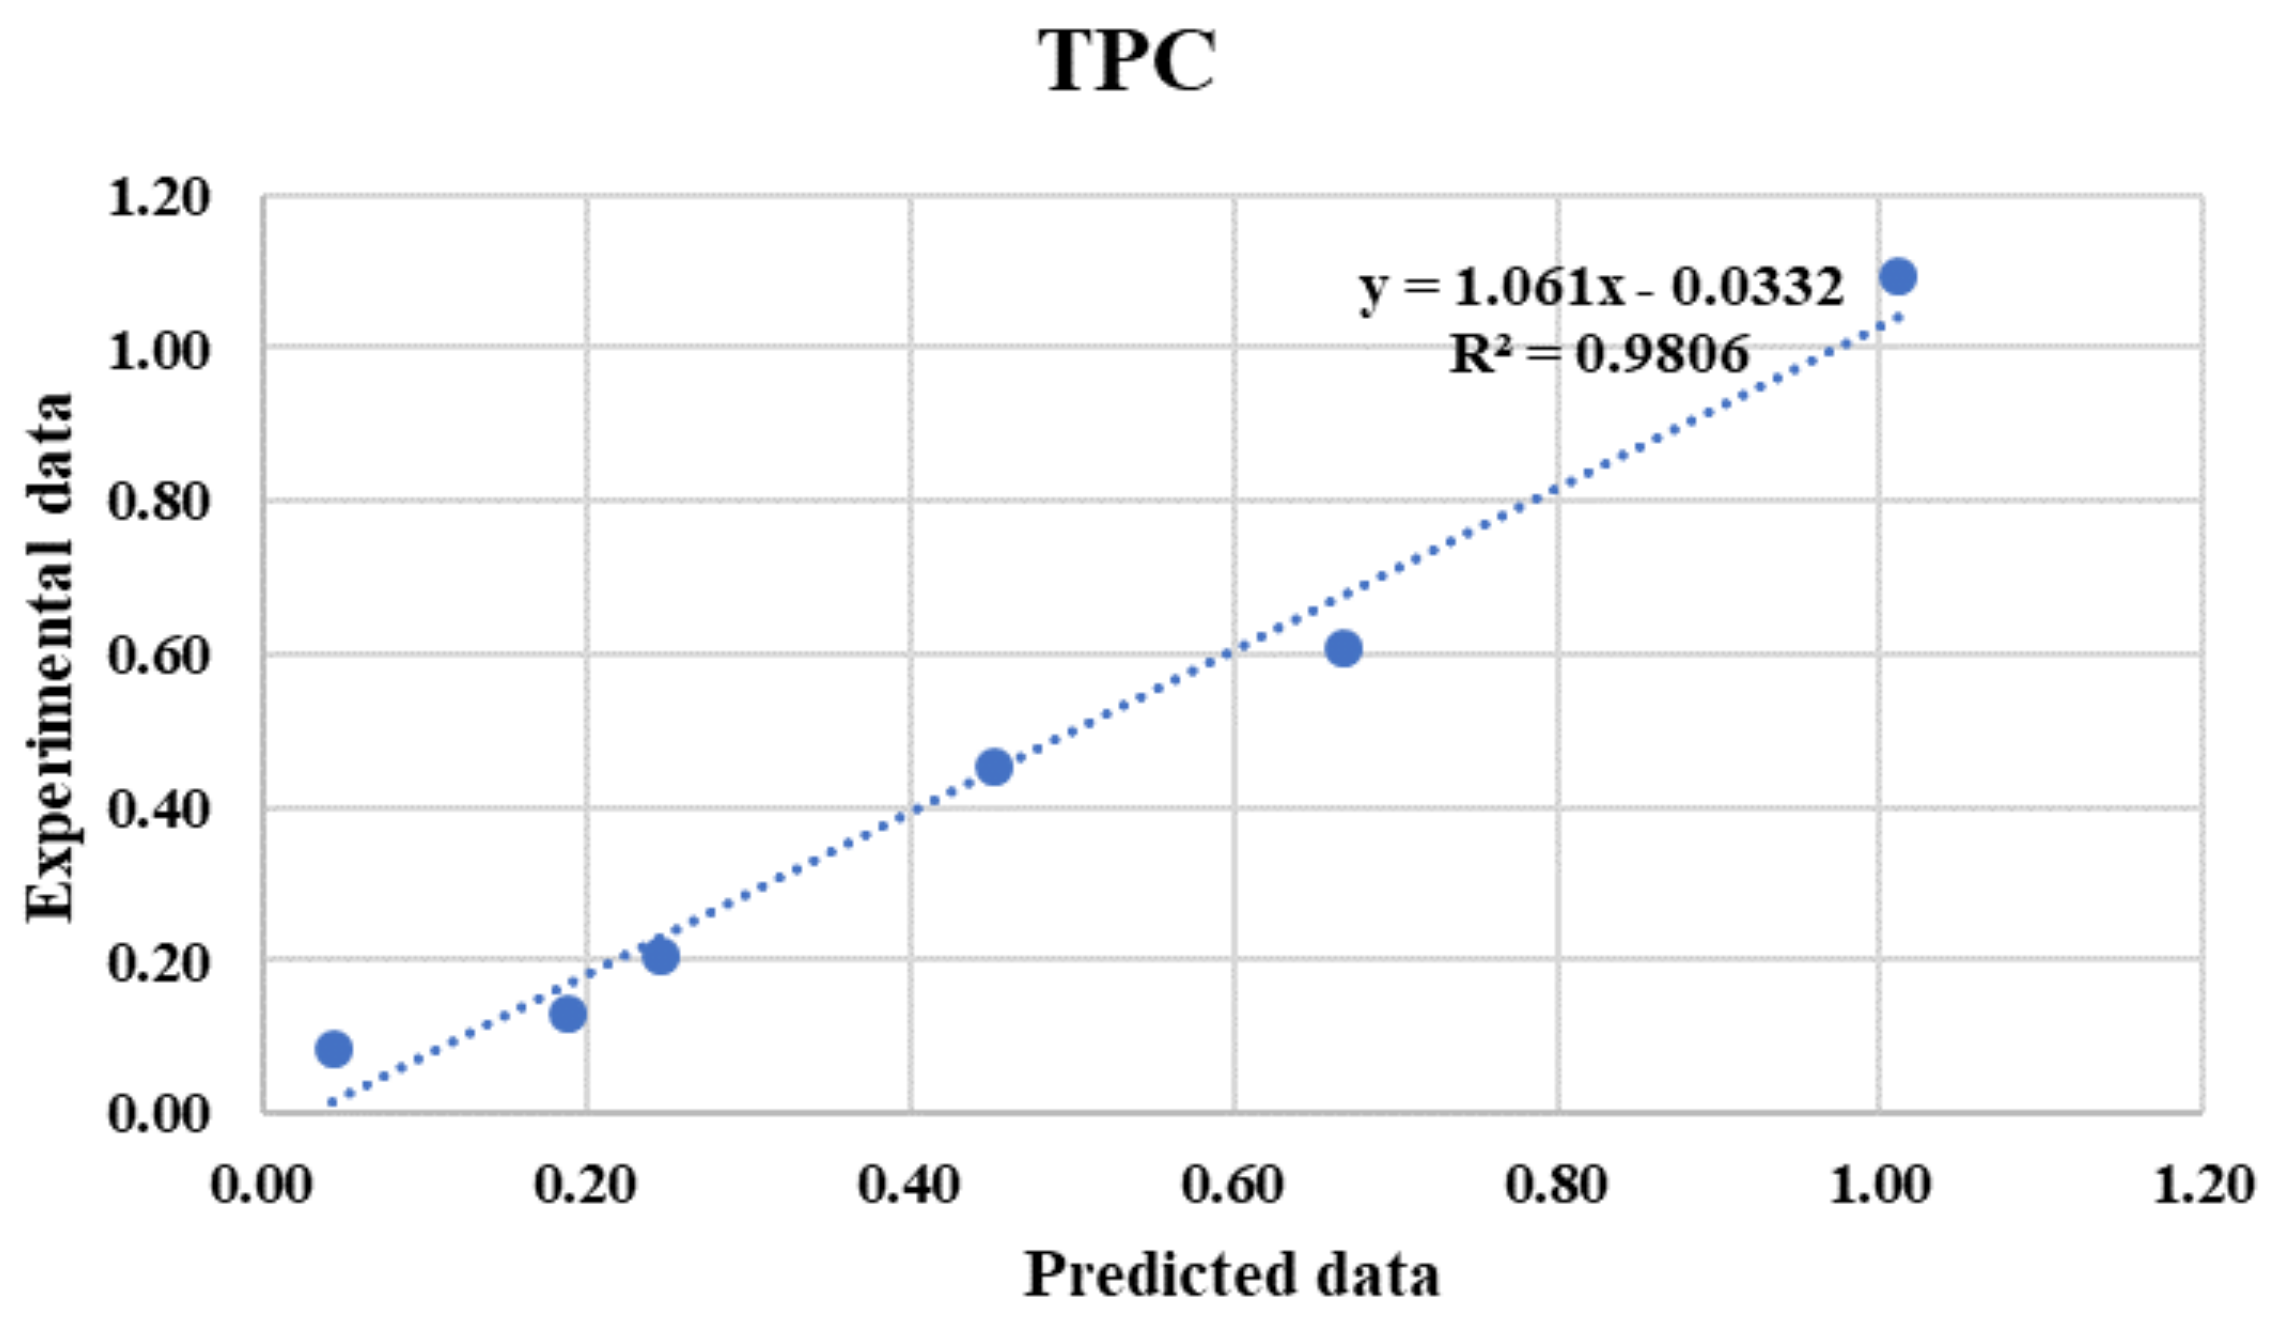
| CFBP | LM | Tansig-Purelin | 3-9-1 | 11 | 0.9806 | 0.00470 |
| Purelin-Tansig-Purelin | 3-6-3-1 | 15 | 0.9709 | 0.00620 | ||
| Tansig-Tansig | 3-11-1 | 10 | 0.9783 | 0.00900 | ||
| BR | Purelin-Purelin-Tansig | 3-5-5-1 | 5 | 0.9691 | 0.02490 | |
| Purelin-Purelin | 3-10-1 | 22 | 0.9599 | 0.03170 | ||
| FFBP | LM | Logsig-Logsig-Tansig | 3-20-5-1 | 35 | 0.9755 | 0.00510 |
| Tansig-Tansig-Tansig | 3-10-8-1 | 44 | 0.9730 | 0.00980 | ||
| BR | Purelin-Purelin | 3-15-1 | 12 | 0.9655 | 0.02780 |
| Network | Training Algorithm | Threshold Function | Topology | Epoch | R2 | MSE |
|---|---|---|---|---|---|---|
| FFBP | LM | Purelin-Purelin | 3-7-1 | 9 | 0.9601 | 0.00910 |
| Purelin-Tansig-Purelin | 3-15-9-1 | 15 | 0.9595 | 0.09500 | ||
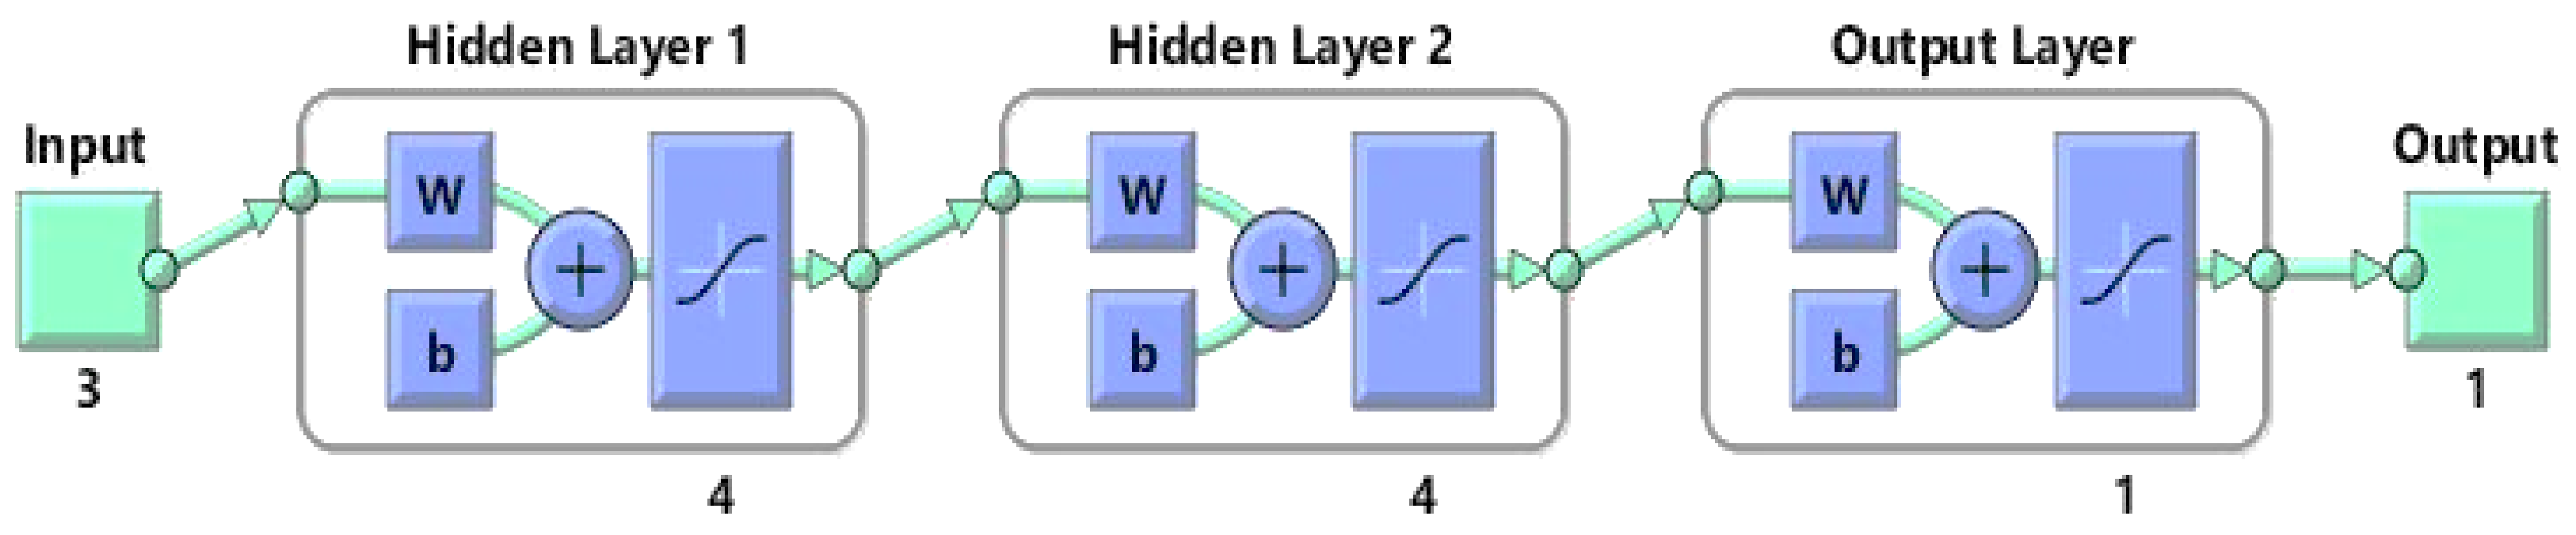
| BR | Tansig-Tansig-Tansig | 3-4-4-1 | 25 | 0.9756 | 0.00350 | |
| Purelin-Tansig-Tansig | 3-10-10-1 | 44 | 0.9734 | 0.00440 | ||
| Logsig-Tansig-Purelin | 3-10-8-1 | 13 | 0.9695 | 0.00610 | ||
| Tansig-Purelin | 3-3-1 | 4 | 0.9633 | 0.00830 | ||
| CFBP | LM | Tansig-Tansig-Tansig | 3-12-6-1 | 18 | 0.9520 | 0.09900 |
| BR | Purelin-Purelin-Purelin | 3-7-3-1 | 27 | 0.9525 | 0.09400 |
| Network | Training Algorithm | Threshold Function | Topology | Epoch | R2 | MSE |
|---|---|---|---|---|---|---|
| FFBP | LM | Purelin-Tansig-Tansing | 3-13-10-1 | 32 | 0.9651 | 0.00286 |
| Tansig-Tansig | 3-8-1 | 18 | 0.9622 | 0.00260 | ||
| Tansig-Purelin -Purelin | 3-5-3-1 | 9 | 0.9512 | 0.00415 | ||
| BR | Logsig-Purelin-Tansig | 3-8-8-1 | 22 | 0.9601 | 0.00370 | |
| Tansig-Purelin-Tansig | 3-3-3-1 | 14 | 0.9555 | 0.00500 | ||
| Purelin-Tansig | 3-6-1 | 3 | 0.9423 | 0.01500 | ||
| CFBP | LM | Tansig-Tansig-Tansig | 3-20-5-1 | 20 | 0.9600 | 0.00420 |
| BR | Purelin-Purelin-Purelin | 3-8-5-1 | 5 | 0.9615 | 0.00335 |
Publisher’s Note: MDPI stays neutral with regard to jurisdictional claims in published maps and institutional affiliations. |
© 2021 by the authors. Licensee MDPI, Basel, Switzerland. This article is an open access article distributed under the terms and conditions of the Creative Commons Attribution (CC BY) license (https://creativecommons.org/licenses/by/4.0/).
Share and Cite
Golpour, I.; Ferrão, A.C.; Gonçalves, F.; Correia, P.M.R.; Blanco-Marigorta, A.M.; Guiné, R.P.F. Extraction of Phenolic Compounds with Antioxidant Activity from Strawberries: Modelling with Artificial Neural Networks (ANNs). Foods 2021, 10, 2228. https://doi.org/10.3390/foods10092228
Golpour I, Ferrão AC, Gonçalves F, Correia PMR, Blanco-Marigorta AM, Guiné RPF. Extraction of Phenolic Compounds with Antioxidant Activity from Strawberries: Modelling with Artificial Neural Networks (ANNs). Foods. 2021; 10(9):2228. https://doi.org/10.3390/foods10092228
Chicago/Turabian StyleGolpour, Iman, Ana Cristina Ferrão, Fernando Gonçalves, Paula M. R. Correia, Ana M. Blanco-Marigorta, and Raquel P. F. Guiné. 2021. "Extraction of Phenolic Compounds with Antioxidant Activity from Strawberries: Modelling with Artificial Neural Networks (ANNs)" Foods 10, no. 9: 2228. https://doi.org/10.3390/foods10092228