
Characterization of Cationic Modified Short Linear Glucan and Fabrication of Complex Nanoparticles with Low and High Methoxy Pectin

 , ,
, ,
Abstract
:1. Introduction
2. Materials and Methods
2.1. Material
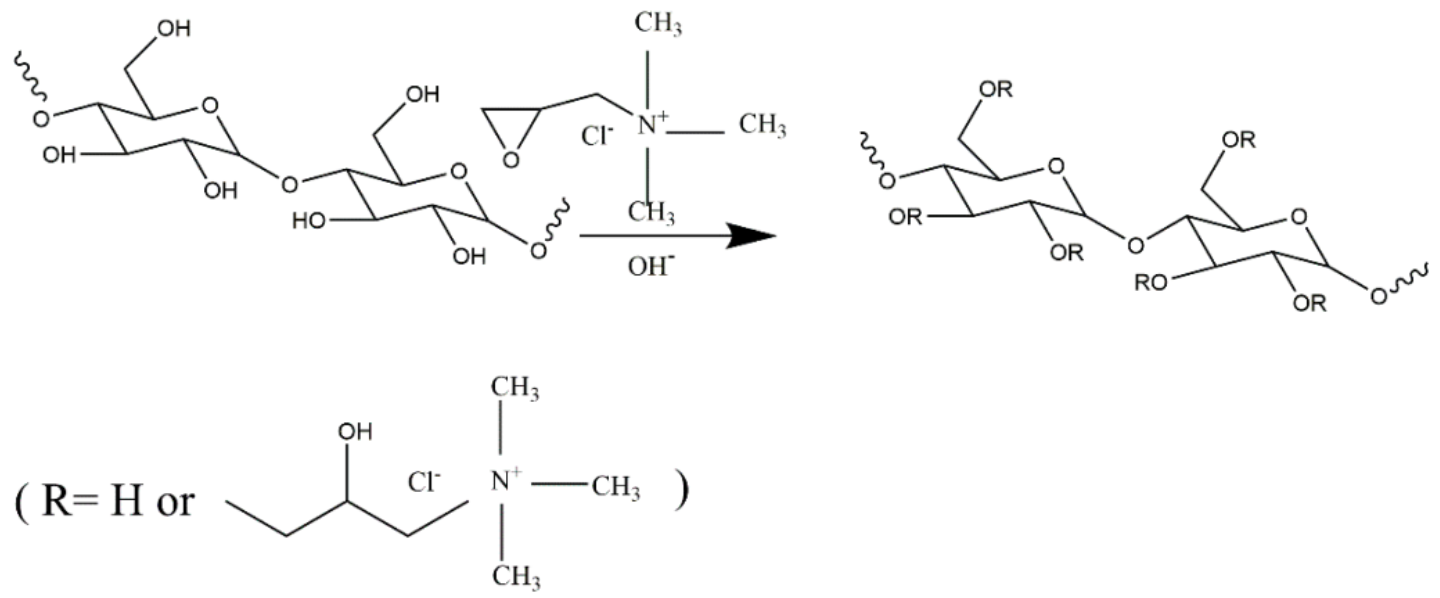
2.2. Preparation of the CSLG
2.3. Characterization of CSLG
2.4. Preparation of the CSLG-Based Nanocomplex
2.5. Particle Size, Polymer Sispersity Index (PDI), and Zeta Potential
2.6. Transmission Electron Microscopy (TEM) Imaging
2.7. Fourier Transform Infrared Spectroscopy (FTIR)
2.8. Differential Scanning Calorimetry (DSC)
2.9. X-ray Diffractogram (XRD
2.10. Nanoparticle Stability in Simulated Gastrointestinal (GI) Fluids
2.11. Encapsulation of Tangeretin (TAN)
2.12. The Release Properties of the TAN in the Nanocomplex Particle
2.13. Statistics
3. Result and Discussion
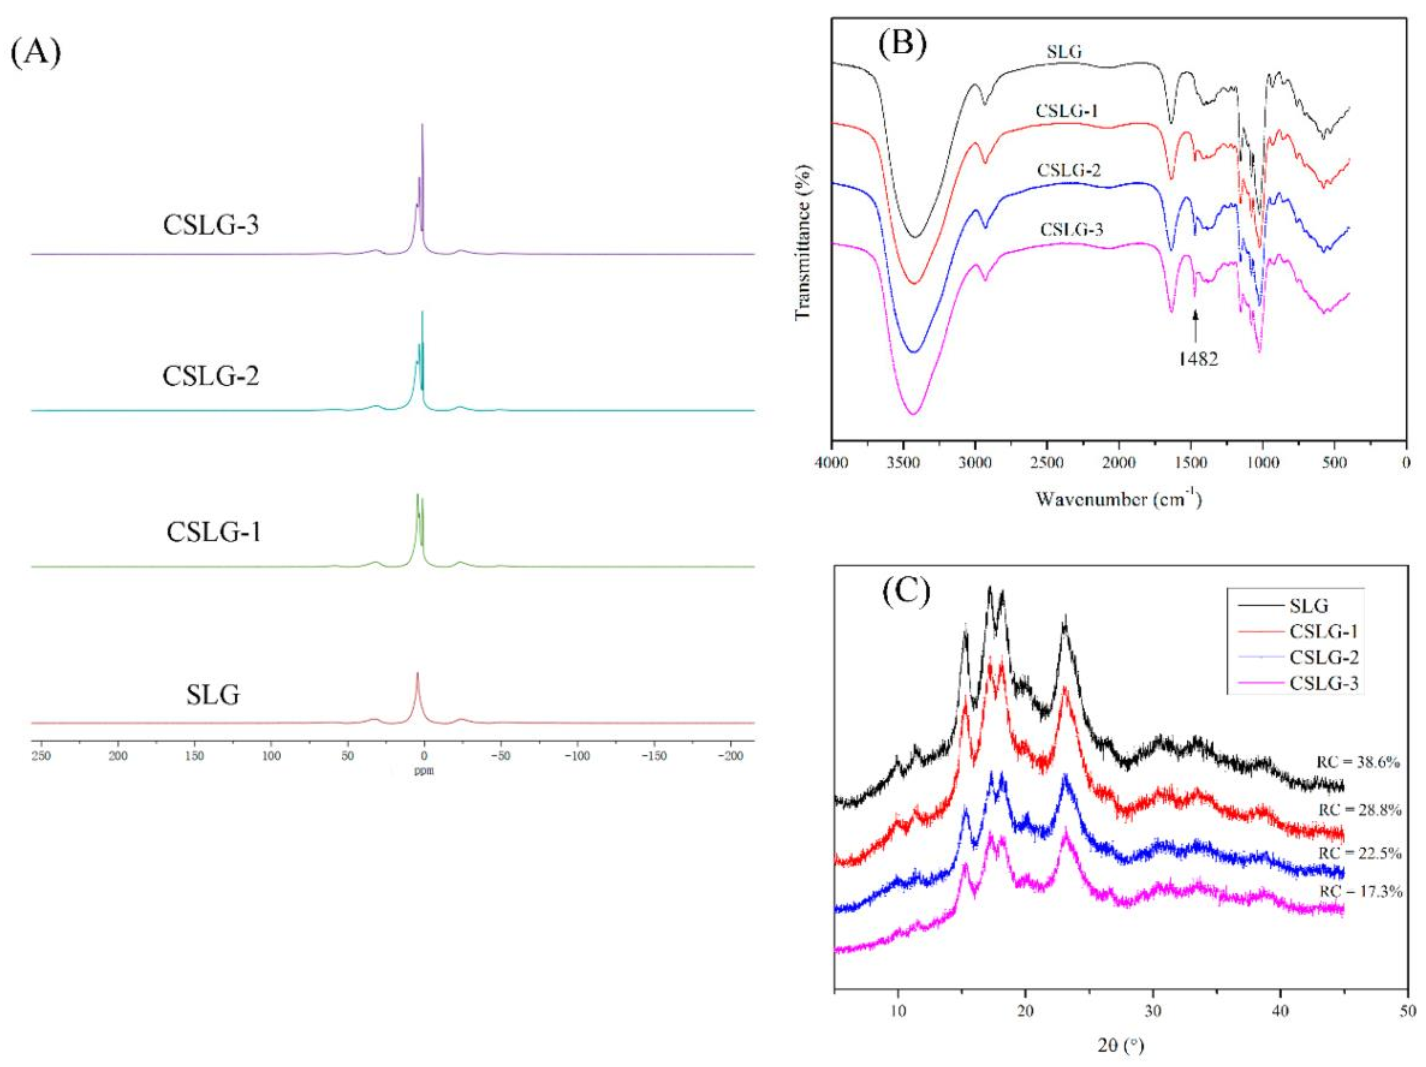
3.1. Characteration of the CSLG
3.2. Characterization of Nanocomplex
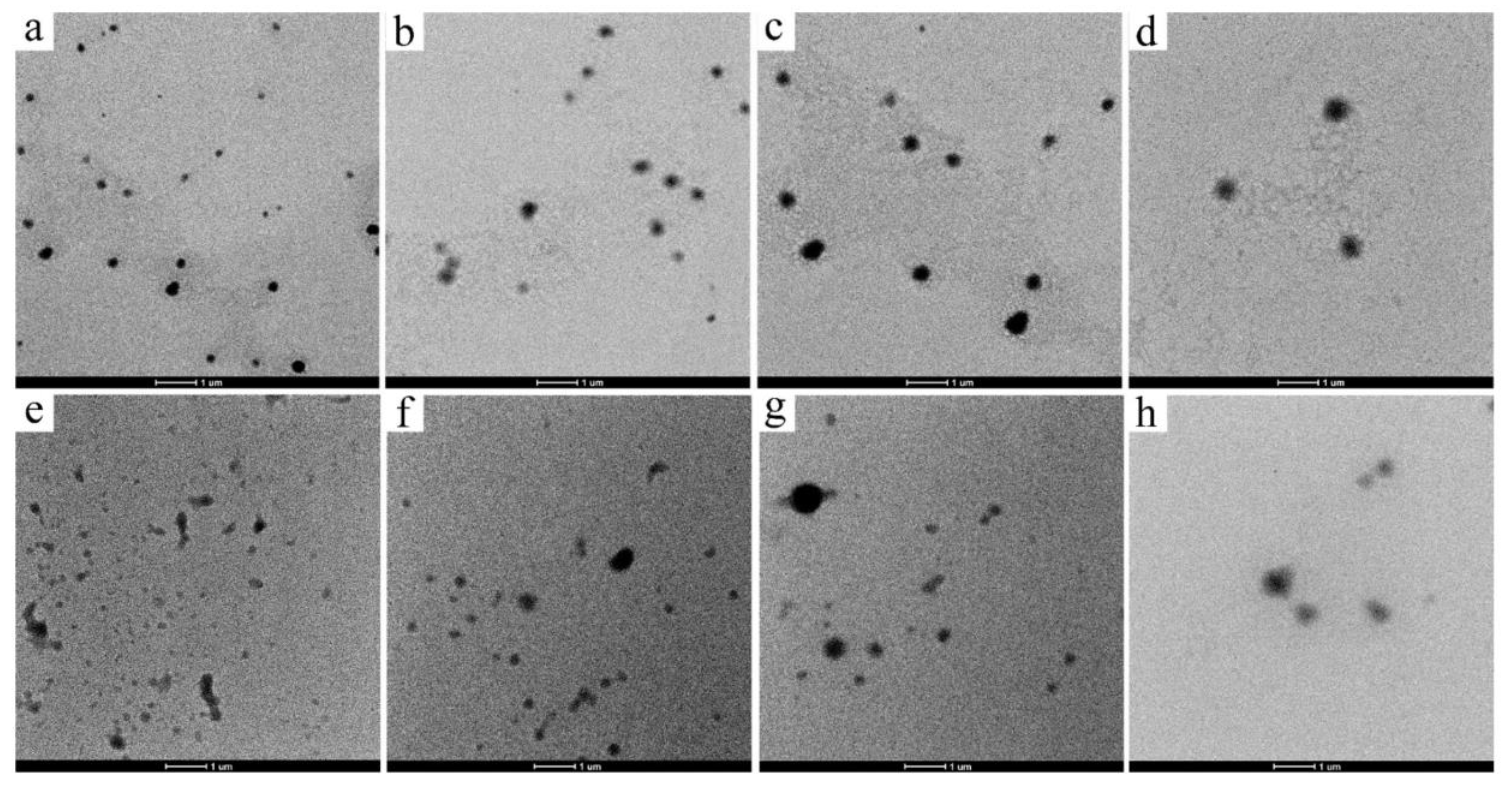
3.3. TEM
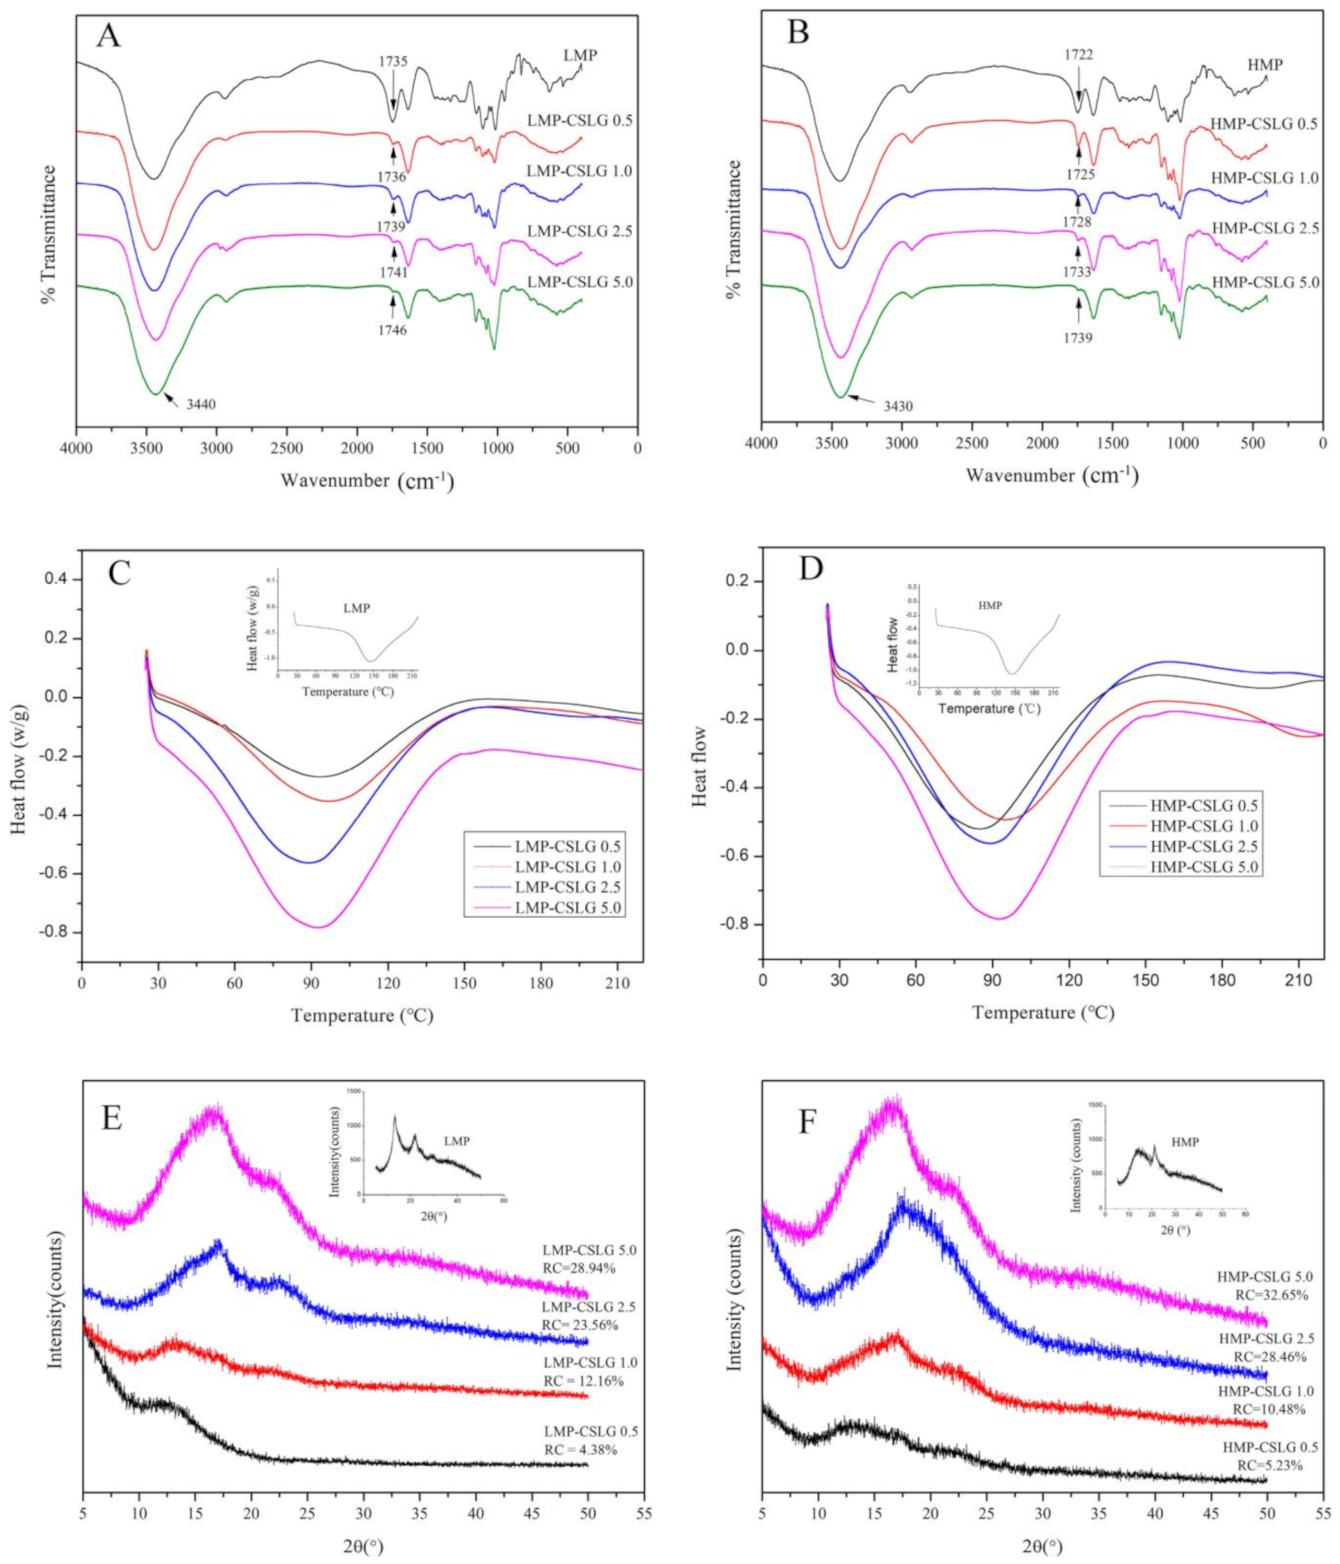
3.4. FT-IR
3.5. DSC
3.6. XRD
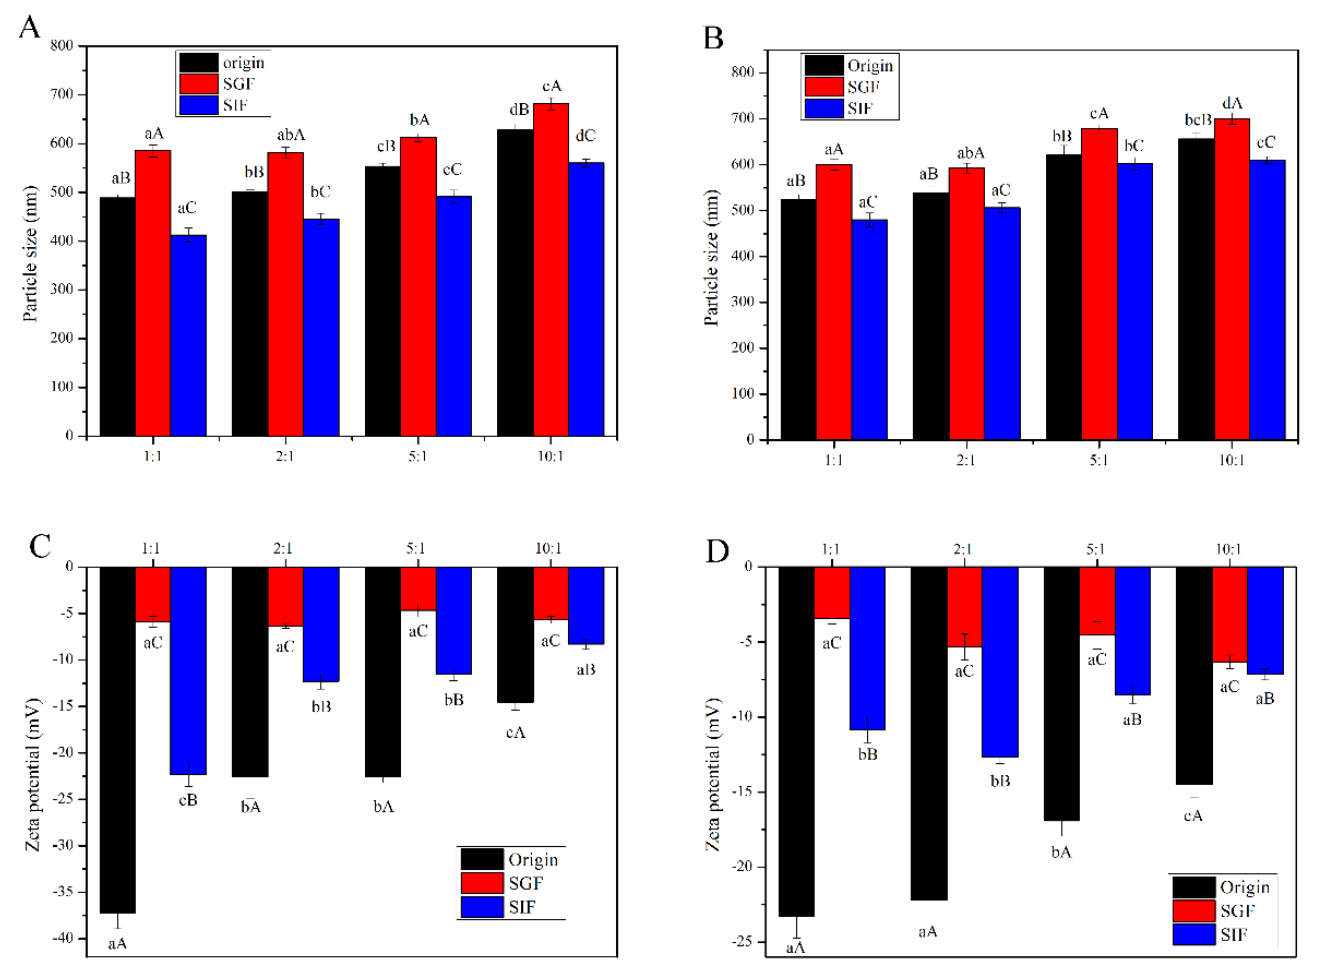
3.7. GI Stability of Nanocomplex Particle
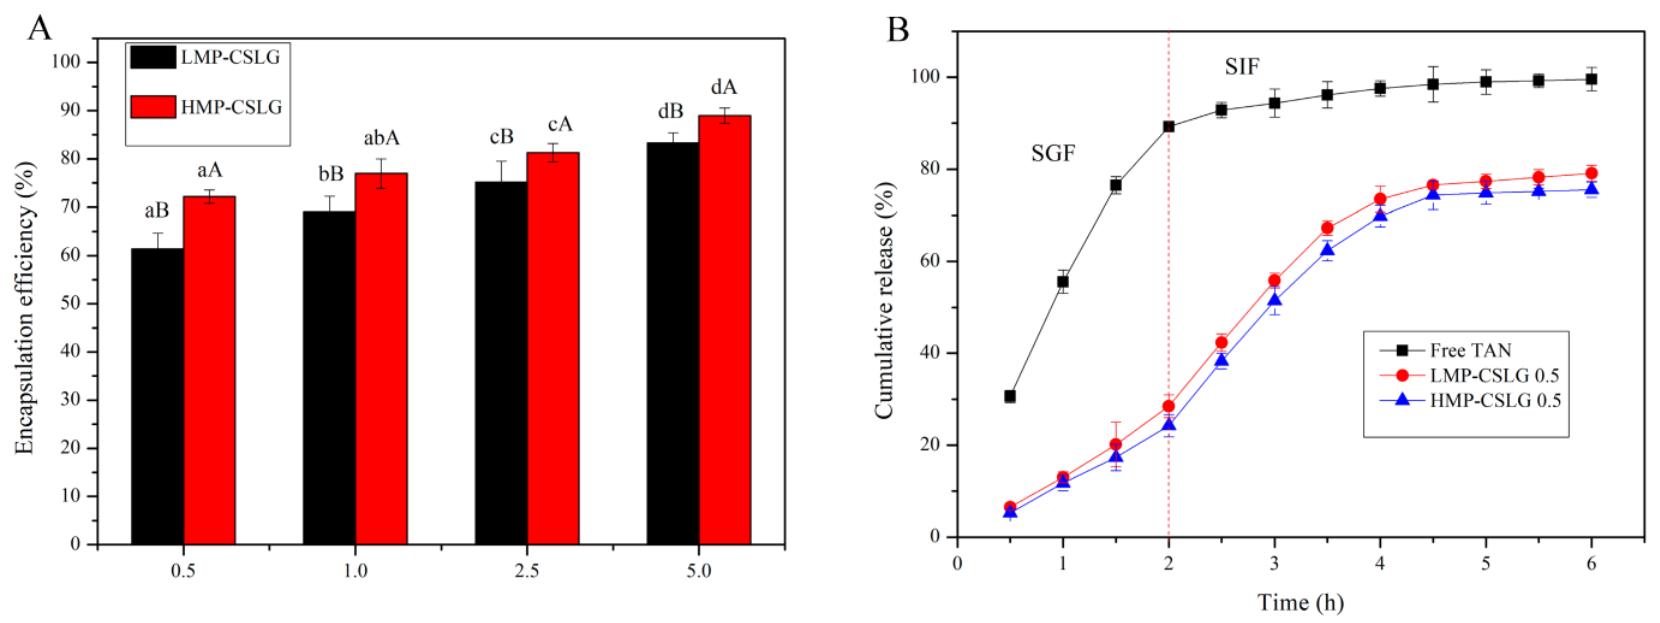
3.8. Encapsulation and Controlled Release of TAN
4. Conclusions
Supplementary Materials
Author Contributions
Funding
Institutional Review Board Statement
Informed Consent Statement
Data Availability Statement
Acknowledgments
Conflicts of Interest
References
- Liu, G.; Wang, Q.; Hu, Z.; Cai, J.; Qin, X. Maillard-Reacted Whey Protein Isolates and Epigallocatechin Gallate Complex Enhance the Thermal Stability of the Pickering Emulsion Delivery of Curcumin. J. Agric. Food Chem. 2019, 67, 5212–5220. [Google Scholar] [CrossRef] [PubMed]
- Liu, G.; Yuan, D.; Wang, Q.; Li, W.; Cai, J.; Li, S.; Lamikanra, O.; Qin, X. Maillard-Reaction-Functionalized Egg Ovalbumin Stabilizes Oil Nanoemulsions. J. Agric. Food Chem. 2018, 66, 4251–4258. [Google Scholar] [CrossRef] [PubMed]
- Wang, T.; Luo, Y. Biological fate of ingested lipid-based nanoparticles: Current understanding and future directions. Nanoscale 2019, 11, 11048–11063. [Google Scholar] [CrossRef] [PubMed]
- Hu, Q.; Hu, S.; Fleming, E.; Lee, J.; Luo, Y. Chitosan-caseinate-dextran ternary complex nanoparticles for potential oral delivery of astaxanthin with significantly improved bioactivity. Int. J. Biol. Macromol. 2020, 151, 747–756. [Google Scholar] [CrossRef]
- Zhang, Y.; Chi, C.; Huang, X.; Zou, Q.; Li, X.; Chen, L. Starch-based nanocapsules fabricated through layer-by-layer assembly for oral delivery of protein to lower gastrointestinal tract. Carbohydr. Polym. 2017, 171, 242–251. [Google Scholar] [CrossRef]
- Patel, A.; Velikov, K. Colloidal delivery systems in foods: A general comparison with oral drug delivery. LWT Food Sci. Technol. 2011, 44, 1958–1964. [Google Scholar] [CrossRef]
- Li, W.; Zhang, W.; Gong, S.; Gu, X.; Yu, Y.; Wu, J.; Wang, Z. Low and high methoxyl pectin lowers on structural change and digestibility of fried potato starch. LWT Food Sci. Technol. 2020, 132, 109853. [Google Scholar] [CrossRef]
- Le Corre, D.; Angellier-Coussy, H. Preparation and application of starch nanoparticles for nanocomposites: A review. React. Funct. Polym. 2014, 85, 97–120. [Google Scholar] [CrossRef]
- Kaur, B.; Ariffin, F.; Bhat, R.; Karim, A.A. Progress in starch modification in the last decade. Food Hydrocoll. 2012, 26, 398–404. [Google Scholar] [CrossRef]
- Liu, Q.; Li, M.; Xiong, L.; Qiu, L.; Bian, X. Characterization of Cationic Modified Debranched Starch and Formation of Complex Nanoparticles with kappa-Carrageenan and Low Methoxyl Pectin. J. Agric. Food Chem. 2019, 67, 2906–2915. [Google Scholar] [CrossRef]
- Luan, F.; Wei, L.; Zhang, J.; Tan, W.; Chen, Y.; Dong, F.; Li, Q.; Guo, Z. Preparation and Characterization of Quaternized Chitosan Derivatives and Assessment of Their Antioxidant Activity. Molecules 2018, 23, 516. [Google Scholar] [CrossRef] [Green Version]
- Heinze, T.; Haack, V.; Rensing, S. Starch Derivatives of High Degree of Functionalization. 7. Preparation of Cationic 2-Hydroxypropyltrimethylammonium Chloride Starches. Starch-Starke 2004, 56, 288–296. [Google Scholar] [CrossRef]
- Krentz, D.-O.; Lohmann, C.; Schwarz, S.; Bratskaya, S.; Liebert, T.; Laube, J.; Heinze, T.; Kulicke, W.-M. Properties and Flocculation Efficiency of Highly Cationized Starch Derivatives. Starch-Starke 2006, 58, 161–169. [Google Scholar] [CrossRef]
- Putseys, J.A.; Derde, L.J.; Lamberts, L.; Östman, E.; Björck, I.M.; Delcour, J.A. Functionality of Short Chain Amylose−Lipid Complexes in Starch−Water Systems and Their Impact on in Vitro Starch Degradation. J. Agric. Food Chem. 2010, 58, 1939–1945. [Google Scholar] [CrossRef]
- Liu, G.; Hong, Y.; Gu, Z.; Li, Z.; Cheng, L.; Li, C. Preparation and characterization of pullulanase debranched starches and their properties for drug con-trolled-release. RSC Adv. 2015, 5, 97066–97075. [Google Scholar] [CrossRef]
- Ji, N.; Hong, Y.; Gu, Z.; Cheng, L.; Li, Z.; Li, C. Binary and Tertiary Complex Based on Short-Chain Glucan and Proanthocyanidins for Oral Insulin Delivery. J. Agric. Food Chem. 2017, 65, 8866–8874. [Google Scholar] [CrossRef]
- Li, X.; Ji, N.; Li, M.; Zhang, S.; Xiong, L.; Sun, Q. Morphology and Structural Properties of Novel Short Linear Glucan/Protein Hybrid Nanoparticles and Their Influence on the Rheological Properties of Starch Gel. J. Agric. Food Chem. 2017, 65, 7955–7965. [Google Scholar] [CrossRef]
- Tang, H.; Liu, X.; Li, Y.; Dong, S. Acetylated debranched rice starch: Structure, characterization, and functional properties. Int. J. Food Prop. 2017, 20, 1–9. [Google Scholar] [CrossRef]
- Chang, R.; Xiong, L.; Li, M.; Chen, H.; Xiao, J.; Wang, S.; Qiu, L.; Bian, X.; Sun, C.; Sun, Q. Preparation of octenyl succinic anhydride-modified debranched starch vesicles for loading of hydrophilic functional ingredients. Food Hydrocoll. 2019, 94, 546–552. [Google Scholar] [CrossRef]
- Zhang, B.; Bai, B.; Pan, Y.; Li, X.-M.; Cheng, J.-S.; Chen, H.-Q. Effects of pectin with different molecular weight on gelatinization behavior, textural properties, retrogradation and in vitro digestibility of corn starch. Food Chem. 2018, 264, 58–63. [Google Scholar] [CrossRef]
- Wang, T.; Hu, Q.; Zhou, M.; Xia, Y.; Nieh, M.-P.; Luo, Y. Development of “all natural” layer-by-layer redispersible solid lipid nanoparticles by nano spray drying technology. Eur. J. Pharm. Biopharm. 2016, 107, 273–285. [Google Scholar] [CrossRef]
- Qin, Y.; Xue, L.; Hu, Y.; Qiu, C.; Jin, Z.; Xu, X.; Wang, J. Green fabrication and characterization of debranched starch nanoparticles via ultrasonication combined with recrystallization. Ultrason. Sonochem. 2020, 66, 105074. [Google Scholar] [CrossRef]
- Gao, W.; Sha, B.; Zou, W.; Liang, X.; Meng, X.; Xu, H.; Tang, J.; Wu, D.; Xu, L.; Zhang, H. Cationic amylose-encapsulated bovine hemoglobin as a nanosized oxygen carrier. Biomaterials 2011, 32, 9425–9433. [Google Scholar] [CrossRef]
- Berardi, A.; Evans, D.J.; Bombelli, F.B.; Lomonossoff, G.P. Stability of plant virus-based nanocarriers in gastrointestinal fluids. Nanoscale 2018, 10, 1667–1679. [Google Scholar] [CrossRef] [Green Version]
- Xu, H.; Fang, Z.; Tian, W.; Wang, Y.; Ye, Q.; Zhang, L.; Cai, J. Green Fabrication of Amphiphilic Quaternized beta-Chitin Derivatives with Excellent Biocompatibility and Antibacterial Activities for Wound Healing. Adv. Mater. 2018, 30, 528–539. [Google Scholar] [CrossRef]
- Shi, A.-M.; Wang, L.-J.; Li, D.; Adhikari, B. The effect of annealing and cryoprotectants on the properties of vacuum-freeze dried starch nanoparticles. Carbohydr. Polym. 2012, 88, 1334–1341. [Google Scholar] [CrossRef]
- Wang, Y.; Xie, W. Synthesis of cationic starch with a high degree of substitution in an ionic liquid. Carbohydr. Polym. 2010, 80, 1172–1177. [Google Scholar] [CrossRef]
- Wang, P.-x.; Wu, X.l.; Dong-hua, X.; Kun, X. Preparation and characterization of cationic corn starch with a high degree of substitution in dioxane-THF-water media. Carbohydr. Res. 2009, 344, 851–855. [Google Scholar]
- Zhang, W.; Gu, X.; Liu, X.; Wang, Z. Fabrication of Pickering emulsion based on particles combining pectin and zein: Effects of pectin methylation. Carbohydr. Polym. 2021, 256, 117515. [Google Scholar] [CrossRef] [PubMed]
- Chen, Y.; Xue, J.; Wusigale; Wang, T.; Hu, Q.; Luo, Y. Carboxymethylation of phytoglycogen and its interactions with caseinate for the preparation of nanocomplex. Food Hydrocoll. 2020, 100, 105390. [Google Scholar] [CrossRef]
- Zhou, M.; Hu, Q.; Wang, T.; Xue, J.; Luo, Y. Effects of different polysaccharides on the formation of egg yolk LDL complex nanogels for nutrient delivery. Carbohydr. Polym. 2016, 153, 336–344. [Google Scholar] [CrossRef] [Green Version]
- Guo, Q.; Su, J.; Shu, X.; Yuan, F.; Mao, L.; Liu, J.; Gao, Y. Production and characterization of pea protein isolate-pectin complexes for delivery of curcumin: Effect of esterified degree of pectin. Food Hydrocoll. 2020, 105, 105777. [Google Scholar] [CrossRef]
- Pan, K.; Zhong, Q. Low energy, organic solvent-free co-assembly of zein and caseinate to prepare stable dispersions. Food Hydrocoll. 2016, 52, 600–606. [Google Scholar] [CrossRef]
- Jiang, Y.; Du, J.; Zhang, L.; Li, W. Properties of pectin extracted from fermented and steeped hawthorn wine pomace: A comparison. Carbohydr. Polym. 2018, 197, 174–182. [Google Scholar] [CrossRef]
- Wang, D.; Mao, L.; Dai, L.; Yan, F.; Gao, Y. Characterization of chitosan-ferulic acid conjugates and their application in the design of beta-carotene bilayer emulsions with propylene glycol alginate. Food Hydrocoll. 2018, 80, 281–291. [Google Scholar] [CrossRef]
- Liu, J.; Lu, J.-F.; Kan, J.; Jin, C.-H. Synthesis of chitosan-gallic acid conjugate: Structure characterization and in vitro anti-diabetic potential. Int. J. Biol. Macromol. 2013, 62, 321–329. [Google Scholar] [CrossRef]
- Jiang, Y.; Xu, Y.; Li, F.; Li, D.; Huang, Q. Pectin extracted from persimmon peel: A physicochemical characterization and emulsifying properties evalu-ation. Food Hydrocoll. 2020, 101, 105561. [Google Scholar] [CrossRef]
- Ji, N.; Hong, Y.; Gu, Z.; Cheng, L.; Li, Z.; Li, C. Preparation and Characterization of Insulin-Loaded Zein/Carboxymethylated Short-Chain Amylose Complex Nanoparticles. J. Agric. Food Chem. 2018, 66, 9335–9343. [Google Scholar] [CrossRef]
- Hu, Y.; Qin, Y.; Qiu, C.; Xu, X.; Jin, X.; Wang, J. Ultrasound-assisted self-assembly of beta-cyclodextrin/debranched starch nanoparticles as promising carriers of tangeretin. Food Hydrocoll. 2020, 108, 106021. [Google Scholar] [CrossRef]
- Chang, C.; Wang, T.; Hu, Q.; Zhou, M.; Xue, J.; Luo, Y. Pectin coating improves physicochemical properties of caseinate/zein nanoparticles as oral delivery vehicles for curcumin. Food Hydrocoll. 2017, 70, 143–151. [Google Scholar] [CrossRef]
- Bai, Y.; Wu, P.; Wang, K.; Li, C.; Li, E.; Gilbert, R.G. Effects of pectin on molecular structural changes in starch during digestion. Food Hydrocoll. 2017, 69, 10–18. [Google Scholar] [CrossRef] [Green Version]
- Lin, Q.; Liang, R.; Zhong, F.; Ye, A.; Singh, H. Physical properties and biological fate of OSA-modified-starch-stabilized emulsions containing beta-carotene: Effect of calcium and pH. Food Hydrocoll. 2018, 77, 549–556. [Google Scholar] [CrossRef]
- Wang, C.; Chen, X.; Liu, S. Encapsulation of tangeretin into debranched-starch inclusion complexes: Structure, properties and stability. Food Hydrocoll. 2020, 100, 105409. [Google Scholar] [CrossRef]
- Niu, Z.; Loveday, S.; Barbe, V.; Thielen, I.; He, Y.; Singh, H. Protection of native lactoferrin under gastric conditions through complexation with pectin and chitosan. Food Hydrocoll. 2019, 93, 120–130. [Google Scholar] [CrossRef]


| Sample | DS | Zeta Potential |
|---|---|---|
| SLG | 0 | −12.13 ± 0.16 |
| CSLG-1 | 0.36 ± 0.03 | 22.18 ± 1.48 |
| CSLG-2 | 0.58 ± 0.01 | 30.54 ± 1.08 |
| CSLG-3 | 0.94 ± 0.04 | 34.52 ± 1.38 |
| Sample | Particle Size | PDI | Zeta Potential |
|---|---|---|---|
| LMP-CSLG | |||
| LMP-CSLG 0.5 | 488.8 ± 6.61 a | 0.203 ± 0.01 a | −37.28 ± 1.64 a |
| LMP-CSLG 1.0 | 500.9 ± 5.16 a | 0.253 ± 0.01 b | −22.58 ± 2.36 b |
| LMP-CSLG 2.5 | 553.5 ± 6.55 b | 0.286 ± 0.02 b | −22.52 ± 0.68 b |
| LMP-CSLG 5.0 | 629.2 ± 11.55 c | 0.300 ± 0.01 c | −14.53 ± 0.85 c |
| HMP-CSLG | |||
| HMP-CSLG 0.5 | 524.0 ± 10.85 a | 0.253 ± 0.02 a | −23.28 ± 1.46 a |
| HMP-CSLG 1.0 | 539.2 ± 14.29 a | 0.276 ± 0.01 a | −22.21 ± 1.03 a |
| HMP-CSLG 2.5 | 621.3 ± 20.85 b | 0.326 ± 0.01 b | −16.91 ± 1.03 b |
| HMP-CSLG 5.0 | 656.2 ± 13.81 c | 0.386 ± 0.02 c | −14.5 ± 0.84 c |
Publisher’s Note: MDPI stays neutral with regard to jurisdictional claims in published maps and institutional affiliations. |
© 2021 by the authors. Licensee MDPI, Basel, Switzerland. This article is an open access article distributed under the terms and conditions of the Creative Commons Attribution (CC BY) license (https://creativecommons.org/licenses/by/4.0/).
Share and Cite
Li, W.; Yu, Y.; Peng, J.; Dai, Z.; Wu, J.; Wang, Z.; Chen, H. Characterization of Cationic Modified Short Linear Glucan and Fabrication of Complex Nanoparticles with Low and High Methoxy Pectin. Foods 2021, 10, 2509. https://doi.org/10.3390/foods10102509
Li W, Yu Y, Peng J, Dai Z, Wu J, Wang Z, Chen H. Characterization of Cationic Modified Short Linear Glucan and Fabrication of Complex Nanoparticles with Low and High Methoxy Pectin. Foods. 2021; 10(10):2509. https://doi.org/10.3390/foods10102509
Chicago/Turabian StyleLi, Wenhui, Ying Yu, Jielong Peng, Ziyang Dai, Jinhong Wu, Zhengwu Wang, and Huiyun Chen. 2021. "Characterization of Cationic Modified Short Linear Glucan and Fabrication of Complex Nanoparticles with Low and High Methoxy Pectin" Foods 10, no. 10: 2509. https://doi.org/10.3390/foods10102509