
Exploratory Bibliometrics: Using VOSviewer as a Preliminary Research Tool

Social and Behavioral Sciences, Arizona State University, Phoenix, AZ 85069-7100, USA
Publications 2023, 11(1), 10; https://doi.org/10.3390/publications11010010
Submission received: 24 August 2022
/
Revised: 29 October 2022
/
Accepted: 13 February 2023
/
Published: 20 February 2023
(This article belongs to the Special Issue Looking Forwards and Backwards: 10 Years of Publications)
Abstract
:This paper explores ways in which open access bibliometric software can be used to undertake exploratory research and to generate new avenues of inquiry. It takes as its focus VOSviewer, a freely available software package used to construct and display bibliometric relationships between a variety of variables. Beginning with published examples, the paper proceeds to create an original case study using bibliometrics to explore the extent to which the field of remote sensing is contributing to the implementation of sustainable development goals. This example uses Scopus data and VOSviewer to examine and contrast co-occurrence data among publications in six journals, and it demonstrates how such software can be successfully used to undertake preliminary studies and to shape subsequent research which employs more formal approaches.
1. Introduction
This paper has been written as a contribution to a Special Issue of Publications which is designed to address the journal’s past and its potential. Although much of this paper deals with a specific case study of sustainability, it was written more generally as a commentary on some specific trends in scholarly publishing: these comments result in part from doing numerous manuscript reviews during the past decade. During that time, Publications has attracted a type of manuscript which focuses on an emerging subfield and uses bibliometrics to provide a tally of the key papers, prolific researchers and the geographic distribution of authors and collaborators.
This growth in what can be described as ‘literature reviews’ reflects the appearance of several accessible software packages over the past decade, which are designed to be used with data repositories such as Web of Science and Scopus [1]. The smooth integration of this software permits a user with an interest in a scientific subfield to easily create a ‘knowledge map’ which can identify significant publications based on citation counts.
While such manuscripts are certainly relevant to scholarly publishing in the most general way, it is my assertion that they often have little to offer the reader of this and cognate journals. As evidence for this claim, the journal Library Philosophy and Practice announced in 2021 that it would “no longer consider bibliometric, scientometric or literature review articles except in areas of the Library and Information Sciences”. The reason for this was that the journal was being “inundated with bibliometric manuscripts” which were changing its scope [2].
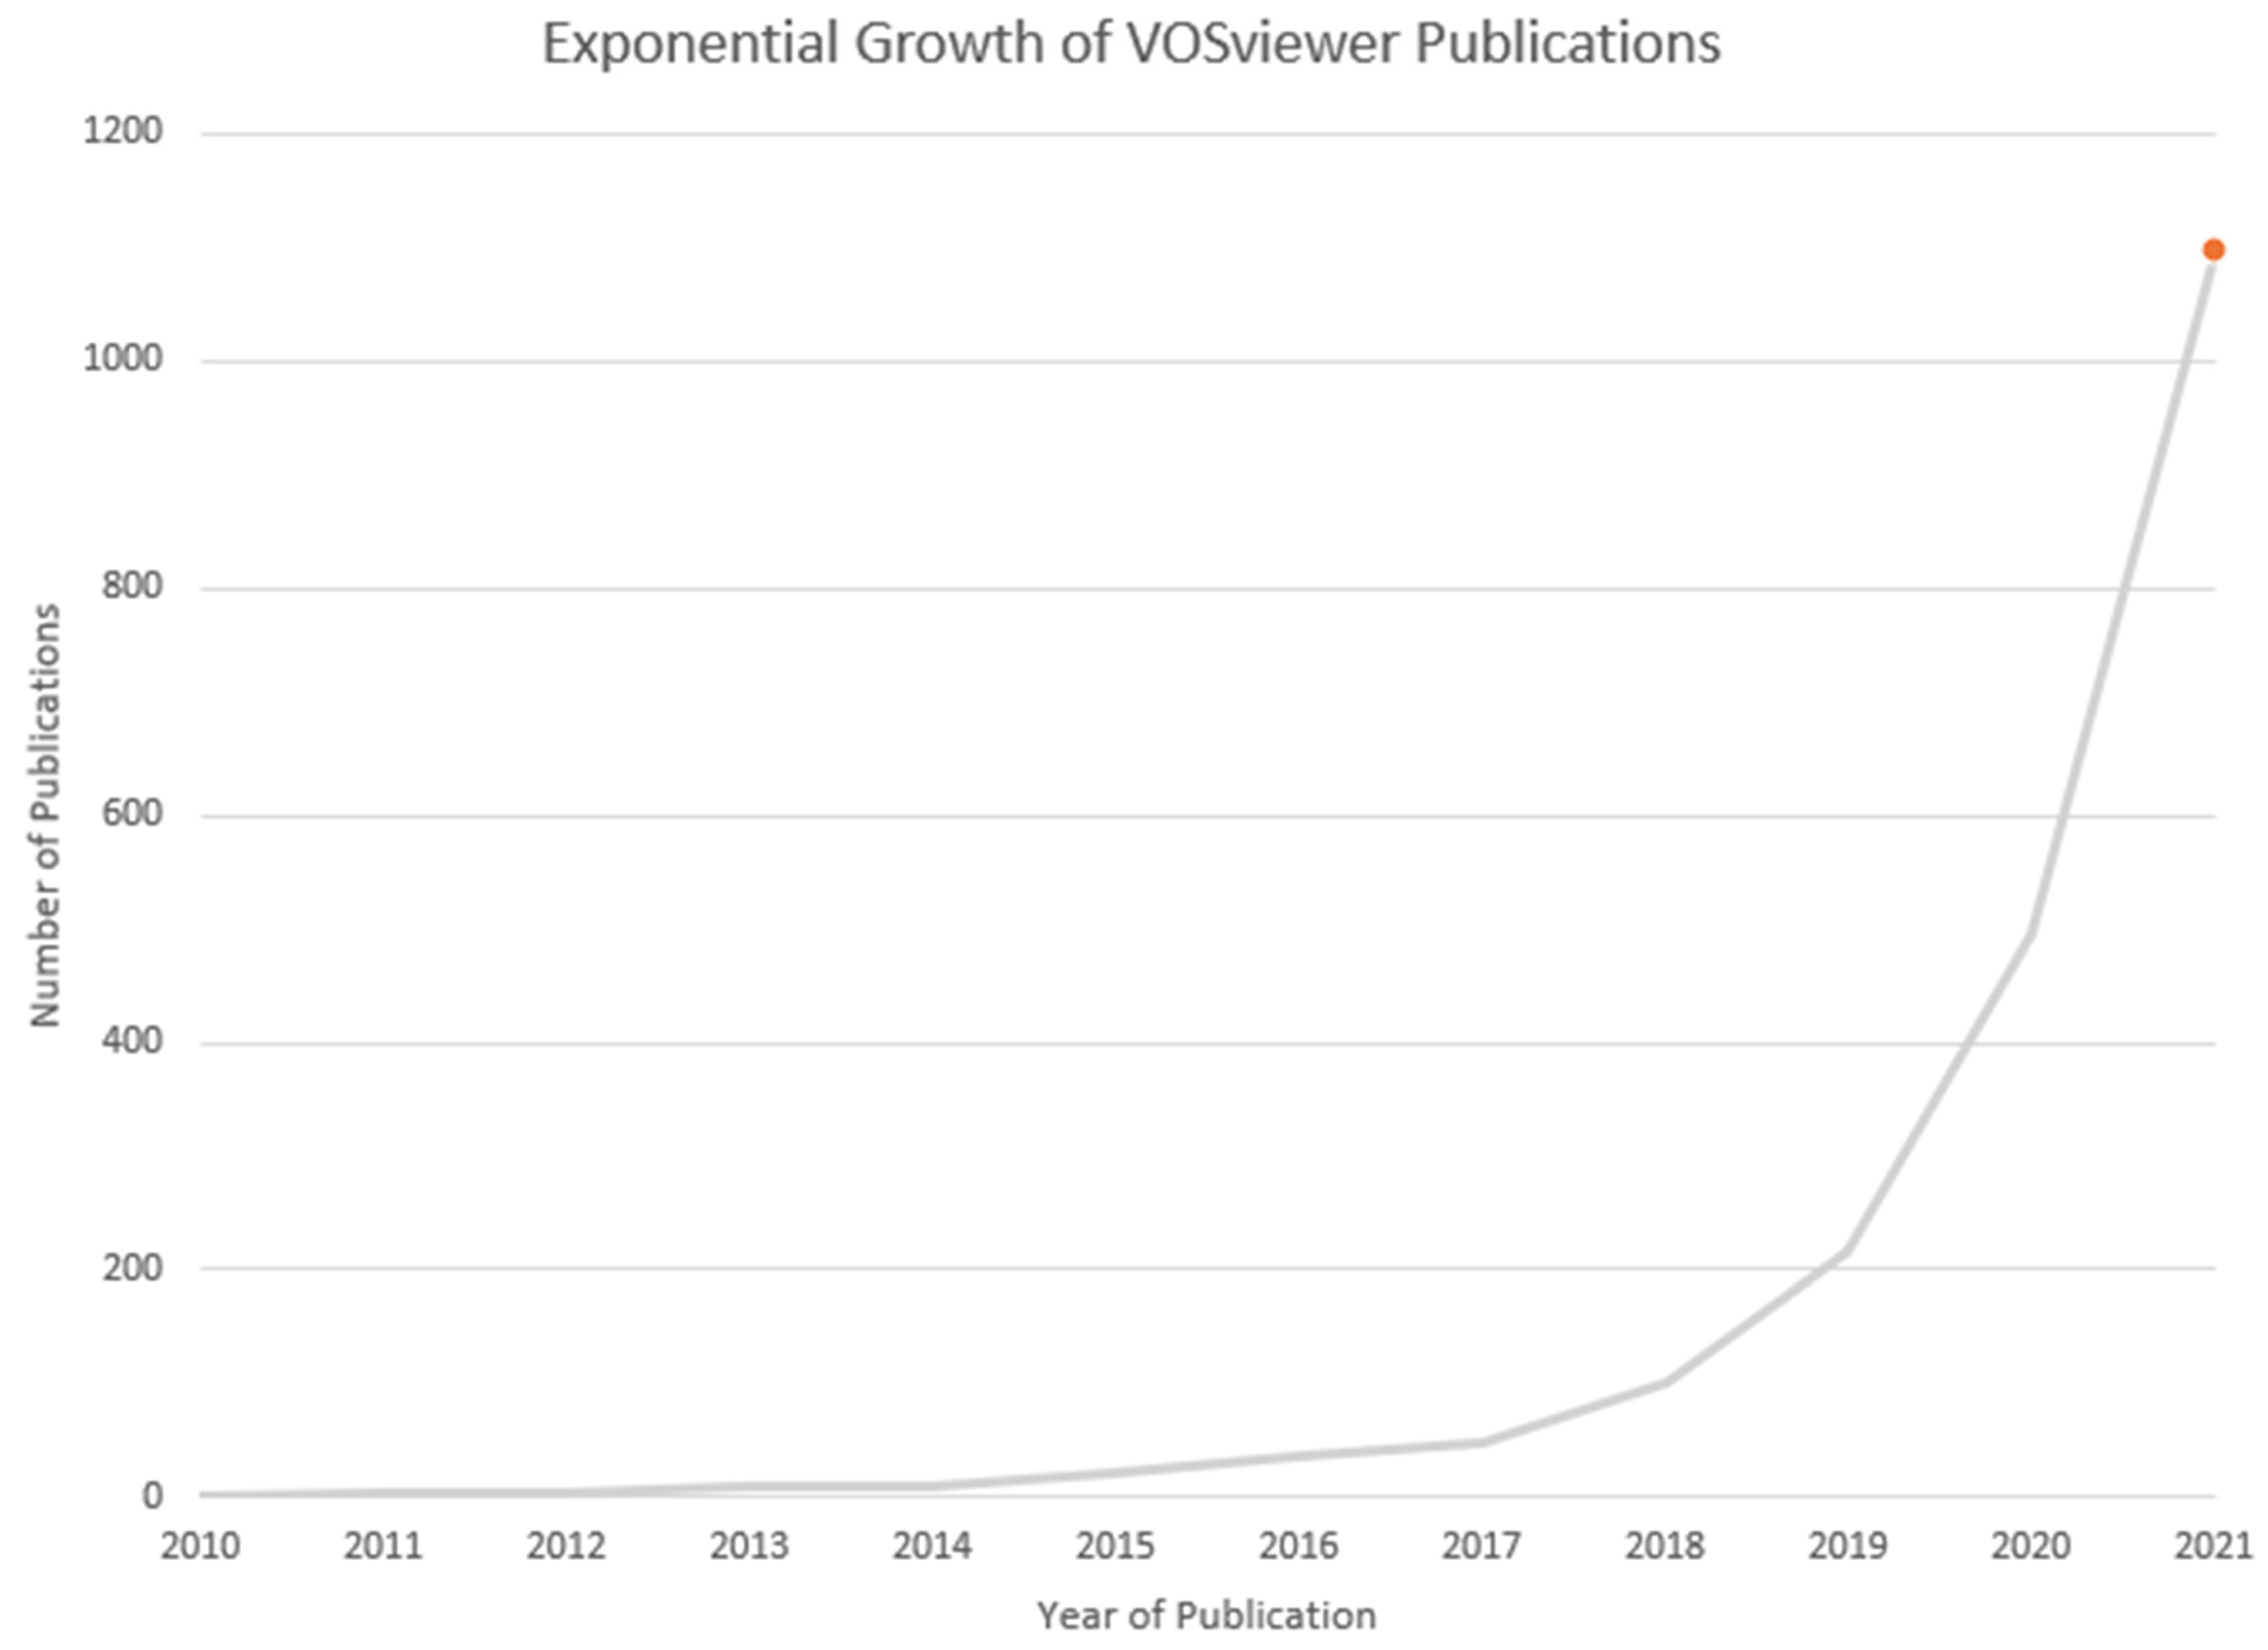
As we will show in the subsequent sections and in the Appendices, there is great potential in software such as VOSviewer. The emergent problem lies in its ease of use and its flexibility, which significantly reduce the opportunity costs for new users. Researchers in a subfield can easily undertake a search of publications and their related citations. The resulting growth of papers using software such as CiteSpace and VOSviewer cannot be minimized. Since the introduction of the latter in 2010, its growth has been literally exponential. Of the 2045 published papers documented in Scopus which have referenced VOSviewer, fully 53% were published just in 2021 (Figure 1).
The drawback for a journal such as this (with a broad focus on scholarly publishing rather than scientometrics) is that the use of a software package encourages a rote presentation of information (key papers, key authors, key countries, key journals, and so on). As a new subfield may well be especially arcane, the scientific content may therefore be of little interest to the general reader [3].
It needs to be emphasized that not every bibliometric submission to this (or related) journals uses simple software. Some are technically complex [4]. This does not, at least in the opinion of this author, increase its relevance to an audience interested in scholarly publication, as distinct from the readership interested in scientometrics, which is served by technical journals. For example, neither of the examples mentioned here has been cited by any other Publications paper, which undermines the significance of what can be classed as ‘within-journal citations’ [3,4,5].
In summary, this paper’s contribution to the Publications Special Issue is to assess the uses of open access bibliometric software. It is suggested that the flood of papers using such programs to describe emerging subfields has the potential to distort the goals of this and cognate journals. However, this is not intended as mere luddism, and the next section discusses the evident potential of VOSviewer (and its peers) in the context of exploratory research.
2. Using Bibliometrics as a Tool
2.1. Introduction
Rapid computational methods and digital information have transformed the researcher’s ability to quickly and cheaply collect data, subject it to different analyses, and display the results. Nonetheless, because unsuccessful research usually remains unpublished research (because of inconclusive results, for instance), there are advantages to being able to undertake rapid exploratory studies. In some practical contexts, these are known as quick-and-dirty methods, which can be followed by more sophisticated protocols if the results are affirmative [6]. In other fields, the researcher can apply tools in unexpected ways, to test ideas or to generate questions. Google Scholar can be used for preliminary tests of word collocations in demonstrations of language use, for example [7]. There is also a fairly extensive body of literature on the use of the open access software Wordle as a precursor to the use of more powerful content analyses [8].
2.2. Testing a Hypothesis Measuring Research Outputs
The first example under discussion here was published in this journal [9]. As the title indicates, the goal of the project was to compare the scientific productivity of Chinese, EU, and US institutes and organizations and to answer the question, “does the future belong to E-Technology companies?” Researchers Carta et al. used data published in the SCImago repository to address the relative performance of public and private organizations working in new technologies. Comparing published output, they conclude that their study “describes a loss of leadership from 2010 to 2020 of European and (partly) American universities, while in China, universities are growing in importance in scientific production, and we are witnessing a growth of direct leadership in the research of private companies” [9] (p. 11).
This study is illustrative both in terms of setting up a specific question and an exploratory methodology. It is also significant in the present context as it indicates how scientific publication can be used as a robust indicator for research activity and performance. As Debackere et al. argue, grant funding, subsequent publication, and scientometric analysis can act as a feedback loop to shape priorities within nations’ science policies [10]. As this can lead in turn to the next rounds of funding and publication, we can see that bibliometrics can itself be a significant component in the work of science.
2.3. Testing a Simple Hypothesis Using Citations as an Analog
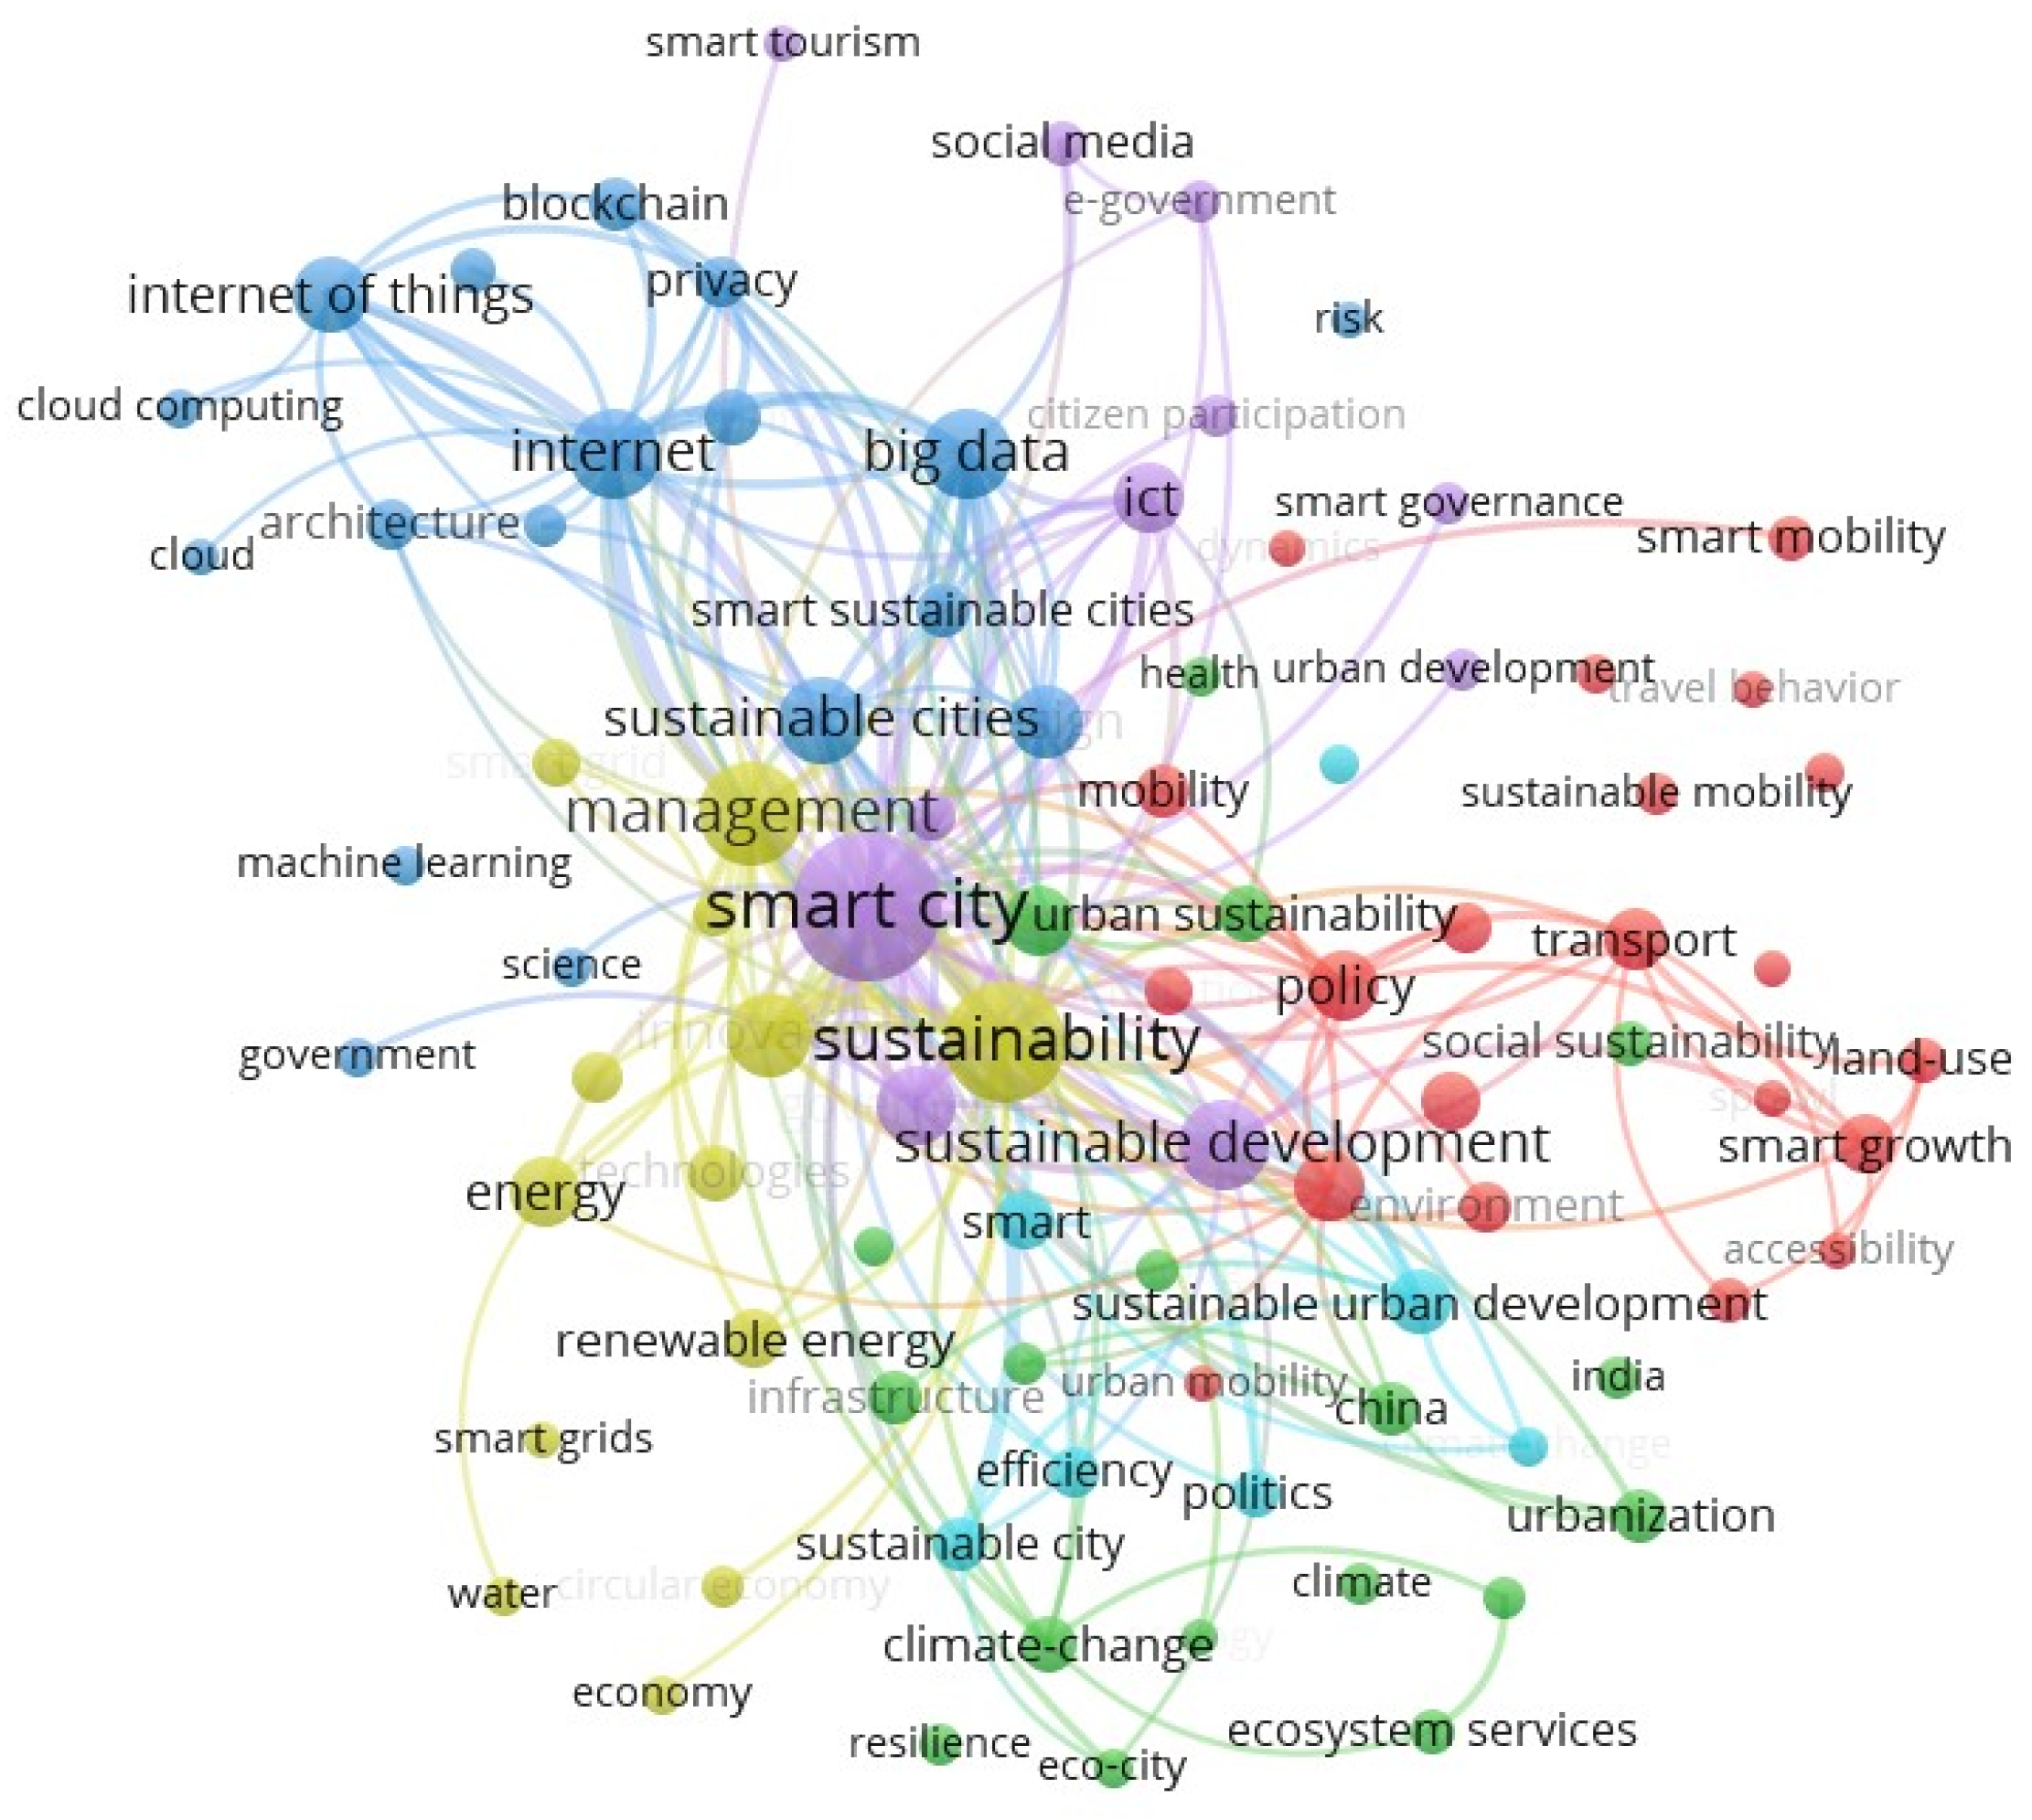
Here, we switch from direct analysis of research output (as in the previous example) to publications and citations which constitute surrogates for actual occurrences, policies, and actors. The example is an assessment of whether ‘smart cities’ are inherently ‘sustainable cities’, which has been claimed, although the literature shows only weak assessments [11]. Here, we can provide some support for a more robust evaluation, using VOSviewer to analyze publications; details of the software, its inputs and outputs and the procedures employed are provided in the Appendix A.1.
In Figure 2, we can see that smart cities exist in a different citation space than sustainable cities (significantly, we can also see a small but discrete category of ‘smart sustainable cities’). This suggests that the pursuit of ‘smart’ policies may not be an automatic guarantee of sustainability. Based on this initial finding, a broader study of the published research, perhaps focused on specific national case studies, appears valid.
These two examples offer contrasting ways to use citation data, one as a measure of research output, and the other using published research as a knowledge map and a surrogate for actually occurring events. The next section shows an exploratory case study in greater detail.
3. An Exploratory Case Study: Remote Sensing and Sustainable Development Goals
3.1. Overview
This case study is focused on the UN Sustainable Development Goals (SDGs), which define a path for nations seeking to contribute to a better planetary future [12]. However, in practice, most of the goals are unlikely to be met by 2030, and it has been argued that this is due in part to data problems facing remote sensing, a key approach to the analysis of sustainability. Sustainability researcher Estoque concludes that while remote sensing “is an important environmental monitoring tool that can help fill gaps in environmental data”, his fear is that “more is being invested in the development of the SDG global indicator framework, including its databases, than is being invested in actual projects that can deliver desirable outcomes and bring about progress” [13].
This case study builds upon and complements Estoque’s argument by undertaking an exploratory bibliometric analysis of the convergence—or divergence—between research on remote sensing and the monitoring of the SDGs. The goal is to assess the extent to which research on SDGs is central to the remote sensing field as a whole, and how that can be evaluated by a comparison of publications in different but complementary journals. The exploratory hypothesis is that the remote sensing field is not focused on the SDGs, with the inference that this lack of research may contribute to weak implementation of SDGs.
The paper consists of the following four parts. In Section 3.2, the methodology for evaluating the remote sensing field as used here is outlined, including the incorporation of the Scopus database, and VOSviewer software. In Section 3.3, research results are presented, including VOSviewer displays of content in the journal Remote Sensing since its creation in 2009, and the emergence of sustainable development as a research subfield. In Section 3.4, these results are interpreted and contrasted with the way remote sensing is studied as a subset of the sustainability field. The conclusions are presented in Section 4.
3.2. Materials and Methods
The field of remote sensing is extremely large. For example, a search on the Scopus database (‘remote’ AND ‘sensing’, for abstracts, titles, and keywords for all years) retrieves over 285,000 entries (the figure was in excess of 19,000 solely for the most recent full year, 2021). This exploratory study therefore reduced the number of publications to be analyzed by focusing solely on the journal Remote Sensing, an indexed journal with an Impact Factor (IF) of 4.84. The high IF suggests that the journal is a frequently cited outlet and can be used as a surrogate for the field in a preliminary study such as this. Since its inception in 2009, 7791 papers have been published, a total which facilitates exploratory analysis of the entire output of the journal. There have also been several bibliometric studies of remote sensing research [14,15,16], as well as more focused analyses of this specific journal’s content [17,18] and these will be referred to in more detail below.
The publications were exported from Scopus as Excel files for each complete year, 2009–2021. Each exported entry includes complete information for each paper, including title, authors, affiliations, keywords, and all citation information. The data were then uploaded into VOSviewer software, the technical details of which are given in the Appendix A.1.
It employs a local moving algorithm which identifies relations within networks of publications, their citations, and keywords. Relationships can be displayed between authors, journal articles, and/or entities such as countries hosting a researcher, between research institutions, or between different scholarly journals. VOSviewer uses inputs from Web of Science, Scopus and PubMed, all of which are highly regarded in the bibliometric field [19]. As indicated in Figure 1, VOSviewer has been employed in literally hundreds of studies, especially in analyses of the morphology of nascent fields [3].
It should be emphasized that VOSviewer is employed in this study because of its simplicity of use, which is consistent with preliminary research which might explore numerous data relationships, some of which will prove inconclusive. As open access software, it is also freely available to scholars with limited resources. However, this does not mean that the software is technically deficient. Indeed, comparative analyses with multi-dimensional scaling techniques suggest that VOSviewer may possess some advantages [20]. Indeed, Eck et al. have suggested that “the VOS approach yields improved results mainly in the case of medium and large datasets”. It is emphasized therefore that “it is one of the best options for performing a science mapping analysis” [1].
3.3. Results
This section first presents the results of the analyses of the publication materials from the journal Remote Sensing (henceforth RS).
3.3.1. Keywords
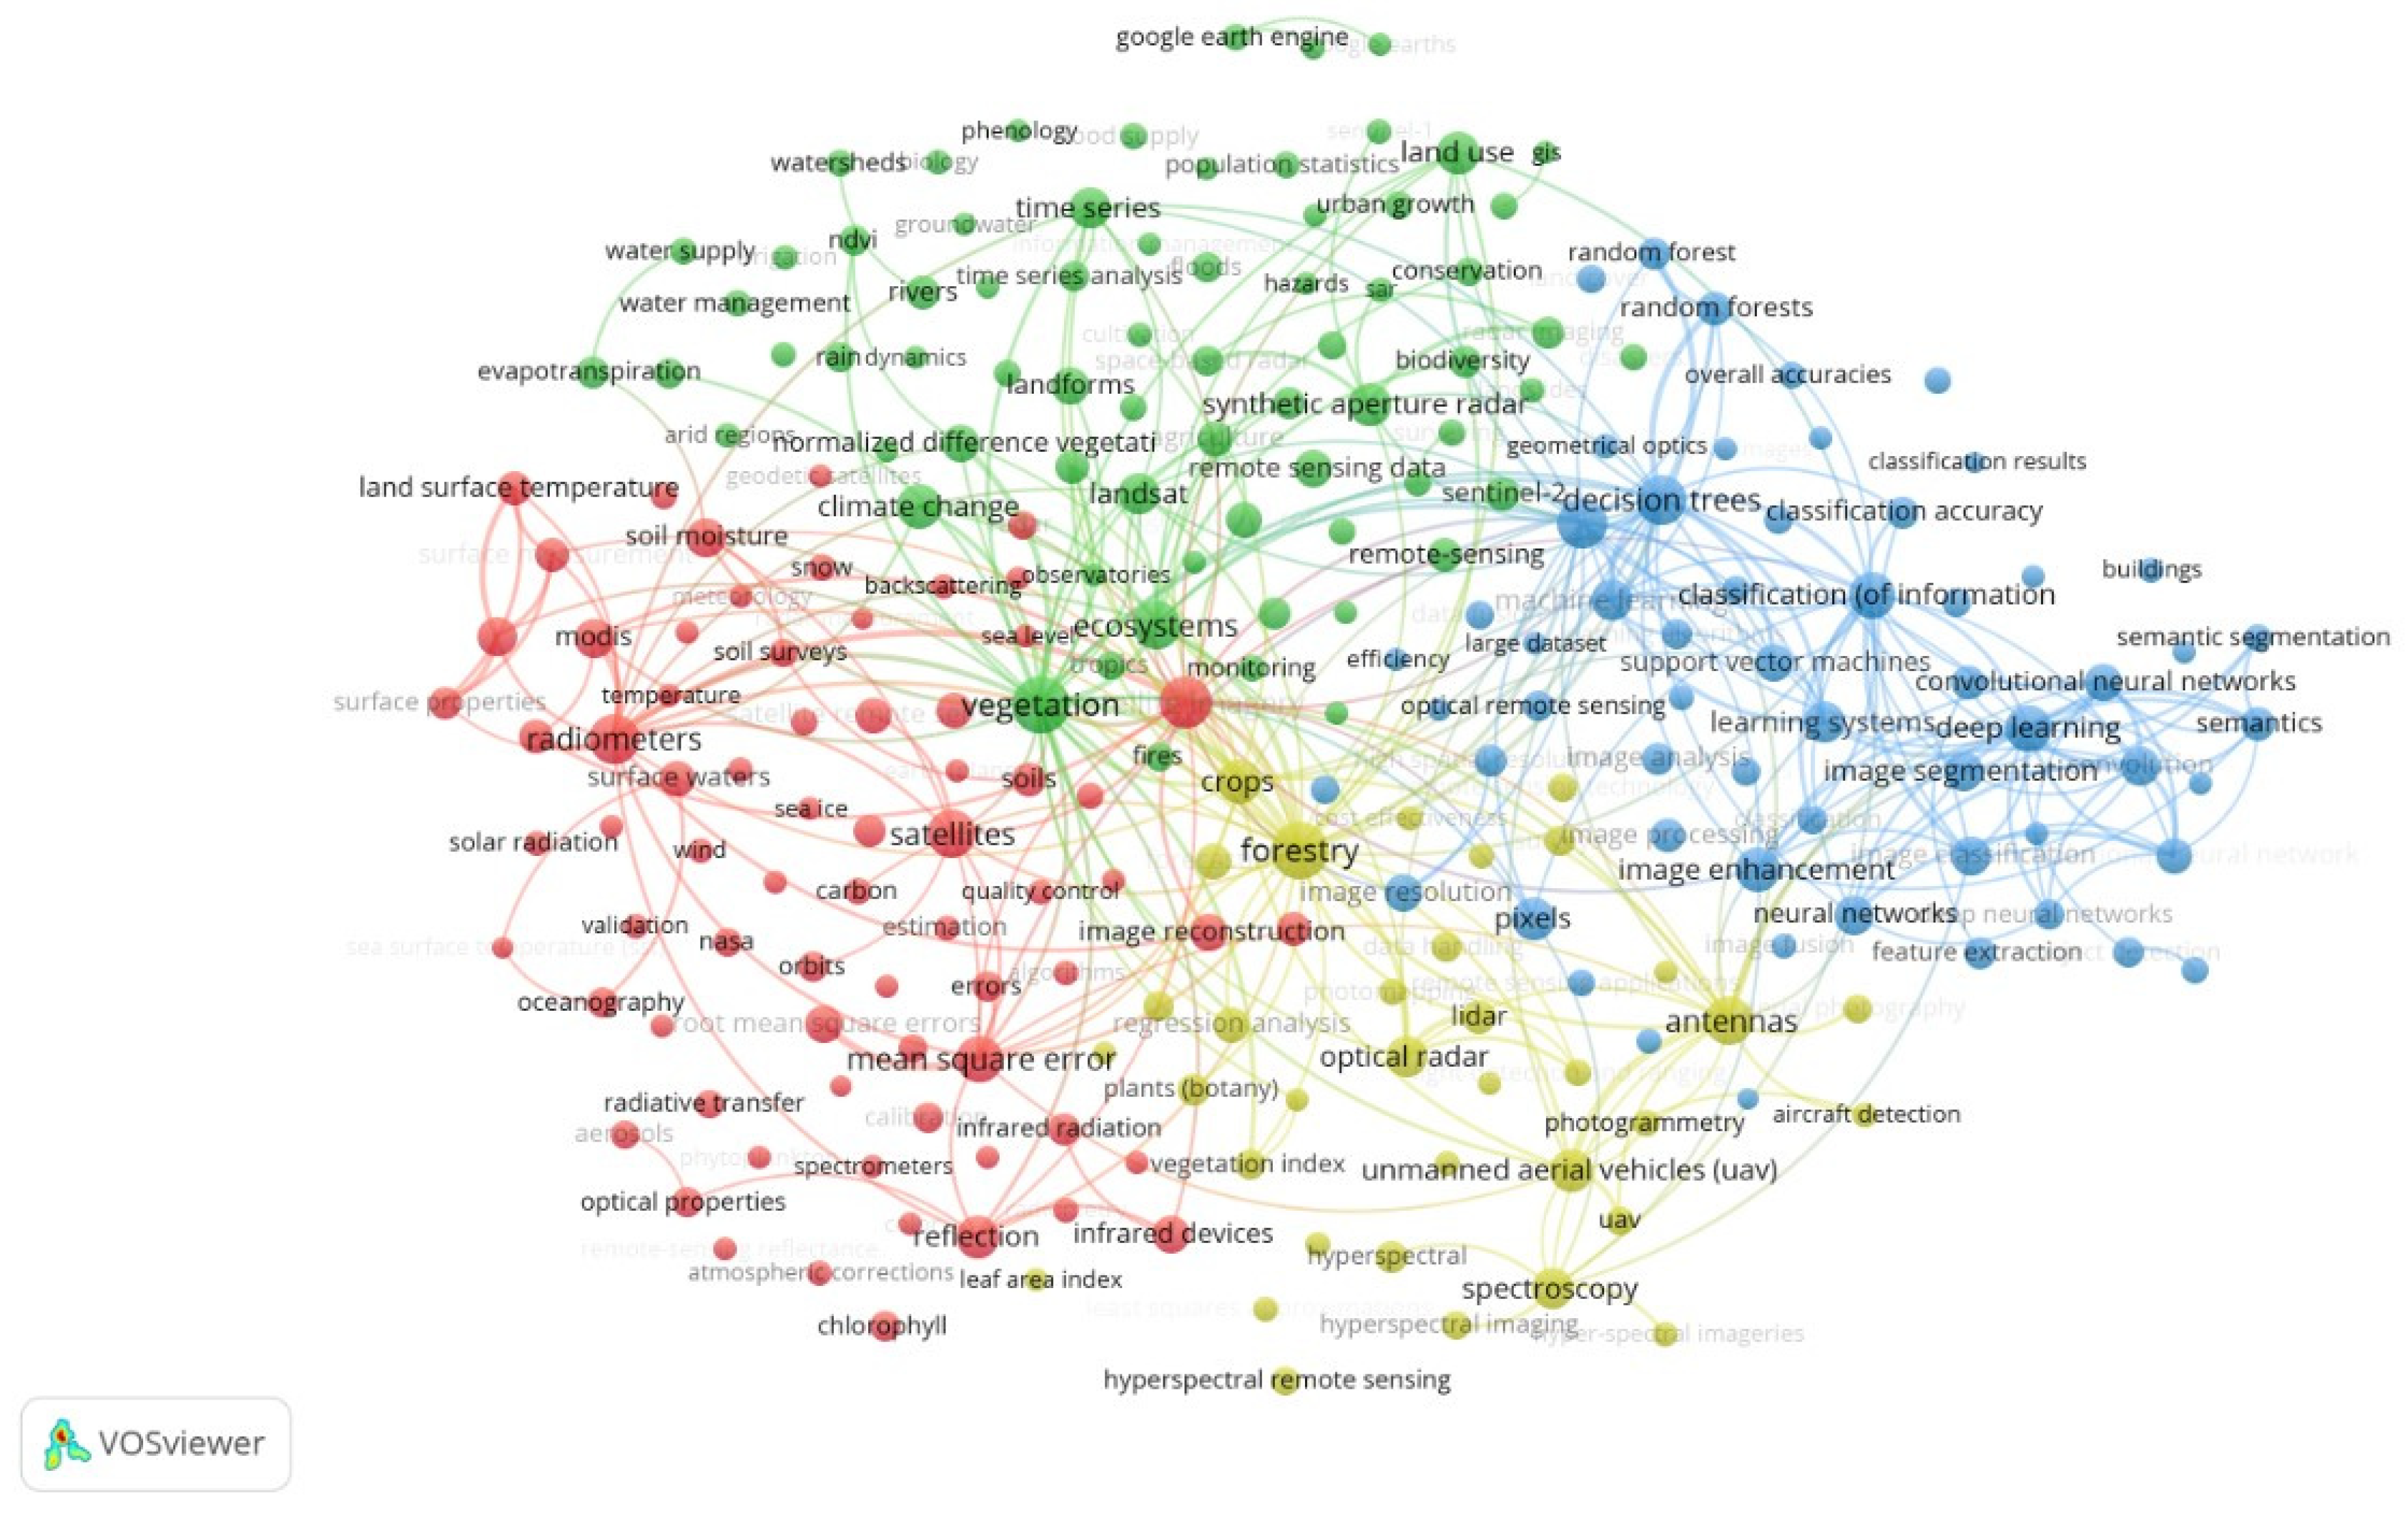
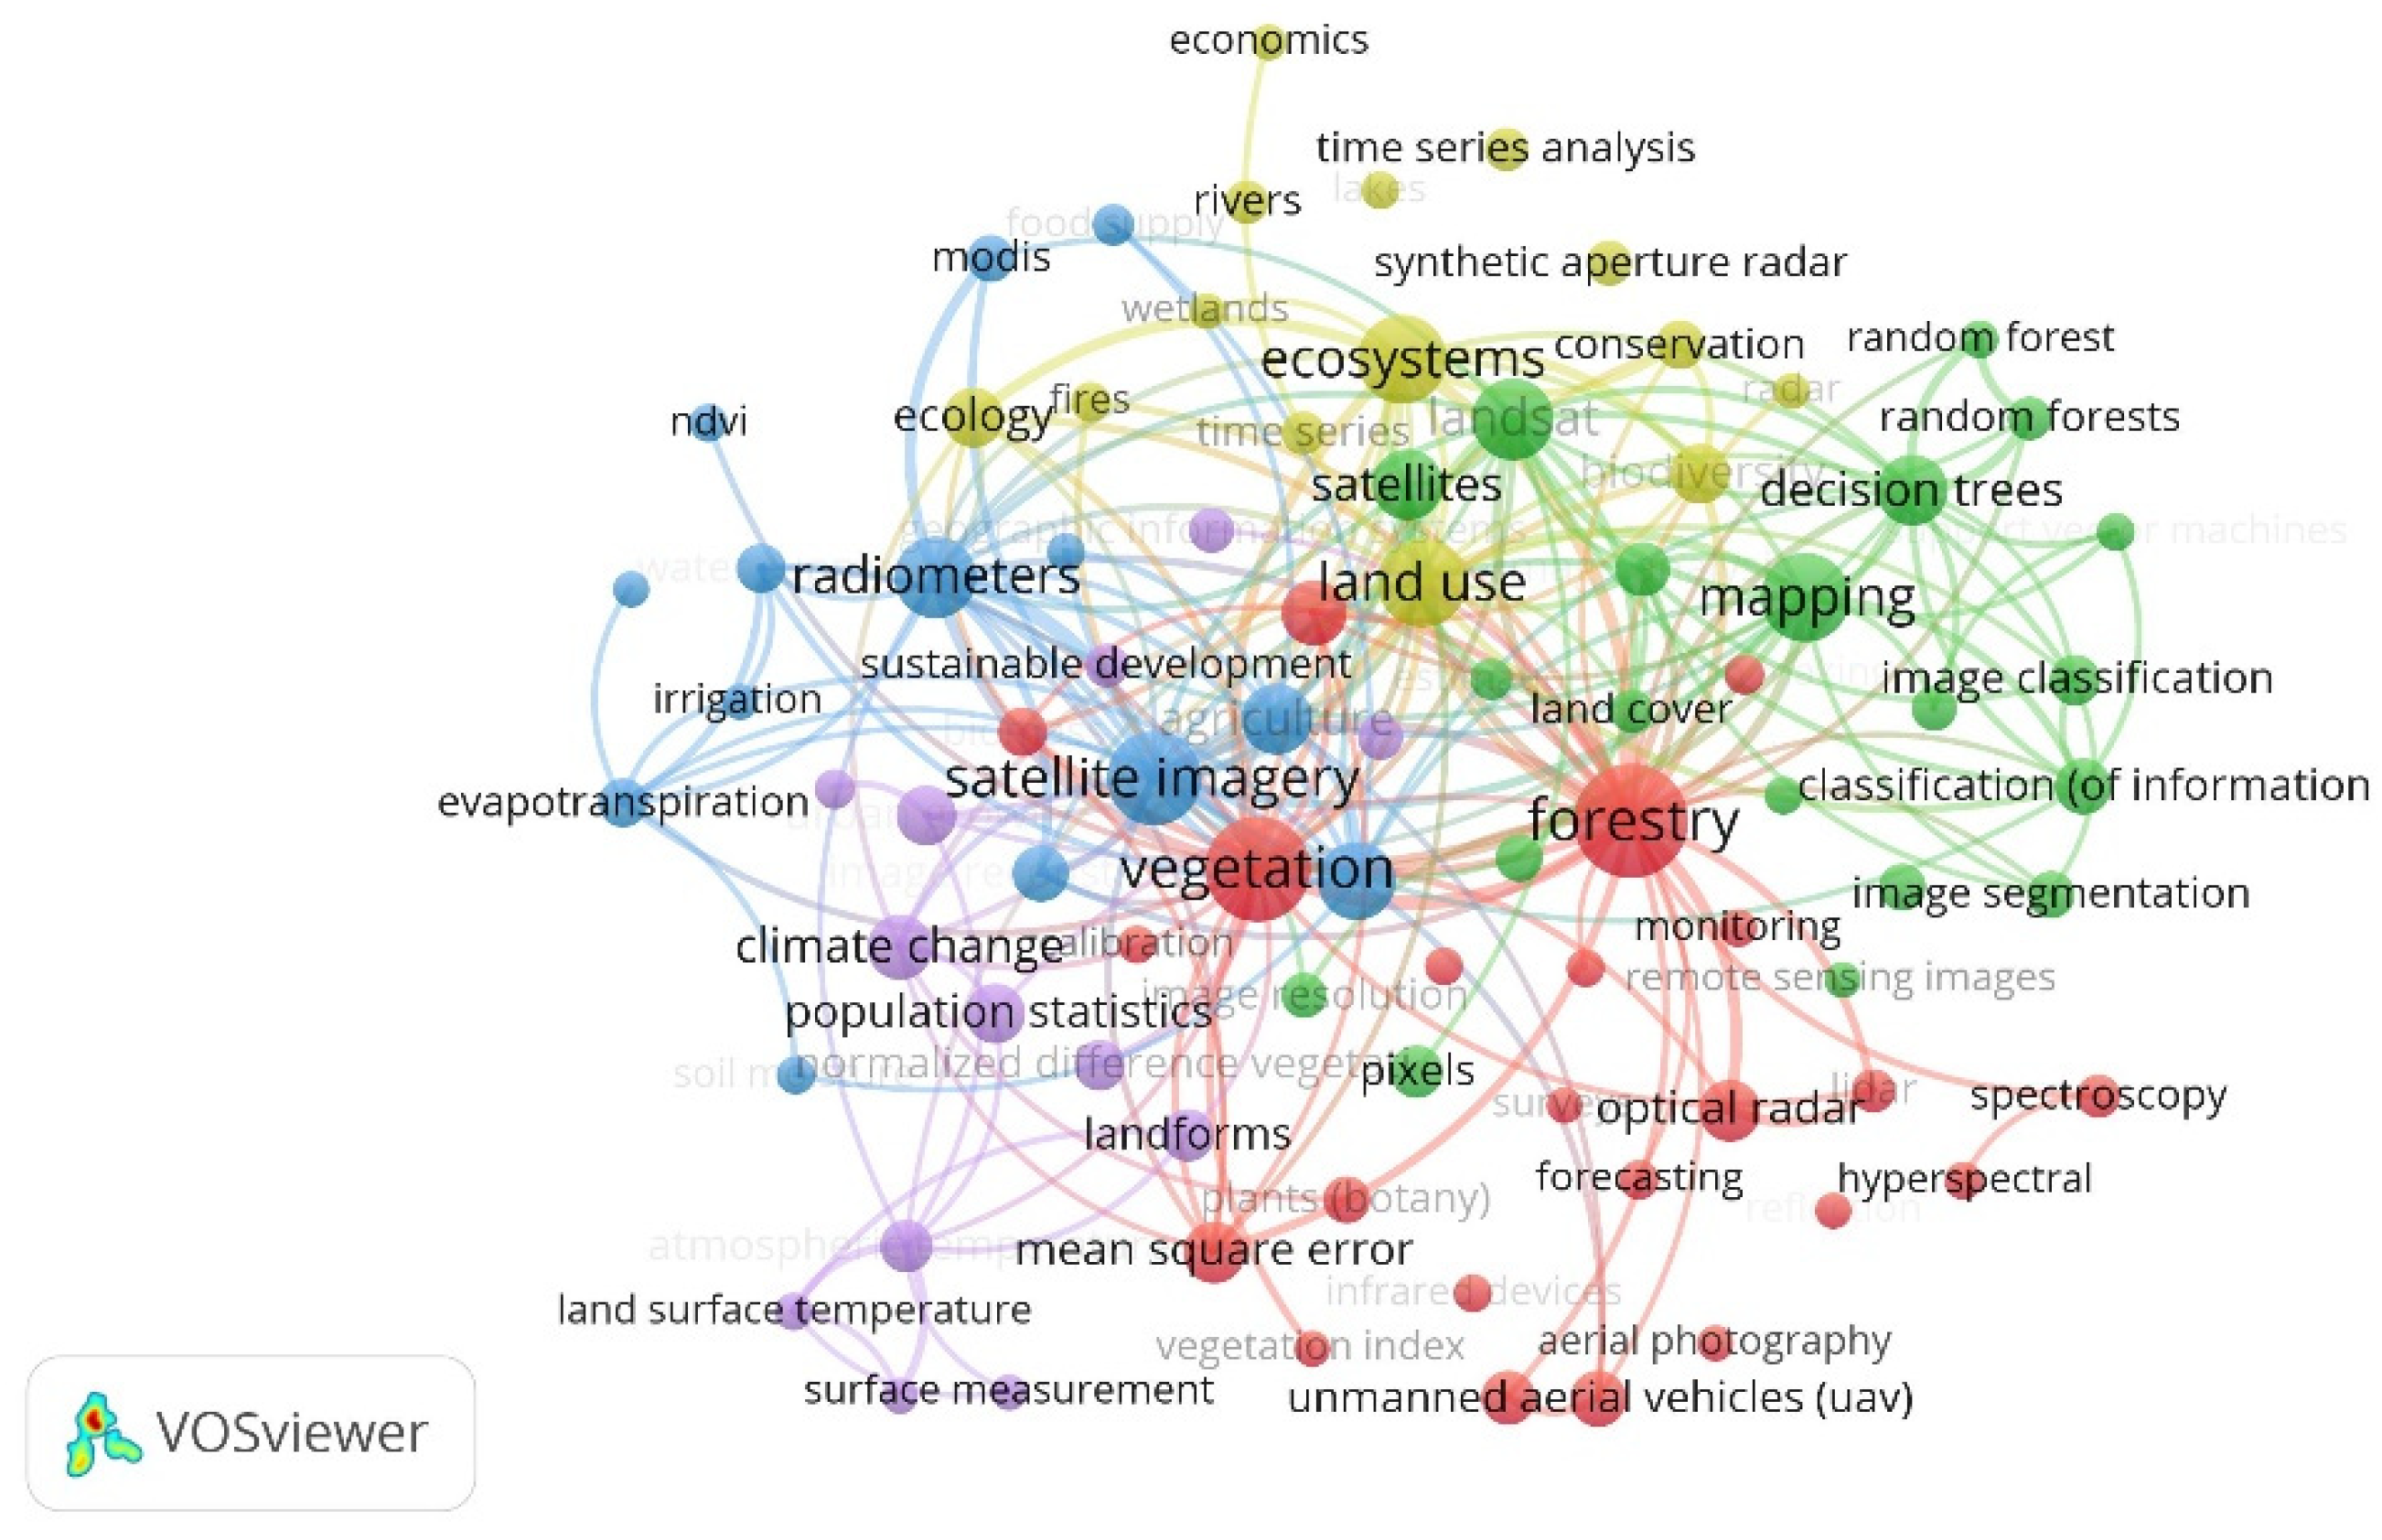
In this section, we can begin by providing a display of the most important terms used in papers published in Remote Sensing between its inception in 2009 and 2021. Figure 3 shows the results of a VOSviewer co-occurrence analysis, which generates links between key terms. On the VOSviewer displays below, lines connect the different terms, and the strength of the links indicates the number of publications in which two terms occur together; thicker lines indicate a stronger link. VOSviewer determines that items are closely related when the software calculates association strengths between items that are similar, where association strength “is a proportion of total co-occurrences between items to the expected total co-occurrences between those items, assuming they are statistically independent” [1]. Technical details are also provided in the Appendix A.1.
Four significant clusters of key terms are created by the VOSviewer algorithm: each of which constitutes a grouping of research activity and subsequent publication. A simplified interpretation and label is suggested by the author for each cluster in Table 1.
This table differs somewhat from the material presented in Zhang et al.’s prior bibliometric study of the same journal (summarized in their Table 10) [18]. They identify five clusters, which they label “Multi-spectral and hyperspectral remote sensing”; “LiDAR scanning and forestry”; “MODIS and LAI data applications”; “Remote sensing applications”; and “Synthetic Aperture Radar”. While some procedures used in that study were somewhat different and do not include papers published 2019–2021, both analyses do emphasize the breadth of the different technical components of the research published within RS.
3.3.2. Sustainability and Sustainable Development
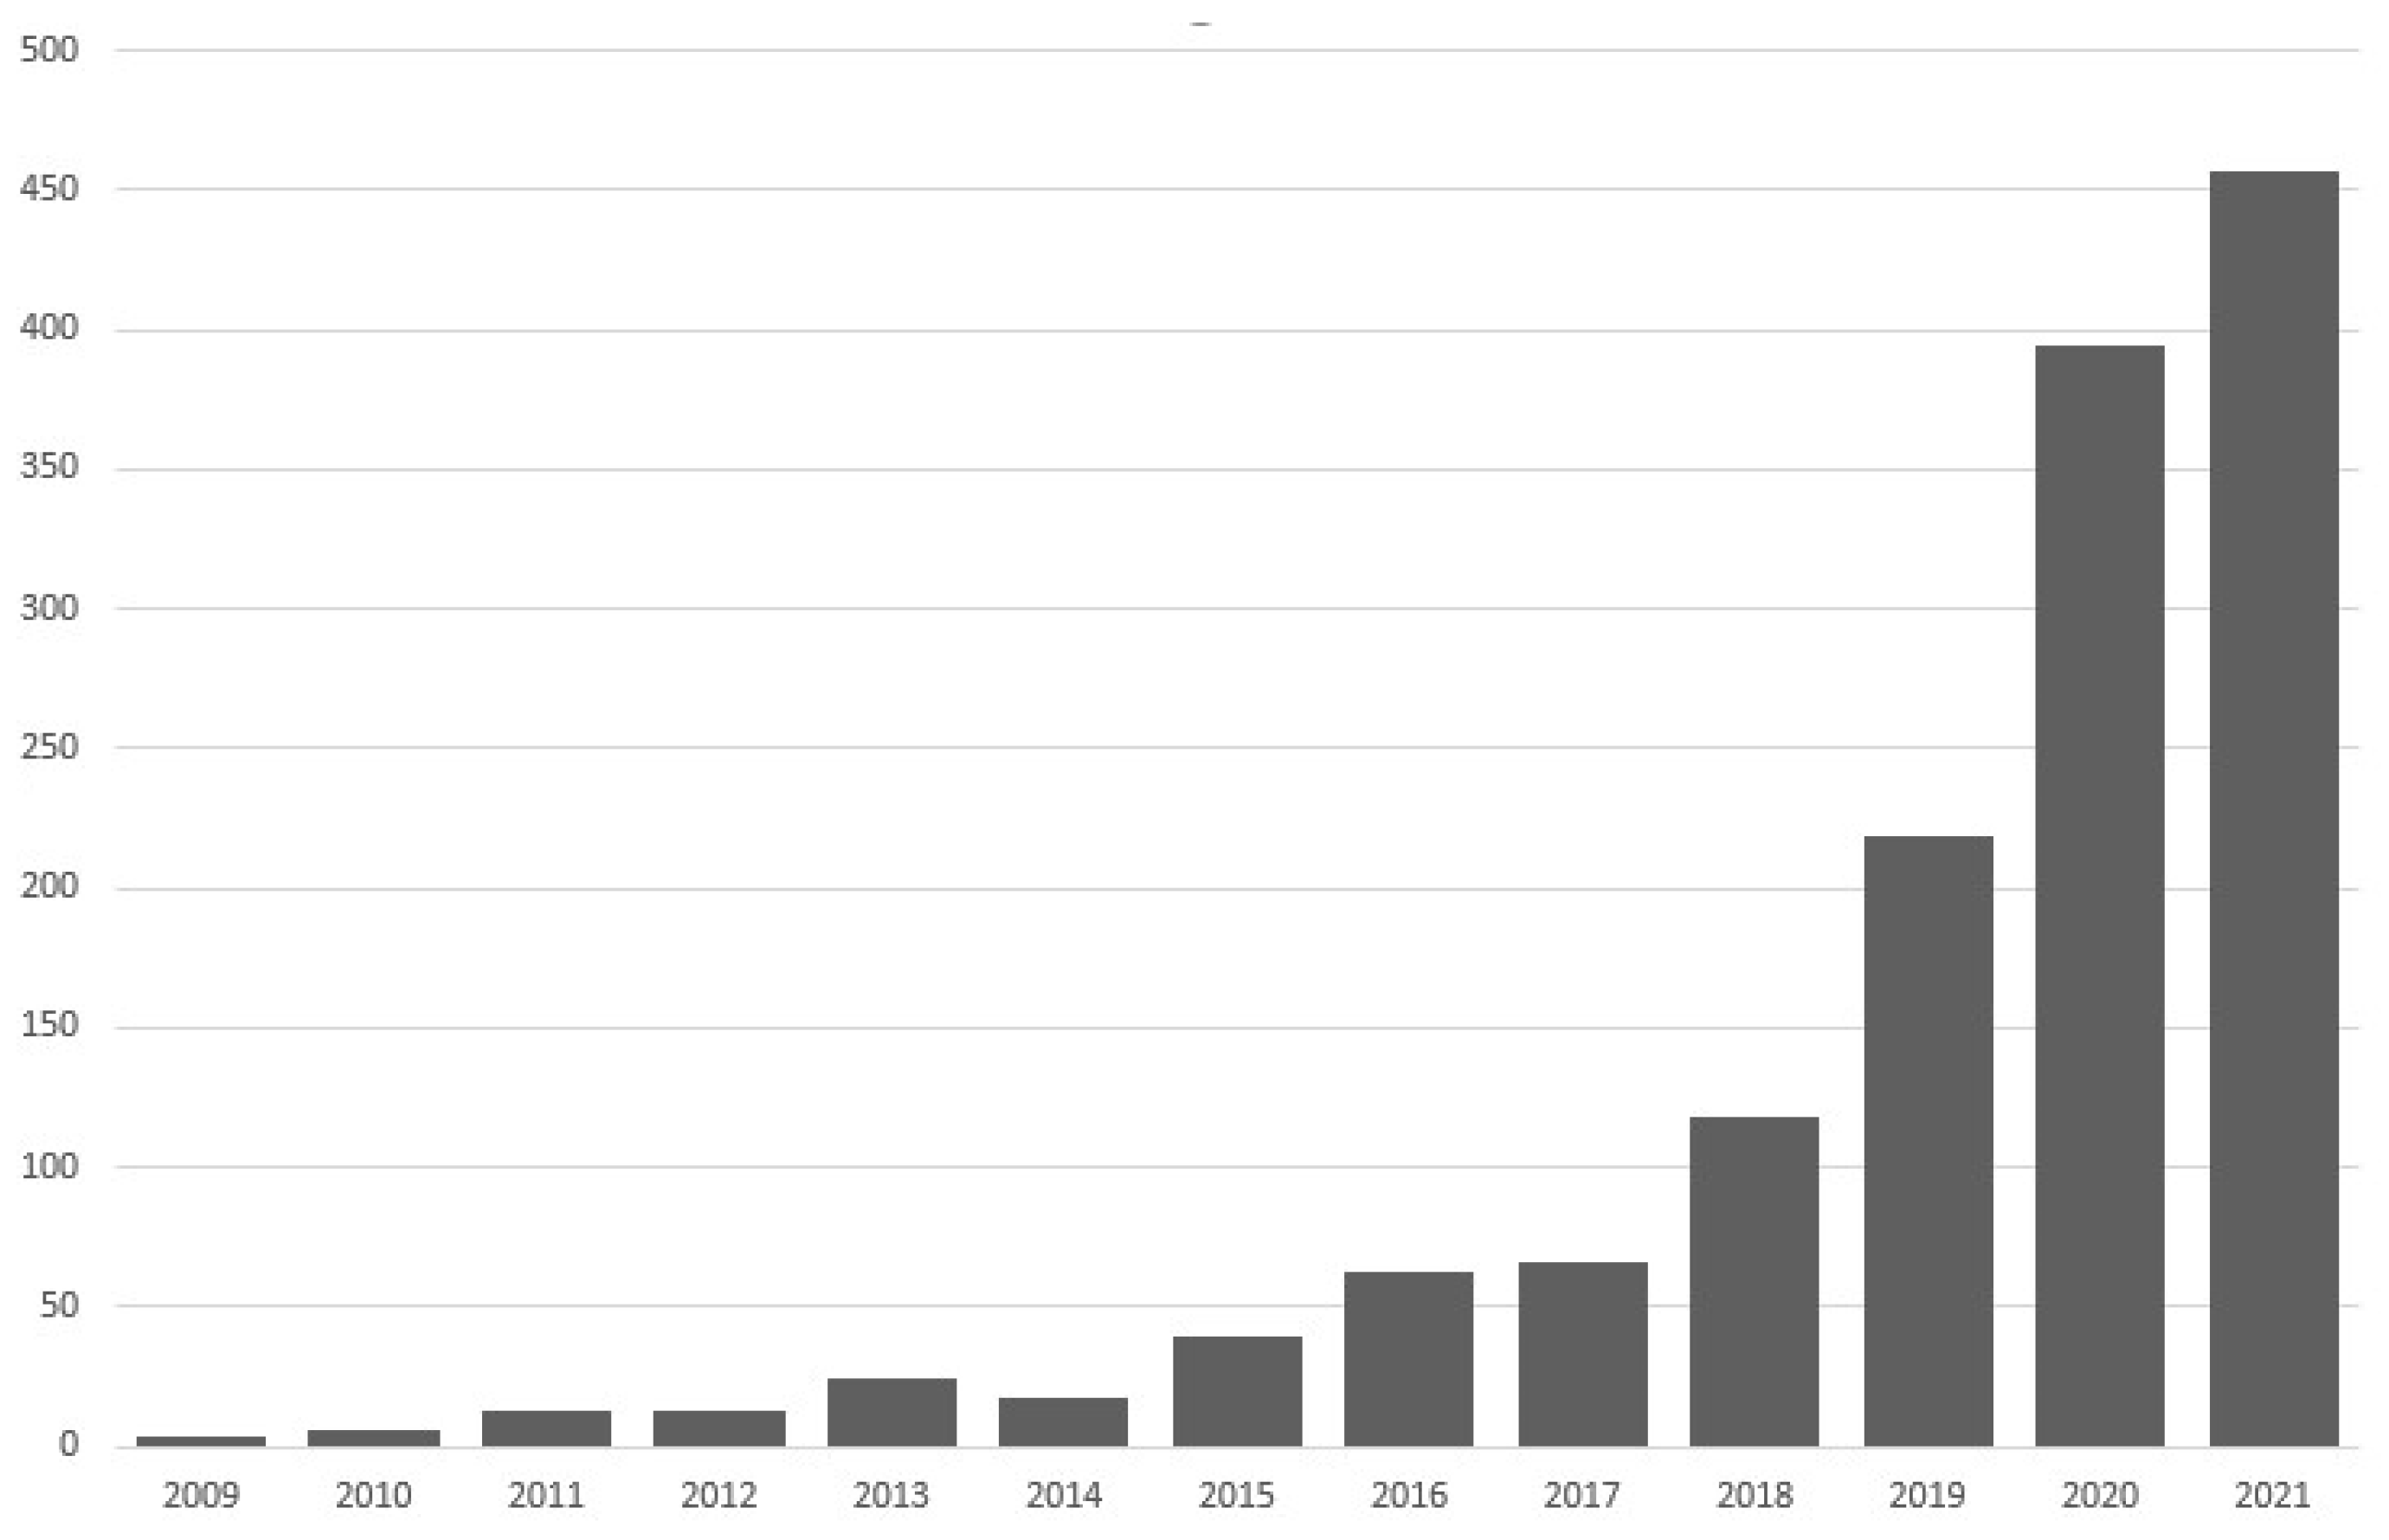
Terms typically associated with sustainability are not prominently display in Figure 3 and Table 1. Subsequent analysis drills down and identifies only RS papers which contain the key terms “sustain” OR “sustainable” (see Appendix A.2). This produces a smaller data set of 1436 publications. These terms are not prominent because they constitute recent arrivals within the journal. As Figure 4 shows, keywords “sustain” or “sustainable” only begin to appear in the journal in 2018 in significant numbers (119 entries), increasing to 219 (in 2019), 394 (in 2020) and 459 (in 2021). While there has been a rising trend in publication in all academic fields in the past decade (as shown for example by Einecker and Kirby), this exponential increase between 2018–2020 far exceeds that background trend [21].
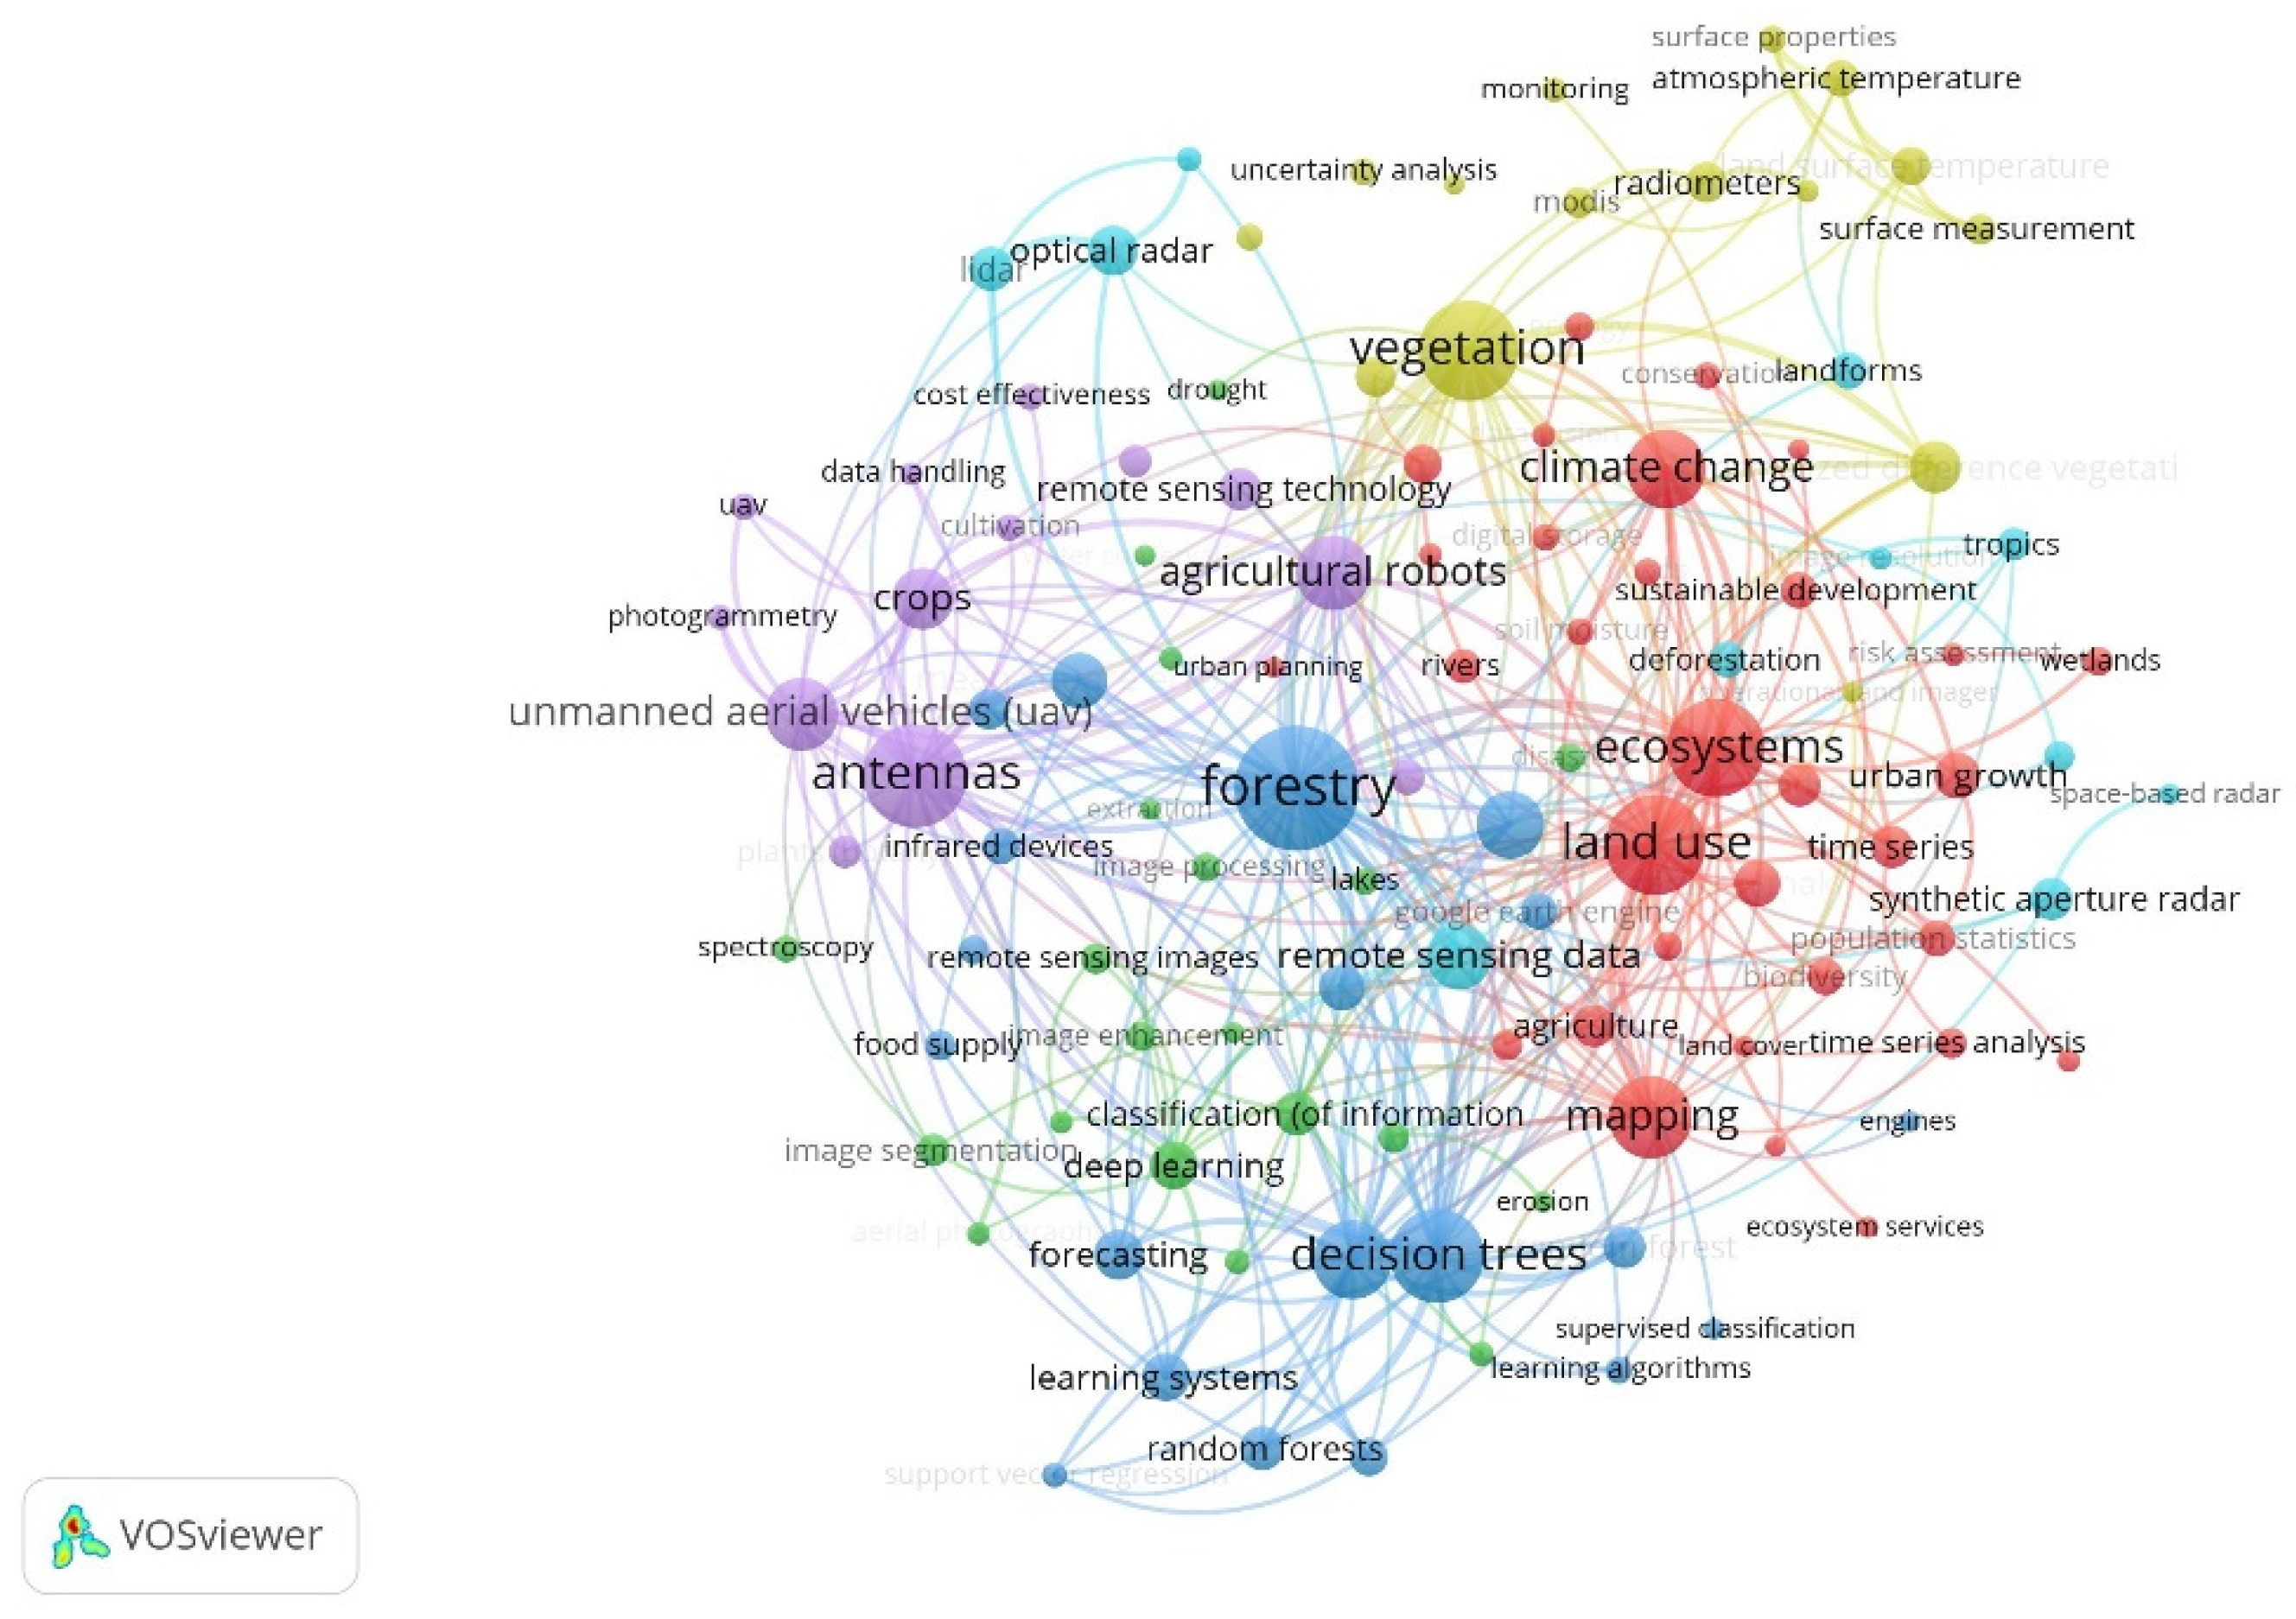
Based on this smaller subset of 1436 publications, Figure 5 shows the co-occurrence of key terms in the journal for first, the years 2009–2018 (that is, papers containing the key terms ‘sustain’ or ‘sustainable development’: this constitutes a set of 364 papers). Second, this is contrasted with the most recent full year, 2021 in Figure 6, based on 459 papers. An exploratory study such as this is seeking to confirm that sustainability has increased in importance over time, and so displays for 2019 and 2020 are omitted (but are available from the author on request).
Comparison of Figure 5 and Figure 6 shows that the co-occurrences among the key term clusters are shifting over time. The clusters identified within VOSviewer for 2021 have been interpreted by the author, and the labels shown in Table 2.
Figure 4 and Figure 6 are significant in that they show that the emergence of “sustainable development” as a key term within this remote sensing publication is occurring as part of a discrete cluster of co-occurrences; this cluster contains terms such as ‘climate change’, ‘land-use’, ‘urban growth’, and ‘ecosystem services’. This indicates that this is an emerging and discrete subfield, not subsumed within other discrete clusters such as forestry, or AI.
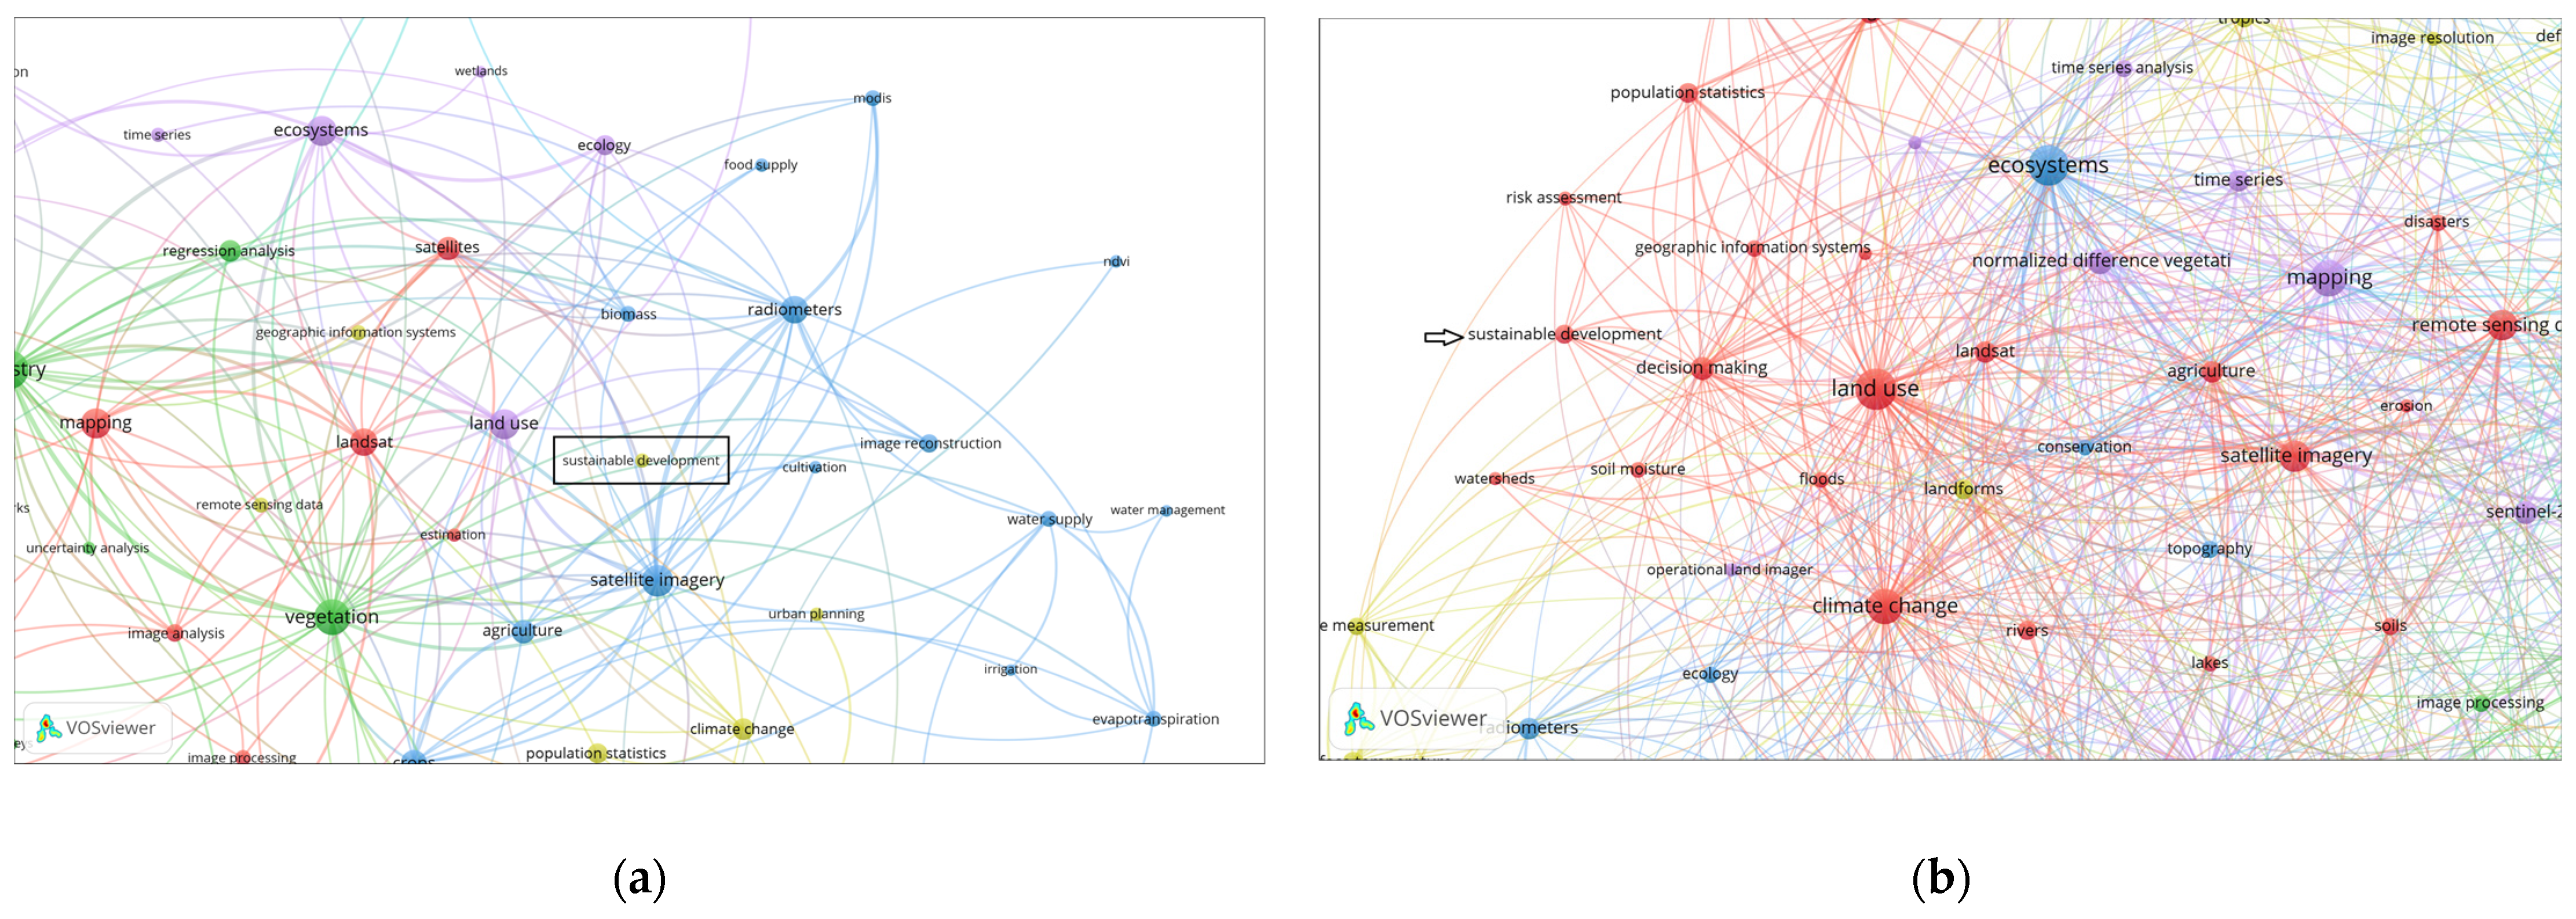
This interpretation is much clearer with an enlargement of the co-occurrence display for ‘sustainable development’, first for all years (Figure 7a) and second for 2021 alone (Figure 7b). In Figure 7a, ‘sustainable development’ is a minor and unconnected keyword; by 2021, it is now connected with terms such as ‘land-use’, ‘ecosystems’, and ‘decision-making’. These displays allow us to identify a preliminary inference, namely, that the remote sensing field has paid little attention to sustainability concepts until climate change has increased in visibility. As this is based on the publications within a single journal, we can broaden the inquiry by introducing additional journals. This could involve additional samples from the roster of remote sensing journals, but here, we have sought contrast by turning to the four indexed journals which have ‘sustainable development’ in their titles; the search process is then inverted, as we search there for ‘remote sensing’ (see Appendix A.2).
3.4. Comparative Analysis of Other Journals
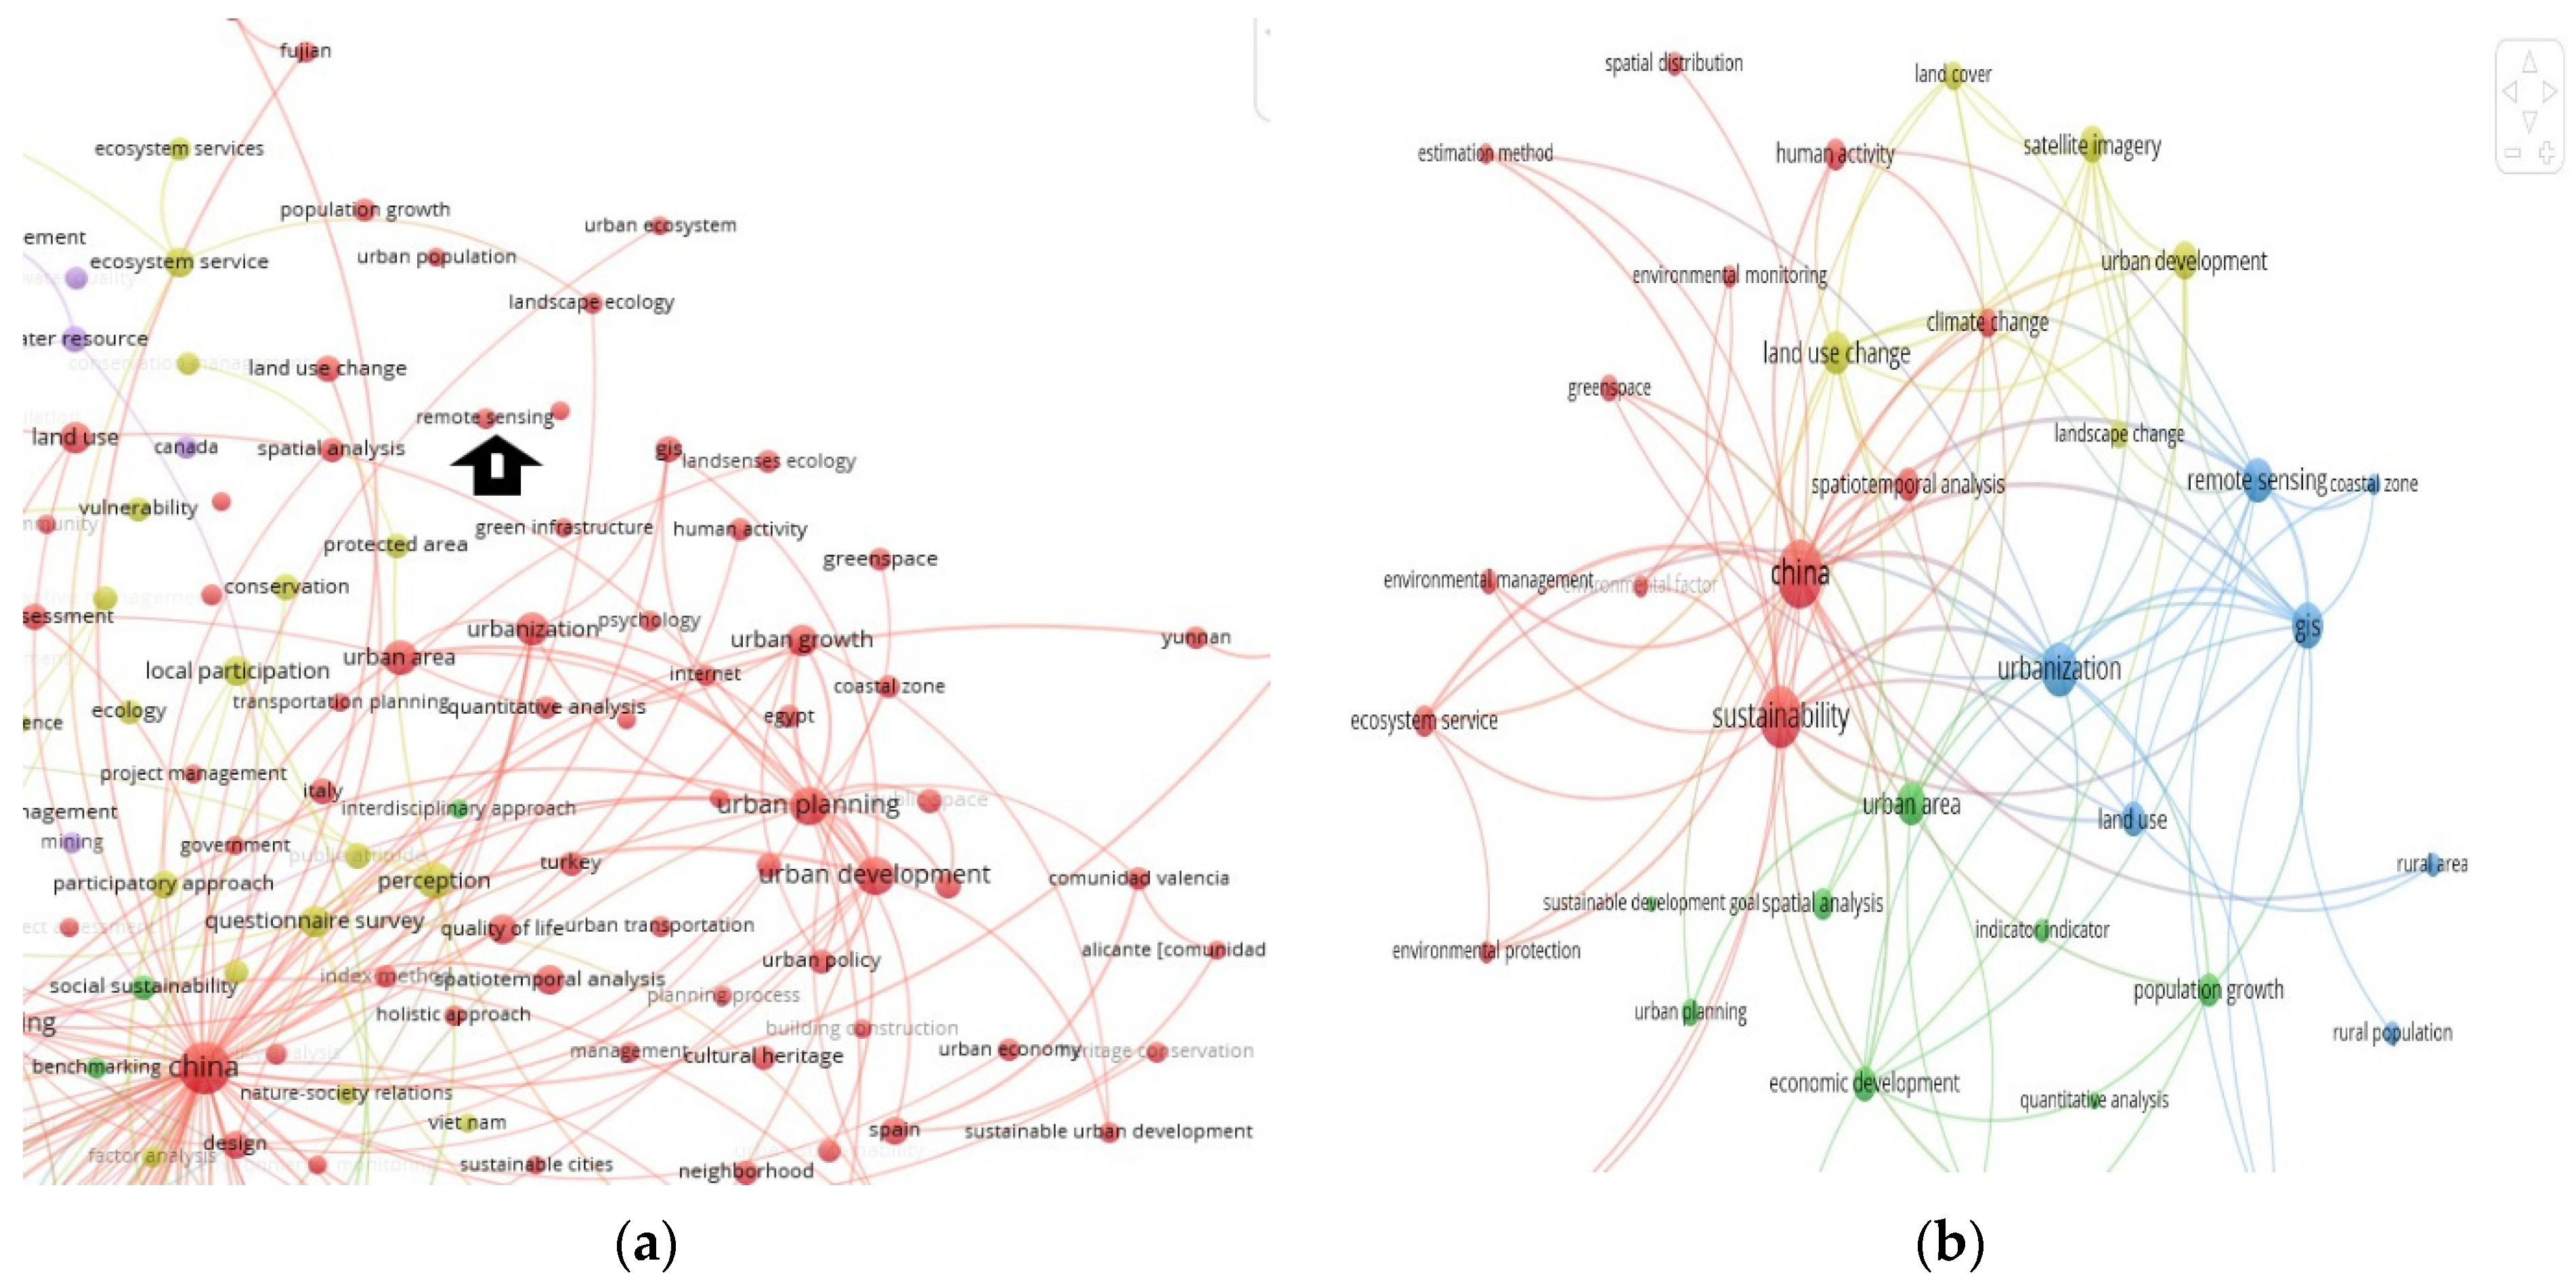
This discussion of sustainable development as an emerging focus within the remote sensing field has thus far been limited to a single journal, albeit one with high visibility (as demonstrated by its impact factor of 4.84). In this section, we undertake a comparative analysis by focusing on the four journals indexed within Scopus which contain ‘sustainable development’ in their title, namely, Sustainable Development, International Journal of Sustainable Development and World Ecology, International Journal of Sustainable Development and Energy for Sustainable Development. This yielded 1586 publications for the years 2009–2021 (i.e., limited to the same time period as before, so that this additional analysis is directly comparable to that already completed).
Two things can be seen in Figure 8. First, across the time period 2009–2021, remote sensing constitutes only a small presence with limited co-occurrences with other key terms in these journals dedicated to sustainable development. Second, this interpretation changes somewhat if we search explicitly for publications in the same four journals that also contain the keywords ‘remote AND sensing’. In Figure 8b, we can see that ‘remote sensing’ and ‘sustainable development goals’ are both present, but the co-occurrences are with other terms. The former is linked to Geographic Information Systems and urbanization, the latter to economic development and urban planning.
The implications of these preliminary findings are explored in detail in the next section, but it can be seen that these visual displays permit a rapid yet detailed exploration of co-occurrences within publications dealing with remote sensing and sustainable development, sufficient to make some initial inferences and then to consider more detailed research directions.
4. Discussion
4.1. Remote Sensing and the Production of Knowledge
The exploratory bibliometric presentation offered here shows that while some subfields cluster (in terms of their reliance on a shared pool of citations), others are barely connected. The strength of the links between research on SDGs and RS appears weak throughout our displays (Figure 2, Figure 5, Figure 6, Figure 7 and Figure 8). This is consistent with (and provides preliminary empirical support for) current scholarship on the SDGs. For example, Kavvada et al. argue that “the uptake of EO {earth observation, a synonym for remote sensing) in support of the global development agenda has been slow and unevenly adopted by countries” [22]. In practice, they indicate that remote sensing specialists should be complemented by others developing new research directions.
4.2. Interdisciplinarity
This discussion of the integration of subfields in the context of the SDGs appears critical. The last preliminary analysis presented here again focuses on a specific journal in order to explore this issue. It focuses on the broadly interdisciplinary journal Sustainability, using the same methods as before.
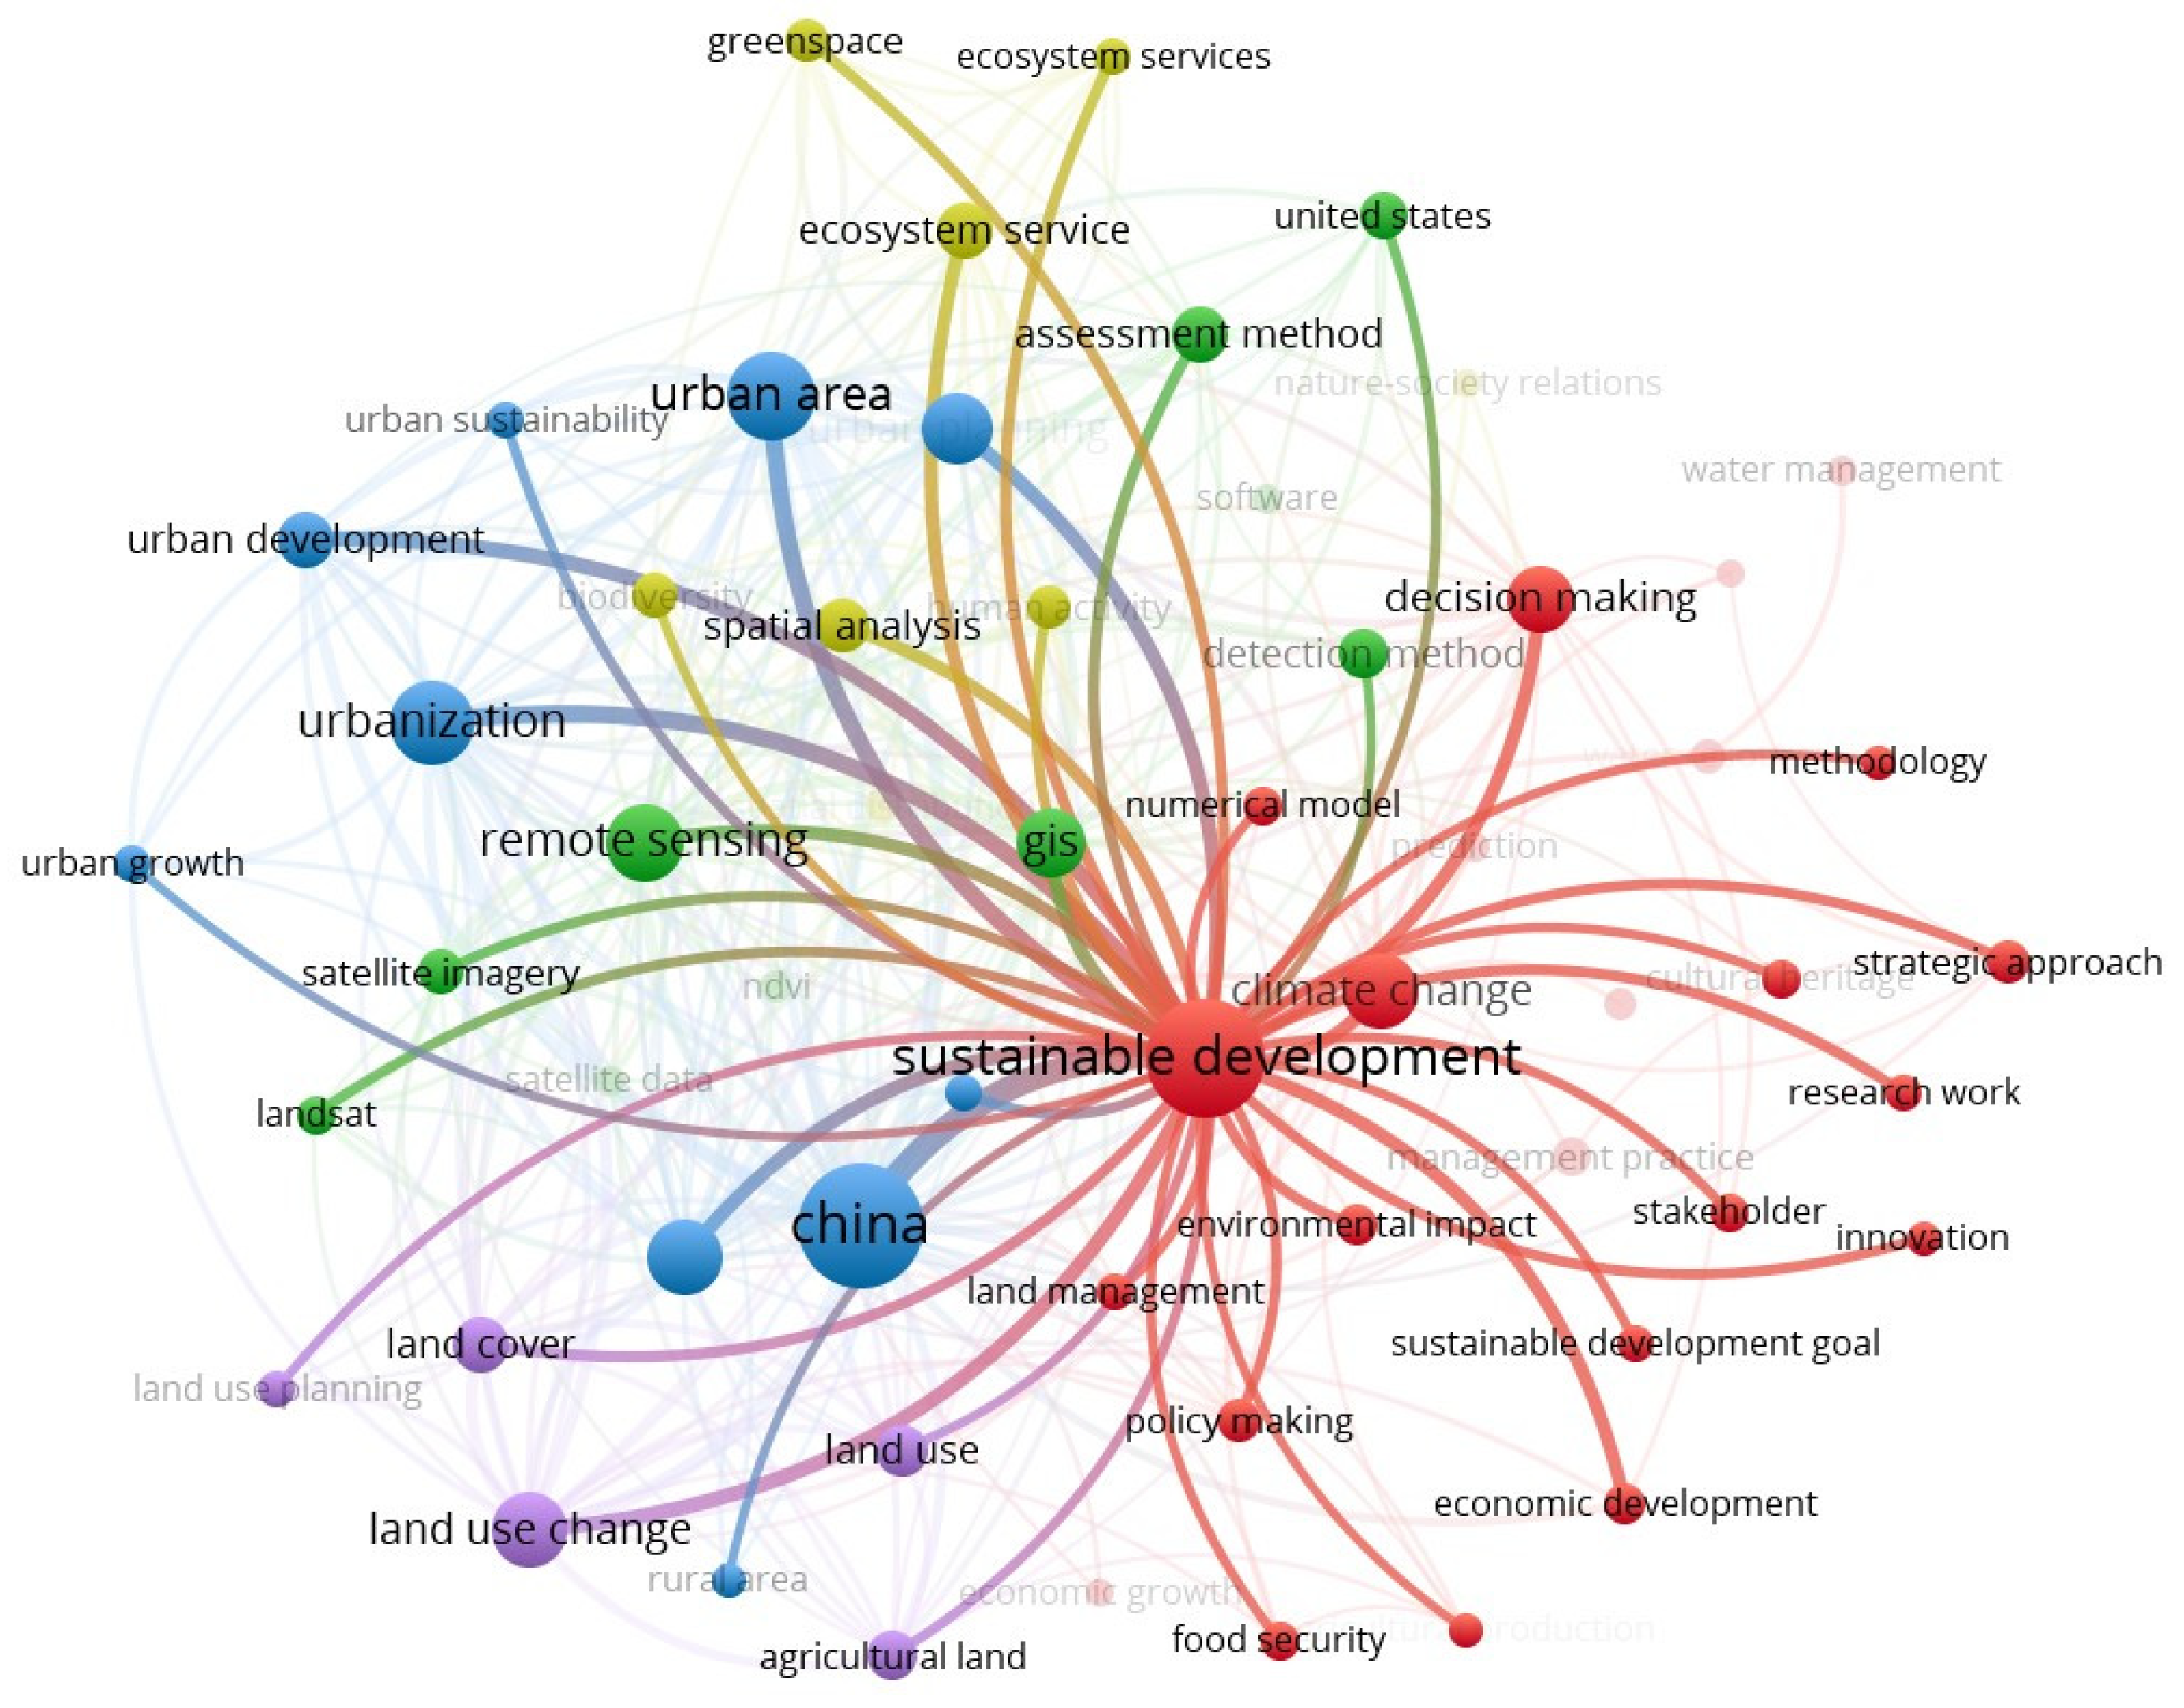
The journal Sustainability is comparable with Remote Sensing in terms of common elements—both have achieved relatively high IFs (3.25 and 4.8, respectively), and both are open access, although Sustainability presents itself explicitly as ‘cross-disciplinary’. Figure 9 displays co-occurrences for papers published there between 2009–2021 containing the key terms ‘remote AND sensing’ (see Appendix A.2). This VOSviewer display presents a clear pattern of co-occurrences between remote sensing (in the upper left quadrant) and sustainable development (in the center). The term ‘sustainable development goal’ also appears (bottom right quadrant). This mapping of a citation space in a different journal offers contrasting insights into the links between sustainable development, climate change, stakeholders, and policy (red cluster) and remote sensing and Geographic Information Systems (GIS) (green cluster). Urbanization (blue) and agriculture (purple) are distinct, but all are linked through publications on sustainable development (Table 3).
If we situate these findings within the preceding discussion, we can see the journal Sustainability as an example of a cross-disciplinary journal (to use its own term) which is publishing papers which juxtapose analytical methods (such as GIS and remote sensing) with policy connected to sustainable development and climate change. More details of the journal’s output can be found in a bibliometric study by Tang et al., although it does not limit its focus to remote sensing [23].
4.3. Summary
This exploratory study demonstrates a successful test of a proposition, namely, that the field of remote sensing appears more focused upon technical inputs than upon social outcomes. This is underlined if we compare citations in that field with the technical material published within sustainability, which show much greater concern for the SDGs.
This is an exploratory project, using bibliometrics in a demonstrative way. Its strengths—notably its relatively rapid completion—can also be seen to be its limitation, as only a handful of journals were used as being representative of two large fields (remote sensing and sustainability). Nonetheless, the results suggest that the initial concerns raised by Estoque—that sustainable development goals are being undermined by poor technical performance with regard to data collection and analysis—are testable, and the criticism is feasible [13]. From here, it would be appropriate to develop a full-scale investigation, using a full database of relevant publications, an analysis of research funding, a content analysis of research reports, and/or a qualitative study of funding agencies.
This approach to preliminary research can be applied in many fields. The author has used this software to explore the proposition that researchers who publish in the field of climate change mitigation operate in a citation space that is distinct from climate change adaptation, to the detriment of public policy development [21]. A current project is examining published research dealing with the US Department of Homeland Security, to explore whether the latter’s remit to combat terrorism appears to be at the expense of a focus on climate change.
5. Conclusions
This paper has sought to present two ideas. The first is that the ready availability of bibliometric software can have potentially negative implications for journals which focus broadly on scholarly publication, due to the rapid growth of descriptive literature reviews. These are not technically innovative, and their content may be arcane. In an ideal academic marketplace, such papers would be directed back towards the emerging fields that they describe.
The second intention has been to suggest that open access bibliometric software can, though, be used in other ways, notably by scholars who are not scientometric researchers. Products such as VOSviewer possess the distinction of being both technically robust and relatively simple to use. The examples used here show that publication data from comprehensive databases can be analyzed to investigate the relations between concepts in any research field. This approach can be applied to an exploration of simple hypotheses, as are commonly developed in preliminary studies and mixed-methods approaches, where the complexity of the reality under investigation encourages simple step-by-step analysis. To be clear, these findings are illustrative and not definitive. However, the relative simplicity of the approach shows these and similar examples to be useful starting points in many research contexts.
Funding
This research received no external funding. As an exploratory study, it is important to emphasize that open access software was employed throughout.
Data Availability Statement
The data employed in this preliminary study were downloaded from Scopus and are readily available there, using the search terms indicated in Appendix A.2.
Acknowledgments
The author thanks Robert Varady and one of the reviewers for helpful comments.
Conflicts of Interest
The author declares no conflict of interest.
Appendix A
Appendix A.1. VOSviewer
VOSviewer is a creation of researchers working in scientometrics (Eck and Waltman, 2010). The software is based upon a local moving algorithm which identifies relations within networks of publications and their citations and keywords. VOSviewer uses inputs from Web of Science, Scopus and PubMed, and its outputs are maps which represent networks of keywords, scientific publications and journals, researchers and research organizations and their countries of origin. Items in these networks can be connected by co-authorship, co-occurrence, citation, bibliographic coupling, or co-citation links.
VOSviewer considers nodes within a two-dimensional space, where one scholarly publication constitutes a node which is joined by a number of edges to a finite number of other nodes through a pattern of citations. The algorithm also assigns the nodes in any network (publications, journals, and so forth) to clusters, each constituting a group of closely related nodes. As each node is assigned to only one cluster, this permits the creation of a meaningful visual display.
VOS minimizes the function
where n represents the nodes in a network, xi represents the location of node i in two-dimensional space and ||xi − xj|| represents the Euclidean distance between nodes i and j.
These mathematical functions underpinning VOSviewer can be explored in detail in the Appendix to van Eck and Waltman [24].
The number of clusters can be determined by a resolution parameter, and the user has numerous options in terms of generating clusters and exploring their placement within the two-dimensional space. For consistency, the displays used in this presentation employed default values for minimum cluster size and numbers of iterations.
Appendix A.2. Technical Content
This paper contains a series of bibliometric analyses which are indicative of the use of the VOSviewer software. For consistency, the program’s default parameters for layout and clustering were used but these can be altered by the user to generate different displays. The search parameters used in each display are presented below.

Table A1.
Search parameters employed to generate VOSviewer displays Figure 1, Figure 2, Figure 3, Figure 4, Figure 5, Figure 6, Figure 7, Figure 8 and Figure 9.
| Figure | Parameters Used in the Analysis |
|---|---|
| Figure 1 | Data generated by Scopus, accessed 29 May 2022. Search for “VOSviewer” in Title, Abstract and Keywords, 2010 (software first published)-2021 (last full year); TI = (“VOSviewer”) OR AB = (“VOSviewer”) OR AK = (“VOSviewer”). Graph created in Excel. |
| Figure 2 | Data generated by Web of Science, accessed 3 March 2021. Search for keywords “smart” and “sustainable”, refined by ‘city’; (TITLE-ABS-KEY (“smart” AND “sustainable”) AND PUBYEAR > 2014 AND PUBYEAR < 2021) AND (“city”); results limited to 1000 most cited papers published in WoS 2015–2020; VOSviewer display of co-occurrences limited to keyword threshold 10. |
| Figure 3 | Data generated by Scopus, accessed 1 March 2022; all publications in the journal Remote Sensing for full years from inception 2009–2021; TITLE-ABS-KEY (“remote sensing”) AND PUBYEAR > 2008 AND PUBYEAR < 2022 AND (LIMIT-TO (EXACTSRCTITLE, “Remote Sensing”)); VOSviewer display of co-occurrences limited to keyword threshold 150. |
| Figure 4 | The use of key terms “sustain” OR “sustainable” in the journal Remote Sensing, 2009–2021; (TITLE-ABS-KEY (“remote sensing”) AND PUBYEAR > 2008 AND PUBYEAR < 2022) AND (“sustain” OR “sustainable”) AND (LIMIT-TO (EXACTSRCTITLE, “Remote Sensing”)); graph created in Excel. |
| Figure 5 | VOSviewer results of co-occurrences in papers published in Remote Sensing 2009–2018 with key terms “sustain” OR “sustainable development”; (TITLE-ABS-KEY (“remote sensing”) AND PUBYEAR > 2008 AND PUBYEAR < 2019) AND (“sustain” OR “sustainable”) AND (LIMIT-TO (EXACTSRCTITLE, “Remote Sensing”)); VOSviewer display of co-occurrences limited to keyword threshold 10. |
| Figure 6 | VOSviewer results of co-occurrences in papers published in Remote Sensing in 2021 with key terms “sustain” or “sustainable development”; (TITLE-ABS-KEY (“remote sensing”) AND PUBYEAR > 2008 AND PUBYEAR < 2022) AND (“sustain” OR “sustainable”) AND (LIMIT-TO (EXACTSRCTITLE, “Remote Sensing”)) AND (LIMIT-TO (PUBYEAR, 2021)); VOSviewer display of co-occurrences limited to keyword threshold 10. |
| Figure 7 | Figure 7. (a) VOSviewer results of co-occurrences among papers published in Remote Sensing 2009–2021 with key terms “sustain” OR “sustainable development”; display shows enlarged output solely for ‘sustainable development’; (b) VOSviewer results of co-occurrences in papers published in Remote Sensing solely in 2021 with key terms “sustain” or “sustainable development”; display shows enlarged output solely for “sustainable development”; data as in Figure 5 and Figure 6. |
| Figure 8 | Figure 8. (a) VOSviewer results of co-occurrences in papers published in four journals dealing with sustainable development 2009–2021 indexed in Scopus (see text for details): TITLE-ABS-KEY (“sustainable” AND “development”) AND PUBYEAR > 2008 AND PUBYEAR < 2022 AND (LIMIT-TO (SUBJAREA, “ENVI”) OR LIMIT-TO (SUBJAREA, “SOCI”)) AND (LIMIT-TO (EXACTSRCTITLE, “Sustainable Development”) OR LIMIT-TO (EXACTSRCTITLE, “International Journal Of Sustainable Development And World Ecology”) OR LIMIT-TO (EXACTSRCTITLE, “Energy For Sustainable Development”) OR LIMIT-TO (EXACTSRCTITLE, “International Journal Of Sustainable Development”)); display detail shows enlarged output for term ‘remote sensing’’; (b) VOSviewer results of co-occurrences in papers published in same four journals containing the key term ‘remote sensing’ for 2009–2021.: display shows enlarged output for ‘sustainable development goals’ and ‘remote sensing’. |
| Figure 9 | Data generated by Scopus accessed 23 March 2022; search TITLE-ABS-KEY (remote AND sensing) AND PUBYEAR > 2008 AND PUBYEAR < 2022 AND (LIMIT-TO (EXACTSRCTITLE, “Sustainability Switzerland”)); VOSviewer results of co-occurrences in papers published in journal Sustainability 2009–2021 with key terms “remote AND sensing”; display limited to keyword threshold 10. |
References
- Moral-Munoz, J.A.; López-Herrera, A.G.; Herrera-Viedma, E.; Cobo, M.J. Science mapping analysis software tools: A review. In Springer Handbook of Science and Technology Indicators; Glänzel, W., Moed, H.F., Schmoch, U., Thelwall, M., Eds.; Springer Handbook; Springer: Cham, Switzerland, 2019; pp. 159–185. [Google Scholar] [CrossRef]
- Bolin, M.; University of Nebraska, Lincoln, NE, USA. Personal communication, 2022.
- Herrera-Franco, G.; Montalván-Burbano, N.; Mora-Frank, C.; Bravo-Montero, L. 2021 Scientific Research in Ecuador: A Bibliometric Analysis. Publications 2021, 9, 55. [Google Scholar] [CrossRef]
- Sobreira, C.; Klu, J.K.; Cole, C.; Nic Daéid, N.; Ménard, H. Reviewing Research Trends—A Scientometric Approach Using Gunshot Residue (GSR) Literature as an Example. Publications 2020, 8, 7. [Google Scholar] [CrossRef] [Green Version]
- Leydesdorff, L. Can scientific journals be classified in terms of aggregated journal-journal citation relations using theJournal Citation Reports? J. Am. Soc. Inf. Sci. Technol. 2006, 57, 601–613. [Google Scholar] [CrossRef]
- Valentin, D.; Chollet, S.; Lelièvre, M.; Abdi, H. Quick and dirty but still pretty good: A review of new descriptive methods in food science. Int. J. Food Sci. Technol. 2012, 47, 1563–1578. [Google Scholar] [CrossRef]
- Robb, T. Google as a quick ‘n dirty corpus tool. TESL-EJ Electron. J. Engl. A Second. Lang. 2003, 7, 14–16. [Google Scholar]
- McNaught, C.; Lam, P. Using Wordle as a supplementary research tool. Qual. Rep. 2010, 15, 630–643. [Google Scholar] [CrossRef]
- Carta, M.; Angermeyer, M.; Tagliagambe, S. The Trend of Scientific Productivity of Chinese, European Union, and United States Universities and Private Companies: Does the Future Belong to E-Technology Companies? Publications 2021, 9, 18. [Google Scholar] [CrossRef]
- Debackere, K.; Glänzel, W.; Thijs, B. Scientometrics Shaping Science Policy and vice versa, the ECOOM Case. In Springer Handbook of Science and Technology Indicators; Glänzel, W., Moed, H.F., Schmoch, U., Thelwall, M., Eds.; Springer Handbooks; Springer: Cham, Switzerland, 2019. [Google Scholar] [CrossRef]
- Trindade, E.P.; Hinnig, M.P.F.; Da Costa, E.M.; Marques, J.S.; Bastos, R.C.; Yigitcanlar, T. Sustainable development of smart cities: A systematic review of the literature. J. Open Innov. Technol. Mark. Complex. 2017, 3, 11. [Google Scholar] [CrossRef] [Green Version]
- Alamanos, A.; Linnane, S. Estimating SDG Indicators in Data-Scarce Areas: The Transition to the Use of New Technologies and Multidisciplinary Studies. Earth 2021, 2, 635–652. [Google Scholar] [CrossRef]
- Estoque, R. A Review of the Sustainability Concept and the State of SDG Monitoring Using Remote Sensing. Remote Sens. 2020, 12, 1770. [Google Scholar] [CrossRef]
- Viana, J.; Santos, J.V.; Neiva, R.M.; Souza, J.; Duarte, L.; Teodoro, A.C.; Freitas, A. Remote Sensing in Human Health: A 10-Year Bibliometric Analysis. Remote Sens. 2017, 9, 1225. [Google Scholar] [CrossRef] [Green Version]
- Wang, L.J.; Zhang, G.M.; Wang, Z.Y.; Liu, J.G.; Shang, J.L.; Liang, L. Bibliometric Analysis of Remote Sensing Research Trend in Crop Growth Monitoring: A Case Study in China. Remote Sens. 2019, 11, 809. [Google Scholar] [CrossRef] [Green Version]
- Noszczyk, T.; Gawronek, P. Remote Sensing and GIS for Environmental Analysis and Cultural Heritage. Remote Sens. 2020, 12, 3960. [Google Scholar] [CrossRef]
- Thenkabail, P. Remote Sensing Open Access Journal of MDPI: Current Progress and Future Vision. Remote Sens. 2020, 12, 2442. [Google Scholar] [CrossRef]
- Zhang, Y.; Thenkabail, P.S.; Wang, P. A Bibliometric Profile of the Remote Sensing Open Access Journal Published by MDPI between 2009 and 2018. Remote Sens. 2019, 11, 91. [Google Scholar] [CrossRef] [Green Version]
- Martín-Martín, A.; Thelwall, M.; Orduna-Malea, E.; López-Cózar, E.D. Google Scholar, Microsoft Academic, Scopus, Dimensions, Web of Science, and OpenCitations’ COCI: A multidisciplinary comparison of coverage via citations. Scientometrics 2020, 126, 871–906. [Google Scholar] [CrossRef] [PubMed]
- van Eck, N.J.; Waltman, L.; Dekker, R.; van den Berg, J. A comparison of two techniques for bibliometric mapping: Multidimensional scaling and VOS. J. Am. Soc. Inf. Sci. Technol. 2010, 61, 2405–2416. [Google Scholar] [CrossRef] [Green Version]
- Einecker, R.; Kirby, A. Climate Change: A Bibliometric Study of Adaptation, Mitigation and Resilience. Sustainability 2020, 12, 6935. [Google Scholar] [CrossRef]
- Kavvada, A.; Metternicht, G.; Kerblat, F.; Mudau, N.; Haldorson, M.; Laldaparsad, S.; Friedl, L.; Held, A.; Chuvieco, E. Towards delivering on the Sustainable Development Goals using Earth observations. Remote Sens. Environ. 2020, 247, 111930. [Google Scholar] [CrossRef]
- Tang, M.; Liao, H.; Wan, Z.; Herrera-Viedma, E.; Rosen, M.A. Ten Years of Sustainability (2009 to 2018): A Bibliometric Overview. Sustainability 2018, 10, 1655. [Google Scholar] [CrossRef]
- Van Eck, N.; Waltman, L. Visualizing bibliometric networks. In Measuring Scholarly Impact: Methods and Practice; Ding, Y., Rousseau, R., Wolfram, D., Eds.; Springer: Cham, Switzerland, 2014; pp. 285–320. [Google Scholar] [CrossRef]
Figure 1.
Published papers identifying VOSviewer in the Abstract, title or keywords; source Scopus, data compiled March 2022: see Appendix A.2 for details.
Figure 1.
Published papers identifying VOSviewer in the Abstract, title or keywords; source Scopus, data compiled March 2022: see Appendix A.2 for details.

Figure 2.
Co-occurrences of keywords ‘smart’ and ‘sustainable’ refined by ‘city’; 1000 most cited papers published in Web of Science 2015–2020; see Appendix A.2 for details.
Figure 2.
Co-occurrences of keywords ‘smart’ and ‘sustainable’ refined by ‘city’; 1000 most cited papers published in Web of Science 2015–2020; see Appendix A.2 for details.

Figure 3.
VOSviewer output of keyword co-occurrences; journal Remote Sensing 2009–2021. See Appendix A.2 for details.
Figure 3.
VOSviewer output of keyword co-occurrences; journal Remote Sensing 2009–2021. See Appendix A.2 for details.

Figure 4.
The use of key terms “sustain” OR “sustainable” in the journal Remote Sensing, 2009–2021, see Appendix A.2 for details.
Figure 4.
The use of key terms “sustain” OR “sustainable” in the journal Remote Sensing, 2009–2021, see Appendix A.2 for details.

Figure 5.
VOSviewer results of co-occurrences in papers published in Remote Sensing 2009–2018 with key terms “sustain” or “sustainable development”: see Appendix A.2 for details.
Figure 5.
VOSviewer results of co-occurrences in papers published in Remote Sensing 2009–2018 with key terms “sustain” or “sustainable development”: see Appendix A.2 for details.

Figure 6.
VOSviewer results of co-occurrences in papers published in Remote Sensing in 2021 with key terms “sustain” or “sustainable development”: see Appendix A.2 for details.
Figure 6.
VOSviewer results of co-occurrences in papers published in Remote Sensing in 2021 with key terms “sustain” or “sustainable development”: see Appendix A.2 for details.

Figure 7.
(a) VOSviewer results of co-occurrences in papers published in Remote Sensing 2009–2021 with key terms “sustain” or “sustainable development”; display shows enlarged output solely for term ‘sustainable development’; (b) VOSviewer results of co-occurrences in papers published in Remote Sensing solely in 2021 with key terms “sustain” or “sustainable development”; display shows enlarged output solely for “sustainable development”: see Appendix A.2 for details.

Figure 8.
(a) VOSviewer results of co-occurrences in papers published in four journals dealing with sustainable development 2009–2021 indexed in Scopus (see text for details): display detail shows enlarged output for term ‘remote sensing’’; (b) VOSviewer results of co-occurrences in papers published in same four journals containing the key term ‘remote sensing’ for 2009–2021: display shows enlarged output for ‘sustainable development goals’ and ‘remote sensing’: see Appendix A.2 for details.

Figure 9.
VOSviewer results of co-occurrences in papers published in Sustainability 2009–2021 with key terms “remote AND sensing”: see Appendix A.2 for details.
Figure 9.
VOSviewer results of co-occurrences in papers published in Sustainability 2009–2021 with key terms “remote AND sensing”: see Appendix A.2 for details.

Table 1.
Interpretation of co-occurrence clusters displayed in Figure 1.
Table 1.
Interpretation of co-occurrence clusters displayed in Figure 1.
| Cluster | Color | Label |
|---|---|---|
| 1 | Red | MODIS, radiometers, satellites |
| 2 | Green | Vegetation, ecosystems, climate change |
| 3 | Blue | AI, decision trees |
| 4 | Sand | Forestry, LiDAR |
Table 2.
Interpretation of co-occurrence clusters displayed in Figure 6.
Table 2.
Interpretation of co-occurrence clusters displayed in Figure 6.
| Cluster | Color | Label |
|---|---|---|
| 1 | Red | Sustainable development, land-use, climate change, urban growth |
| 2 | Blue | Forestry |
| 3 | Purple | Crops, antennas |
| 4 | Sand | Vegetation |
| 5 | Green | Deep learning |
Table 3.
Interpretation of co-occurrence clusters displayed in Figure 9.
Table 3.
Interpretation of co-occurrence clusters displayed in Figure 9.
| Cluster | Color | Label |
|---|---|---|
| 1 | Red | Sustainable development, climate change, policy |
| 2 | Blue | Urbanization, China |
| 3 | Purple | Land-use |
| 4 | Sand | Ecosystem services, spatial analysis |
| 5 | Green | Remote Sensing, GIS, Unites States |
Disclaimer/Publisher’s Note: The statements, opinions and data contained in all publications are solely those of the individual author(s) and contributor(s) and not of MDPI and/or the editor(s). MDPI and/or the editor(s) disclaim responsibility for any injury to people or property resulting from any ideas, methods, instructions or products referred to in the content. |
© 2023 by the author. Licensee MDPI, Basel, Switzerland. This article is an open access article distributed under the terms and conditions of the Creative Commons Attribution (CC BY) license (https://creativecommons.org/licenses/by/4.0/).
Share and Cite
MDPI and ACS Style
Kirby, A. Exploratory Bibliometrics: Using VOSviewer as a Preliminary Research Tool. Publications 2023, 11, 10. https://doi.org/10.3390/publications11010010
AMA Style
Kirby A. Exploratory Bibliometrics: Using VOSviewer as a Preliminary Research Tool. Publications. 2023; 11(1):10. https://doi.org/10.3390/publications11010010
Chicago/Turabian StyleKirby, Andrew. 2023. "Exploratory Bibliometrics: Using VOSviewer as a Preliminary Research Tool" Publications 11, no. 1: 10. https://doi.org/10.3390/publications11010010
Note that from the first issue of 2016, this journal uses article numbers instead of page numbers. See further details here.