Article

Automated Remodelling of Connectors in Fixed Partial Dentures

Department of Prosthetic Dentistry and Biomedical Materials Science, Hannover Medical School, Carl-Neuberg-Straße 1, 30625 Hannover, Germany
*
Author to whom correspondence should be addressed.
Dent. J. 2023, 11(11), 252; https://doi.org/10.3390/dj11110252
Submission received: 7 September 2023 / Revised: 13 October 2023 / Accepted: 26 October 2023 / Published: 27 October 2023
(This article belongs to the Special Issue Feature Papers in Digital Dentistry)

Abstract

:
In this study, an approach for automated parametric remodelling of the connector cross-sectional area in a CAD model of a given fixed partial denture (FPD) geometry was developed and then applied to a 4-unit FPD. The remodelling algorithm was implemented using Rhinoceros and the Grasshopper plugin. The generated CAD models were used to perform a finite element analysis with Ansys to analyse the stress distribution in an implant-supported 4-unit FPD for different connector designs. The results showed that the type of connector adjustment matters and that the resulting stress can be significantly different even for connectors with the same cross-sectional area. For tensile stresses, a reduction in the connector cross-sectional area from the gingival side showed the highest influence on each connector type. It can be concluded that the developed algorithm is suitable for automatic connector detection and adjustment.

Graphical Abstract

1. Introduction

In dentistry, a fixed partial denture (FPD) is often used to replace one or more missing teeth. Metal–ceramic FPDs have been used successfully for decades and have been reported with a 5-year survival of 94.4% in a systematic review by Sailer et al. [1]. Nowadays, various ceramic-based materials are used for FPDs, whereas da Silva et al. reported the main advantages and disadvantages of different ceramic systems and processing methods [2]. Among those alternatives, zirconia-based FPDs are promising, either with a zirconia-based framework and a veneering or in a monolithic form. For veneered zirconia-based 3-unit FPDs, Zarone et al. recently reported a 14-year survival of 91% for patients wearing an FPD [3]. According to a recent review by Laumbacher et al., veneering fractures are the predominant problem for tooth-supported as well as implant-supported crowns and multi-unit FPDs [4]. For monolithic zirconia-based FPDs, a recent review by Kim et al. found high 5-year cumulative survival rates of 99.60%, indicating an excellent 5-year performance [5]. Longer follow-up periods are currently missing.
In addition to the choice of material, the connector design also plays an important role in the fracture load, which has been shown in many in vitro studies for 3-unit and 4-unit FPDs [6,7,8,9,10,11]. Larsson et al. [7] for instance found that the fracture strength was higher for a large connector diameter. Oh et al. found that the radius of the connectors has an influence, and suggested that the radius at the gingival site plays a prominent role, while the curvature at the occlusal site can be as sharp as needed for the aesthetics [6].
Besides the in vitro studies mentioned above, finite element analysis (FEA) was used in the literature to investigate the effect of connector design on the stresses in FPDs, and many studies found the connector design to have a significant influence on the failure behaviour or on observed stresses [12,13,14,15]. Furthermore, Alberto et al. [12] found the radius of the interdental gingival shape to have a significant influence on the stresses in FPDs, whereas the smallest radius led to the highest tensile stresses. Almasi et al. performed an FEA on 3-unit FPDs and concluded that increasing the connector cross-sectional area and using a wider shape (ellipse) strongly decreases failure probability [13].
Although a lot of work on FPDs and connector design has been conducted, one might ask if there is a way to check the influence of the connector design for individual geometries with reasonable effort. A possible solution is to automate the design using parametric CAD-modelling, and in a second step FEA, up to a point where one can just import an FPD design and receive a response regarding stress distribution for standard support and standard load cases in automated form. Parametric CAD-modelling has been applied in the field of biomechanics before, for instance, for parametric modelling of a human hand [16], an ear model [17] or the semi-automated generation of bone defects around dental implants [18].
The main goal of this study was to develop an approach for parametric remodelling of the connectors dimension of FPDs. The automated approach was used to generate 3D models, which were used to investigate the influence of connector design on the stress distribution within a 4-unit FPD.

2. Materials and Methods

In this study, an algorithm for the automatic adjustment of the connector dimension in n-unit fixed partial dentures (FPD) was developed and implemented in Rhinoceros/Grasshopper (Robert McNeel & Associates, Seattle, WA, USA). The implementation was used to investigate the effect of the connector design on the stress distribution in a 4-unit FPD using finite element analysis (FEA).
The basic geometry of the 4-unit FPD was acquired using an optical scanner (ATOS II SO, GOM GmbH, Braunschweig, Germany) and a master model that was already used in previous studies [19,20,21,22,23,24]. Afterwards, the steps described in Section 2.1 were used to reduce the cross-sectional area from the occlusal, gingival, lingual, buccal or all sides and generate a CAD model of an implant-supported 4-unit FPD that was used for FEA with ANSYS workbench 2022R1 (ANSYS Inc., Canonsburg, PA, USA). The abbreviations used in the next sections denote P: points, L: lines, C: curves, E: planes, M: meshes, B: bounding boxes, R: bounding rectangles, A: areas and d: distances, respectively.

2.1. CAD-Modelling

An overview of the proposed algorithm can be found in Figure 1. First of all, an STL-File of a 4-unit FPD was imported into Rhino/Grasshopper and a remeshed mesh was computed using Grasshopper’s function Quad-remesh, to allow for a uniform distribution of the mesh vertices Pi along the FPD surface. For this study, the FPD surface was remeshed with 60,000 quads. The remeshed mesh and initial meshes were compared by calculating the Hausdorff distance [25], resulting in a maximum distance deviation of 0.0817 mm and an average deviation of 0.0045 mm from the initial geometry. Afterwards, the positions of the connectors were detected automatically. The mesh vertices Pi were then adjusted according to user-defined parameters. Finally, the mesh was updated using the new vertex positions and supporting implants were placed. Details of these steps are given in the following sections.

2.1.1. Automatic Connector Detection

The connectors of the imported 4-unit FPD were automatically detected using the following steps:
  • Find the smallest bounding box B0 (with faces focclusal, fgingival, fmesial, fdistal, flingual and fbuccal) for the FPD mesh geometry MFPD using the bounding box function in Grasshopper. Connect the centre of the smallest faces of B0 (fdistal and fmesial) with the line L1, see Figure 2a.
  • Generate 300 equally spaced planes Ei along the line L1 that are perpendicular to L1. Find the intersection curves Ci between the planes Ei and the FPD mesh (MFPD), see Figure 2b.
  • Define the plane Emid that lies in the middle between the faces focclusal and fgingival of Box B0. Define the plane Emid2 that lies in the middle between the faces flingual and fbuccal of Box B0.
  • Create bounding rectangles Ri for all intersection curves Ci, with the rectangle’s sides parallel to the faces of the box B0, see Figure 2c.
  • Divide each bounding rectangle Ri into an occlusal rectangle Ri-occlusal and a gingival rectangle Ri-gingival using Emid, see Figure 2c.
  • Compute the surface areas (Ai-occlusal and Ai-gingival) of each bounding rectangle (Ri-occlusal and Ri-gingival). Find the local minima of Ai-occlusal (denoted as αj) and of Ai-gingival (denoted as βj), see Figure 2d. The minima are used to define the position of the connectors. As the connectors may be oblique, the minima for the occlusal and gingival sides are calculated separately.

2.1.2. Connector Adjustment

In this section, the steps for adjusting the connectors are described. The initial cross-sectional areas of the connectors were as follows: the distal connector had an area of 33.1 mm2 (with a height of 5.7 mm and length of 6.8 mm), the middle connector had an area of 28.5 mm2 (with a height of 5.7 mm and length of 6.0 mm), and the mesial connector had an area of 33.2 mm2 (with a height of 5.8 mm and length of 6.8 mm). Due to aesthetic considerations, these connectors were designed in an irregular, oval shape. The connectors were either shrunk evenly in all directions or shrunk from either the occlusal, gingival, lingual or the buccal side. Given that the steps for adjusting the connectors are similar for all directions, only one example is provided in this section to illustrate how the cross-sectional area of the middle connector (C2) was reduced from the occlusal direction. The different types of adjustment are shown in Figure 3a. To adjust the connector C2 in the occlusal direction, the following steps were taken:
  • Define Lo as the upper edge of the previously computed bounding rectangle Ri-occlusal at the position of αj (minimum detected in step 6 in the previous section). Define Lg as the lower edge of Ri-gingival at the position of βj. Define a plane EmidCon that contains Lo and Lg.
  • Define a Cartesian coordinate system (xyz), whereas the origin is defined by the point, which lies in Emid, Emid2 (see step 3 in the previous section) and EmidCon. The x-axis points from the origin in the direction of the point that is obtained by Emid2 crossing Lo. The y-axis lies in EmidCon and points to the buccal side (defined by the previously computed bounding Box B0). The z-axis is chosen perpendicular to the x- and y-axis.
  • Compute the distances d i   of all points of the FPD mesh to the plane EmidCon and select all points that are closer to the plane than w ( d i < w), whereas w is a user-defined parameter (w = 1 mm in this study). These selected points are called Pi-C2 and their position is altered in the following steps to adjust the connectors.
  • Starting from the point set Pi-C2 select all points with x > 0, which are the points close to the occlusal side, see Figure 3c. These selected points are called Pi-occlusal.
  • For each point in Pi-occlusal calculate the distance to the x-y plane (equals EmidCon) and y-z plane. These distances are called d x y i   and d y z i .
  • Compute a new x-coordinate xnew(i) for each point Pi-occlusal, see Figure 3b. B(t) is a bézier type function, x(i) is the old x-coordinate and k is a parameter chosen in step 7. The equations were:
    x n e w i = x i k   d y z i   · B d x y i · x i
    B t = w t 3 ·   w + 3 t w t 2 · 0.9 w + 3 t 2 w t · 0.1 w
  • Calculate the cross-sectional area A2 of connector C2 and iteratively adjust the value of the parameter k in Equation (1) using Galapagos in Grasshopper until A2 matches the predefined input area value Ainput. The optimization was stopped after an accuracy of ± 0.001 mm2 was achieved.
  • Reconstruct the FPD mesh using the updated vertices via the Grasshopper function construct mesh.
Figure 3. Illustration of substeps for connector adjustment. (a) Connectors cross-section for different types of connector shape adjustment. (b) Connector adjustment from the occlusal side, shown for a cross-section perpendicular to the lingual-buccal direction. (c) Selected points Pi-occlusal (blue) and Pi-gingival (green) for occlusal/ginginval adjustment. (d) Selected points Pi-lingual (red) and Pi-buccal (black) for lingual/buccal adjustment.
Dentistry 11 00252 g003

2.1.3. Implant Support for the FPD

The 4-unit FPD, measuring 9.0 mm in height, 11.7 mm in width, and 32.5 mm in length, was supported by two conical bone-levelled implants. Each implant measured 12 mm in length, 5 mm in top diameter, 4 mm in bottom diameter, and featured a metric thread design with a thread pitch of 0.5 mm. The abutment measured 8.3 mm in length and had a diameter of 3.3 mm. The abutment screw was modelled without threads to reduce the simulation time. A cement layer with a thickness of 0.1 mm was modelled between the abutment and FPD. The design and dimensions of the implant, abutment and abutment screw are shown in Figure 4c.

2.2. Material Properties, Contact Models, Boundary Conditions and Mesh Size

The material properties that were used in the finite element analysis are provided in Table 1. The materials used in this study were modelled with linear elastic and isotropic material models, exempt the transition zone that had a linear graded Young’s modulus. All surfaces between the different components were defined as bonded.
The bone was modelled with a graded transition zone between cortical and cancellous bone. The cortical layer had a thickness of 1.355 mm, and the transition zone had a thickness of 0.29 mm, the Young’s modulus is given in Table 1. Details of the graded bone model and its construction method can be found in Roffmann et al. [26].
Table 1. Material properties used in the finite element analysis.
ComponentMaterialYoung’s Modulus [GPa]Poisson’s Ratio
Implant 1Titanium grade 4104.50.37
Abutment 1Titanium grade 4104.50.37
Implant screw 1Titanium grade 5114.00.33
Cement layer 2Glass ionomer cement14.30.33
FPD 3Zirconium dioxide2100.27
Cortical bone 4-13.70.3
Transition zone-13.7 to 1.37 (graded)0.3
Cancellous bone 4-1.370.3
1 [27] 2 [28] 3 [29] 4 [30].
The lower surface of the mandibular bone segment was fixed (blue surface in Figure 4a) and both side surfaces were defined as frictionless and supported (yellow surfaces in Figure 4a). In all simulations, a force of 100 N was applied to the occlusal surface of the FPD parallel to the implant axis of both implants (red surfaces in Figure 4a). The force was not applied close to the middle connector as it is often done, because this area changed in our approach and it was the goal to have the same load conditions for all cases. The details of the model can be observed in Figure 4. The FPD was meshed using a mesh size of 0.3 mm. Mesh convergence was checked for different connector geometries. The implant system and bone were meshed with a slightly larger size (0.4 mm implant system, 0.5 mm bone). A total of 1,621,580 tetrahedral elements and 2,374,578 nodes were used in this study. Due to their complex geometries, the FE models were meshed with tetrahedral elements, as shown in Figure 4b.

2.3. Evaluation of Results

The developed approach for automatically altering the connector dimensions was applied to a 4-unit FPD. First, the influence of altering the distal connector was analysed, by reducing the connector area by 10% and 20% from all directions, or from either the gingival, occlusal, lingual or buccal direction. The same analysis was repeated for geometries with altered middle connectors and geometries with altered mesial connectors.
The maximum and minimum principal stresses were computed for the 4-unit FPD. For visualization, the FPD was segmented into 200 sections of equal width across its length of 32.5 mm (in the distal–mesial direction), resulting in a section thickness of about 0.16 mm. The highest maximum principal stress and lowest minimum principal stress in each section were chosen for display and plotted along the length coordinate.
For clarity, the stresses along the length coordinate are only shown over the full FPD length for the reference design (Figure 5). For the altered geometries (Figure 6), the stresses are only shown around the altered connectors, as the influence on the other connectors was rather low. The low influence can be observed in the data presented in Appendix A.

3. Results

In all models, the highest compressive stress (lowest minimum principal stress) was located in the occlusal region of the connectors. The highest tensile stress (highest maximum principal stress) was observed in the gingival region of the connectors. Figure 5 shows the principal stress behaviour along the length of the 4-unit FPD without altered connector regions (method details in Section 2.3).
The stress distribution of the 4-unit FPDs with altered connector areas along the length coordinate is shown in Figure 6. The distal, middle and mesial connectors were altered in separate geometries, with the other connectors remaining unchanged in all cases. A reduction in the cross-sectional area of 10% and 20% was chosen, whereas the reduction was performed either from all directions (iso) or from the gingival (gin), occlusal (occ), lingual (lin) or the buccal (buc) direction. As the main stress changes occur close to the changed connectors, Figure 6 shows only the stresses close to the distal connectors for the geometries with a changed distal connector and vice versa. In Table A1, Table A2 and Table A3, the relative stress change of the maximum principal stress is shown for all connectors, for different reductions of the connector cross-sectional area of the distal (A1), middle (A2) and mesial (A3) connector.

4. Discussion

This study aimed to develop an approach for parametric remodelling of the connectors dimension of FPDs and to study the influence of connector design on the stress distribution within a 4-unit FPD.
Overall, the results indicate that the way, how a certain cross-sectional area is modelled, has a large influence on the resulting stresses, depending on the geometric details. A reduction from the occlusal side had the greatest effect on compressive stresses (minimum principal stresses), while a reduction from the gingival side showed the greatest effect on tensile stresses (maximum principal stresses). Given that the tensile stresses become maximal at the gingival side of the middle connector, an area reduction at that side is possibly problematic.
In the literature, in vitro studies also found that the connector design plays an important role in fracture load [6,7,8,9,10,11], which is in line with the general observed stress behaviour in this study. Furthermore, Osman et al. [31] studied the influence of rectangular- and trapezoidal-shaped connectors under different loadings for lithium disilicate and zirconium dioxide three-unit conventional FPD. They found that the base of the connector, regardless of its shape, substantially impacts fracture strength. Arinc [32] performed a finite element analysis for a FPD with three different heights (2 mm, 3 mm and 4 mm). He found that the change in connector height affects the stress distribution in FPDs.
As described in the introduction, Alberto et al. [12] found the radius of the interdental gingival shape to have a significant influence on the stresses in the FPD, whereas the smallest radius led to the highest tensile stresses. The way the connector design is altered in this study is dominated by Equations (1) and (2) presented in Section 2.1.2. These equations were selected to obtain an aesthetically pleasing result and are not optimized for the radius of the interdental shape or minimal stresses. This might be a point for future optimization when the parametric approach is applied in a broader context.
In this study, an axial force of 100 N was applied to the occlusal surface of the FPD. The 100 N are somewhat arbitrary but are often used in dental finite element analysis [33,34,35,36]. The force lies in the range of bite forces for solid food, as reported by Schindler et al. [37] ranging from 20 N to 120 N. Maximum voluntary human bite forces were reported in the review by van der Bilt [38] to be between 306 N ± 42 N and 878 N ± 194 N. Changing the forces in this study to higher values would lead to higher absolute stress values, but the main conclusions of this study are not affected by this point. In a patient-specific analysis, one would instead apply the likely maximum force that can be expected for the patient. Furthermore, the FPD was implant-supported. It is known that the type of support affects the stress in the FPD, whereas more rigid support leads to lower tensile stresses [22].
The current study has certain limitations. The FE models use bonded material interfaces, which is a commonly employed simplification [39,40,41]. However, this simplification may lead to a higher stiffness of the implant and thus a more rigid support. Furthermore, all material properties used in this study were considered as homogeneous, linear and isotropic, apart from the transition zone having a graded Young’s modulus. A further limitation is that the force was directly applied to the occlusal surface, resulting in a simplified contact situation between the FPD and its antagonist compared to previous studies [42]. These simplifications were implemented to reduce the complexity of the FE-model.
The connector adjustment in this study was only performed for one 4-unit FPD. The design parameters, such as wall thickness or crown height, differ between different FPDs. Other designs will have a different stress distribution under load, so the effect of connector adjustment might be slightly different or stress maxima outside of the connectors might arise.
If one for a moment thinks about providing a simulation-based infrastructure to optimize the connector geometries in a dentist’s office, a viable business model is of course mandatory. The computing time needed for the FEA was the biggest time factor and took about 10 min for each simulation on a virtual server using 16 CPU cores (AMD Epyc 7713) and 256 RAM. Licensing an FE software to an individual dentist’s office is probably not realistic, as typically high licensing costs are associated with those licenses. However, this is not a fundamental problem and can be solved in principle. It might be a solution to provide an automated design software as a cloud service, possibly with a specialized licensing model with the FEA software supplier to make it economically viable. Besides the computing itself, a standardization of material constants or even geometry of the supporting bone might be necessary, especially in the first stages, as gathering of individual data can lead to further costs, risks and challenges. However, the current study is still at the basic research level and the focus of this manuscript is on the automation algorithms and not on possible business models.
This study aimed to develop an algorithm to adjust the connector cross-sectional area of a FPD, as a preparation for further automation steps. This goal was successfully achieved, improving the degree of automation in the field of dentistry. Automating the full FDP design including support in a well-controlled way, seems in principle reachable with today’s technology, but still represents a formidable challenge.

5. Clinical Relevance

It is generally advisable to avoid low connector area designs, particularly at the gingival side of the middle connector in a 4-unit FPD, due to the susceptibility to high stresses. Besides suitable algorithms a cost-effective method of automation is needed, to be capable to perform a stress analysis of patient-specific FPDs.

6. Conclusions

The following conclusions can be drawn from this study:
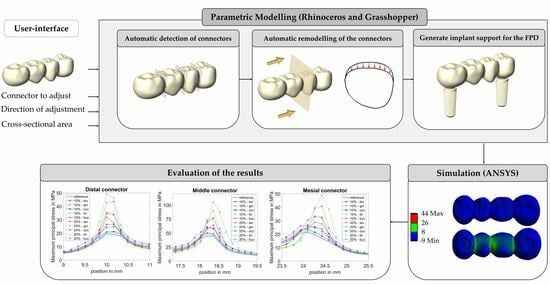
  • The proposed algorithm enables automatic detection of the connector position and parameterized adjustment of the cross-sectional area of the connectors from various directions.
  • Reducing the connector area from the gingival side has a major influence on the tensile stresses, whereas the middle connector in a 4-unit FPD is most vulnerable regarding a cross-sectional area reduction.

Author Contributions

Conceptualization, A.G.; Funding acquisition, A.G.; Investigation, H.J.; Methodology, H.J., M.E. and A.G.; Supervision, M.E. and A.G.; Visualization, H.J. and A.G.; Writing—original draft, H.J.; Writing—review and editing, H.J., M.E. and A.G. All authors have read and agreed to the published version of the manuscript.

Funding

This research was supported by the Deutsche Forschungsgemeinschaft (DFG), project number 462306304.

Institutional Review Board Statement

Not applicable.

Informed Consent Statement

Not applicable.

Data Availability Statement

The data are available on reasonable request.

Conflicts of Interest

The authors declare no conflict of interest. The funders had no role in the design of the study; in the collection, analyses, or interpretation of data; in the writing of the manuscript; or in the decision to publish the results.

Appendix A

Table A1. Relative stress change of the highest maximum principal stress at the distal/middle/mesial connector for a changed connector area of the distal connector. iso: reduction from all directions, gin: gingival reduction, occ: occlusal reduction, lin: lingual reduction, buc: buccal reduction.
Stress Increase in %, When Distal Connector Area 10% ReducedStress Increase in %, When Distal Connector Area 20% Reduced
Dis. ConMid. ConMes. ConDis. ConMid. ConMes. Con
Iso36017701
Gin811−115210
Occ90027−1−1
Lin6103111
Buc6401123−10
Table A2. Relative stress change of the highest maximum principal stress at the distal/middle/mesial connector for a changed connector area of the middle connector. iso: reduction from all directions, gin: gingival reduction, occ: occlusal reduction, lin: lingual reduction, buc: buccal reduction.
Stress Increase in %, When Middle Connector Area 10% ReducedStress Increase in %, When Middle Connector Area 20% Reduced
Dis. ConMid. ConMes. ConDis. ConMid. ConMes. Con
Iso0330371−1
Gin072−51137−6
Occ11334366
Lin0621145
Buc14402101−3
Table A3. Relative stress change of the highest maximum principal stress at the distal/middle/mesial connector for a changed connector area of the mesial connector. iso: reduction from all directions, gin: gingival reduction, occ: occlusal reduction, lin: lingual reduction, buc: buccal reduction.
Stress Increase in %, When Mesial Connector Area 10% ReducedStress Increase in %, When Mesial Connector Area 20% Reduced
Dis. ConMid. ConMes. ConDis. ConMid. ConMes. Con
Iso1−119−1055
Gin−1−1570−1128
Occ−10110424
Lin0450330
Buc0236−1−191

References

  1. Sailer, I.; Pjetursson, B.E.; Zwahlen, M.; Hämmerle, C.H. A systematic review of the survival and complication rates of all-ceramic and metal–ceramic reconstructions after an observation period of at least 3 years. Part II: Fixed dental prostheses. Clin. Oral Implant. Res. 2007, 18, 86–96. [Google Scholar] [CrossRef] [PubMed]
  2. da Silva, L.H.; de Lima, E.; de Paula Miranda, R.B.; Favero, S.S.; Lohbauer, U.; Cesar, P.F. Dental ceramics: A review of new materials and processing methods. Braz. Oral Res. 2017, 31, 133–146. [Google Scholar] [CrossRef] [PubMed]
  3. Zarone, F.; Di Mauro, M.I.; Spagnuolo, G.; Gherlone, E.; Sorrentino, R. Fourteen-year evaluation of posterior zirconia-based three-unit fixed dental prostheses. J. Dent. 2020, 101, 103419. [Google Scholar] [CrossRef] [PubMed]
  4. Laumbacher, H.; Strasser, T.; Knuttel, H.; Rosentritt, M. Long-term clinical performance and complications of zirconia-based tooth-and implant-supported fixed prosthodontic restorations: A summary of systematic reviews. J. Dent. 2021, 111, 103723. [Google Scholar] [CrossRef] [PubMed]
  5. Kim, W.J.; Li, X.C.; Bidra, A.S. Clinical outcomes of implant-supported monolithic zirconia crowns and fixed partial dentures: A systematic review. J. Prosthodont. Implant Esthet. Reconstr. Dent. 2023, 32, 102–107. [Google Scholar] [CrossRef]
  6. Oh, W.S.; Anusavice, K.J. Effect of connector design on the fracture resistance of all-ceramic fixed partial dentures. J. Prosthet. Dent. 2002, 87, 536–542. [Google Scholar] [CrossRef]
  7. Larsson, C.; Holm, L.; Lovgren, N.; Kokubo, Y.; von Steyern, P.V. Fracture strength of four-unit Y-TZP FPD cores designed with varying connector diameter. An in-vitro study. J. Oral Rehabil. 2007, 34, 702–709. [Google Scholar] [CrossRef]
  8. Bahat, Z.; Mahmood, D.J.H.; von Steyern, P.V. Fracture strength of three-unit fixed partial denture cores (Y-TZP) with different connector dimension and design. Swed. Dent. J. 2009, 33, 149–159. [Google Scholar]
  9. Wimmer, T.; Ender, A.; Roos, M.; Stawarczyk, B. Fracture load of milled polymeric fixed dental prostheses as a function of connector cross-sectional areas. J. Prosthet. Dent. 2013, 110, 288–295. [Google Scholar] [CrossRef]
  10. Hamza, T.A.; Attia, M.A.; El-Hossary, M.M.K.; Mosleh, I.E.; Shokry, T.E.; Wee, A.G. Flexural strength of small connector designs of zirconia-based partial fixed dental prostheses. J. Prosthet. Dent. 2016, 115, 224–229. [Google Scholar] [CrossRef]
  11. de Freitas, B.N.; Tonin, B.S.H.; Zaparolli, D.; Faria, A.C.L.; Toniollo, M.B.; Ribeiro, R.F.; Macedo, A.P. Mechanical comparison of milled fiber-reinforced resin composite and Co–Cr frameworks with different connector cross-sectional geometries: An in vitro study. J. Mech. Behav. Biomed. Mater. 2023, 141, 105759. [Google Scholar] [CrossRef] [PubMed]
  12. Alberto, L.H.J.; Kalluri, L.; Esquivel-Upshaw, J.F.; Duan, Y. Three-Dimensional Finite Element Analysis of Different Connector Designs for All-Ceramic Implant-Supported Fixed Dental Prostheses. Ceramics 2022, 5, 34–43. [Google Scholar] [CrossRef]
  13. Almasi, A.; Antoniac, I.; Focsaneanu, S.; Manole, M.; Ciocoiu, R.; Trante, O.; Earar, K.; Saceleanu, A.; Porumb, A.; Ratiu, C. Design Improvement of Y-TZP Three Unit Bridges by Predicted Stress Concentration Using FEA and Experimental Failure Modes after Three Point Bending Test. Rev. Chim. 2019, 70, 336–342. [Google Scholar] [CrossRef]
  14. Möllers, K.; Pätzold, W.; Parkot, D.; Kirsten, A.; Güth, J.-F.; Edelhoff, D.; Fischer, H. Influence of connector design and material composition and veneering on the stress distribution of all-ceramic fixed dental prostheses: A finite element study. Dent. Mater. 2011, 27, e171–e175. [Google Scholar] [CrossRef]
  15. Lakshmi, R.D.; Abraham, A.; Sekar, V.; Hariharan, A. Influence of connector dimensions on the stress distribution of monolithic zirconia and lithium-di-silicate inlay retained fixed dental prostheses—A 3D finite element analysis. Tanta Dent. J. 2015, 12, 56–64. [Google Scholar] [CrossRef]
  16. Demoly, F.; Roth, S. Knowledge-based parametric CAD models of configurable biomechanical structures using geometric skeletons. Comput. Ind. 2017, 92, 104–117. [Google Scholar] [CrossRef]
  17. Bos, E.; Scholten, T.; Song, Y.; Verlinden, J.; Wolff, J.; Forouzanfar, T.; Helder, M.; Van Zuijlen, P. Developing a parametric ear model for auricular reconstruction: A new step towards patient-specific implants. J. Cranio-Maxillofac. Surg. 2015, 43, 390–395. [Google Scholar] [CrossRef]
  18. Jemaa, H.; Eisenburger, M.; Greuling, A. Semi-automated generation of bone loss defects around dental implants and its application in finite element analysis. Comput. Methods Biomech. Biomed. Eng. 2023, 1–12. [Google Scholar] [CrossRef]
  19. Dittmer, M.P.; Borchers, L.; Stiesch, M.; Kohorst, P. Stresses and distortions within zirconia-fixed dental prostheses due to the veneering process. Acta Biomater. 2009, 5, 3231–3239. [Google Scholar] [CrossRef]
  20. Dittmer, M.P.; Kohorst, P.; Borchers, L.; Schwestka-Polly, R.; Stiesch, M. Stress analysis of an all-ceramic FDP loaded according to different occlusal concepts. J. Oral Rehabil. 2011, 38, 278–285. [Google Scholar] [CrossRef]
  21. Dittmer, M.P.; Kohorst, P.; Borchers, L.; Stiesch-Scholz, M. Finite element analysis of a four-unit all-ceramic fixed partial denture. J. Prosthodont. 2009, 5, 1349–1355. [Google Scholar] [CrossRef] [PubMed]
  22. Rand, A.; Kohorst, P.; Greuling, A.; Borchers, L.; Stiesch, M. Stress Distribution in All-Ceramic Posterior 4-Unit Fixed Dental Prostheses Supported in Different Ways: Finite Element Analysis. Implant Dent. 2016, 25, 485–491. [Google Scholar] [CrossRef] [PubMed]
  23. Sarafidou, K.; Stiesch, M.; Dittmer, M.P.; Borchers, L.; Kohorst, P. Load-bearing capacity of implant-supported, tooth-supported, and combined zirconia-fixed dental prostheses. Implant Dent. 2011, 20, 311–317. [Google Scholar] [CrossRef]
  24. Sarafidou, K.; Stiesch, M.; Dittmer, M.P.; Jörn, D.; Borchers, L.; Kohorst, P. Load-bearing capacity of artificially aged zirconia fixed dental prostheses with heterogeneous abutment supports. Clin. Oral Investig. 2012, 16, 961–968. [Google Scholar] [CrossRef] [PubMed]
  25. Guthe, M.; Borodin, P.; Klein, R. Fast and Accurate Hausdorff Distance Calculation between Meshes. J. WSCG 2005, 13, 41–48. [Google Scholar]
  26. Roffmann, O.; Stiesch, M.; Greuling, A. Preventing stress singularities in peri-implant bone—A finite element analysis using a graded bone. Comput. Methods Biomech. Biomed. Eng. 2023, 1–11. [Google Scholar] [CrossRef]
  27. de la Rosa Castolo, G.; Guevara Perez, S.V.; Arnoux, P.J.; Badih, L.; Bonnet, F.; Behr, M. Mechanical strength and fracture point of a dental implant under certification conditions: A numerical approach by finite element analysis. J. Prosthet. Dent. 2018, 119, 611–619. [Google Scholar] [CrossRef]
  28. Denisova, L. The use of acoustic microscopy to study the mechanical properties of glass-ionomer cement. Dent. Mater. 2004, 20, 358–363. [Google Scholar] [CrossRef]
  29. Piconi, C.; Maccauro, G. Zirconia as a ceramic biomaterial. Biomaterials 1999, 20, 1–25. [Google Scholar] [CrossRef]
  30. Ko, C.C.; Chu, C.S.; Chung, K.H.; Lee, M.C. Effects of posts on dentin stress distribution in pulpless teeth. J. Prosthet. Dent. 1992, 68, 421–427. [Google Scholar] [CrossRef]
  31. Osman, M.L.M.; Lim, T.W.; Chang, H.-C.; Ab Ghani, A.R.; Tsoi, J.K.H.; Ab Ghani, S.M. Structural Integrity of Anterior Ceramic Resin-Bonded Fixed Partial Denture: A Finite Element Analysis Study. J. Funct. Biomater. 2023, 14, 108. [Google Scholar] [CrossRef] [PubMed]
  32. Arinc, H. Effects of Prosthetic Material and Framework Design on Stress Distribution in Dental Implants and Peripheral Bone: A Three-Dimensional Finite Element Analysis. Med. Sci. Monit. 2018, 24, 4279–4287. [Google Scholar] [CrossRef] [PubMed]
  33. Yamanishi, Y.; Yamaguchi, S.; Imazato, S.; Nakano, T.; Yatani, H. Influences of implant neck design and implant-abutment joint type on peri-implant bone stress and abutment micromovement: Three-dimensional finite element analysis. Dent. Mater. 2012, 28, 26–33. [Google Scholar] [CrossRef]
  34. Magne, P. Efficient 3D finite element analysis of dental restorative procedures using micro-CT data. Dent. Mater. 2007, 23, 539–548. [Google Scholar] [CrossRef] [PubMed]
  35. Chun, H.J.; Cheong, S.Y.; Han, J.H.; Heo, S.J.; Chung, J.P.; Rhyu, I.C.; Choi, Y.C.; Baik, H.K.; Ku, Y.; Kim, M.H. Evaluation of design parameters of osseointegrated dental implants using finite element analysis. J. Oral Rehabil. 2002, 29, 565–574. [Google Scholar] [CrossRef] [PubMed]
  36. Eskitascioglu, G.; Usumez, A.; Sevimay, M.; Soykan, E.; Unsal, E. The influence of occlusal loading location on stresses transferred to implant-supported prostheses and supporting bone: A three-dimensional finite element study. J. Prosthet. Dent. 2004, 91, 144–150. [Google Scholar] [CrossRef]
  37. Schindler, H.J.; Stengel, E.; Spiess, W.E.L. Feedback control during mastication of solid food textures—A clinical-experimental study. J. Prosthet. Dent. 1998, 80, 330–336. [Google Scholar] [CrossRef]
  38. Van der Bilt, A. Assessment of mastication with implications for oral rehabilitation: A review. J. Oral Rehabil. 2011, 38, 754–780. [Google Scholar] [CrossRef]
  39. Geng, J.-P.; Tan, K.B.C.; Liu, G.-R. Application of finite element analysis in implant dentistry: A review of the literature. J. Prosthet. Dent. 2001, 85, 585–598. [Google Scholar] [CrossRef]
  40. Chang, C.L.; Chen, C.S.; Huang, C.H.; Hsu, M.L. Finite element analysis of the dental implant using a topology optimization method. Med. Eng. Phys. 2012, 34, 999–1008. [Google Scholar] [CrossRef]
  41. Datte, C.-E.; Nishioka, R.-S.; Bottino, M.-A.; Evangelhista, A.-D.M.; Monteiro, F.M.d.M. Influence of different restorative materials on the stress distribution in dental implants. J. Clin. Exp. Dent. 2018, 10, e439. [Google Scholar] [CrossRef] [PubMed]
  42. Rand, A.; Stiesch, M.; Eisenburger, M.; Greuling, A. The effect of direct and indirect force transmission on peri-implant bone stress—A contact finite element analysis. Comput. Methods Biomech. Biomed. Eng. 2017, 20, 1132–1139. [Google Scholar] [CrossRef] [PubMed]
Figure 1. Overview of the proposed algorithm.
Dentistry 11 00252 g001
Figure 2. Illustration of substeps for the automatic detection of connectors. Thirty intersecting curves are shown in steps b and c for better visualization, whereas the calculation used 300 intersecting curves. (a) Bounding box B0, L1 connects the distal and mesial faces fdistal/mesial. (b) Intersection curves Ci. (c) Bounding rectangles Ri-occlusal and Ri-gingival. (d) Surface area plots of bounding rectangles with local minima αj and βj. (e) Found connector planes EdisCon, EmidCon and EmesCon.
Dentistry 11 00252 g002
Figure 4. Configuration of the investigated model. (a) Boundary conditions. (b) Mesh of the FE-model. (c) Dimensions of the implant system used in this study.
Dentistry 11 00252 g004
Figure 5. Principal stress behaviour along the length (distal−mesial direction) of the 4−unit FPD without altered connector regions (reference). The main peaks occur at the 3 connector regions.
Dentistry 11 00252 g005
Figure 6. Principal stress behaviour along the length (distal–mesial direction) of the 4-unit FPD for a connector area reduction at either the distal, middle or mesial connector. The connector area was reduced by 10% or 20% from either all (iso), gingival (gin), occlusal (occ), lingual (lin) or the buccal (buc) direction. The stresses are only shown around the connector site where the connector area reduction took place (e.g., the image ‘Distal connector’ shows stresses around the distal connector for geometries with altered distal connectors). The stresses at the non-altered connectors were only mildly affected and are not shown here for clarity.
Dentistry 11 00252 g006
Disclaimer/Publisher’s Note: The statements, opinions and data contained in all publications are solely those of the individual author(s) and contributor(s) and not of MDPI and/or the editor(s). MDPI and/or the editor(s) disclaim responsibility for any injury to people or property resulting from any ideas, methods, instructions or products referred to in the content.

