

Dental Maturation in Two Groups of Children Born in 1969–1973 and 2005–2010


Abstract
: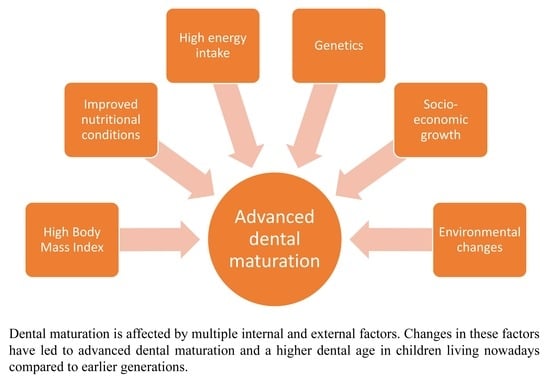
1. Introduction
2. Material and Methods
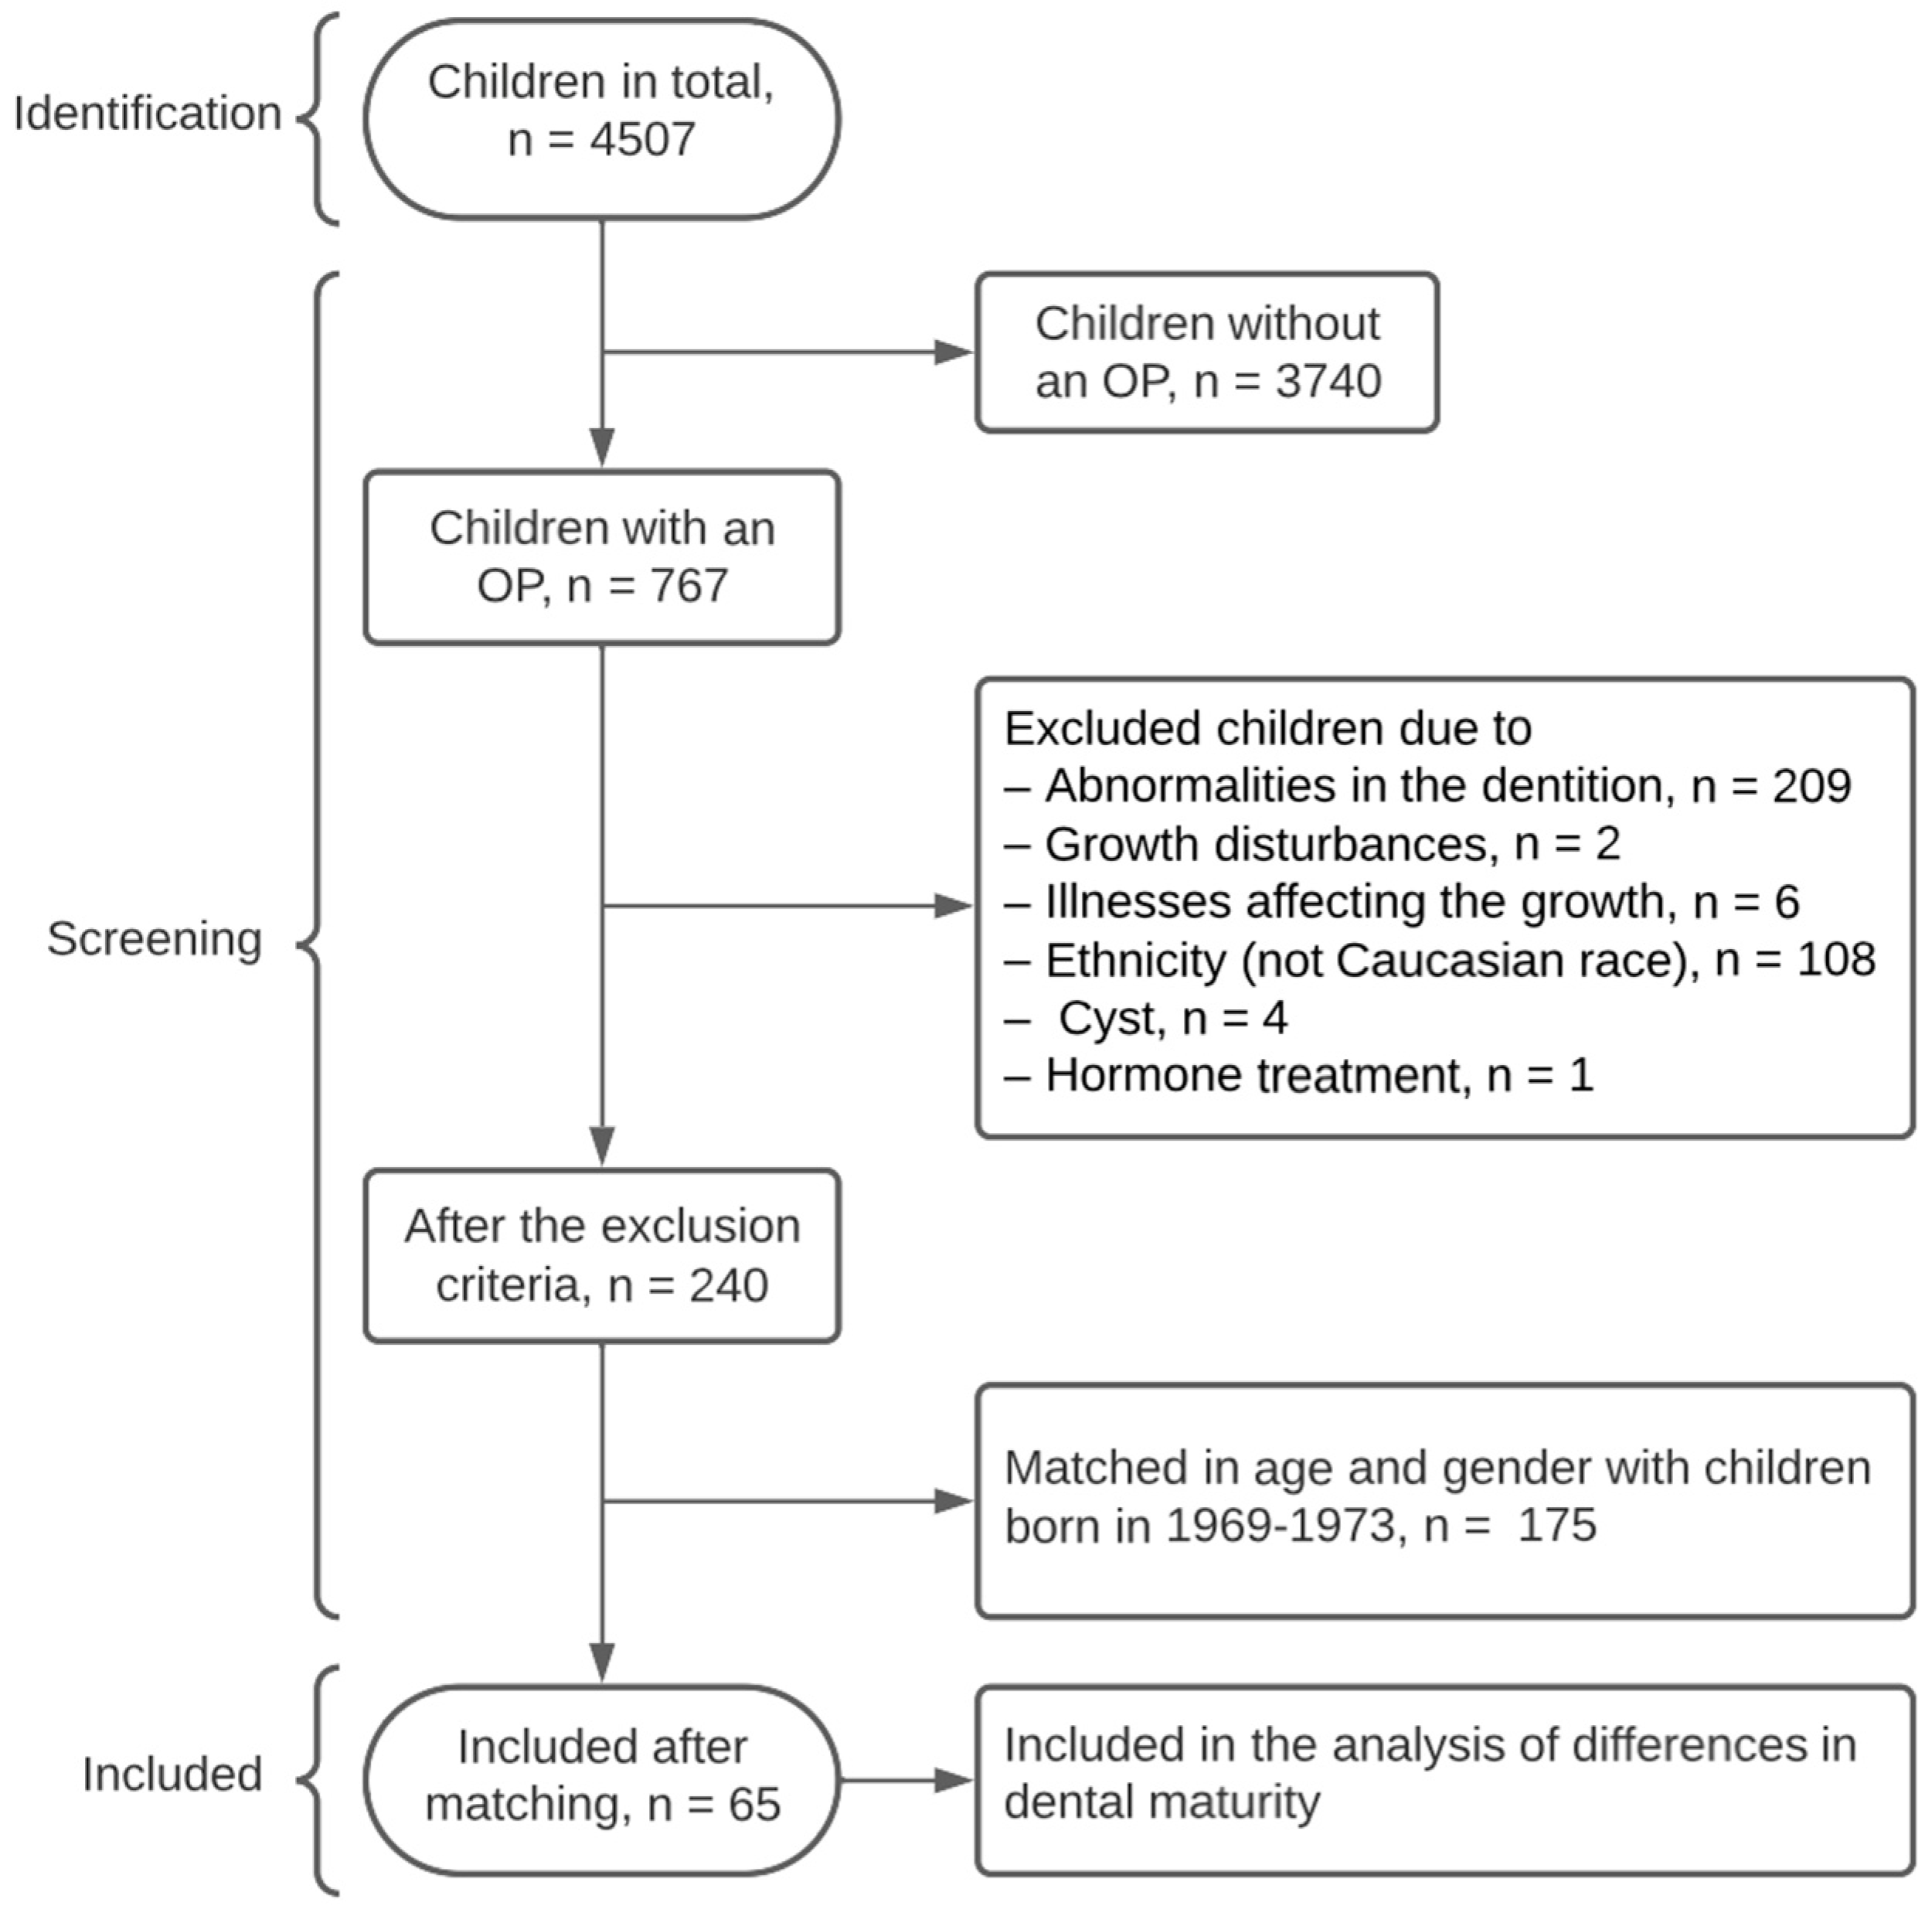
2.1. Subjects
2.2. Methods
2.2.1. Dental Maturation
2.2.2. Demirjian
2.2.3. Haavikko
2.3. Statistical Analysis
2.4. Reliability
3. Results
4. Discussion
5. Conclusions
Author Contributions
Funding
Institutional Review Board Statement
Informed Consent Statement
Data Availability Statement
Acknowledgments
Conflicts of Interest
References
- Caspersen, L.M.; Sonnesen, L. Secular trend in the skeletal maturation in relation to peak height velocity—A comparison between two groups of children born 1969–1973 and 1996–2000. Eur. J. Orthod. 2020, 15, cjz098. [Google Scholar] [CrossRef]
- Jääsaari, P.; Tolvanen, M.; Niinikoski, H.; Karjalainen, S. Advanced dental maturity of Finnish 6- to 12-yr-old children is associated with high energy intake. Eur. J. Oral. Sci. 2016, 124, 465–471. [Google Scholar] [CrossRef] [PubMed]
- Holtgrave, E.A.; Kretschmer, R.; Müller, R. Acceleration in dental development; fact or fiction. Eur. J. Orthod. 1997, 19, 703–710. [Google Scholar] [CrossRef] [PubMed]
- Eckert-Lind, C.; Busch, A.S.; Petersen, J.H.; Biro, F.M.; Butler, G.; Bräuner, E.V.; Juul, A. Worldwide Secular Trends in Age at Pubertal Onset Assessed by Breast Development Among Girls: A Systematic Review and Meta-analysis. JAMA Pediatr. 2020, 174, e195881. [Google Scholar] [CrossRef]
- Stagi, S.; De Masi, S.; Bencini, E.; Losi, S.; Paci, S.; Parpagnoli, M.; Ricci, F.; Ciofi, D.; Azzari, C. Increased incidence of precocious and accelerated puberty in females during and after the Italian lockdown for the coronavirus 2019 (COVID-19) pandemic. Ital. J. Pediatr. 2020, 46, 165. [Google Scholar] [CrossRef]
- Svanholt, M.; Kjær, I. Developmental stages of permanent canines, premolars, and 2nd molars in 244 Danish children. Acta Odontol. Scand. 2008, 66, 342–350. [Google Scholar] [CrossRef]
- Macha, M.; Lamba, B.; Avula, J.S.S.; Muthineni, S.; Margana, P.G.J.S.; Chitoori, P. Estimation of Correlation between Chronological Age, Skeletal Age and Dental Age in Children: A Cross-sectional Study. J. Clin. Diagn. Res. 2017, 11, ZC01–ZC04. [Google Scholar] [CrossRef]
- Krailassiri, S.; Anuwongnukroh, N.; Dechkunakorn, S. Relationships between dental calcification stages and skeletal maturity indicators in Thai individuals. Angle Orthod. 2002, 72, 155–166. [Google Scholar]
- Różyło-Kalinowska, I.; Kiworkowa-Rączkowska, E.; Kalinowski, P. Dental age in central Poland. Forensic Sci. Int. 2008, 74, 207–216. [Google Scholar] [CrossRef]
- Liversidge, H.M. Dental maturation of 18th and 19th century British children using Demirjian’s method. Int. J. Paediatr. Dent. 1999, 9, 111–115. [Google Scholar] [CrossRef]
- Sasso, A.; Špalj, S.; Maričić, B.M.; Sasso, A.; Ćabov, T.; Legović, M. Secular trend in dental development of permanent teeth in a population of Istria and the Littoral region of Croatia. J. Forensic Sci. 2013, 58, 673–677. [Google Scholar] [CrossRef] [PubMed]
- Chertkow, S. Tooth mineralization as an indicator of the pubertal growth spurt. Am. J. Orthod. Dentofac. Orthop. 1989, 77, 79–91. [Google Scholar] [CrossRef] [PubMed]
- Demirjian, A.; Buschang, P.; Tanguay, R.; Patterson, D. Interrelationships among measures of somatic, skeletal, dental, and sexual maturity. Am. J. Orthod. Dentofac. Orthop. 1985, 88, 433–438. [Google Scholar] [CrossRef]
- de Muinck Keizer-Schrama, S.M.P.F.; Mul, D. Trends in pubertal development in Europe. Hum. Reprod. Update 2001, 7, 287–291. [Google Scholar] [CrossRef] [PubMed]
- Shalitin, S.; Gat-Yablonski, G. Associations of Obesity with Linear Growth and Puberty. Horm. Res. Paediatr. 2022, 95, 120–136. [Google Scholar] [CrossRef]
- Modesto, A.; Jacas, C.A.; Kim, S.M.; Desman, A.; West, I.; Lebow, M.; Littlejohn, C.; Deeley, K.; Studen-Pavlovich, D.; Vieira, A.R. Childhood Obesity, Genetic Variation, and Dental Age. Pediatr. Dent. 2019, 41, 132–135. [Google Scholar] [PubMed]
- Mack, K.B.; Phillips, C.; Jain, N.; Koroluk, L.D. Relationship between body mass index percentile and skeletal maturation and dental development in orthodontic patients. Am. J. Orthod. Dentofac. Orthop. 2013, 143, 228–234. [Google Scholar] [CrossRef]
- Gelbrich, B.; Hirsch, A.; Dannhauer, K.-H.; Gelbrich, G. Agenesis of second premolars and delayed dental development. J. Orofac. Orthop. 2015, 76, 338–350. [Google Scholar] [CrossRef]
- Klein, O.D.; Oberoi, S.; Huysseune, A.; Hovorakova, M.; Peterka, M.; Peterkova, R. Developmental disorders of the dentition: An update. Am. J. Med. Genet. C Sem. Med. Genet. 2013, 163C, 318–332. [Google Scholar] [CrossRef]
- Malina, R.M. Research on secular trends in auxology. Anthr. Anz. 1990, 48, 209–227. [Google Scholar] [CrossRef]
- Demirjian, A.; Goldstein, H.; Tanner, J.M. A new system of dental age assessment. Hum. Biol. 1973, 45, 211–227. [Google Scholar] [PubMed]
- Haavikko, K. The formation and the alveolar and clinical eruption of the permanent teeth: An orthopantomographic study. Suom. Hammaslaakariseuran Toim. Fin. Tandlakarsallskapets Forh. 1970, 63, 103–170. [Google Scholar]
- Hess, A.S.; Hess, J.R. Linear regression and correlation. Transfusion 2017, 57, 9–11. [Google Scholar] [CrossRef] [PubMed]
- Landis, J.R.; Koch, G.G. The measurement of observer agreement for categorical data. Biometrics 1977, 33, 159–174. [Google Scholar] [CrossRef]
- Kaygisiz, E.; Uzuner, F.D.; Yeniay, A.; Darendeliler, N. Secular trend in the maturation of permanent teeth in a sample of Turkish children over the past 30 years. Forensic Sci. Int. 2016, 259, 155–160. [Google Scholar] [CrossRef]
- Jayaraman, J.; Wong, H.M.; King, N.; Roberts, G. Secular trends in the maturation of permanent teeth in 5 to 6 years old children. Am. J. Hum. Biol. 2013, 25, 329–334. [Google Scholar] [CrossRef] [PubMed]
- Rousset, M.-M.; Boualam, N.; Delfosse, C.; Roberts, W.E. Emergence of permanent teeth: Secular trends and variance in a modern sample. J. Dent. Child. 2003, 70, 208–214. [Google Scholar]
- Chaillet, N.; Nyström, M.; Demirjian, A. Comparison of dental maturity of children of different ethnic origins: International maturity curves for clinicians. J. Forensic Sci. 2005, 50, 1164–1174. [Google Scholar] [CrossRef] [PubMed]
- Jayaraman, J.; Roberts, G.J. Comparison of maturation in Hong Kong Chinese and United Kingdom Caucasian populations. Forensic Sci. Int. 2018, 292, 61–70. [Google Scholar] [CrossRef]
- Björk, A.; Skieller, V. Facial development and tooth eruption. Mondo Ortod. 1977, 19, 29–63. [Google Scholar]
- Makino, E.; Tsujino, K.; Ishii, T.; Shintani, S.; Sueishi, K. Difference in bilateral timing of eruption of permanent teeth. Bull. Tokyo Dent. Coll. 2018, 59, 277–284. [Google Scholar] [CrossRef] [PubMed]
- Govindraju, P.; Chandra, P. Radiomorphometric Indices of the Mandible—An Indicator of Osteoporosis. J. Clin. Diagn. Res. 2014, 8, 195–198. [Google Scholar] [CrossRef]
- Farman, A.G.; Avant, S.L.; Scarfe, W.C.; Farman, T.T.; Green, D.B. In vivo comparison of Visualix-2 and Ektaspeed Plus in the assessment of periradicular lesion dimensions. Oral. Surg. Oral. Med. Oral. Pathol. Oral. Radiol. Endod. 1998, 85, 203–209. [Google Scholar] [CrossRef] [PubMed]
- Suri, L.; Gagari, E.; Vastardis, H. Delayed tooth eruption: Pathogenesis, diagnosis, and treatment. A literature review. Am. J. Orthod. Dentofac. Orthop. 2004, 126, 432–445. [Google Scholar] [CrossRef] [PubMed]
- Mappes, M.S.; Harris, E.F.; Behrents, R.G. An example of regional variation in the tempos of tooth mineralization and hand-wrist ossification. Am. J. Orthod. Dentofac. Orthop. 1992, 101, 145–151. [Google Scholar] [CrossRef] [PubMed]
- OECD. OECD Economic Surveys: Denmark 2019; OECD Publishing: Paris, France, 2019. [Google Scholar] [CrossRef]
- IMF (International Monetary Fund). Central, Eastern, Southeastern Europe: A Broadening Recovery; Regional Economic Issues; IMF: Washington, DC, USA, 2017; Available online: https://www.imf.org/en/Publications/REO/EU/Issues/2017/05/10/a-broadening-recovery (accessed on 7 February 2023).
- Ochoa, B.K.; Nanda, R.S. Comparison of maxillary and mandibular growth. Am. J. Orthod. Dentofac. Orthop. 2004, 125, 148–159. [Google Scholar] [CrossRef] [PubMed]
- Shi, L.; Zhou, Y.; Lu, T.; Fan, F.; Zhu, L.; Suo, Y.; Chen, Y.; Deng, Z. Dental age estimation of Tibetan children and adolescents: Comparison of Demirjian, Willems methods and a newly modified Demirjian method. Leg. Med. 2022, 55, 102013. [Google Scholar] [CrossRef]
- Ishwarkumar, S.; Pillay, P.; Chetty, M.; Satyapal, K.S. The Application of the Cameriere’s Methodologies for Dental Age Estimation in a Select KwaZulu-Natal Population of South Africa. Dent. J. 2022, 10, 130. [Google Scholar] [CrossRef]


| Age in Years | Number of Subjects | ||
|---|---|---|---|
| Girls (n, (%)) | Boys (n, (%)) | Total (n, (%)) | |
| 7 | 7 (23.33) | 1 (2.86) | 8 (12.31) |
| 8 | 12 (40) | 19 (54.28) | 31 (47.69) |
| 9 | 3 (10) | 7 (20) | 10 (15.38) |
| 10 | 3 (10) | 2 (5.71) | 5 (7.69) |
| 11 | 3 (10) | 1 (2.86) | 4 (6.15) |
| 12 | 2 (6.66) | 3 (8.57) | 5 (7.7) |
| 13 | 0 (0) | 1 (2.86) | 1 (1.54) |
| 14 | 0 (0) | 1 (2.86) | 1 (1.54) |
| Total | 30 (100) | 35 (100) | 65 (100) |
| Age | Sex | Diff (yrs) | Mths | Lower CI | Higher CI | p | n |
|---|---|---|---|---|---|---|---|
| Total | G + B | 0.503 | 6.04 | 0.23 | 0.77 | 0.000 | 130 |
| G | 0.541 | 6.49 | 0.14 | 0.94 | 0.009 | 60 | |
| B | 0.470 | 5.64 | 0.10 | 0.84 | 0.014 | 70 | |
| 11 | G | 0.934 | 11.21 | 0.17 | 1.70 | 0.030 | 6 |
| Tooth | Sex | Mean | Lower CI | Higher CI | t | p |
|---|---|---|---|---|---|---|
| Total | G + B | 0.211 | 0.11 | 0.31 | 4.10 | 0.000 1 |
| G | 0.222 | 0.07 | 0.37 | 2.98 | 0.004 1 | |
| B | 0.202 | 0.06 | 0.35 | 3.18 | 0.007 1 | |
| 33 | G | 0.482 | 0.22 | 0.75 | 3.67 | 0.001 1 |
| B | 0.253 | −0.04 | 0.55 | 1.72 | 0.033 1 | |
| 34 | G | 0.349 | 0.12 | 0.58 | 2.99 | 0.004 1 |
| B | 0.338 | 0.13 | 0.55 | 3.23 | 0.002 1 | |
| 35 | G | 0.415 | 0.18 | 0.65 | 3.55 | 0.001 1 |
| B | 0.285 | 0.04 | 0.53 | 2.32 | 0.024 1 | |
| 37 | G | 0.344 | 0.07 | 0.62 | 2.51 | 0.015 1 |
| B | 0.449 | 0.23 | 0.67 | 4.03 | 0.000 1 |
| Tooth | Sex | Diff | Lower CI | Higher CI | t | p |
|---|---|---|---|---|---|---|
| Total U | G + B | 0.386 | 0.21 | 0.56 | 4.40 | 0.000 1 |
| G | 0.381 | 0.11 | 0.65 | 2.81 | 0.007 1 | |
| B | 0.391 | 0.16 | 0.62 | 3.36 | 0.001 1 | |
| 13/23 | G | 0.427 | 0.10 | 0.76 | 2.61 | 0.012 1 |
| B | 0.482 | 0.15 | 0.82 | 2.87 | 0.005 1 | |
| 14/24 | B | 0.652 | 0.23 | 1.07 | 3.10 | 0.003 1 |
| 15/25 | G | 0.705 | 0.23 | 1.18 | 2.98 | 0.004 1 |
| B | 0.823 | 0.43 | 1.22 | 4.12 | 0.000 1 | |
| 16/26 | B | −0.229 | −0.44 | −0.02 | −2.21 | 0.031 1 |
| Total L | G + B | 0.417 | 0.17 | 0.67 | 3.33 | 0.001 1 |
| G | 0.527 | 0.05 | 1.00 | 2.22 | 0.030 1 | |
| B | 0.322 | 0.09 | 0.55 | 2.79 | 0.007 1 | |
| 33/43 | G | 0.360 | 0.04 | 0.68 | 2.23 | 0.030 1 |
| B | 0.511 | 0.17 | 0.86 | 2.96 | 0.004 1 | |
| 34/44 | G | 0.598 | 0.26 | 0.94 | 3.55 | 0.001 1 |
| B | 0.424 | 0.08 | 0.77 | 2.49 | 0.015 1 | |
| 35/45 | G | 0.435 | 0.07 | 0.80 | 2.39 | 0.020 1 |
| B | 0.538 | 0.12 | 0.96 | 2.56 | 0.013 1 | |
| 37/47 | G | 0.533 | 0.12 | 0.94 | 2.60 | 0.012 1 |
| B | 0.653 | 0.26 | 1.05 | 3.31 | 0.001 1 |
Disclaimer/Publisher’s Note: The statements, opinions and data contained in all publications are solely those of the individual author(s) and contributor(s) and not of MDPI and/or the editor(s). MDPI and/or the editor(s) disclaim responsibility for any injury to people or property resulting from any ideas, methods, instructions or products referred to in the content. |
© 2023 by the authors. Licensee MDPI, Basel, Switzerland. This article is an open access article distributed under the terms and conditions of the Creative Commons Attribution (CC BY) license (https://creativecommons.org/licenses/by/4.0/).
Share and Cite
Poulsen, A.R.; Sonnesen, L. Dental Maturation in Two Groups of Children Born in 1969–1973 and 2005–2010. Dent. J. 2023, 11, 248. https://doi.org/10.3390/dj11110248
Poulsen AR, Sonnesen L. Dental Maturation in Two Groups of Children Born in 1969–1973 and 2005–2010. Dentistry Journal. 2023; 11(11):248. https://doi.org/10.3390/dj11110248
Chicago/Turabian StylePoulsen, Astrid Rathcke, and Liselotte Sonnesen. 2023. "Dental Maturation in Two Groups of Children Born in 1969–1973 and 2005–2010" Dentistry Journal 11, no. 11: 248. https://doi.org/10.3390/dj11110248