
Interactions of an Artificial Zinc Finger Protein with Cd(II) and Hg(II): Competition and Metal and DNA Binding

Abstract
:1. Introduction
2. Results and Discussion
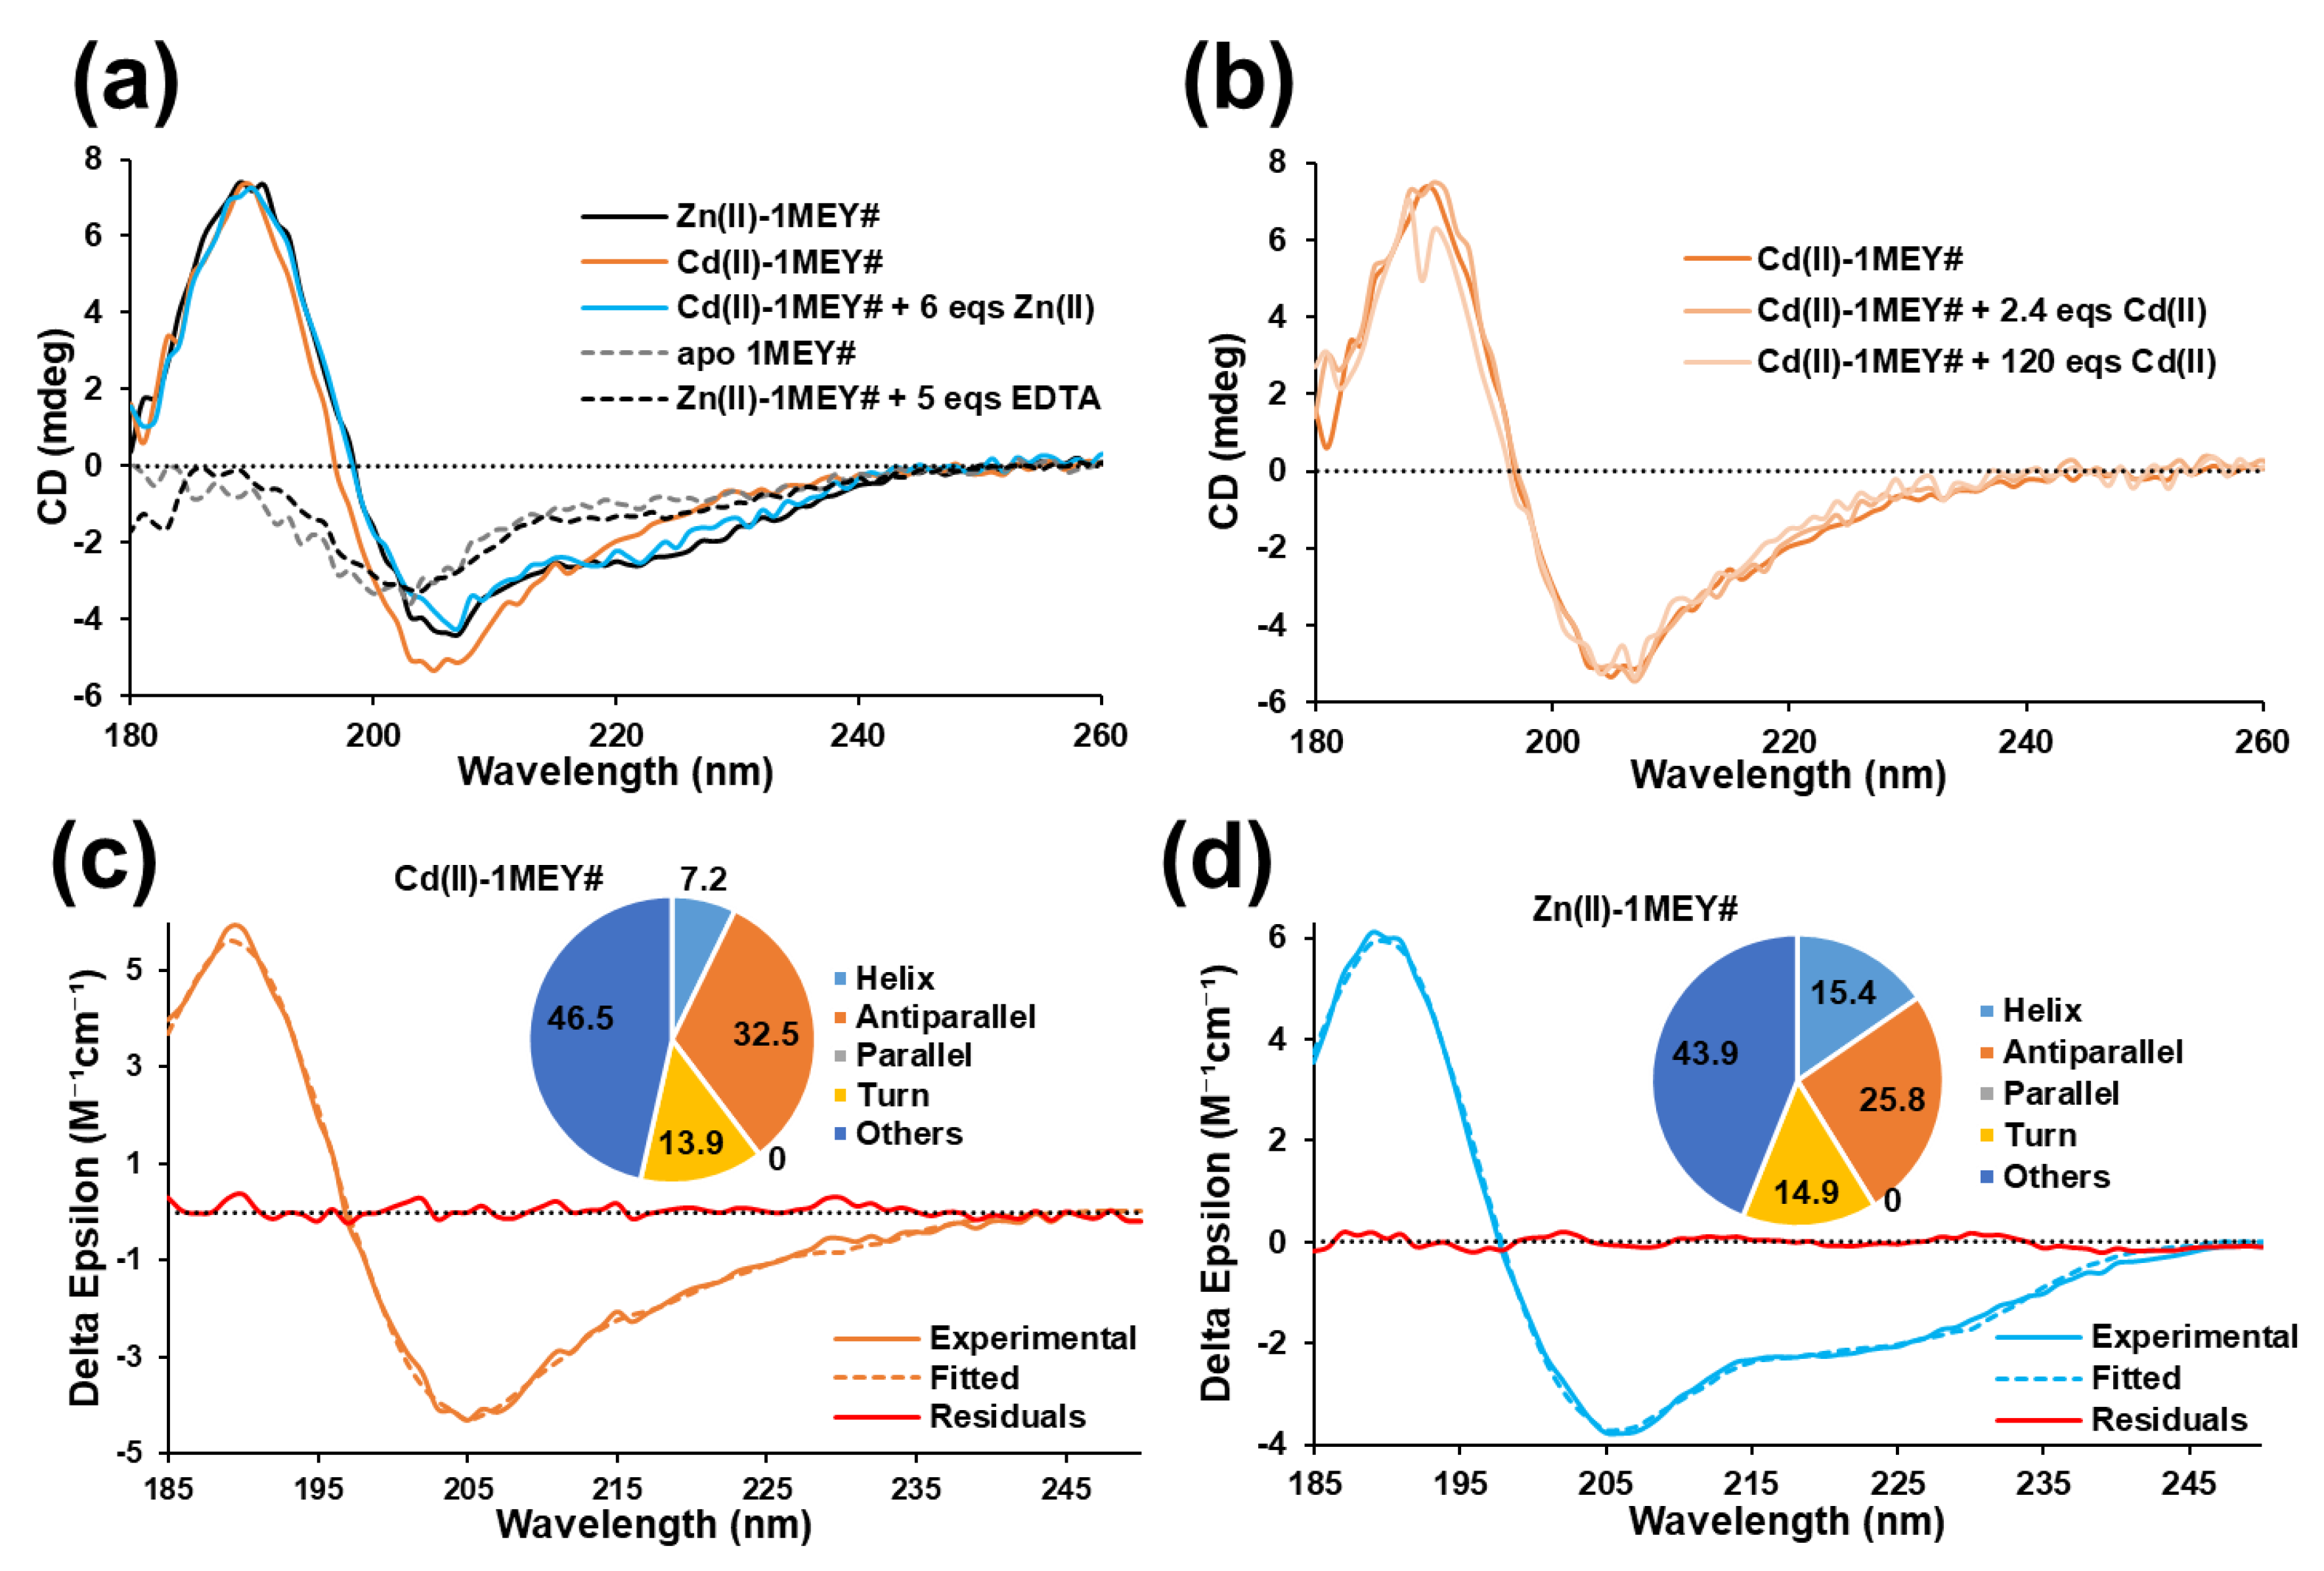
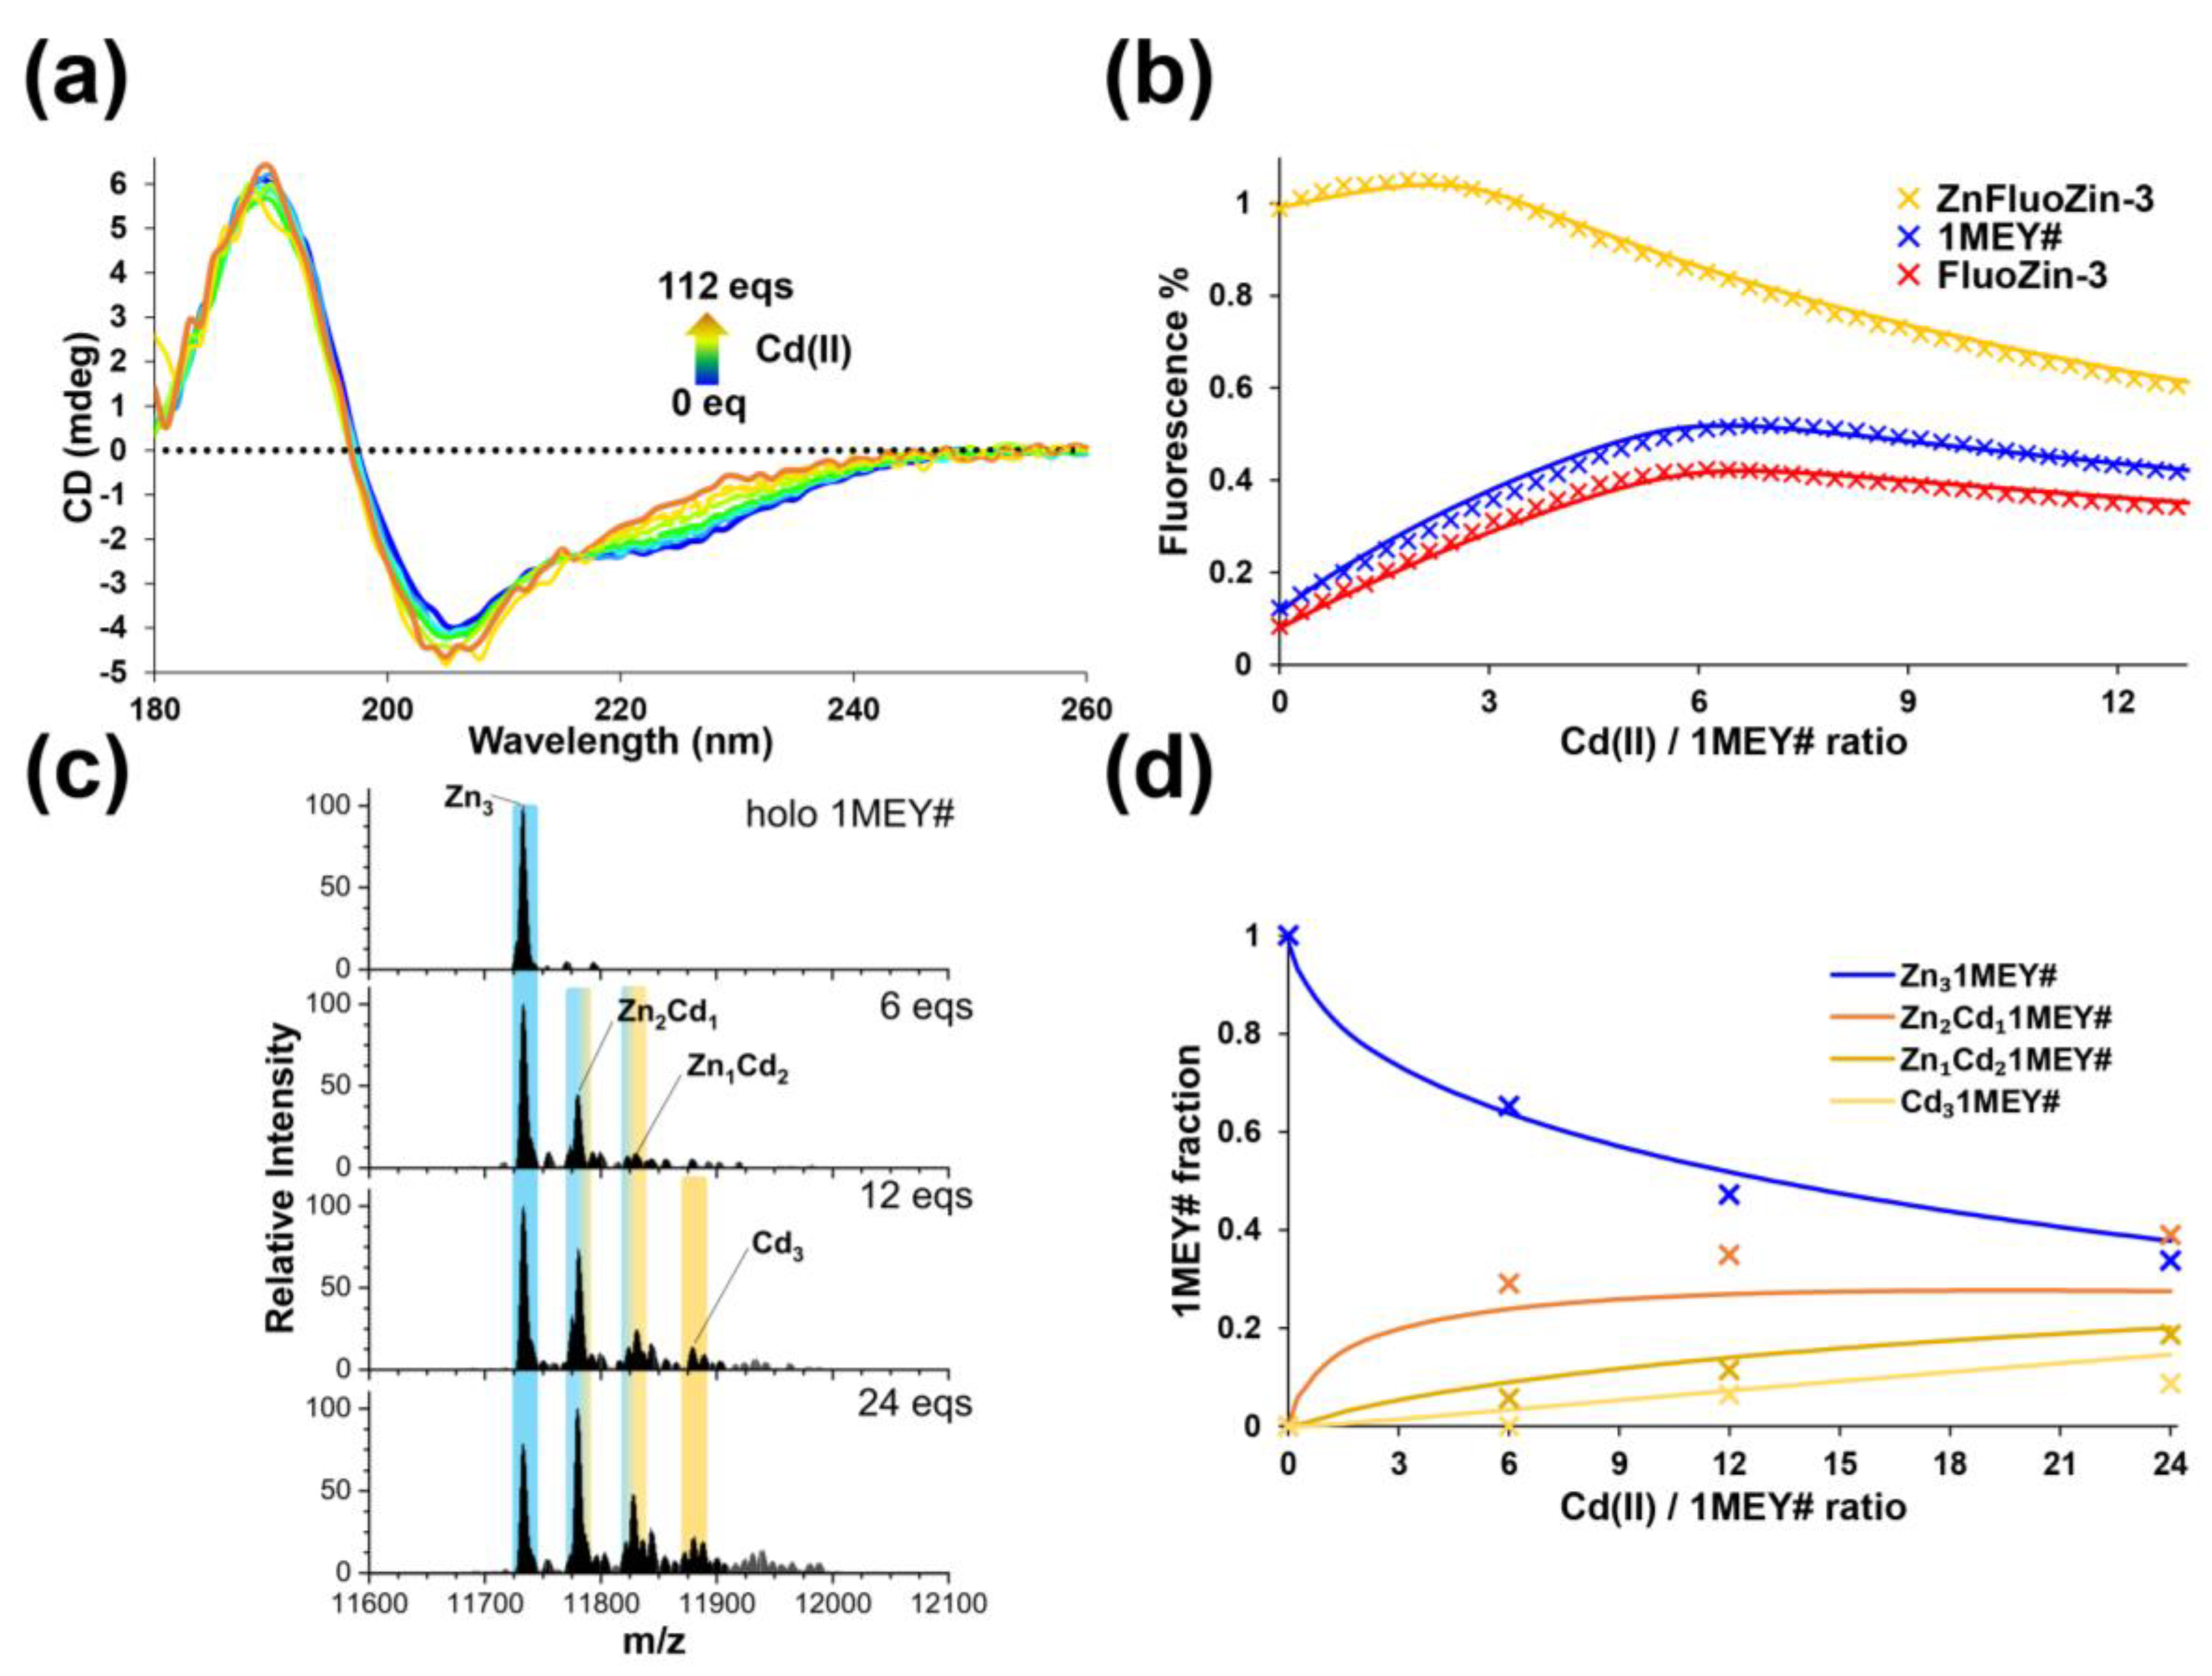
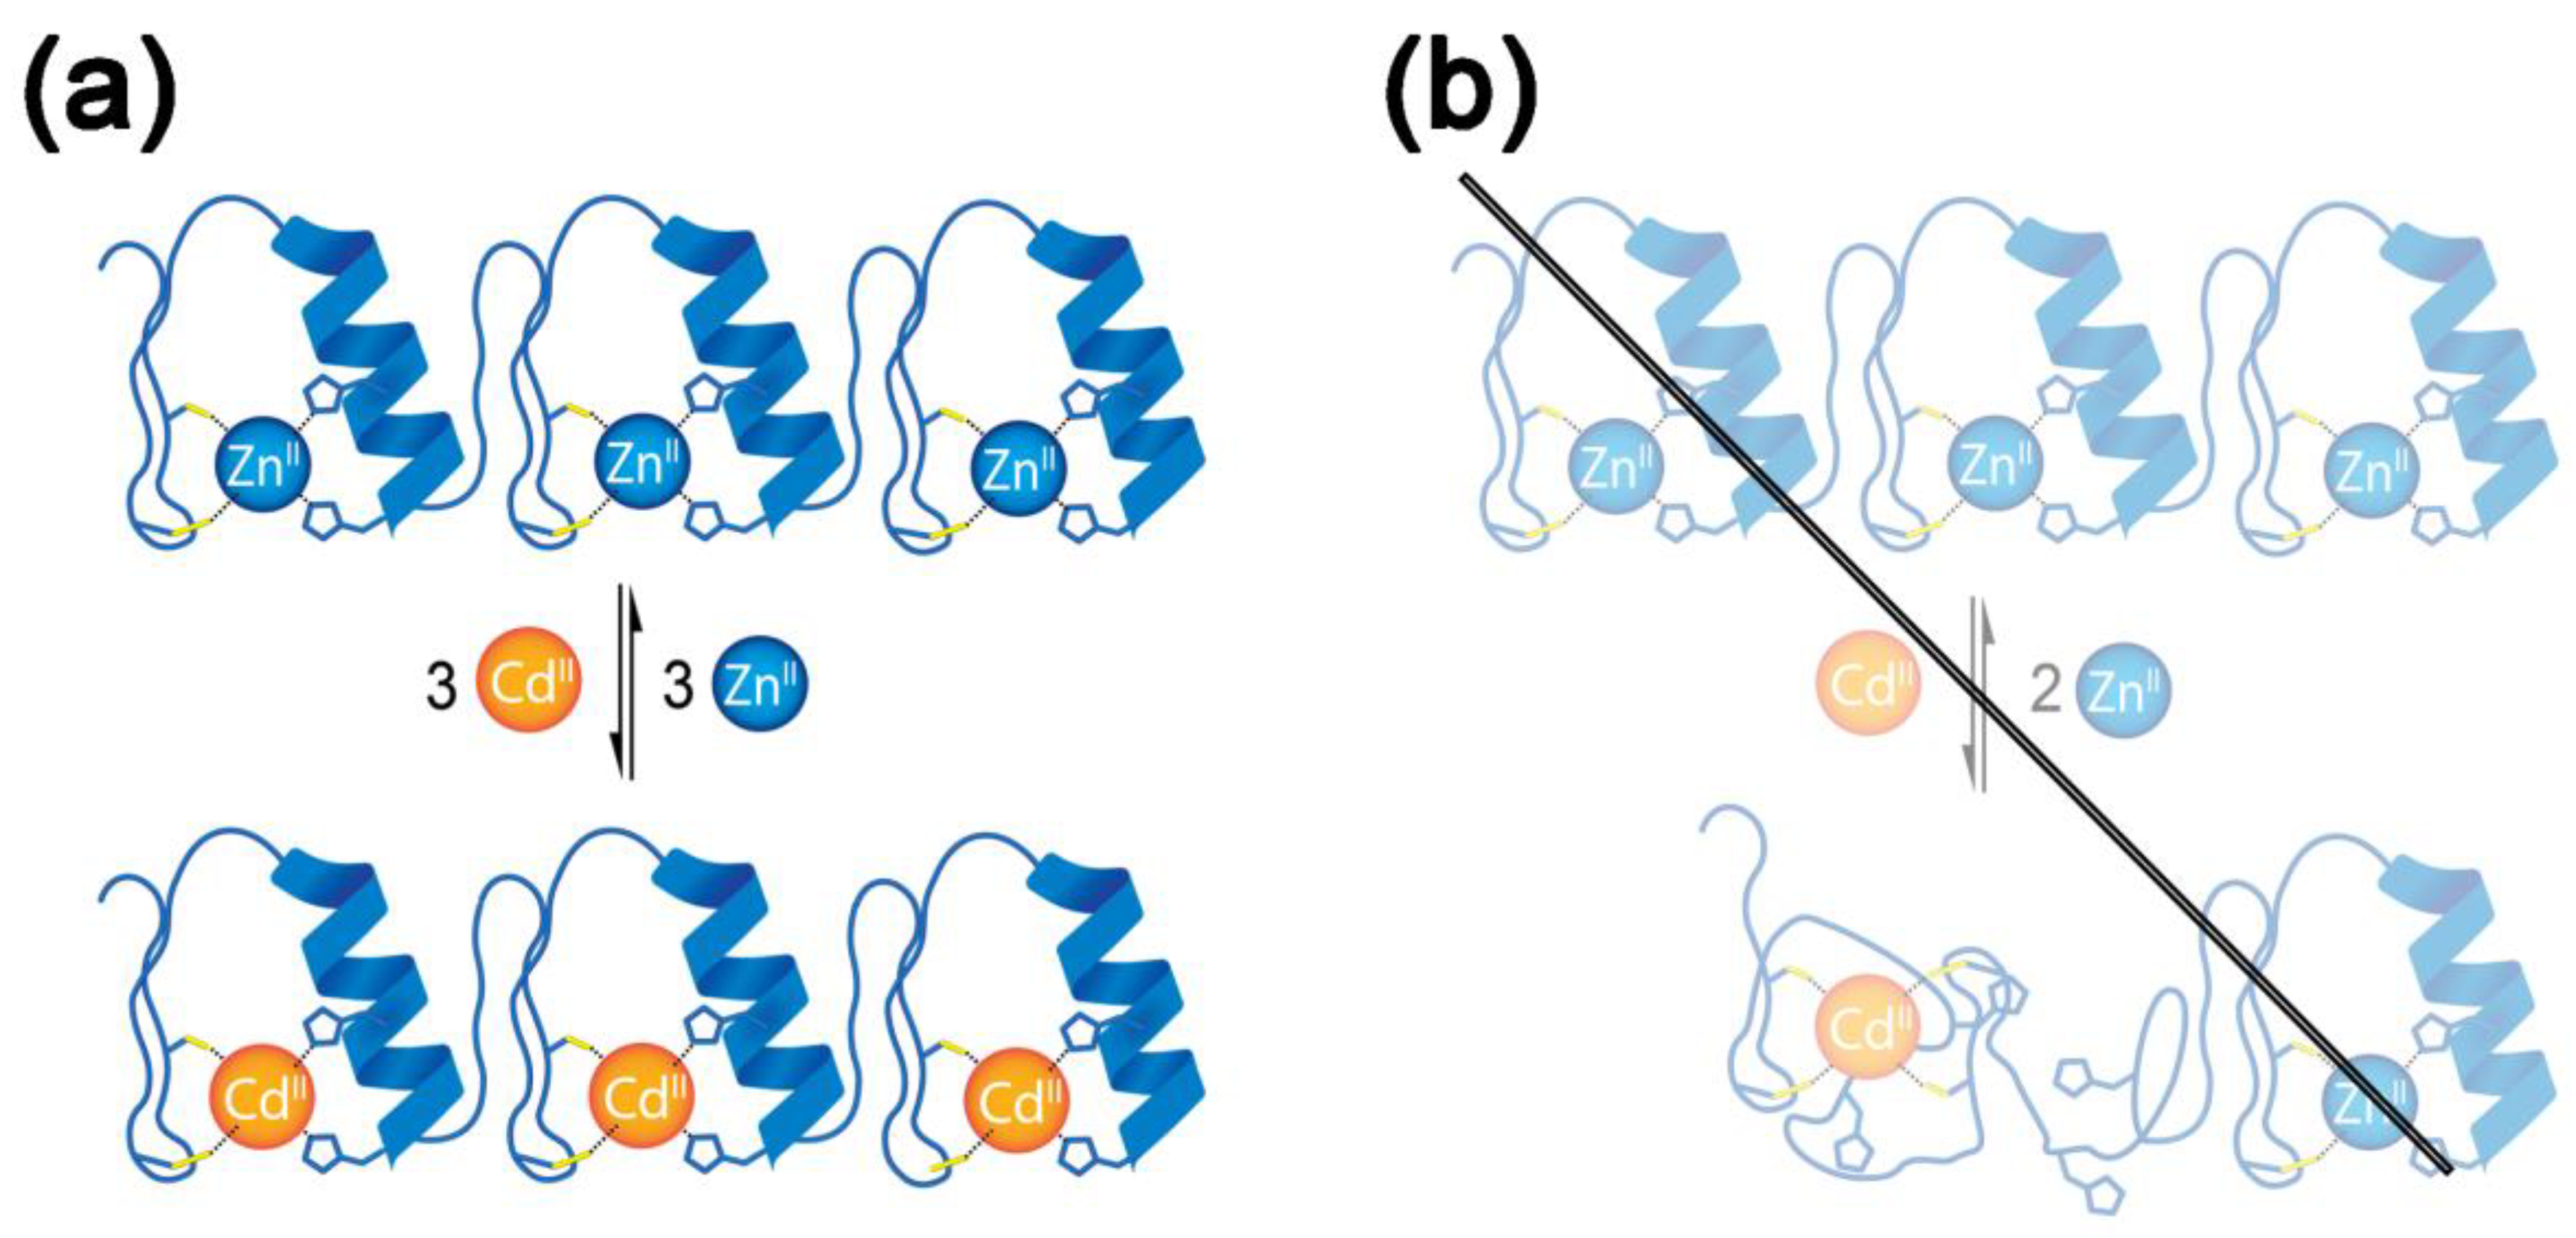
2.1. Interaction of 1MEY# Zinc Finger Protein with Cd(II)
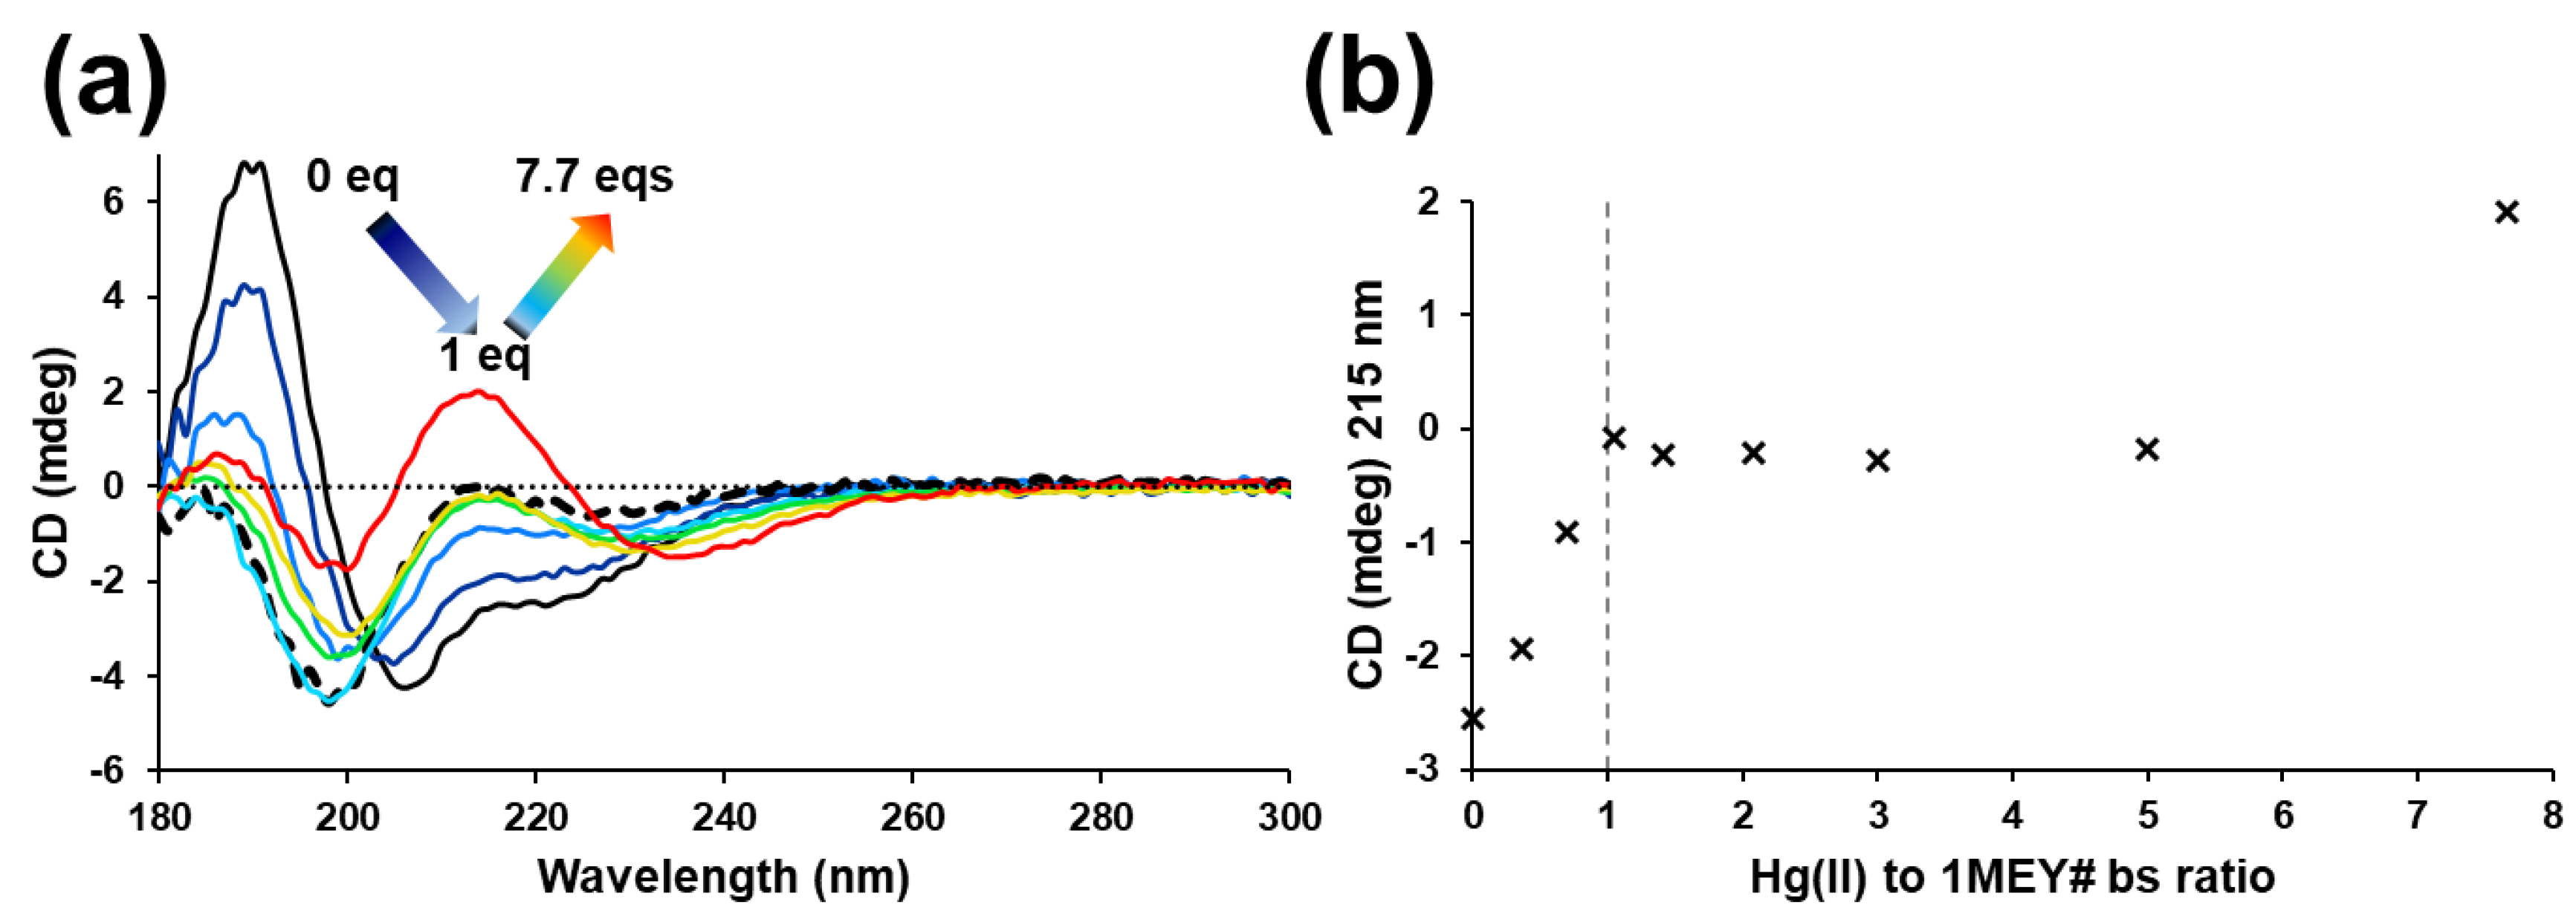
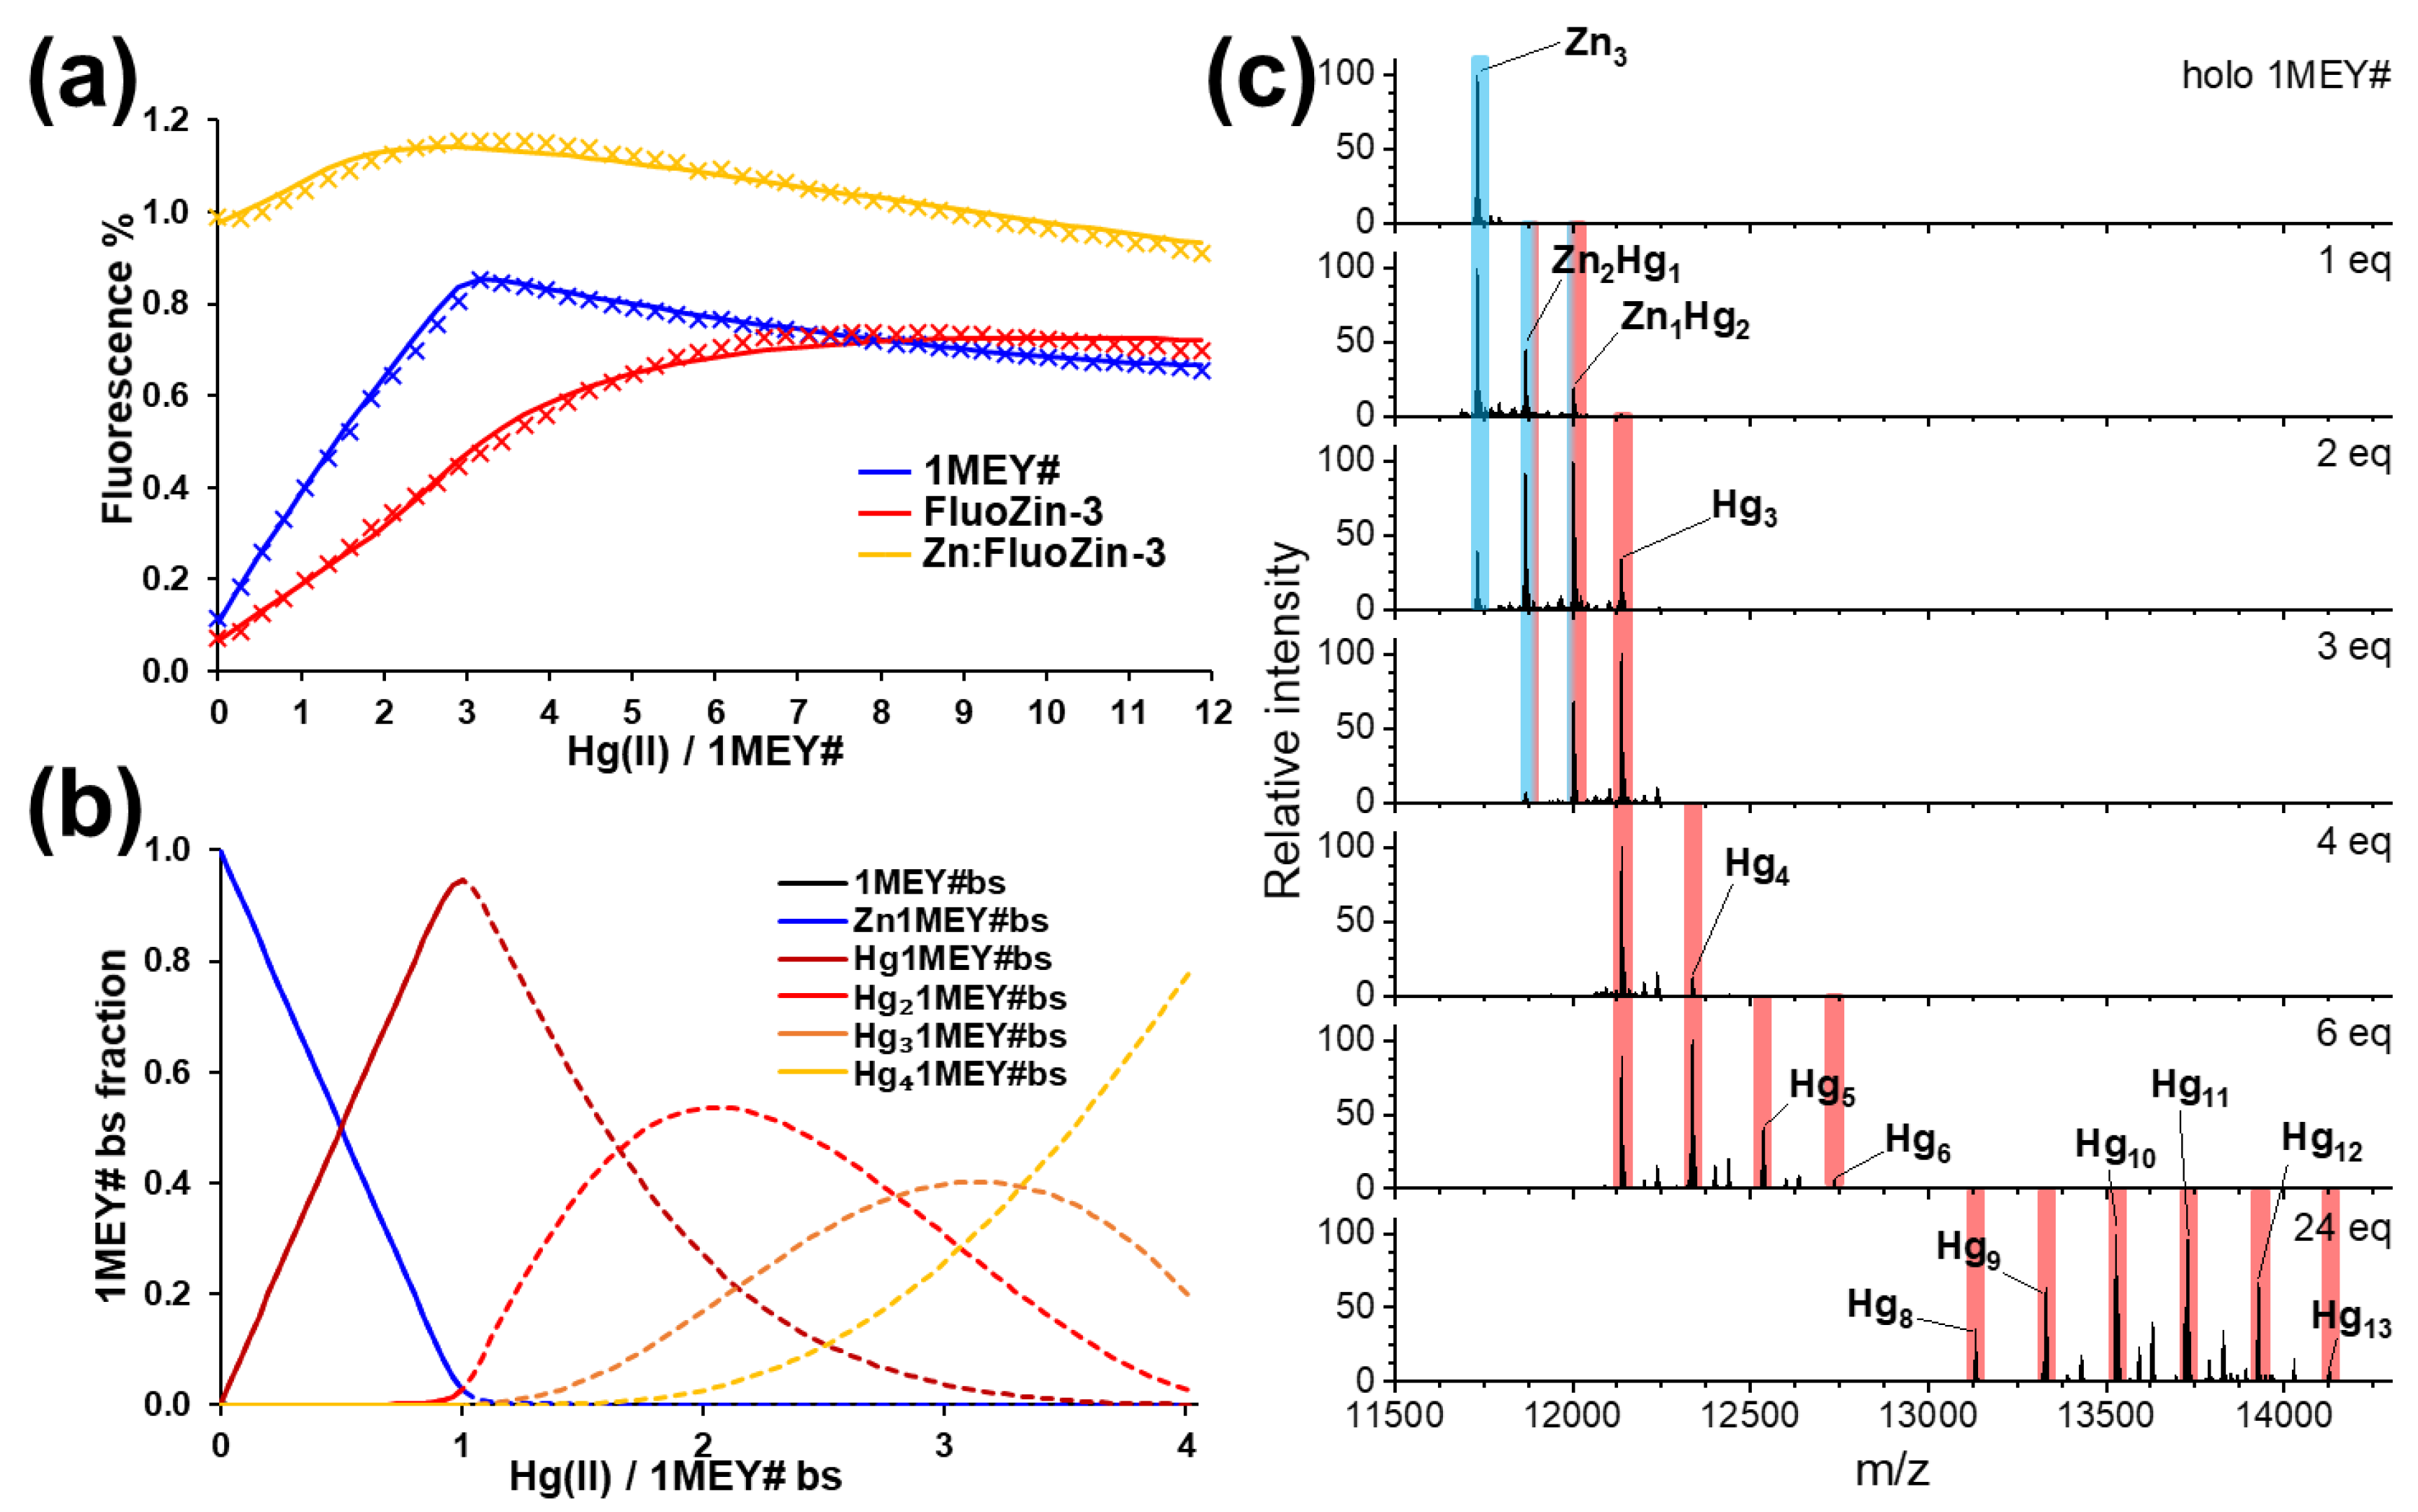
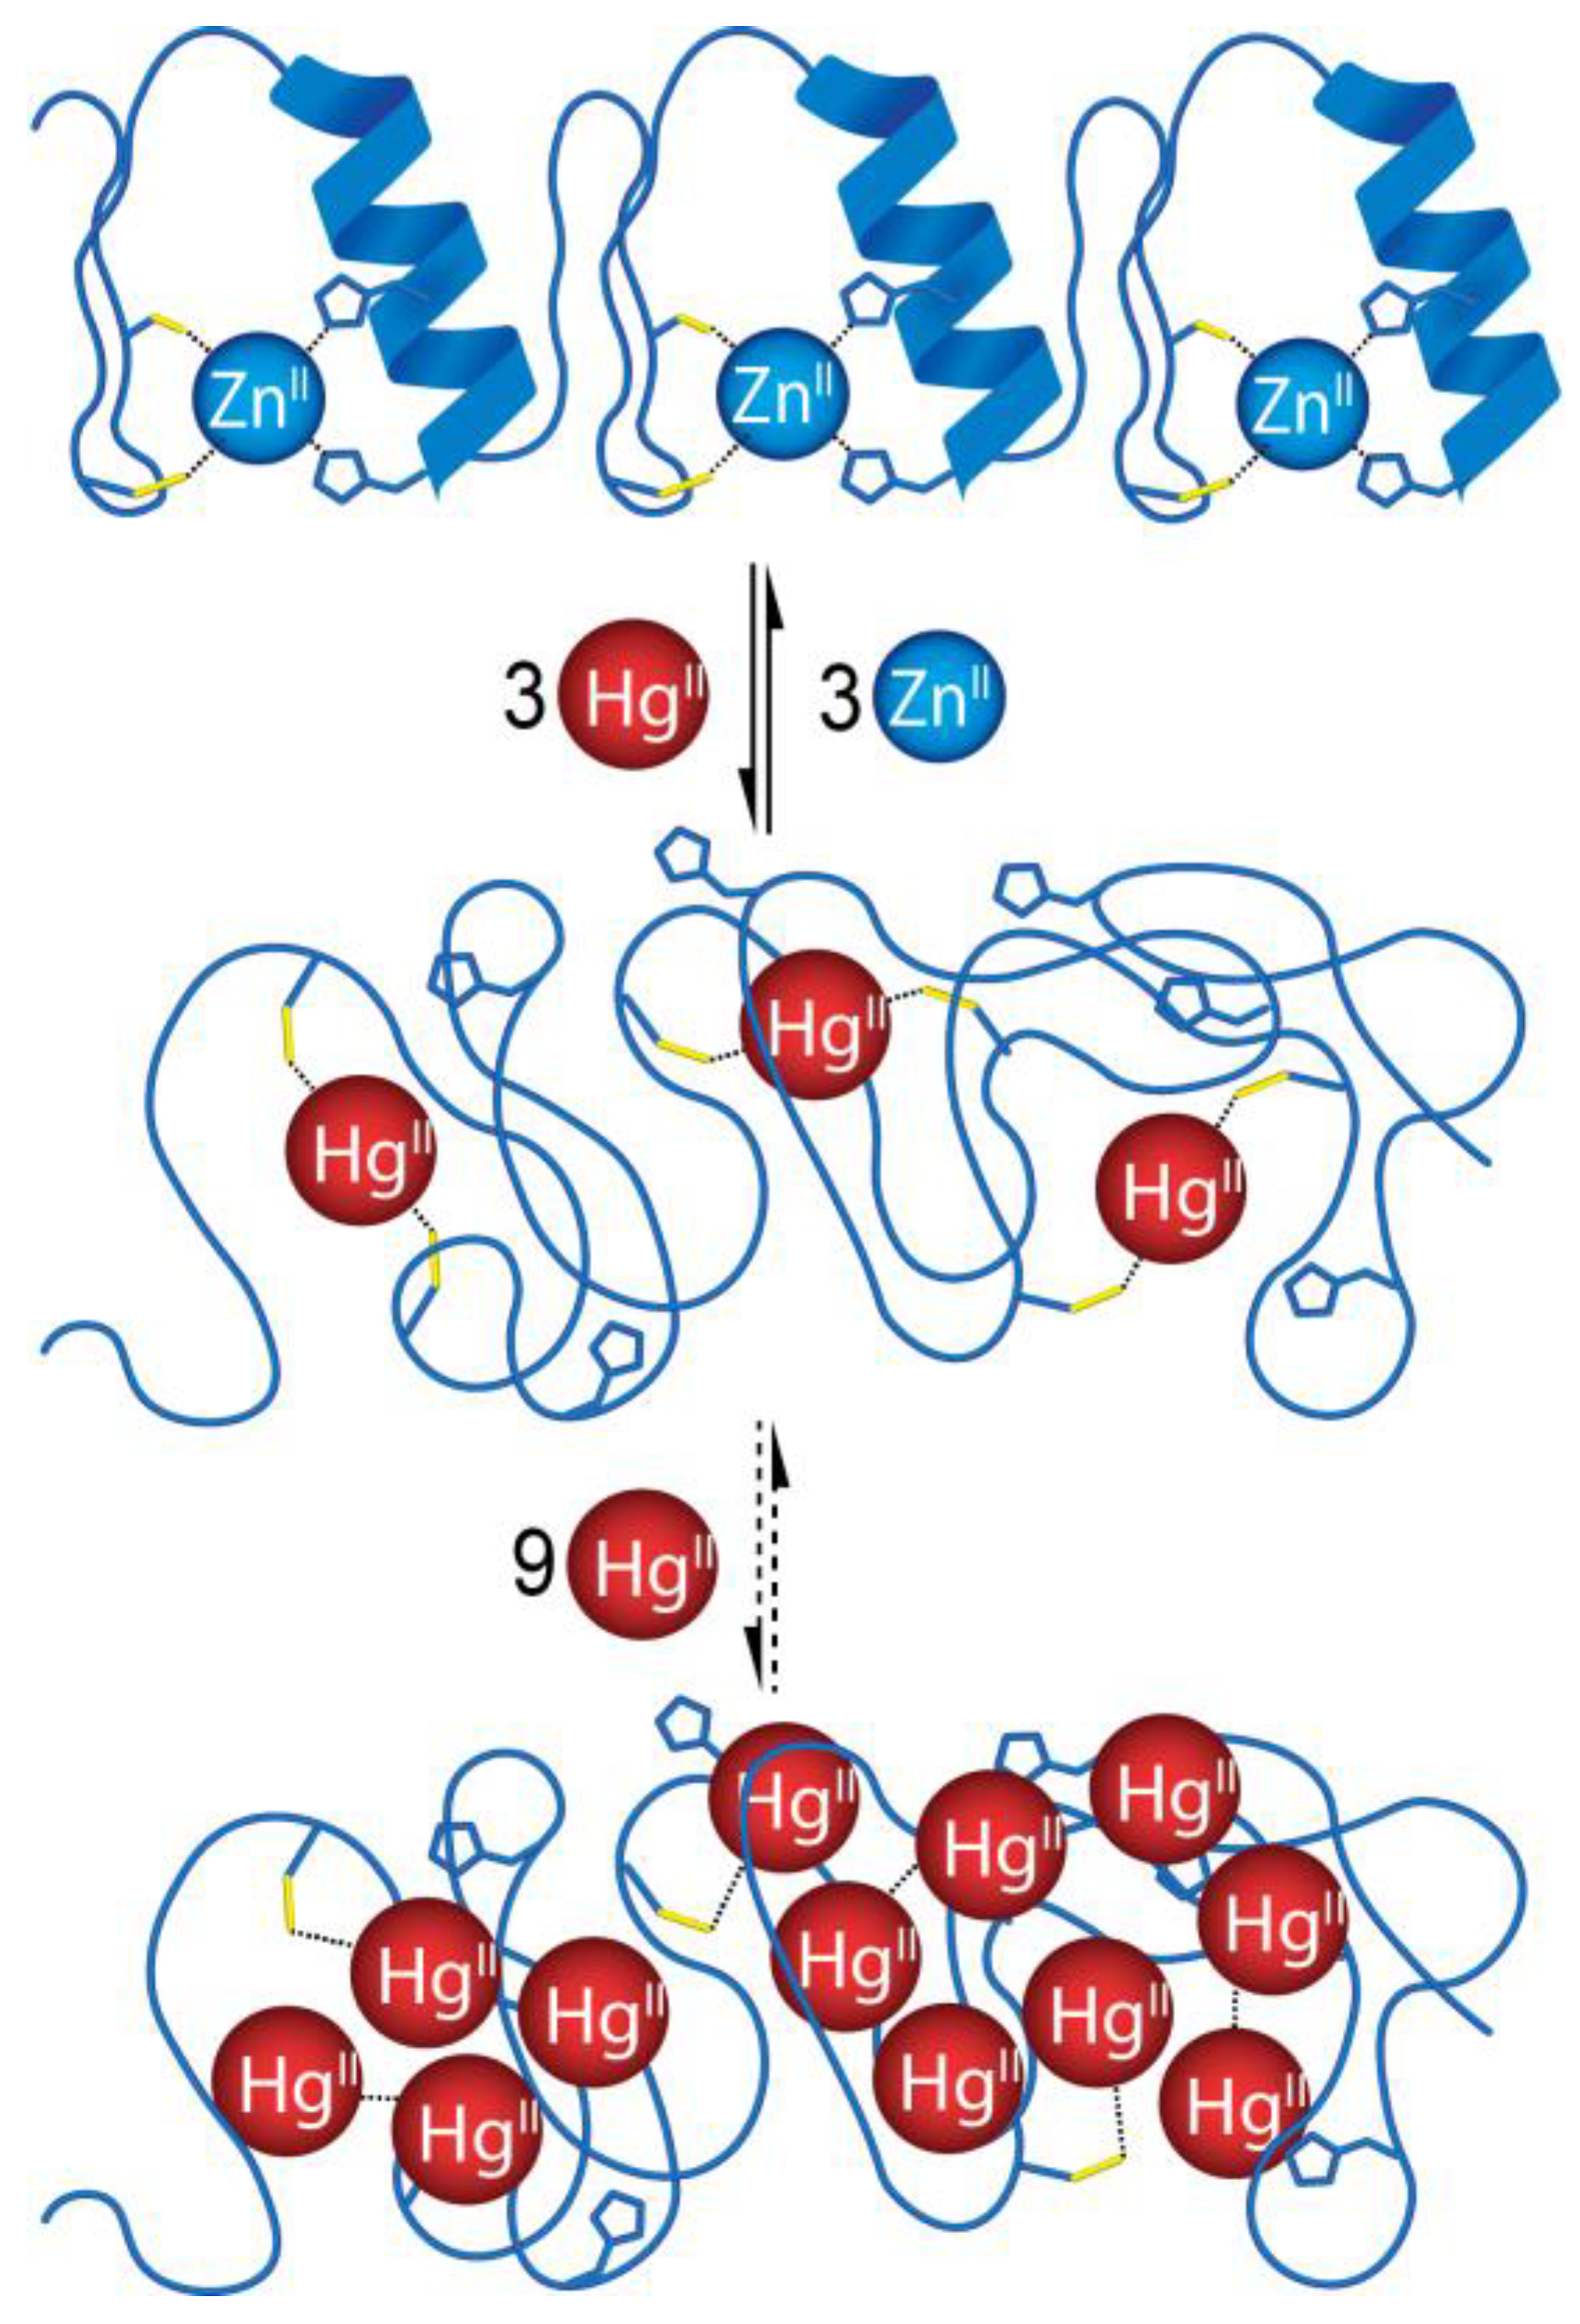
2.2. Hg(II) Binding of the 1MEY# Zinc Finger Protein
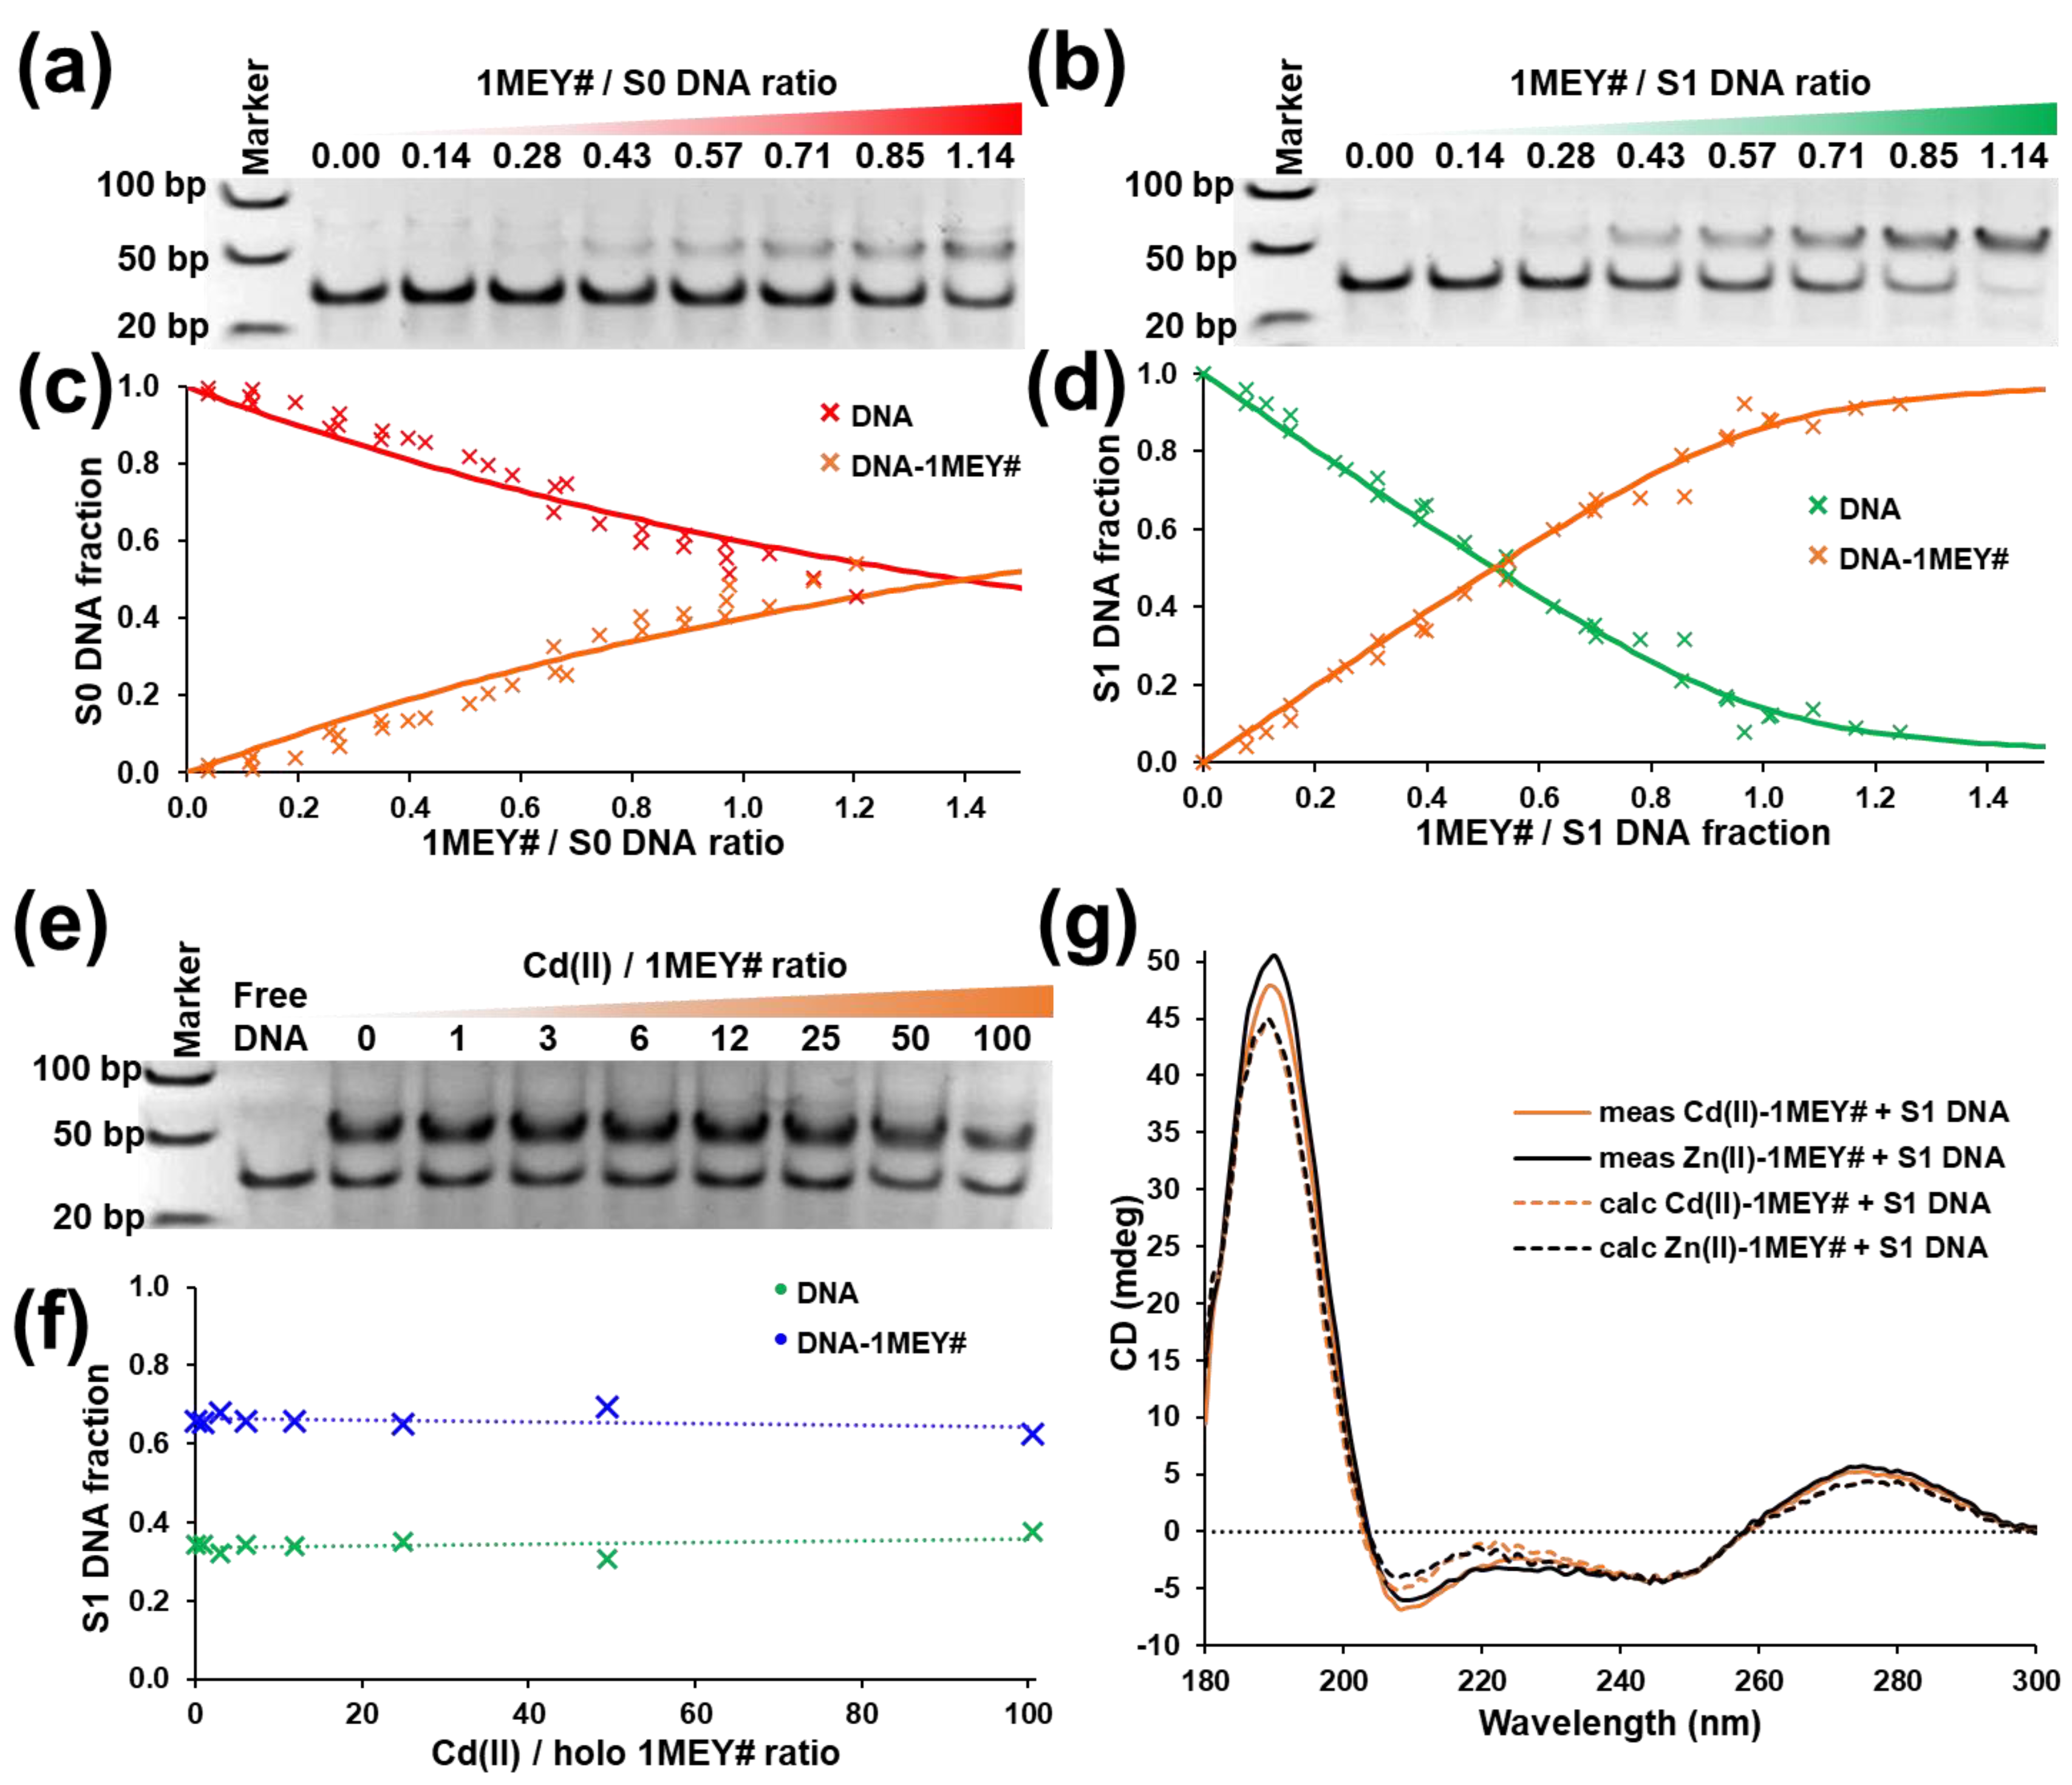
2.3. DNA Binding of 1MEY# ZFP Is Influenced by Toxic Metal Ions
2.3.1. Cd(II)
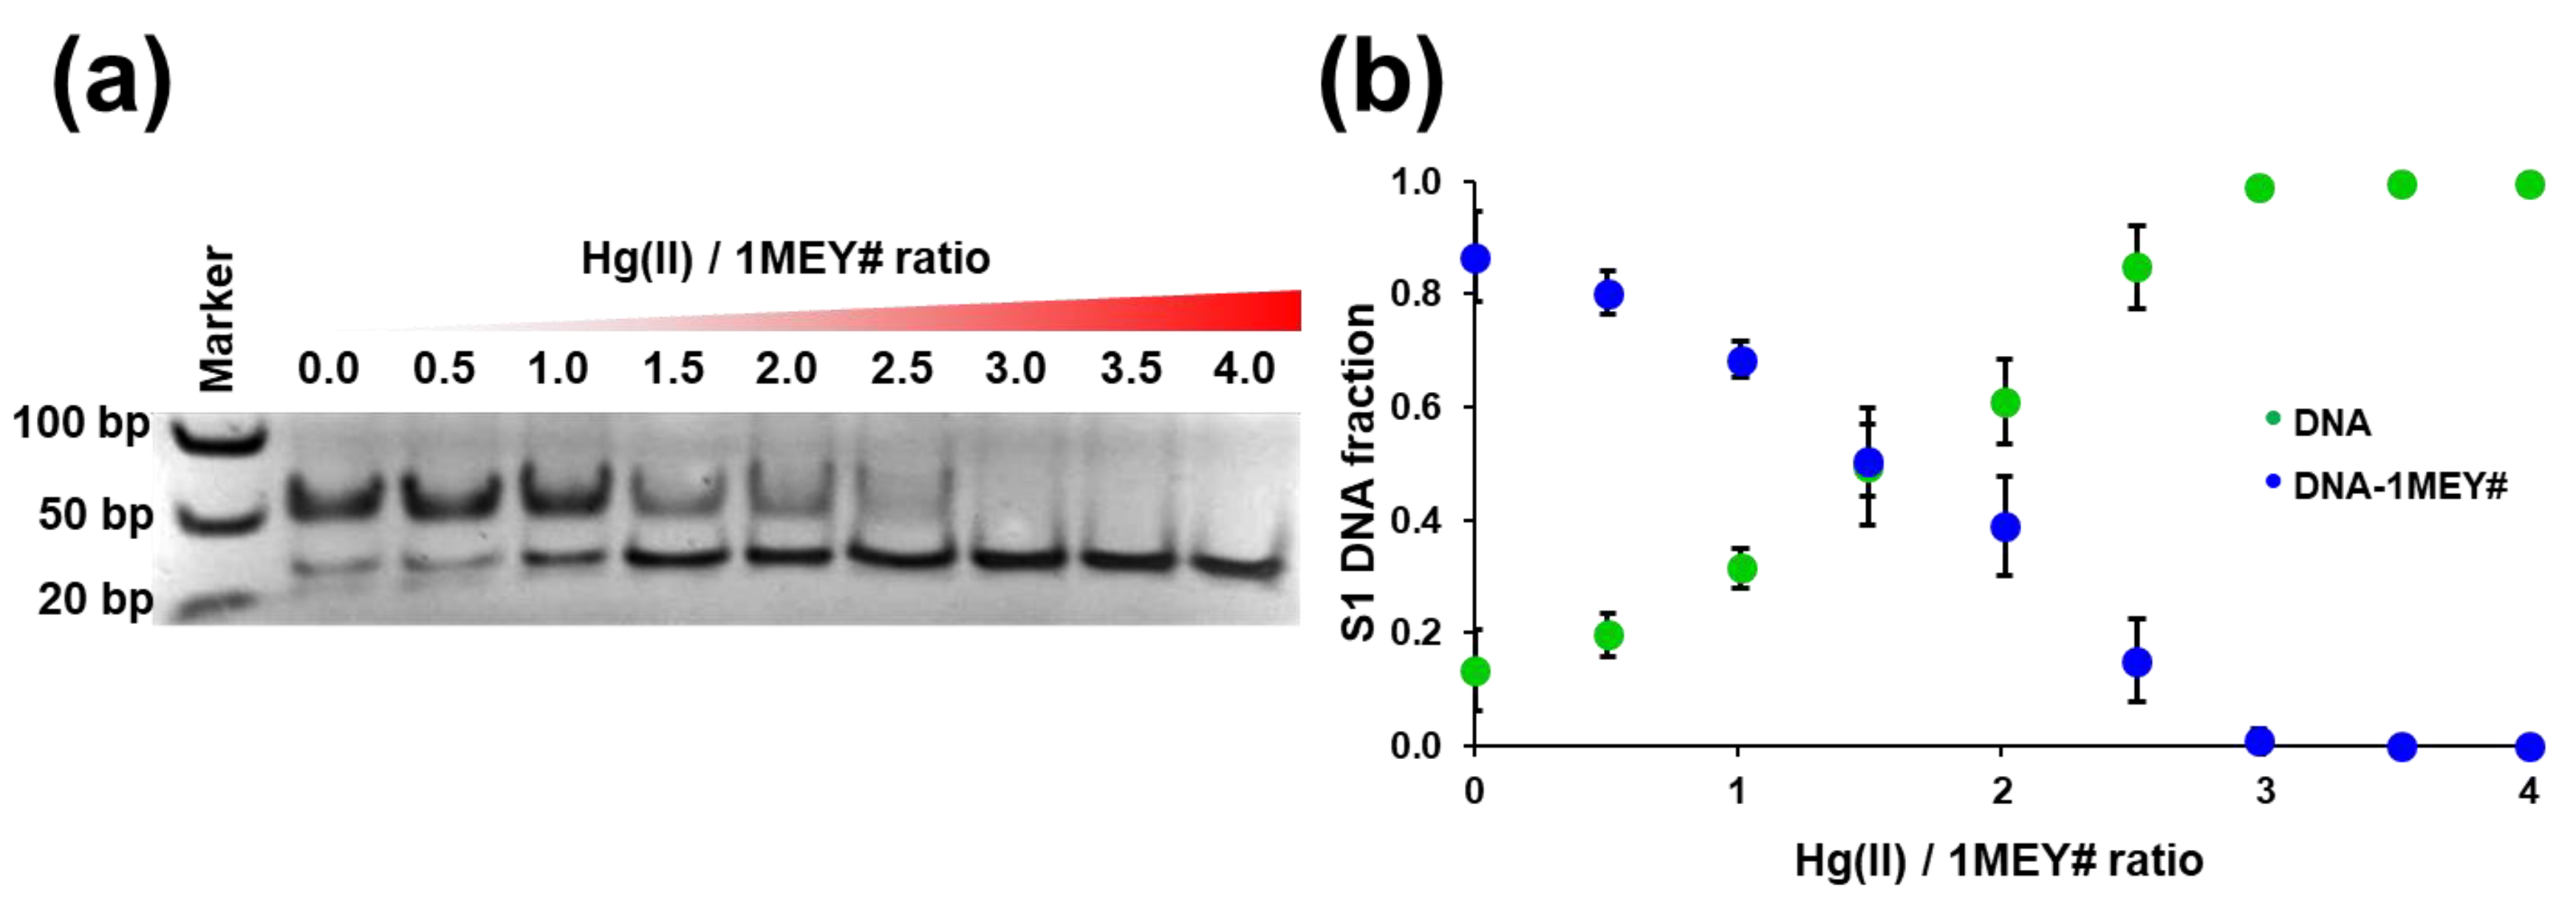
2.3.2. Hg(II)
3. Materials and Methods
3.1. Protein Expression and Purification
3.2. Mass Spectrometric Analysis of the Protein
3.3. CD Spectroscopy
3.4. Electrophoretic Mobility Shift Assay (EMSA)
3.5. Fluorimetry
4. Conclusions
Supplementary Materials
Author Contributions
Funding
Institutional Review Board Statement
Data Availability Statement
Acknowledgments
Conflicts of Interest
References
- Mackay, J.P.; Crossley, M. Zinc fingers are sticking together. Trends Biochem. Sci. 1998, 23, 1–4. [Google Scholar] [CrossRef] [PubMed]
- Tupler, R.; Perini, G.; Green, M.R. Expressing the human genome. Nature 2001, 409, 832–833. [Google Scholar] [CrossRef] [PubMed] [Green Version]
- Miller, J.; McLachlan, A.; Klug, A. Repetitive zinc-binding domains in the protein transcription factor IIIA from Xenopus oocytes. EMBO J. 1985, 4, 1609–1614. [Google Scholar] [CrossRef] [PubMed]
- Klug, A. The Discovery of Zinc Fingers and Their Applications in Gene Regulation and Genome Manipulation. Annu. Rev. Biochem. 2010, 79, 213–231. [Google Scholar] [CrossRef] [Green Version]
- Cassandri, M.; Smirnov, A.; Novelli, F.; Pitolli, C.; Agostini, M.; Malewicz, M.; Melino, G.; Raschellà, G. Zinc-finger proteins in health and disease. Cell Death Discov. 2017, 3, 17071. [Google Scholar] [CrossRef] [Green Version]
- Berg, J.M.; Shi, Y. The Galvanization of Biology: A Growing Appreciation for the Roles of Zinc. Science 1996, 271, 1081–1085. [Google Scholar] [CrossRef]
- Bulaj, G.; Kortemme, T.; Goldenberg, D.P. Ionization−Reactivity Relationships for Cysteine Thiols in Polypeptides. Biochemistry 1998, 37, 8965–8972. [Google Scholar] [CrossRef]
- Maynard, A.T.; Covell, D.G. Reactivity of Zinc Finger Cores: Analysis of Protein Packing and Electrostatic Screening. J. Am. Chem. Soc. 2001, 123, 1047–1058. [Google Scholar] [CrossRef]
- Smith, J.N.; Hoffman, J.T.; Shirin, Z.; Carrano, C.J. H-Bonding Interactions and Control of Thiolate Nucleophilicity and Specificity in Model Complexes of Zinc Metalloproteins. Inorg. Chem. 2005, 44, 2012–2017. [Google Scholar] [CrossRef]
- Lee, Y.-M.; Lim, C. Factors Controlling the Reactivity of Zinc Finger Cores. J. Am. Chem. Soc. 2011, 133, 8691–8703. [Google Scholar] [CrossRef]
- Quintal, S.M.; Depaula, Q.A.; Farrell, N.P. Zinc finger proteins as templates for metal ion exchange and ligand reactivity. Chemical and biological consequences. Metallomics 2011, 3, 121–139. [Google Scholar] [CrossRef] [PubMed]
- Frankel, A.D.; Berg, J.M.; Pabo, C.O. Metal-dependent folding of a single zinc finger from transcription factor IIIA. Proc. Natl. Acad. Sci. USA 1987, 84, 4841–4845. [Google Scholar] [CrossRef] [PubMed] [Green Version]
- Krishna, S.S.; Majumdar, I.; Grishin, N.V. Structural classification of zinc fingers. Nucleic Acids Res. 2003, 31, 532–550. [Google Scholar] [CrossRef] [PubMed] [Green Version]
- Kellis, J.T.; Nyberg, K., Jr.; Šail, D.; Fersht, A.R. Contribution of hydrophobic interactions to protein stability. Nature 1988, 333, 784–786. [Google Scholar] [CrossRef] [PubMed]
- La Gatta, S.; Leone, L.; Maglio, O.; De Fenza, M.; Nastri, F.; Pavone, V.; Chino, M.; Lombardi, A. Unravelling the Structure of the Tetrahedral Metal-Binding Site in METP3 through an Experimental and Computational Approach. Molecules 2021, 26, 5221. [Google Scholar] [CrossRef] [PubMed]
- Lander, E.S.; Linton, L.M.; Birren, B.; Nusbaum, C. Initial sequencing and analysis of the human genome. Nature 2001, 409, 860–921. [Google Scholar] [CrossRef] [Green Version]
- Kim, Y.G.; Cha, J.; Chandrasegaran, S. Hybrid restriction enzymes: Zinc finger fusions to Fok I cleavage domain. Proc. Natl. Acad. Sci. USA 1996, 93, 1156–1160. [Google Scholar] [CrossRef] [Green Version]
- Urnov, F.D.; Rebar, E.J.; Holmes, M.C.; Zhang, H.S.; Gregory, P.D. Genome editing with engineered zinc finger nucleases. Nat. Rev. Genet. 2010, 11, 636–646. [Google Scholar] [CrossRef]
- Gaj, T.; Gersbach, C.A.; Barbas, C.F., III. ZFN, TALEN, and CRISPR/Cas-based methods for genome engineering. Trends Biotechnol. 2014, 31, 397–405. [Google Scholar] [CrossRef] [Green Version]
- Segal, D.J.; Meckler, J.F.; Carroll, D.; Voytas, D.F.; Porteus, M.; Bickmore, W.A.; Walden, H.; Deans, A.J.; Moldovan, G.-L.; D’Andrea, A.D.; et al. Genome Engineering at the Dawn of the Golden Age. Annu. Rev. Genom. Hum. Genet. 2013, 14, 135–158. [Google Scholar] [CrossRef]
- Urnov, F.D.; Miller, J.C.; Lee, Y.-L.; Beausejour, C.M.; Rock, J.M.; Augustus, S.; Jamieson, A.C.; Porteus, M.H.; Gregory, P.D.; Holmes, M.C. Highly efficient endogenous human gene correction using designed zinc-finger nucleases. Nature 2005, 435, 646–651. [Google Scholar] [CrossRef] [PubMed]
- Passananti, C.; Corbi, N.; Oniri, A.; Di Certo, M.G.; Mattei, E. Transgenic Mice Expressing an Artifical Zinc Finger Regulator Targeting an Endogenous Gene, Engineered Zinc Finger Proteins. Methods Mol. Biol. 2010, 649, 183–206. [Google Scholar] [CrossRef] [PubMed]
- Petolino, J.F. Genome editing in plants via designed zinc finger nucleases. In Vitro Cell. Dev. Biol. Plant 2015, 51, 1–8. [Google Scholar] [CrossRef] [Green Version]
- Ousterout, D.G.; Kabadi, A.M.; Thakore, P.I.; Perez-Pinera, P.; Brown, M.T.; Majoros, W.H.; Reddy, T.E.; Gersbach, C.A. Correction of Dystrophin Expression in Cells from Duchenne Muscular Dystrophy Patients through Genomic Excision of Exon 51 by Zinc Finger Nucleases. Mol. Ther. 2015, 23, 523–532. [Google Scholar] [CrossRef] [Green Version]
- Rodríguez, J.; Mosquera, J.; García-Fandiño, R.; Vázquez, M.E.; Mascareñas, J.L. A designed DNA binding motif that recognizes extended sites and spans two adjacent major grooves. Chem. Sci. 2016, 7, 3298–3303. [Google Scholar] [CrossRef] [Green Version]
- Shi, Y.; Beger, R.D.; Berg, J.M. Metal binding properties of single amino acid deletion mutants of zinc finger peptides: Studies using cobalt(II) as a spectroscopic probe. Biophys. J. 1993, 64, 749–753. [Google Scholar] [CrossRef] [Green Version]
- Hartwig, A.; Asmuss, M.; Ehleben, I.; Herzer, U.; Kostelac, D.; Pelzer, A.; Schwerdtle, T.; Bürkle, A. Interference by toxic metal ions with DNA repair processes and cell cycle control: Molecular mechanisms. Environ. Health Perspect. 2002, 110, 797–799. [Google Scholar] [CrossRef] [Green Version]
- Witkiewiczkucharczyk, A.; Bal, W. Damage of zinc fingers in DNA repair proteins, a novel molecular mechanism in carcinogenesis. Toxicol. Lett. 2006, 162, 29–42. [Google Scholar] [CrossRef]
- Kluska, K.; Adamczyk, J.; Krężel, A. Metal binding properties, stability and reactivity of zinc fingers. Co-ord. Chem. Rev. 2018, 367, 18–64. [Google Scholar] [CrossRef]
- Párraga, G.; Horvath, S.J.; Eisen, A.; Taylor, W.E.; Hood, L.; Young, E.T.; Klevit, R.E. Zinc-dependent structure of a single-finger domain of yeast ADR1. Science 1988, 241, 1489–1492. [Google Scholar] [CrossRef] [PubMed]
- Kopera, E.; Schwerdtle, T.; Hartwig, A.; Bal, W. Co(II) and Cd(II) Substitute for Zn(II) in the Zinc Finger Derived from the DNA Repair Protein XPA, Demonstrating a Variety of Potential Mechanisms of Toxicity. Chem. Res. Toxicol. 2004, 17, 1452–1458. [Google Scholar] [CrossRef] [PubMed]
- Hartwig, A. Zinc Finger Proteins as Potential Targets for Toxic Metal Ions: Differential Effects on Structure and Function. Antioxidants Redox Signal. 2001, 3, 625–634. [Google Scholar] [CrossRef] [PubMed]
- Krizek, B.A.; Merkle, D.L.; Berg, J.M. Ligand variation and metal ion binding specificity in zinc finger peptides. Inorg. Chem. 1993, 32, 937–940. [Google Scholar] [CrossRef]
- Heinz, U.; Hemmingsen, L.; Kiefer, M.; Adolph, H.-W. Structural Adaptability of Zinc Binding Sites: Different Structures in Partially, Fully, and Heavy-Metal Loaded States. Chem. A Eur. J. 2009, 15, 7350–7358. [Google Scholar] [CrossRef] [PubMed]
- Petering, D.H.; Huang, M.; Moteki, S.; Iii, C.F.S. Cadmium and lead interactions with transcription factor IIIA from Xenopus laevis: A model for zinc finger protein reactions with toxic metal ions and metallothionein. Mar. Environ. Res. 2000, 50, 89–92. [Google Scholar] [CrossRef] [Green Version]
- Huang, M.; Krepkiy, D.; Hu, W.; Petering, D.H. Zn-, Cd-, and Pb-transcription factor IIIA: Properties, DNA binding, and comparison with TFIIIA-finger 3 metal complexes. J. Inorg. Biochem. 2004, 98, 775–785. [Google Scholar] [CrossRef] [Green Version]
- Hanas, J.S.; Gunn, C.G. Inhibition of Transcription Factor IIIA-DNA Interactions by Xenobiotic Metal Ions. Nucleic Acids Res. 1996, 24, 924–930. [Google Scholar] [CrossRef] [Green Version]
- Makowski, G.S.; Sunderman, F., Jr. The interactions of zinc, nickel, and cadmium with Xenopus transcription factor IIIA, assessed by equilibrium dialysis. J. Inorg. Biochem. 1992, 48, 107–119. [Google Scholar] [CrossRef]
- Krepkiy, D.; Försterling, F.H.; Petering, D.H. Interaction of Cd2+ with Zn Finger 3 of Transcription Factor IIIA: Structures and Binding to Cognate DNA. Chem. Res. Toxicol. 2004, 17, 863–870. [Google Scholar] [CrossRef]
- Razmiafshari, M.; Zawia, N.H. Utilization of a Synthetic Peptide as a Tool to Study the Interaction of Heavy Metals with the Zinc Finger Domain of Proteins Critical for Gene Expression in the Developing Brain. Toxicol. Appl. Pharmacol. 2000, 166, 1–12. [Google Scholar] [CrossRef]
- Kothinti, R.; Blodgett, A.; Tabatabai, N.M.; Petering, D.H. Zinc Finger Transcription Factor Zn3-Sp1 Reactions with Cd2+. Chem. Res. Toxicol. 2010, 23, 405–412. [Google Scholar] [CrossRef] [PubMed] [Green Version]
- Kothinti, R.K.; Blodgett, A.B.; Petering, D.H.; Tabatabai, N.M. Cadmium down-regulation of kidney Sp1 binding to mouse SGLT1 and SGLT2 gene promoters: Possible reaction of cadmium with the zinc finger domain of Sp1. Toxicol. Appl. Pharmacol. 2010, 244, 254–262. [Google Scholar] [CrossRef] [PubMed] [Green Version]
- Bittel, D.; Dalton, T.; Samson, S.L.-A.; Gedamu, L.; Andrews, G.K. The DNA Binding Activity of Metal Response Element-binding Transcription Factor-1 Is Activated In Vivo and in Vitro by Zinc, but Not by Other Transition Metals. J. Biol. Chem. 1998, 273, 7127–7133. [Google Scholar] [CrossRef] [PubMed] [Green Version]
- Kuwahara, J.; Coleman, J.E. Role of the zinc(II) ions in the structure of the three-finger DNA binding domain of the Sp1 transcription factor. Biochemistry 1990, 29, 8627–8631. [Google Scholar] [CrossRef]
- Malgieri, G.; Palmieri, M.; Esposito, S.; Maione, V.; Russo, L.; Baglivo, I.; de Paola, I.; Milardi, D.; Diana, D.; Zaccaro, L.; et al. Zinc to cadmium replacement in the prokaryotic zinc-finger domain. Metallomics 2014, 6, 96–104. [Google Scholar] [CrossRef]
- Roesijadi, G.; Bogumil, R.; Vasák, M.; Kägi, J.H.R. Modulation of DNA Binding of a Tramtrack Zinc Finger Peptide by the Metallothionein-Thionein Conjugate Pair. J. Biol. Chem. 1998, 273, 17425–17432. [Google Scholar] [CrossRef] [Green Version]
- Zhang, B.; Georgiev, O.; Hagmann, M.; Günes, C.; Cramer, M.; Faller, P.; Vasák, M.; Schaffner, W. Activity of Metal-Responsive Transcription Factor 1 by Toxic Heavy Metals and H2O2 In Vitro Is Modulated by Metallothionein. Mol. Cell. Biol. 2003, 23, 8471–8485. [Google Scholar] [CrossRef] [Green Version]
- Giedroc, D.P.; Chen, X.; Pennella, M.A.; LiWang, A.C. Conformational Heterogeneity in the C-terminal Zinc Fingers of Human MTF-1: An Nmr and Zinc-Binding Study. J. Biol. Chem. 2001, 276, 42322–42332. [Google Scholar] [CrossRef] [Green Version]
- Ciavatta, L.; Grimaldi, M. Equilibrium constants of mercury(II) chloride complexes. J. Inorg. Nucl. Chem. 1968, 30, 197–205. [Google Scholar] [CrossRef]
- Makowski, G.S.; Lin, S.-M.; Brennan, S.M.; Smilowitz, H.M.; Hopfer, S.M.; Sunderman, F.W. Detection of two Zn-finger proteins ofXenopus laevis, TFIIIA, and p43, by probing western blots of ovary cytosol with 65Zn2+, 63Ni2+, or 109Cd2+. Biol. Trace Element Res. 1991, 29, 93–109. [Google Scholar] [CrossRef]
- Sivo, V.; D’Abrosca, G.; Baglivo, I.; Iacovino, R.; Pedone, P.V.; Fattorusso, R.; Russo, L.; Malgieri, G.; Isernia, C. Ni(II), Hg(II), and Pb(II) Coordination in the Prokaryotic Zinc-Finger Ros87. Inorg. Chem. 2019, 58, 1067–1080. [Google Scholar] [CrossRef]
- Hajdu, B.; Hunyadi-Gulyás, É.; Kato, K.; Kawaguchi, A.; Nagata, K.; Gyurcsik, B. Zinc binding of a Cys2His2 type zinc finger protein is enhanced by the interaction with DNA. J. Biol. Inorg. Chem. 2022; accepted for publication. [Google Scholar]
- Sénèque, O.; Latour, J.-M. Coordination Properties of Zinc Finger Peptides Revisited: Ligand Competition Studies Reveal Higher Affinities for Zinc and Cobalt. J. Am. Chem. Soc. 2010, 132, 17760–17774. [Google Scholar] [CrossRef] [PubMed]
- Kägi, J.H.; Vallee, B.L.; Carlson, J.M. Metallothionein: A Cadmium and Zinc-containing Protein from Equine Renal Cortex: II. Physicochemical properties. J. Biol. Chem. 1961, 236, 2435–2442. [Google Scholar] [CrossRef]
- Willner, H.; Vasak, M.; Kaegi, J.H.R. Cadmium-thiolate clusters in metallothionein: Spectrophotometric and spectropolarimetric features. Biochemistry 1987, 26, 6287–6292. [Google Scholar] [CrossRef] [PubMed]
- Micsonai, A.; Moussong, É.; Wien, F.; Boros, E.; Vadászi, H.; Murvai, N.; Lee, Y.-H.; Molnár, T.; Réfrégiers, M.; Goto, Y.; et al. BeStSel: Webserver for secondary structure and fold prediction for protein CD spectroscopy. Nucleic Acids Res. 2022, 50, W90–W98. [Google Scholar] [CrossRef] [PubMed]
- Basile, L.A.; Coleman, J.E. Optical activity associated with the sulfur to metal charge transfer bands of Zn and Cd GAL4. Protein Sci. 1992, 1, 617–624. [Google Scholar] [CrossRef] [Green Version]
- Zékány, L.; Nagypál, I. A Comprehensive Program for the Evaluation of Potentiometric and/or Spectrophotometric Equilibrium Data Using Analytical Derivatives. In Computational Methods for the Determination of Formation Constants; Springer: Boston, MA, USA, 1985; pp. 291–353. [Google Scholar] [CrossRef]
- Malaiyandi, L.M.; Sharthiya, H.; Barakat, A.N.; Edwards, J.R.; Dineley, K.E. Using FluoZin-3 and fura-2 to monitor acute accumulation of free intracellular Cd2+ in a pancreatic beta cell line. Biometals 2019, 32, 951–964. [Google Scholar] [CrossRef] [Green Version]
- Palmieri, M.; Malgieri, G.; Russo, L.; Baglivo, I.; Esposito, S.; Netti, F.; Del Gatto, A.; de Paola, I.; Zaccaro, L.; Pedone, P.V.; et al. Structural Zn(II) Implies a Switch from Fully Cooperative to Partly Downhill Folding in Highly Homologous Proteins. J. Am. Chem. Soc. 2013, 135, 5220–5228. [Google Scholar] [CrossRef]
- Grazioso, R.; García-Viñuales, S.; Russo, L.; D’Abrosca, G.; Esposito, S.; Zaccaro, L.; Iacovino, R.; Milardi, D.; Fattorusso, R.; Malgieri, G.; et al. Substitution of the Native Zn(II) with Cd(II), Co(II) and Ni(II) Changes the Downhill Unfolding Mechanism of Ros87 to a Completely Different Scenario. Int. J. Mol. Sci. 2020, 21, 8285. [Google Scholar] [CrossRef]
- Szunyogh, D.; Gyurcsik, B.; Larsen, F.H.; Stachura, M.; Thulstrup, P.W.; Hemmingsen, L.; Jancsó, A. ZnII and HgII binding to a designed peptide that accommodates different coordination geometries. Dalton Trans. 2015, 44, 12576–12588. [Google Scholar] [CrossRef] [PubMed] [Green Version]
- Kägi, J.H.; Vasák, M.; Lerch, K.; Gilg, D.E.; Hunziker, P.; Bernhard, W.R.; Good, M. Structure of mammalian metallothionein. Environ. Health Perspect. 1984, 54, 93–103. [Google Scholar] [CrossRef] [PubMed] [Green Version]
- Stricks, W.; Kolthoff, I.M. Reactions between Mercuric Mercury and Cysteine and Glutathione. Apparent Dissociation Constants, Heats and Entropies of Formation of Various Forms of Mercuric Mercapto-Cysteine and -Glutathione. J. Am. Chem. Soc. 1953, 75, 5673–5681. [Google Scholar] [CrossRef]
- Pires, S.; Habjanič, J.; Sezer, M.; Soares, C.M.; Hemmingsen, L.; Iranzo, O. Design of a Peptidic Turn with High Affinity for HgII. Inorg. Chem. 2012, 51, 11339–11348. [Google Scholar] [CrossRef] [PubMed]
- DeSilva, T.M.; Veglia, G.; Porcelli, F.; Prantner, A.M.; Opella, S.J. Selectivity in heavy metal- binding to peptides and proteins. Biopolymers 2002, 64, 189–197. [Google Scholar] [CrossRef] [PubMed]
- Rousselot-Pailley, P.; Sénèque, O.; Lebrun, C.; Crouzy, S.; Boturyn, D.; Dumy, P.; Ferrand, M.; Delangle, P. Model Peptides Based on the Binding Loop of the Copper Metallochaperone Atx1: Selectivity of the Consensus Sequence MxCxxC for Metal Ions Hg(II), Cu(I), Cd(II), Pb(II), and Zn(II). Inorg. Chem. 2006, 45, 5510–5520. [Google Scholar] [CrossRef] [PubMed]
- Schneider, C.A.; Rasband, W.S.; Eliceiri, K.W. NIH Image to ImageJ: 25 Years of image analysis. Nat. Methods 2012, 9, 671–675. [Google Scholar] [CrossRef]
- Bjerrum, J. Metal Amine Formation in Aqueous Solution; Haase: Copenhagen, Denmark, 1941. [Google Scholar]
- Beck, M.T.; Nagypál, I. Chemistry of Complex Equilibria; Akadémiai Kiadó: Budapest, Hungary; Ellis Horwood Limited: Chichester, UK, 1990. [Google Scholar]
- Malakhov, M.P.; Mattern, M.R.; Malakhova, O.A.; Drinker, M.; Weeks, S.D.; Butt, T.R. SUMO fusions and SUMO-specific protease for efficient expression and purification of proteins. J. Struct. Funct. Genom. 2004, 5, 75–86. [Google Scholar] [CrossRef]
- Elhameed, H.A.A.; Hajdu, B.; Balogh, R.K.; Hermann, E.; Hunyadi-Gulyás, É.; Gyurcsik, B. Purification of proteins with native terminal sequences using a Ni(II)-cleavable C-terminal hexahistidine affinity tag. Protein Expr. Purif. 2019, 159, 53–59. [Google Scholar] [CrossRef] [Green Version]
- Kim, C.A.; Berg, J.M. A 2.2 Å resolution crystal structure of a designed zinc finger protein bound to DNA. Nat. Struct. Biol. 1996, 3, 940–945. [Google Scholar] [CrossRef]
- Krizek, B.A.; Amann, B.T.; Kilfoil, V.J.; Merkle, D.L.; Berg, J.M. A consensus zinc finger peptide: Design high-affinity metal binding a pH-dependent structure and a His to Cys sequence variant. J. Am. Chem. Soc. 1991, 113, 4518–4523. [Google Scholar] [CrossRef]
- Miles, A.J.; Hoffmann, S.V.; Wallace, B.A.; Tao, Y.; Janes, R.W. Synchrotron Radiation Circular Dichroism (SRCD) spectroscopy: New beamlines and new applications in biology. Spectroscopy 2007, 21, 245–255. [Google Scholar] [CrossRef]
- Miles, A.J.; Janes, R.W.; Brown, A.; Clarke, D.T.; Sutherland, J.C.; Tao, Y.; Wallace, B.A.; Hoffmann, S.V. Light flux density threshold at which protein denaturation is induced by synchrotron radiation circular dichroism beamlines. J. Synchrotron Radiat. 2008, 15, 420–422. [Google Scholar] [CrossRef]
- Kluska, K.; Veronesi, G.; Deniaud, A.; Hajdu, B.; Gyurcsik, B.; Bal, W.; Krężel, A. Structures of Silver Fingers and a Pathway to Their Genotoxicity. Angew. Chem. Int. Ed. 2022, 61, e202116621. [Google Scholar] [CrossRef] [PubMed]
- Marszałek, I.; Krężel, A.; Goch, W.; Zhukov, I.; Paczkowska, I.; Bal, W. Revised stability constant, spectroscopic properties and binding mode of Zn(II) to FluoZin-3, the most common zinc probe in life sciences. J. Inorg. Biochem. 2016, 161, 107–114. [Google Scholar] [CrossRef] [PubMed]


| logβ′Cd(II) | logβ′Zn(II) | Δlogβ′ 1 | Method | References | |
|---|---|---|---|---|---|
| 1MEY# | 12.2 | cITC | [52] | ||
| 10.11 ± 0.03 | 2.11 | FTc | Present work | ||
| 11.14 ± 0.03 | 1.06 | rCD | Present work | ||
| CP1 | 8.7 | 11.2 | 2.5 | RT | [33] |
| TFIIIA | 5.6 a | 8.0 a | 2.4 | ED | [38] |
| 3.8 b | 4.6 b | 0.8 | ED | [38] | |
| Ros87 | 8.0 | 9.2 | 1.2 | RT | [51,61] |
| 7.7 | DT | [45] |
| pK′ | |
|---|---|
| Hg11MEY# bs | ≥16.7 |
| Hg21MEY# bs | ≥9.3 |
| Hg31MEY# bs | ≥8.5 |
| Hg41MEY# bs | ≥8.2 |
Disclaimer/Publisher’s Note: The statements, opinions and data contained in all publications are solely those of the individual author(s) and contributor(s) and not of MDPI and/or the editor(s). MDPI and/or the editor(s) disclaim responsibility for any injury to people or property resulting from any ideas, methods, instructions or products referred to in the content. |
© 2023 by the authors. Licensee MDPI, Basel, Switzerland. This article is an open access article distributed under the terms and conditions of the Creative Commons Attribution (CC BY) license (https://creativecommons.org/licenses/by/4.0/).
Share and Cite
Hajdu, B.; Hunyadi-Gulyás, É.; Gyurcsik, B. Interactions of an Artificial Zinc Finger Protein with Cd(II) and Hg(II): Competition and Metal and DNA Binding. Inorganics 2023, 11, 64. https://doi.org/10.3390/inorganics11020064
Hajdu B, Hunyadi-Gulyás É, Gyurcsik B. Interactions of an Artificial Zinc Finger Protein with Cd(II) and Hg(II): Competition and Metal and DNA Binding. Inorganics. 2023; 11(2):64. https://doi.org/10.3390/inorganics11020064
Chicago/Turabian StyleHajdu, Bálint, Éva Hunyadi-Gulyás, and Béla Gyurcsik. 2023. "Interactions of an Artificial Zinc Finger Protein with Cd(II) and Hg(II): Competition and Metal and DNA Binding" Inorganics 11, no. 2: 64. https://doi.org/10.3390/inorganics11020064