Article

Low-Dimensional Compounds Containing Bioactive Ligands. Part XX: Crystal Structures, Cytotoxic, Antimicrobial Activities and DNA/BSA Binding of Oligonuclear Zinc Complexes with Halogen Derivatives of 8-Hydroxyquinoline

1
Institute of Chemistry, P. J. Šafárik University in Košice, Moyzesova 11, SK-04154 Košice, Slovakia
2
Department of Pharmacology, P. J. Šafárik University in Košice, Trieda SNP 1, 040 11 Košice, Slovakia
3
Department of Botany, Institute of Biology and Ecology, Faculty of Science, P. J. Šafárik University in Košice, Mánesova 23, 040 01 Košice, Slovakia
4
Department of Microbiology and Immunology, University of Veterinary Medicine and Pharmacy, Komenského 73, 041 81 Košice, Slovakia
5
Institute of Physics of the Czech Academy of Science, Na Slovance 2, CZ-182 21 Prague, Czech Republic
6
Centre of Instrumental Techniques, Institute of Inorganic Chemistry of the CAS, Husinec-Řež č.p. 1001, CZ-25068 Řež, Czech Republic
7
Institute of Experimental Physics, Watsonova 47, SK-04001 Košice, Slovakia
*
Author to whom correspondence should be addressed.
Inorganics 2023, 11(2), 60; https://doi.org/10.3390/inorganics11020060
Submission received: 4 January 2023 / Revised: 19 January 2023 / Accepted: 24 January 2023 / Published: 26 January 2023
(This article belongs to the Special Issue Recent Progress in Coordination Chemistry)

Abstract

:
Two tetranuclear [Zn4Cl2(ClQ)6]·2DMF (1) and [Zn4Cl2(ClQ)6(H2O)2]·4DMF (2), as well as three dinuclear [Zn2(ClQ)3(HClQ)3]I3 (3), [Zn2(dClQ)2(H2O)6(SO4)] (4) and [Zn2(dBrQ)2(H2O)6(SO4)] (5), complexes (HClQ = 5-chloro-8-hydroxyquinoline, HdClQ = 5,7-dichloro-8-hydroxyquinoline and HdBrQ = 5,7-dibromo-8-hydroxyquinoline) were prepared as possible anticancer or antimicrobial agents and characterized by IR spectroscopy, elemental analysis and single crystal X-ray structure analysis. The stability of the complexes in solution was verified by NMR spectroscopy. Antiproliferative activity and selectivity of the prepared complexes were studied using in vitro MTT assay against the HeLa, A549, MCF-7, MDA-MB-231, HCT116 and Caco-2 cancer cell lines and on the Cos-7 non-cancerous cell line. The most sensitive to the tested complexes was Caco-2 cell line. Among the tested complexes, complex 3 showed the highest cytotoxicity against all cell lines. Unfortunately, all complexes showed only poor selectivity to normal cells, except for complex 5, which showed a certain level of selectivity. Antibacterial potential was observed for complex 5 only. Moreover, the DNA/BSA binding potential of complexes 13 was investigated by UV-vis and fluorescence spectroscopic methods.

Graphical Abstract

1. Introduction

Cancer diseases represent one of the greatest challenges for society. Cancer is responsible of around 10.0 million deaths worldwide and 19.3 million new cases each year [1]. There are seven platinum-containing drugs with a great effect in a cancer treatment. Three of them (cisplatin, carboplatin and oxaliplatin) are approved worldwide while other four (nedaplatin, lobaplatin, heptaplatin and miriplatin) are approved in specific Asian countries [2]. Despite their success in a cancer treatment, there are not only several side effects, such as allergic reactions, kidney problems, ototoxicity and decreased immunity associated with the use of these drugs, but also platinum drugs cell resistance can be developed. Therefore, new drugs need to be synthesized to overcome the drug-resistance and unwanted side effects [3]. New transition metal complexes could be a suitable choice because of their bioactivity, biocompatibility, varying coordination numbers and geometries; they can also bind with DNA through covalent, noncovalent and electrostatic interactions, which can lead to cellular death [4]. There are many classes of organic compounds, including heterocyclic compounds, which have been synthesized as suitable bioactive ligands, and their complexes were tested as possible anticancer drugs. Growing interest is noted for 8-hydroxyquinoline (H8-HQ) and its derivatives (HXQ) [5,6]. H8-HQ, as well as HXQ, are known to exhibit anti-SARS-CoV-2 [7], antimicrobial [8,9], antifungal [10], anti-inflammatory [11], anticancer [12,13,14] and antioxidant activity [15,16]. They also have significant effects in the treatment of malaria, HIV and neurological diseases [6]. The lipophilic derivative of H8-HQ, clioquinol (HCQ = 5-chloro-7-iodo-8-hydroxyquinoline), has been studied as a treatment for Alzheimer’s disease [17]. The halogenation of H8-HQ at various positions makes it more lipophilic, which leads to better absorption and better activity. In addition, the complexation of HXQ with metal ions shows better anticancer activity [6 and citations therein]. Recently, we published several papers describing the biological activities of both transition and non-transition metal complexes with HXQ. Some of them, such as K[PdCl2(dClQ)], Cs[PdCl2(dClQ)] (HdClQ = 5,7-dichloro-8-hydroxyquinoline) [18] and [Ga(ClQ)3] (HClQ = 5-chloro-8-hydroxyquinoline) [19], exhibited strong and selective cytotoxic effects against tested cancer cell lines. On the other hand, although mononuclear zinc complexes with HXQ, such as K[Zn(dClQ)3]·2DMF·H2O, (HdClQ)2[ZnCl4]·2H2O or [Zn(dBrQ)2(H2O)]2·DMF·H2O (HdBrQ = 5,7-dibromo-8-hydroxyquinoline), have shown significant cytotoxic activity against colon cancer HCT116 cell lines, they were not selective. However, we have observed strong antimicrobial and antifungal activity of these complexes [20]. These results motivated us to continue our work, and we have prepared a series of di- and tetranuclear zinc complexes with mono and dihalogen derivatives of H8-HQ with the aim of studying their cytotoxic and antimicrobial activity. In this work, we describe preparation of five new zinc(II) complexes, [Zn4Cl2(ClQ)6]·2DMF (1), [Zn4Cl2(ClQ)6(H2O)2]·4DMF (2), [Zn2(ClQ)3(HClQ)3]I3 (3), [Zn2(dClQ)2(H2O)6(SO4)] (4) and [Zn2(dBrQ)2(H2O)6(SO4)] (5), which were characterized by IR and NMR spectroscopy, as well as elemental and single crystal X-ray structure analysis. Moreover, the results of cytotoxic and antimicrobial assays and their DNA/BSA binding properties are presented.

2. Results and Discussion
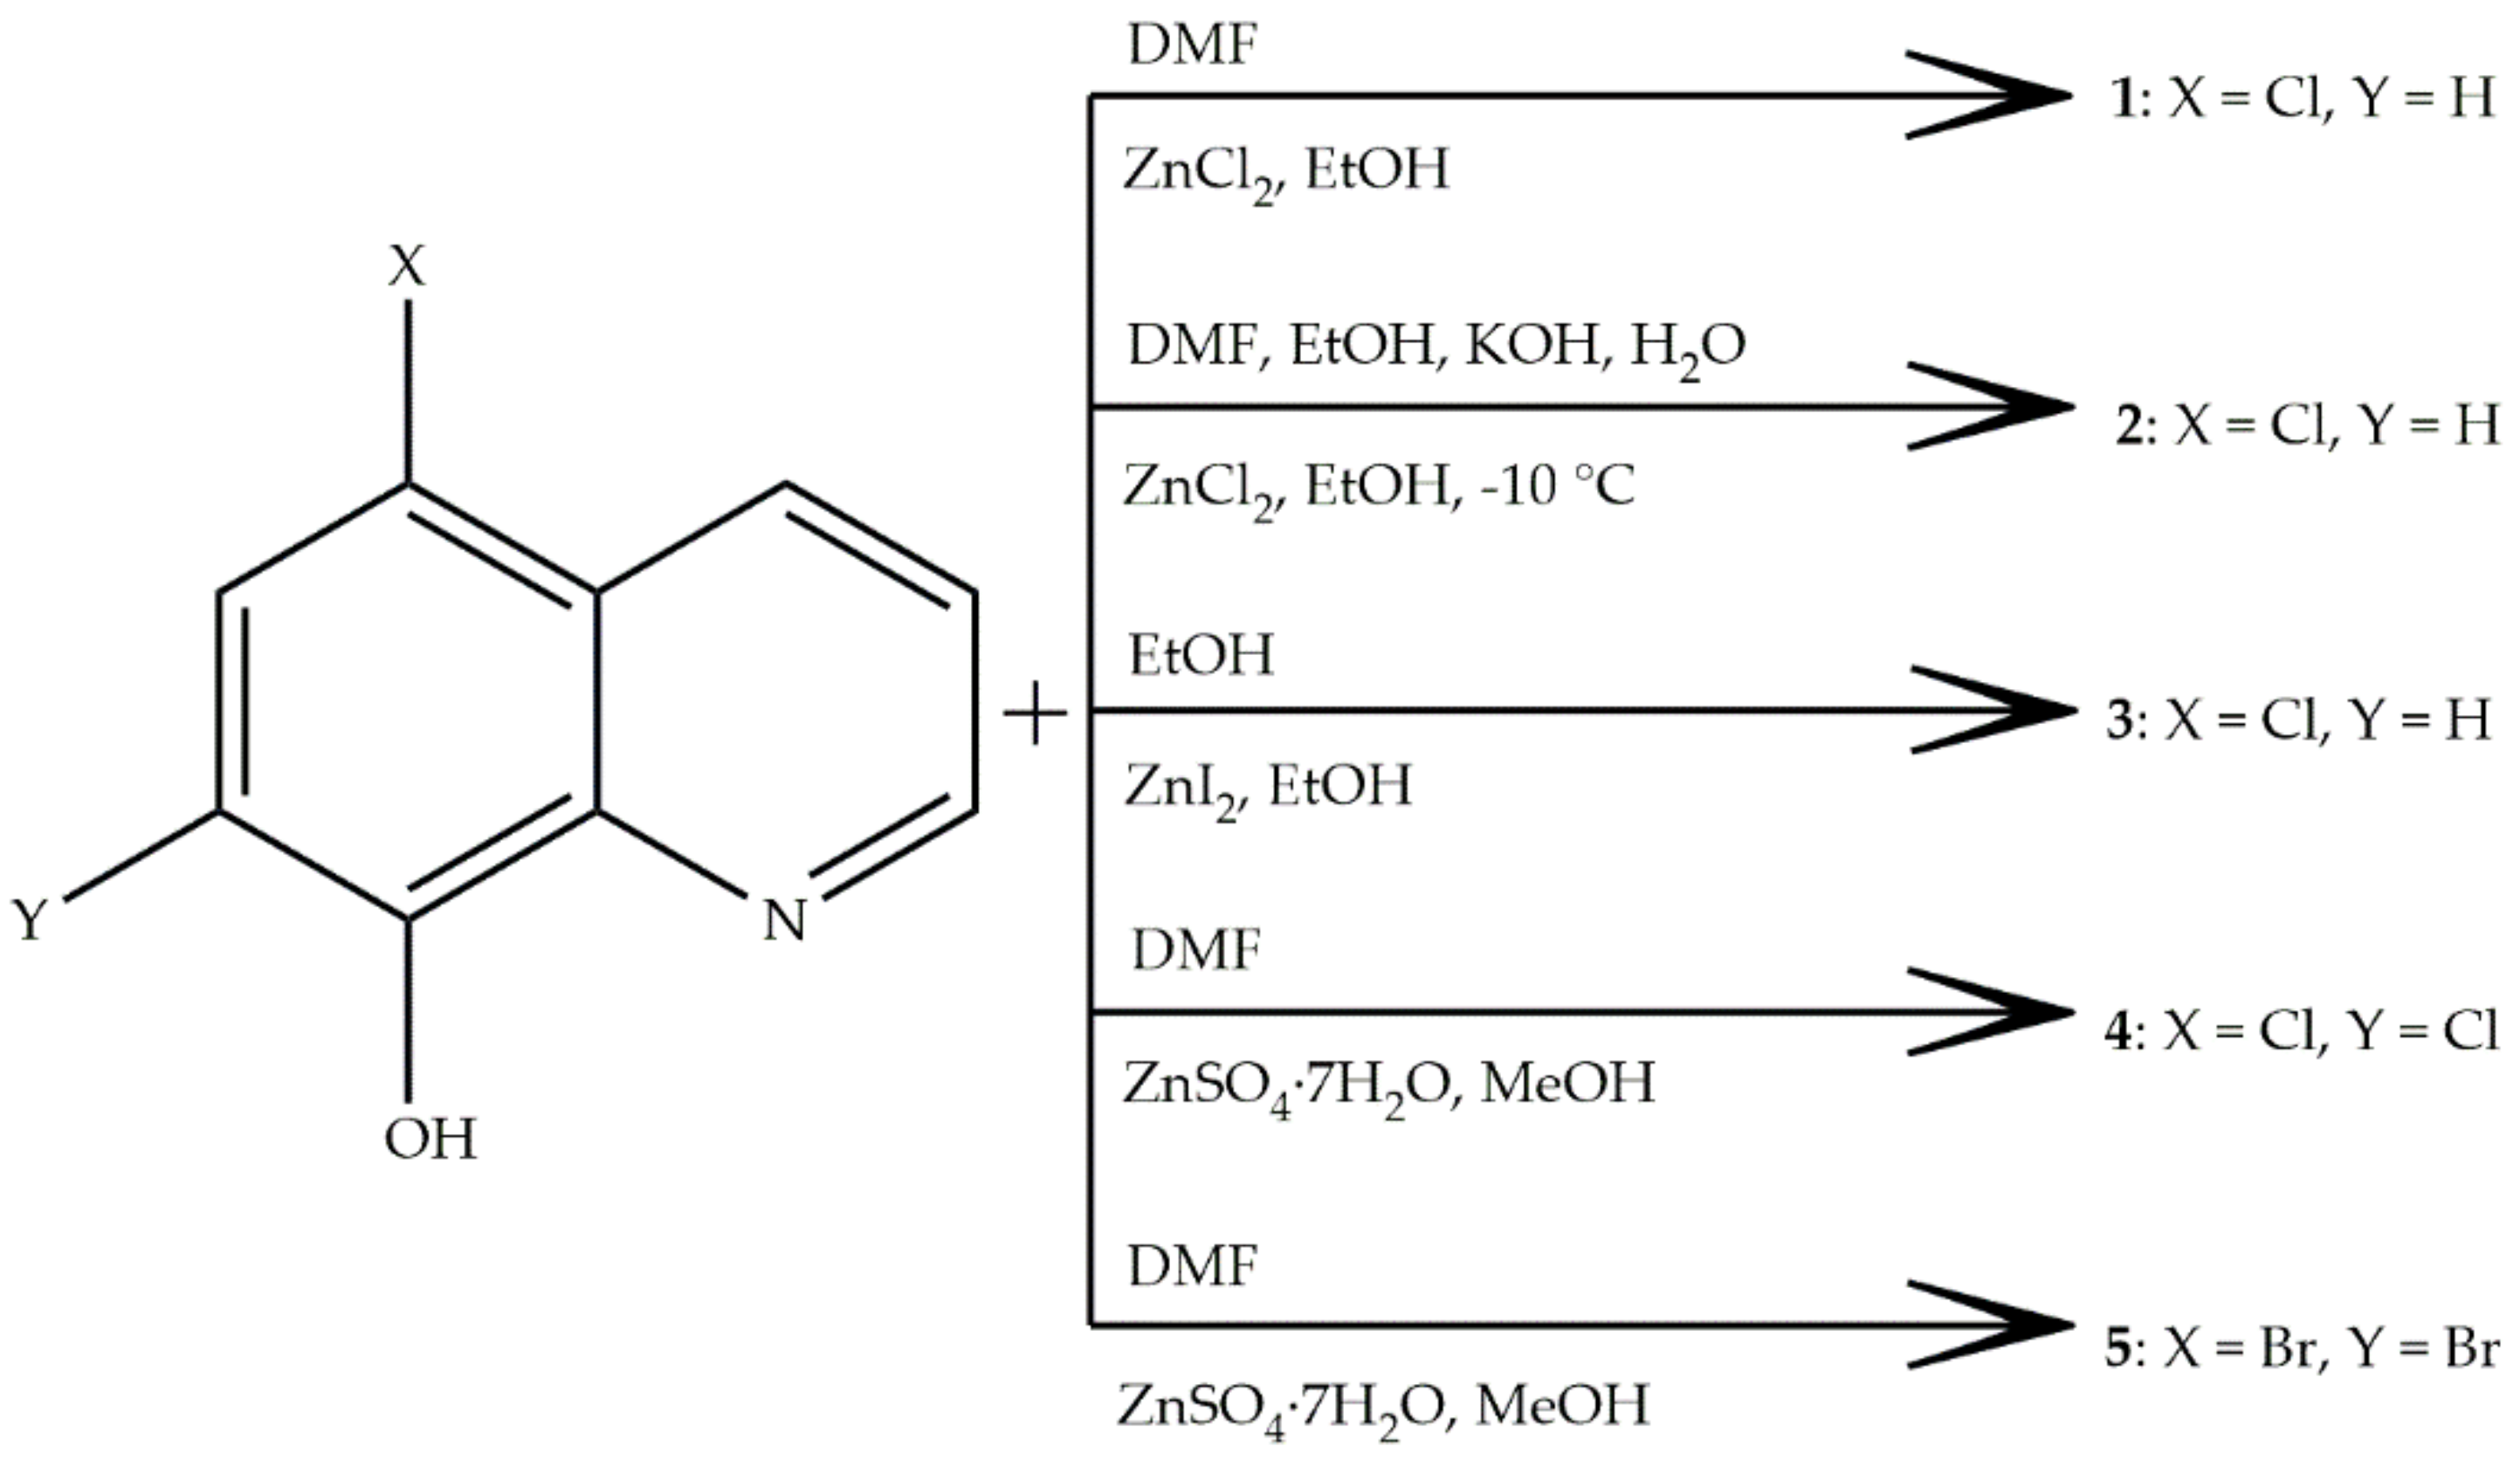
2.1. Syntheses

In this work, we have focused on the preparation of zinc complexes with halogen derivatives of H8-HQ. We have used several zinc salts, solvents, different synthetic strategies and different procedures of crystallization. Regarding solvents, DMF was used to dissolve respective HXQ ligands, while ethanol was used to dissolve zinc(II) chloride or iodide. Because of the better solubility of ZnSO4·7H2O in methanol, for the preparations of sulphato complexes 4 and 5, methanol was used instead of ethanol. The preparation of 1, 3, 4 and 5 was performed at room temperature by a simple one-pot synthesis. After the mixing of reactants, complexes were isolated after several months of crystallization at room temperature. On the other hand, the preparation of 2 was performed at low temperatures; moreover, KOH was used to improve deprotonation of the HClQ hydroxyl group and crystallization was carried out at a low temperature in a fridge. It has to be noted that we attempted to prepare complexes with all three HXQ derivatives at room temperature and also under reflux either with or without added KOH; however, no other products were obtained. Figure 1 schematically describes the synthetic procedure used for the synthesis of 15.

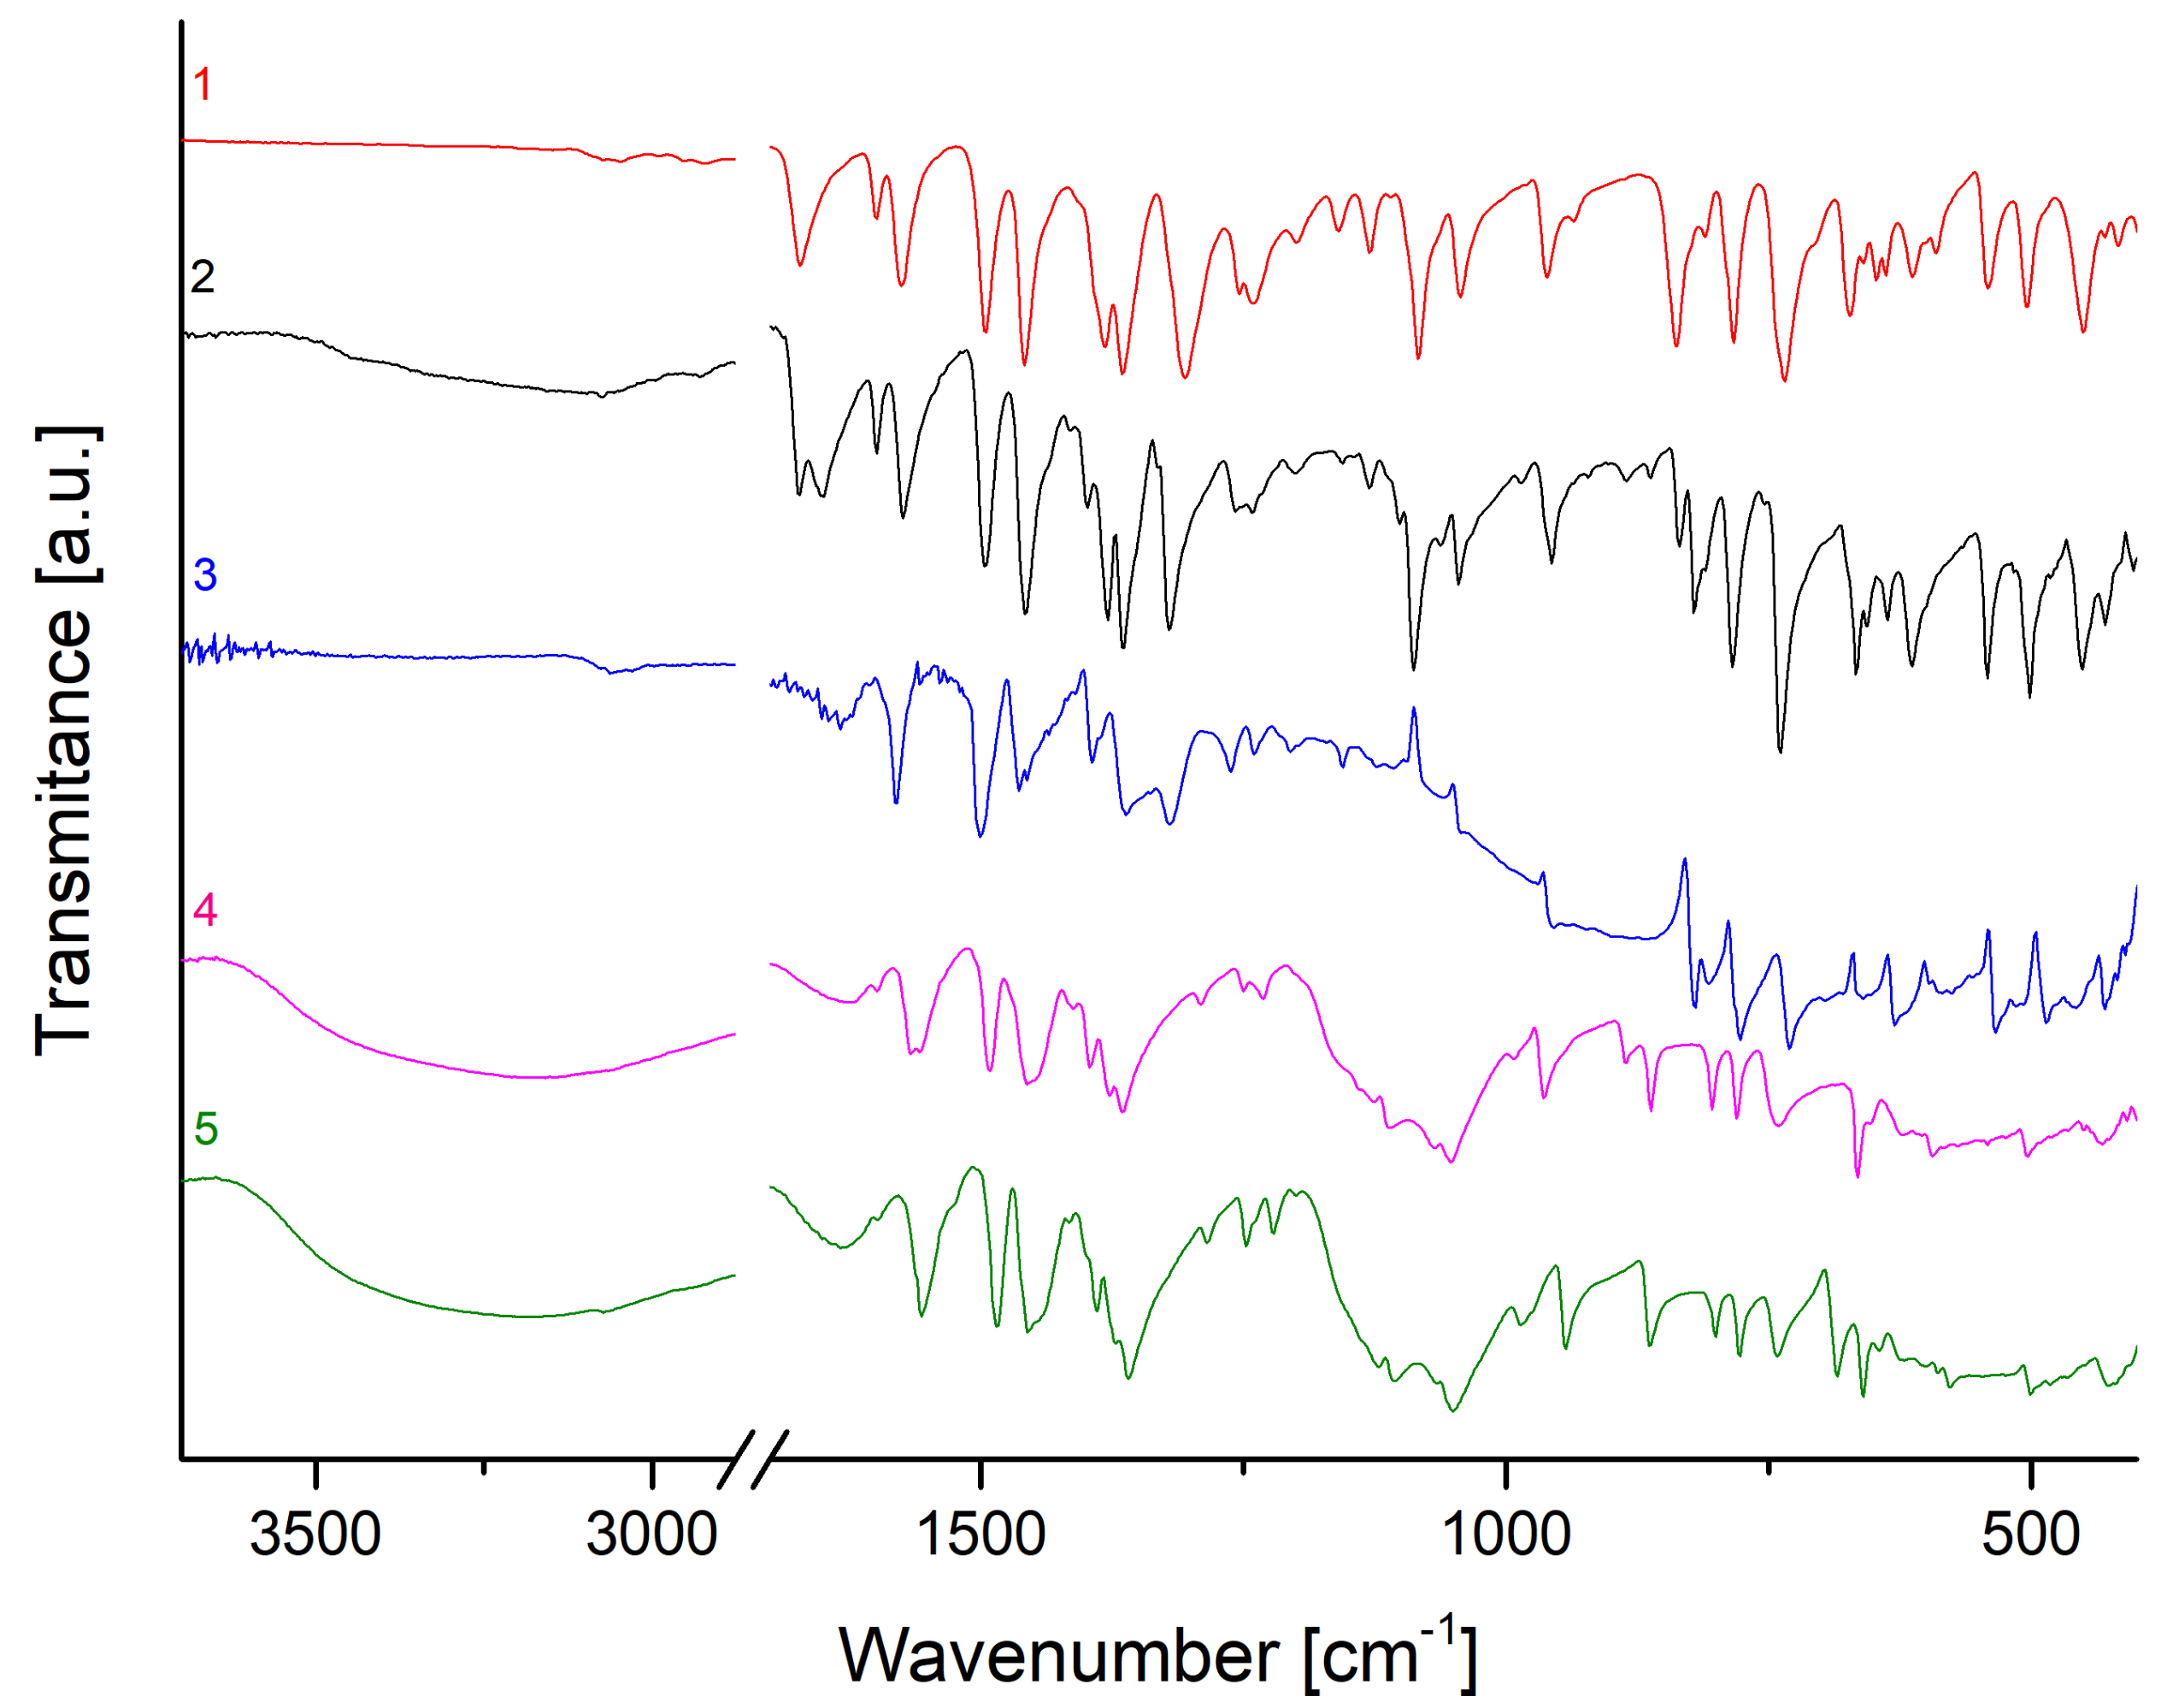
2.2. Infrared Spectroscopy

The presence of HXQ ligands in 15 was first proven by IR spectroscopy. The IR spectra of pure HdClQ, HdBrQ and HClQ ligands have already been described [21,22]. The characteristic vibrations of the free ligands include the ν(O–H) vibration, which manifests as a broad band starting at 3360 cm−1 and ending with a vibration band of ν(C–H)ar at 3060 cm−1, and its absence in 15 suggests the coordination of the respective ligand to the zinc atom through the oxygen atom after the deprotonation of a hydroxyl group. The coordination of the ligands to the zinc atom through pyridine nitrogen atom is supported by the characteristic shift of ν(C=N) bands to lower frequencies in the spectra of 15 (1462–1454 cm−1) compared to the free ligands (1470–1460 cm−1). The remaining ligands bands are still present in the spectra of the complexes. However, they are often shifted compared to the IR spectra of free ligands.
Tetranuclear complexes 1 and 2 have a similar composition with two extra water molecules in 2 and thus their IR spectra will be discussed together. Despite the presence of water molecules, in the spectrum of 2 the valence vibration of the OH group is not clearly visible (Figure 2). We attribute it to a wide band starting at 3305 cm−1, which smoothly passes into the ν(C–H)ar vibration observed at 3076 cm−1. On the other hand, the planar deformation vibration of H2O is clearly visible (1650 cm−1); however, the bands of the rocking, twisting and wagging vibrational modes of coordinated water molecules, which should appear in the spectrum in the ranges of 970–930 cm−1 and 660–600 cm−1 [23], are again missing. DMF molecules in both complexes are proven by the weak bands of ν(C–H)al vibrations between 2990 and 2850 cm−1 and by strong absorption bands of ν(C=O) vibration at 1672 cm−1. The absorption bands of ClQ ligands are at the same wavenumbers in both spectra and are close to those of free ligands with the exception of the above-mentioned ν(O–H) and ν(C=N) bands.
IR spectrum of 3, which contains the same ClQ ligand, is similar to those of 1 and 2; of course, the absorption bands of water and DMF molecules are missing.
The composition of 4 and 5 is again very similar; both complexes differ only by HXQ ligands. The presence of water molecules in these complexes is proven by strong and wide bands of ν(O–H) vibration starting at 3630 cm−1 and ending by ν(C–H)ar vibrations observed at 3072 cm−1, as well as by deformation vibrations around 1630 cm−1.
We observed huge bands around 1110 and 1050 cm−1 in the spectra of 4 and 5, which can be attributed to the νas(S–O) and νs(S–O) valence vibrations, respectively, originating from the sulphato ligand (ZnSO4⋅7H2O was used in the synthesis). The weak bands of deformation vibrations of the SO4 group around 624 cm−1 are also observed in the spectra [24]. The main difference in the bands of HdClQ and HdBrQ ligands present in 4 and 5, respectively, are the bands of ν(C5–X) vibrations. In 4, the ν(C5–Cl) vibration is observed at 964 cm−1 (in the spectra of complexes 13 with HClQ ligand, corresponding bands are between 961 and 955 cm−1) while ν(C5–Br) vibration is observed at 943 cm−1 in the spectrum of 5. On the other hand, ν(C7–X) vibrations that were absent in the spectra of 13 are in the spectra of 4 and 5 at the same wavenumber, 863 cm−1 [21,25,26].

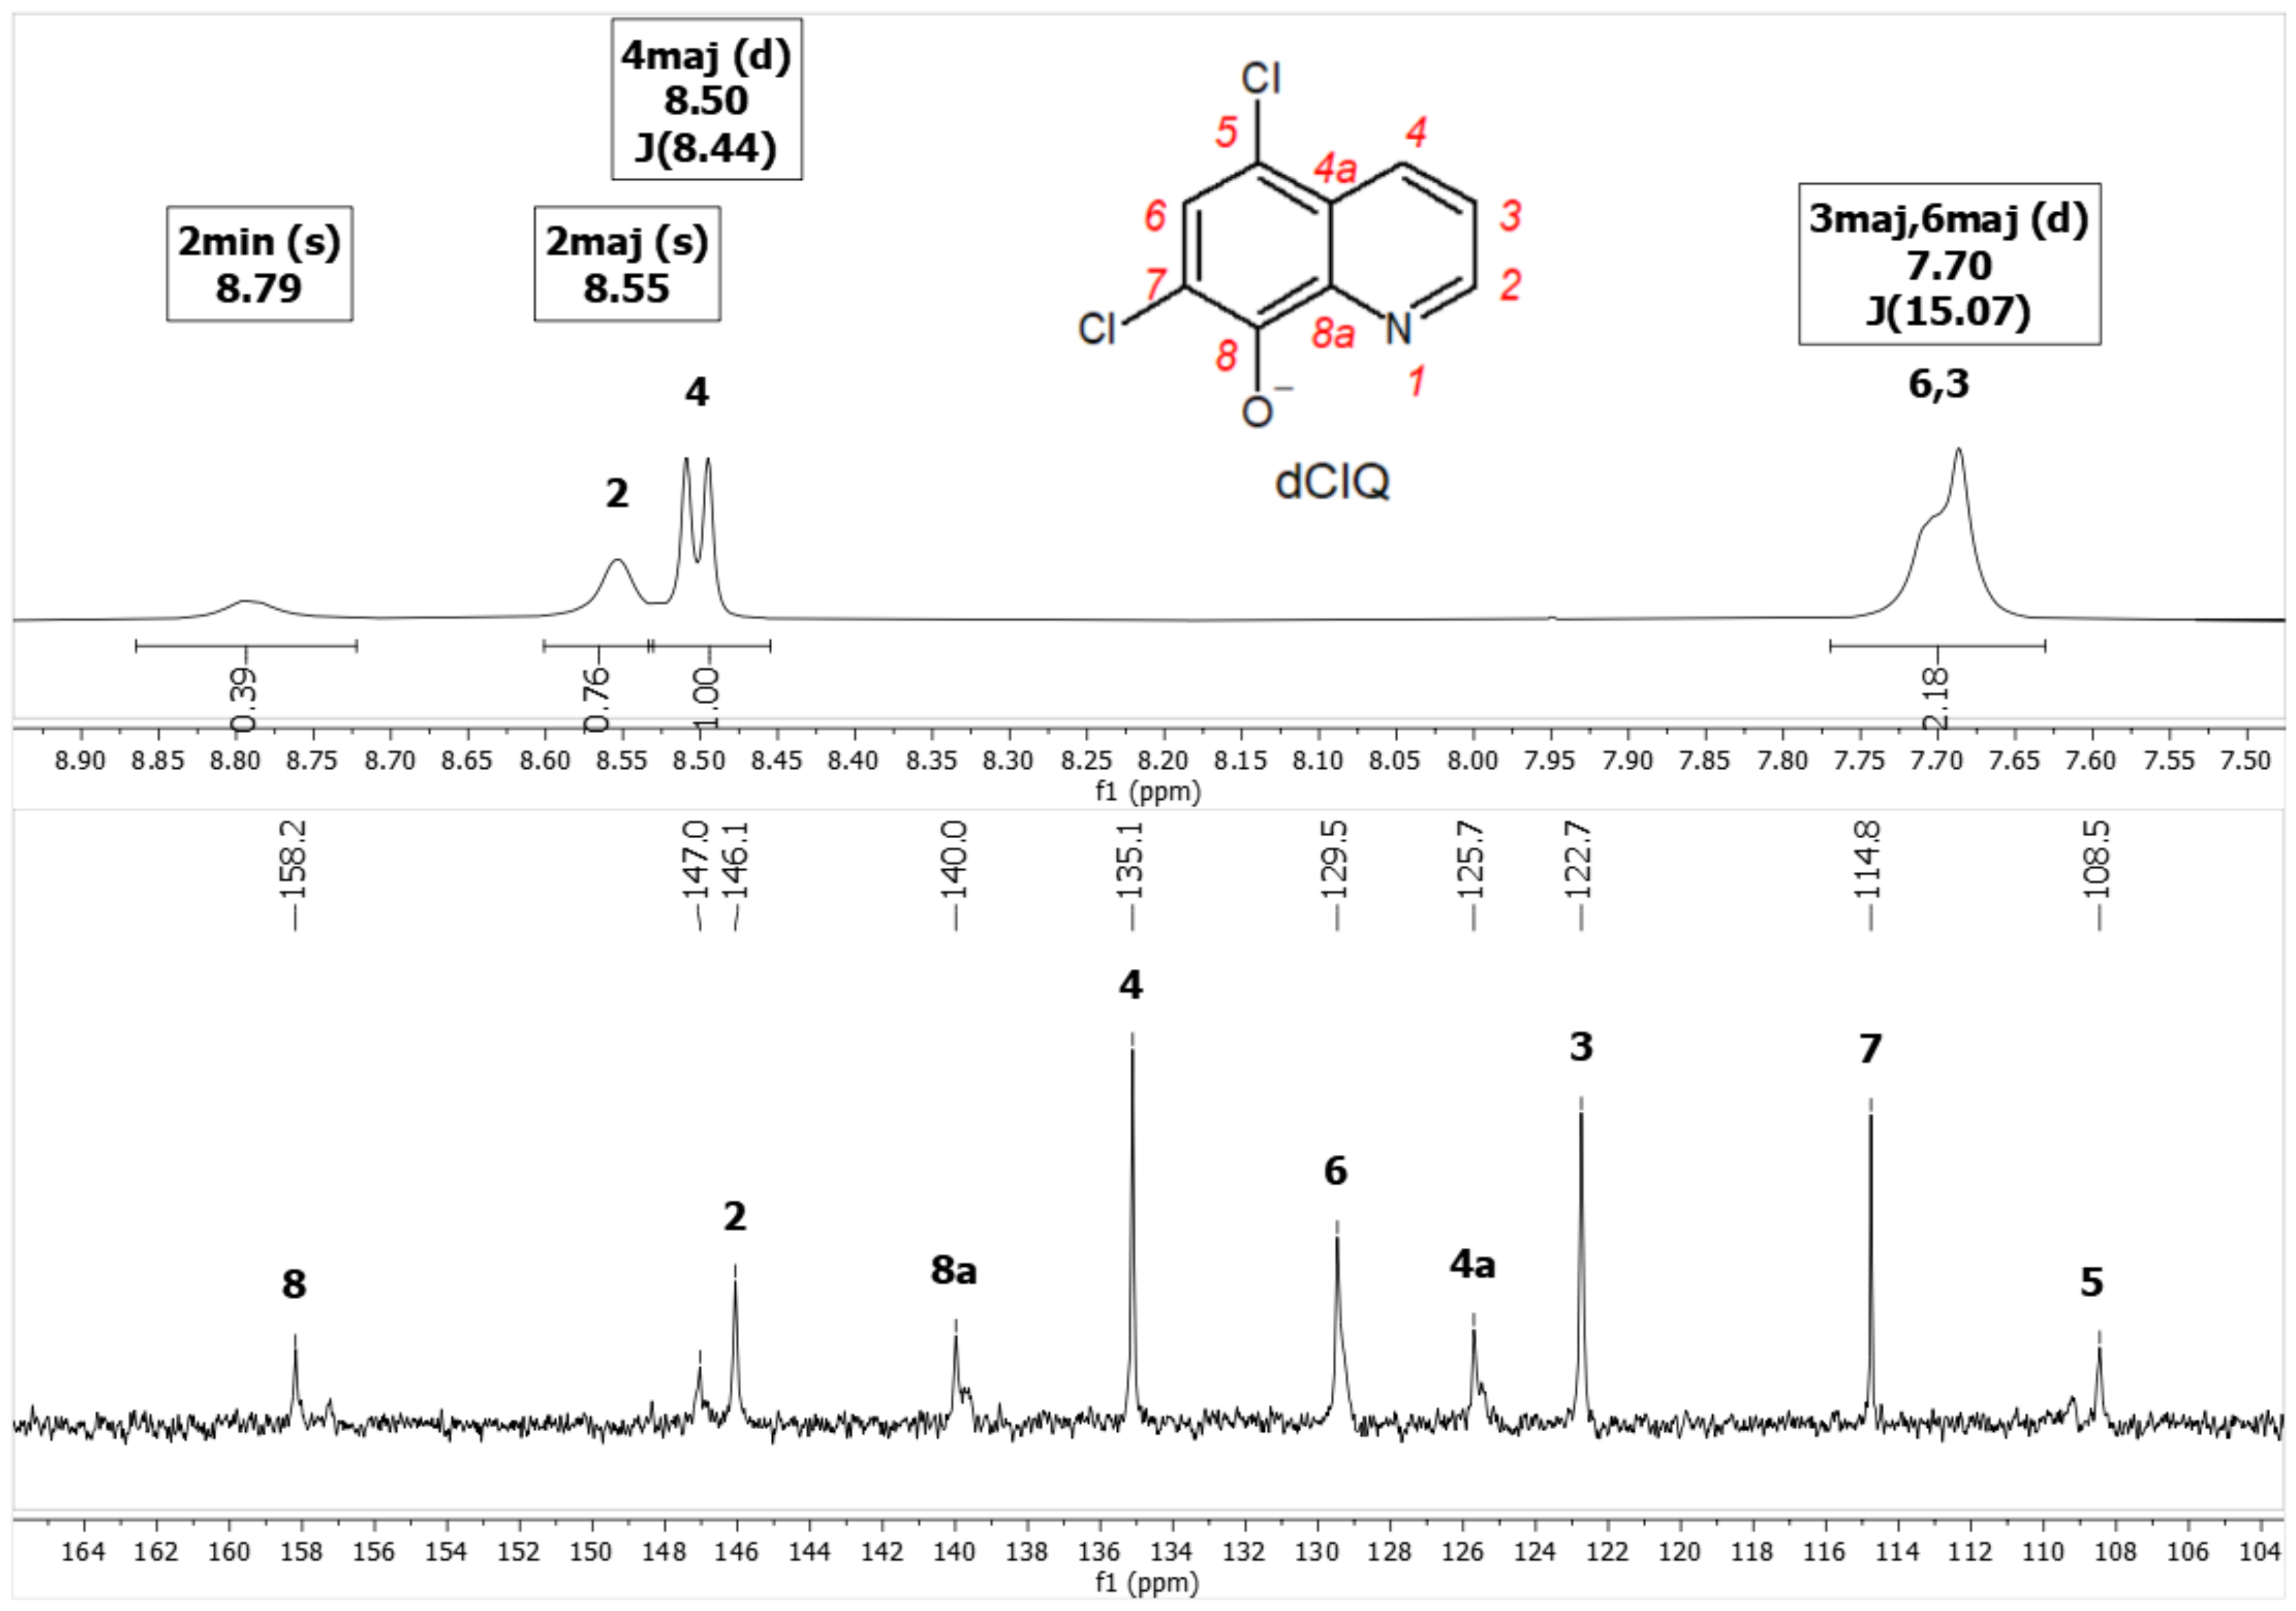
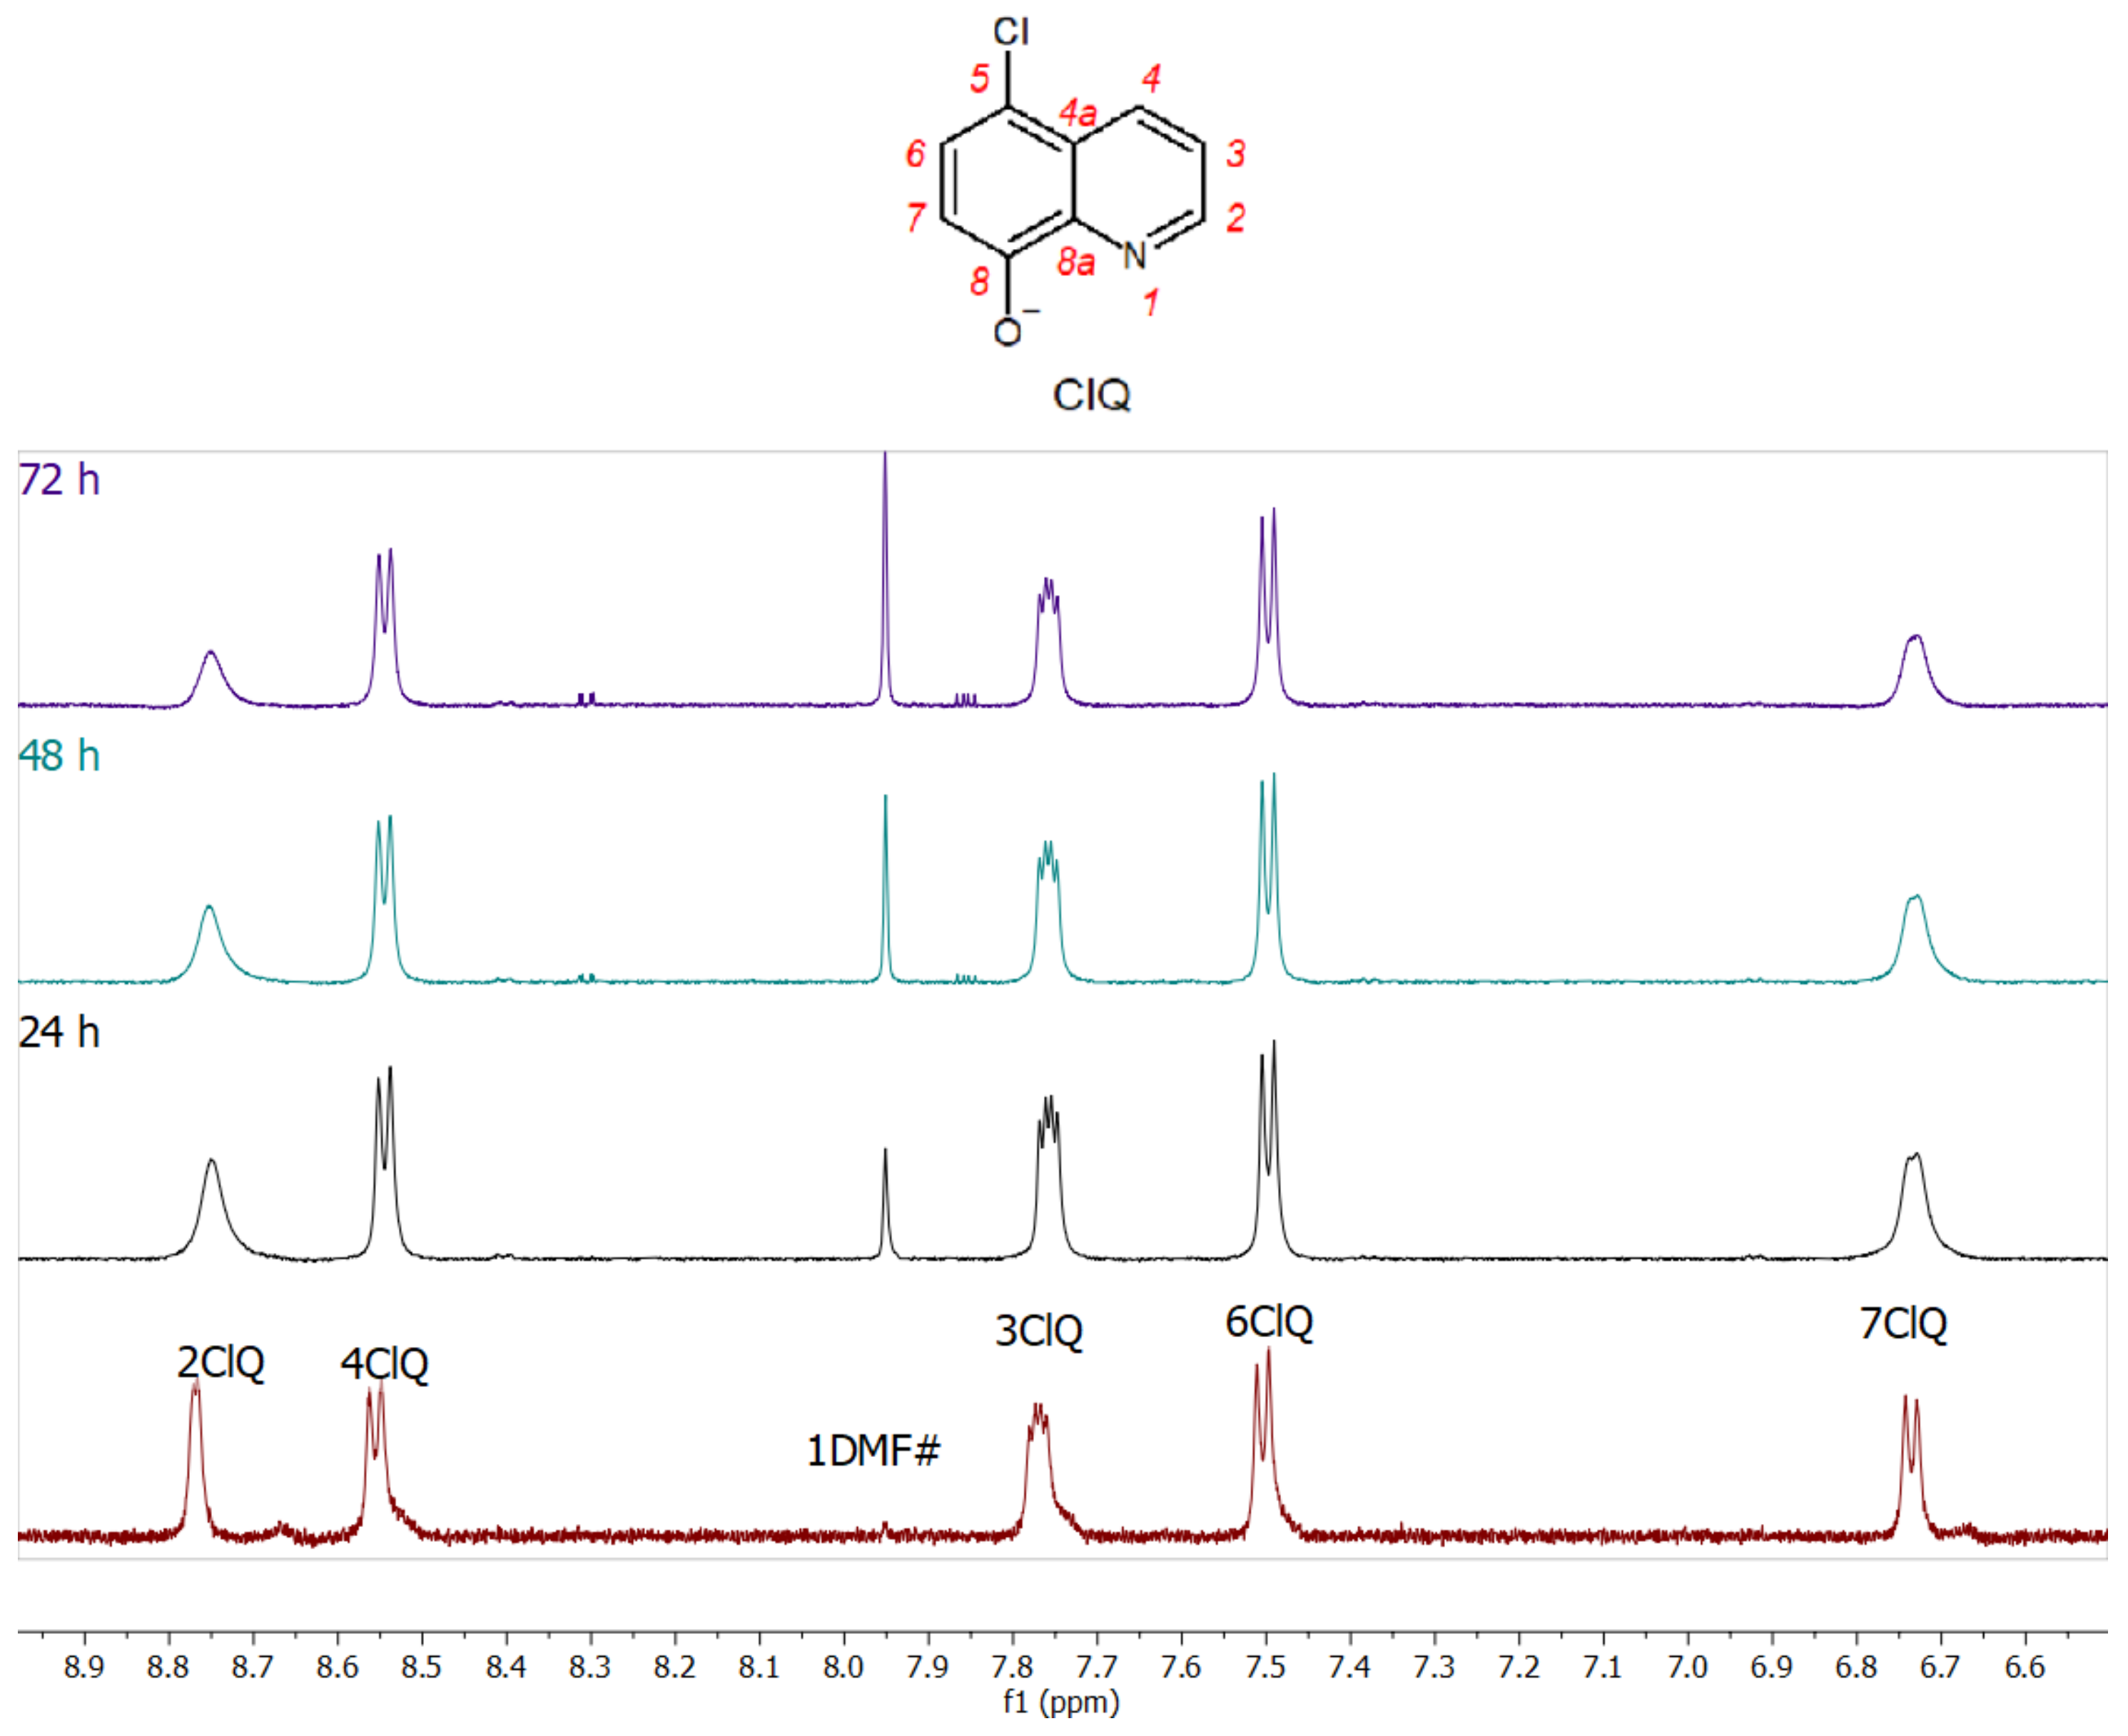
2.3. NMR Characterization and Stability Studies

The assignment of resonances for individual proton and carbon atoms within all complexes were made based on 1H, 13C and 1H, 13C-COSY, 1H, 13C-HSQC, 1H and 13C-HMBC spectra. These studies were performed at 298 K. The data obtained from these spectra are listed in Table 1 and Table S1. It should be noted that the same sets of proton and carbon signals were detected for each quinoline ligand of 1 and 2 because their composition is almost the same. They only differ by the presence of two water molecules in the coordination sphere of complex 2 whose signals are overlapped by the signals of water from DMSO-d6. On the other hand, the separate and broadened signals were detected for complexes 3, 4 and 5.
Based on the crystal structures, we assume that complexes 1 and 2 should have symmetric structures in solution and 1H NMR spectra display only one set of chemical shifts (Table 1), corresponding to the appropriate units, and no fluxional phenomena were observed for these complexes.
Figure S1 displays the 1H NMR spectrum for 3. At 25 °C, the 1H NMR spectrum consists of broadened signals attributable to the protons of ClQ and HClQ ligands. At first sight, one could think that this effect arises from a dynamic within a system. However, it is most likely that broadened signals of 3 arise from its low solubility and the presence of some particulate matter in the solution. For the same reason, it was not possible to measure 13C and 2D NMR spectra and to assign carbon chemical shifts.
We assumed that in the solution, 4 and 5 would give well-resolved signals like the above-described complexes 1 and 2. 1H NMR experiments confirmed the opposite to be true. 1H NMR spectra of complexes 4 and 5 contained broadened peaks consistent with the presence of a dynamic exchange process. As illustrated by Figure 3 and Figure S2, in the 1H NMR spectrum of 4 only, signals belonging to proton H-2 are broadened, and in the 1H NMR spectrum of 5, almost all proton signals H-2, H-3 and H-4 are broadened. All broadened proton signals are shifted to the low field. This observation indicated that protons described as major must exchange positions with protons signed as minor. It is a consequence of the slow proton exchange of 4 and 5 within the NMR time scale. Similarly, 13C signals of 4 and 5 (Figure 3 and Figure S2) exhibited very interesting changes. At ambient temperature, signals belonging to carbons C-8, C-2, C-8a, C-4a and C-5 of 4 are doubled. We expected a similar pattern for the complex 5, but the very low solubility of the complex in DMSO-d6 caused the minor form signals to not be well distinguished (Figure S2). Only the signals of carbons C-4, C-6 and C-4a are visibly doubled.
Because of the different structures of all studied complexes, complexes 4 and 5 are fluxional and are characterized by the proton position exchange without the dissociation of the complex. If the process occurred with dissociation, the process should be associated with the presence of free ligand peaks in NMR spectra, which is not the case.
The stability of the complexes 15 in DMSO-d6 solution was tested using 1H NMR time-dependent spectra to evaluate their suitability for biological testing.
As shown in Figure 4 and Figure S3, at ambient temperature, the time-dependent 1H NMR spectra of complexes 1 and 2 show peaks corresponding to the one set of chemical shifts, an indication of the presence of complexes that are structurally the same for 72 h. However, as shown in Figure 4 and Figure S3, the 1H NMR spectra after 48 h show new peaks at δH 10.20 (s, OH), 9.03 (dd, J 4.7, 1.7, H-2), 8.31 (dd, J 7.9, 1.7, H-4) and 7.86 (dd, J 7.9, 4.7, H-3). Whereas the signals belonging to protons H-6 and H-7 are not detectable. By comparing chemical shifts with free ligand shifts (1H NMR (600 MHz, DMSO-d6): δH 10.18 (s, OH), 8.94 (dd, J 4.1, 1.6, H-2), 8.48 (dd, J 8.6, 1.6, H-4), 7.71 (dd, J 8.6, 4.1, H-3), 7.60 (d, J 8.3, H-6) and 7.08 (d, J 8.3, H-7)), we cannot completely exclude complex decomposition. The ratio of the complex and newly formed structure is 90:1 after 48 h and 70:1 after 96 h for 1 and 56:1 after 48 h and 46:1 after 72 h for 2 (based on integral values of H-4 signals). Nevertheless, we believe that the low concentration of the newly formed structures will not significantly affect the results of biological activity tests. Contrary to our findings, Zhang et al. [27] prepared tetranuclear [Zn4(8-HQ)6Ac2] (Ac = acetate) and [Zn4(MeQ)6Ac2] (MeQ = 2-methyl-8-hydroxylquinoline) complexes, which are very similar to complexes 1 and 2 in our work, and tested them for their stability in the physiological conditions within 48 h. Based on the results of UV-Vis spectroscopy, they concluded that both complexes were stable.
As shown in Figure S3, the 1H NMR spectrum measured the after dissolving of the complex in DMSO-d6 shows broad peaks corresponding to complex 3. After 24 h, spectrum becomes somewhat better resolved but remains broad. It can be confirmed that all time-dependent spectra (24–72 h) are consistent with the structure of complex 3 observed immediately after dissolving. Likewise, complexes 4 (Figure S5) and 5 (Figure S6) are stable in the DMSO-d6 solution for 72 h. Minor peaks at δH 8.75 and 8.29 ppm appeared in the spectra (Figure S6) of the complex 5 and can be attributed to the dynamics rather than the decomposition of complex 5.

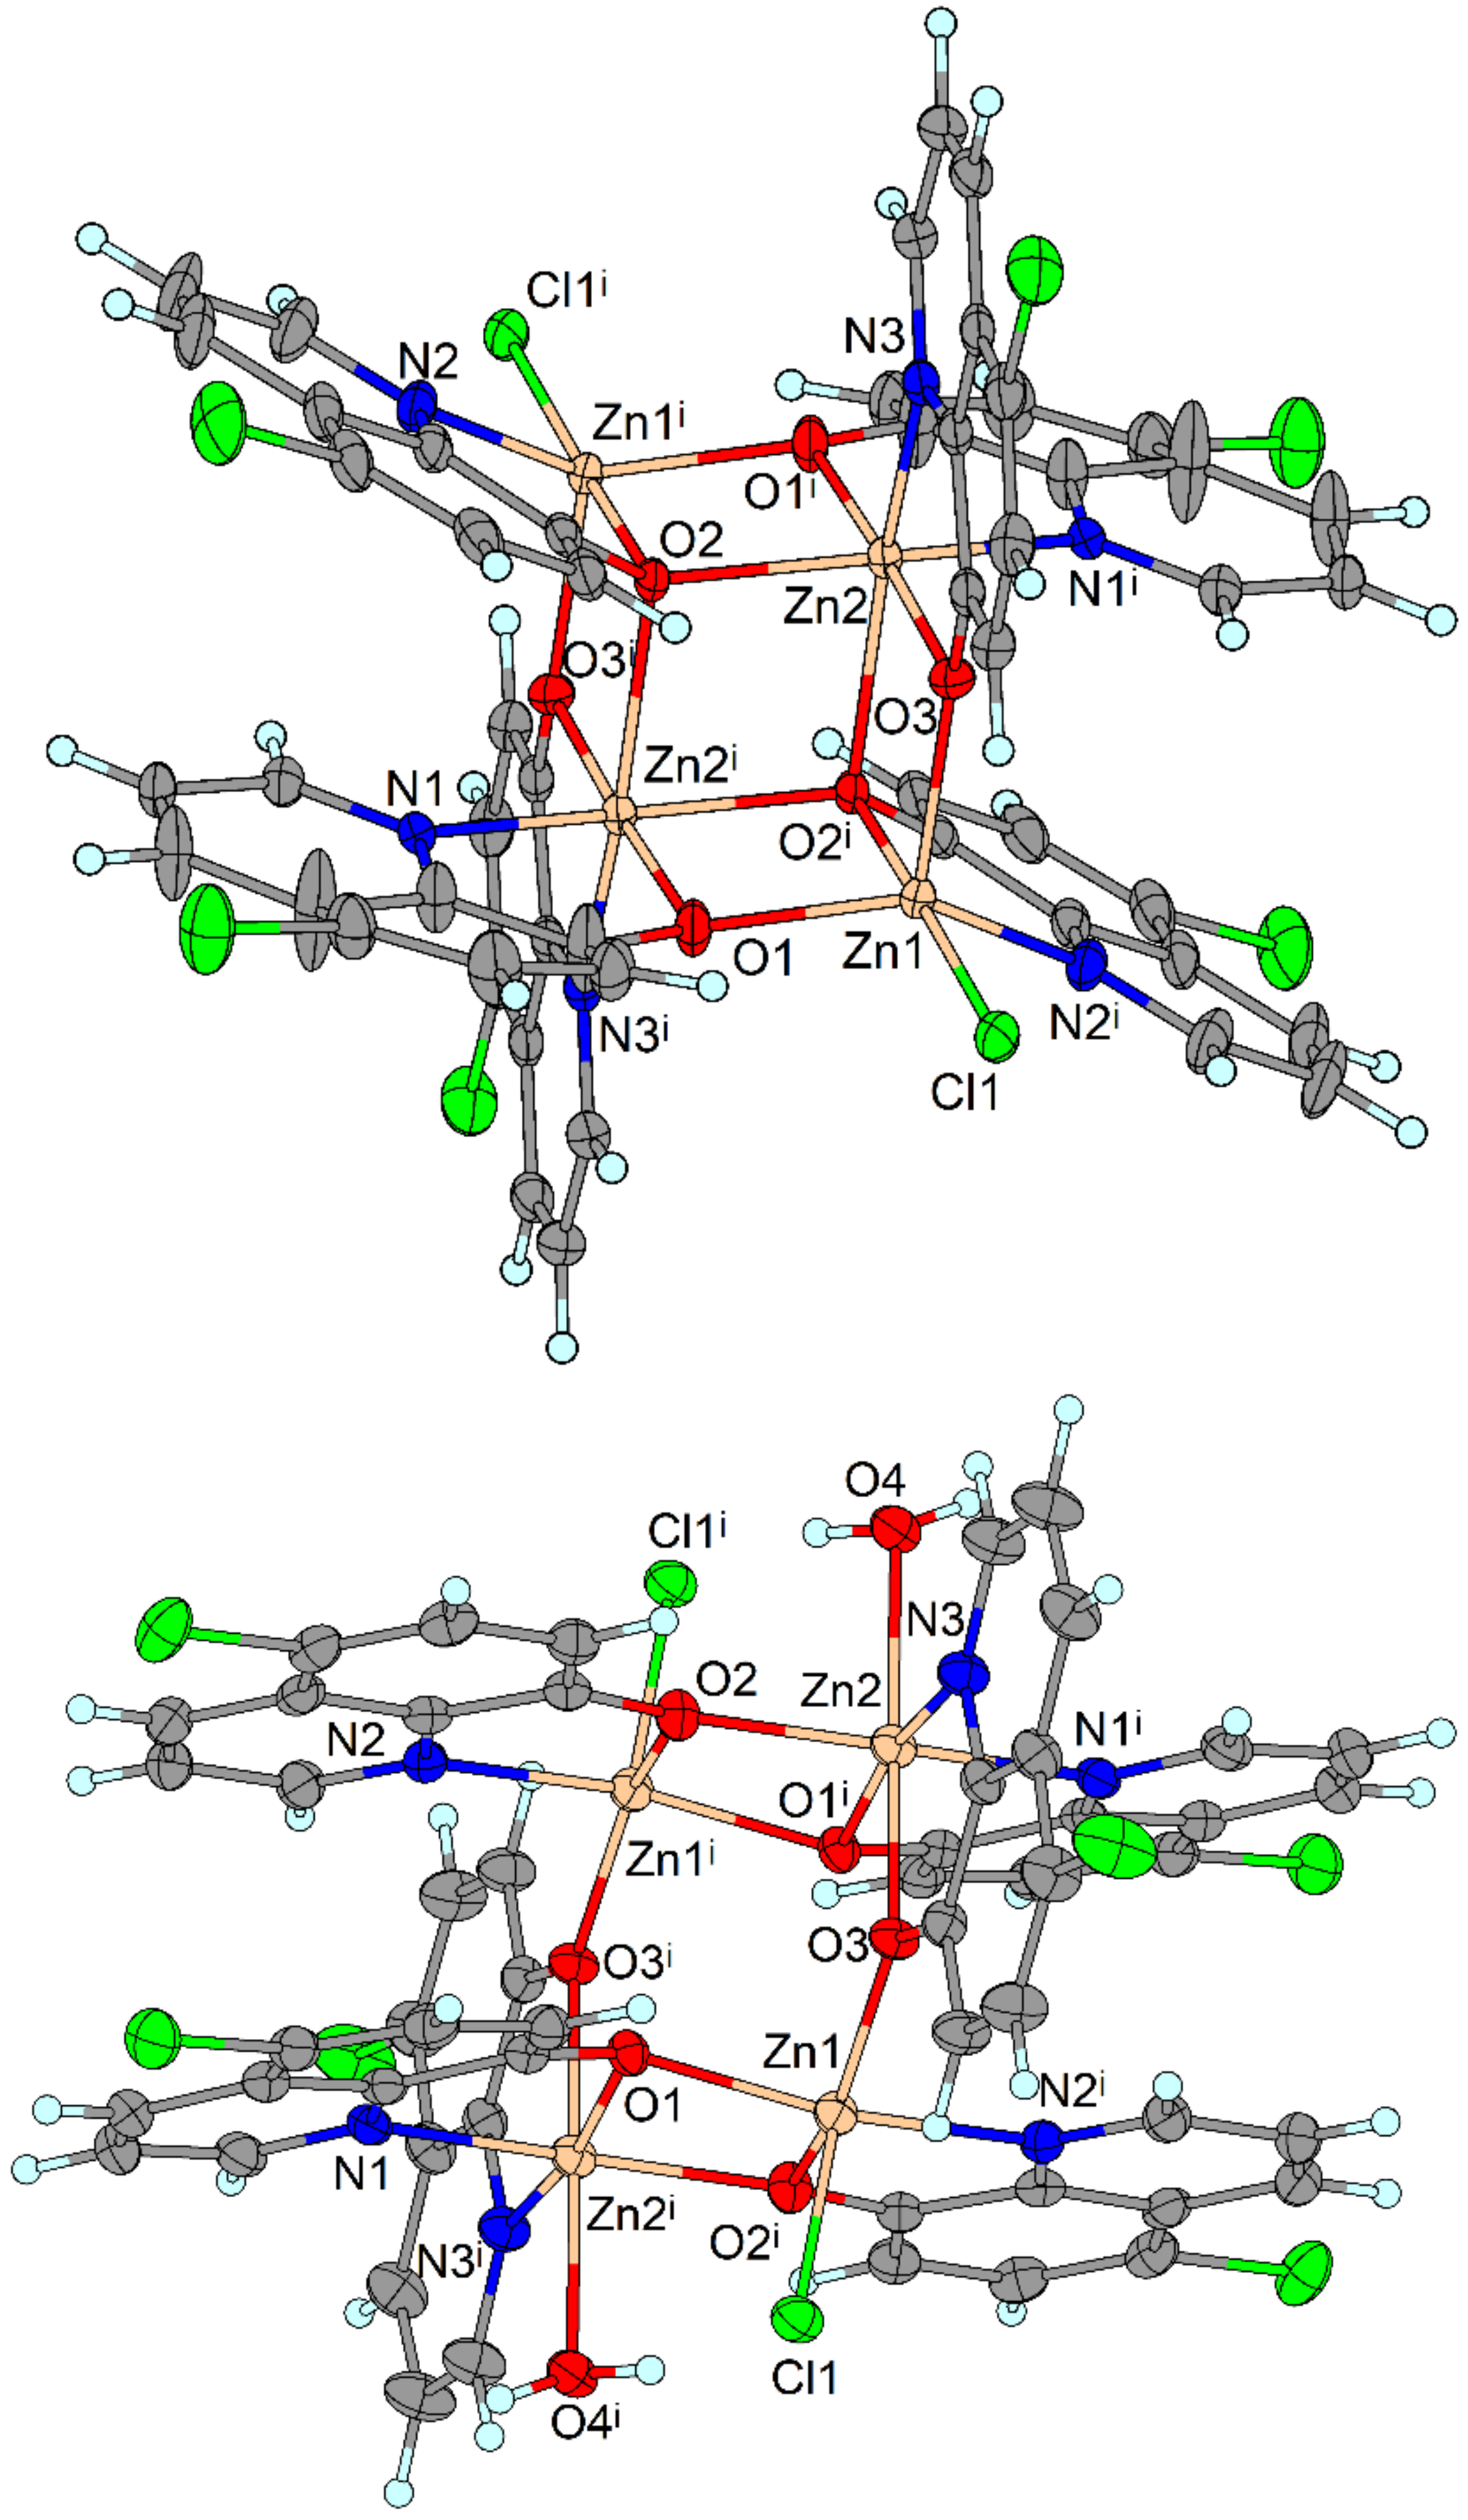
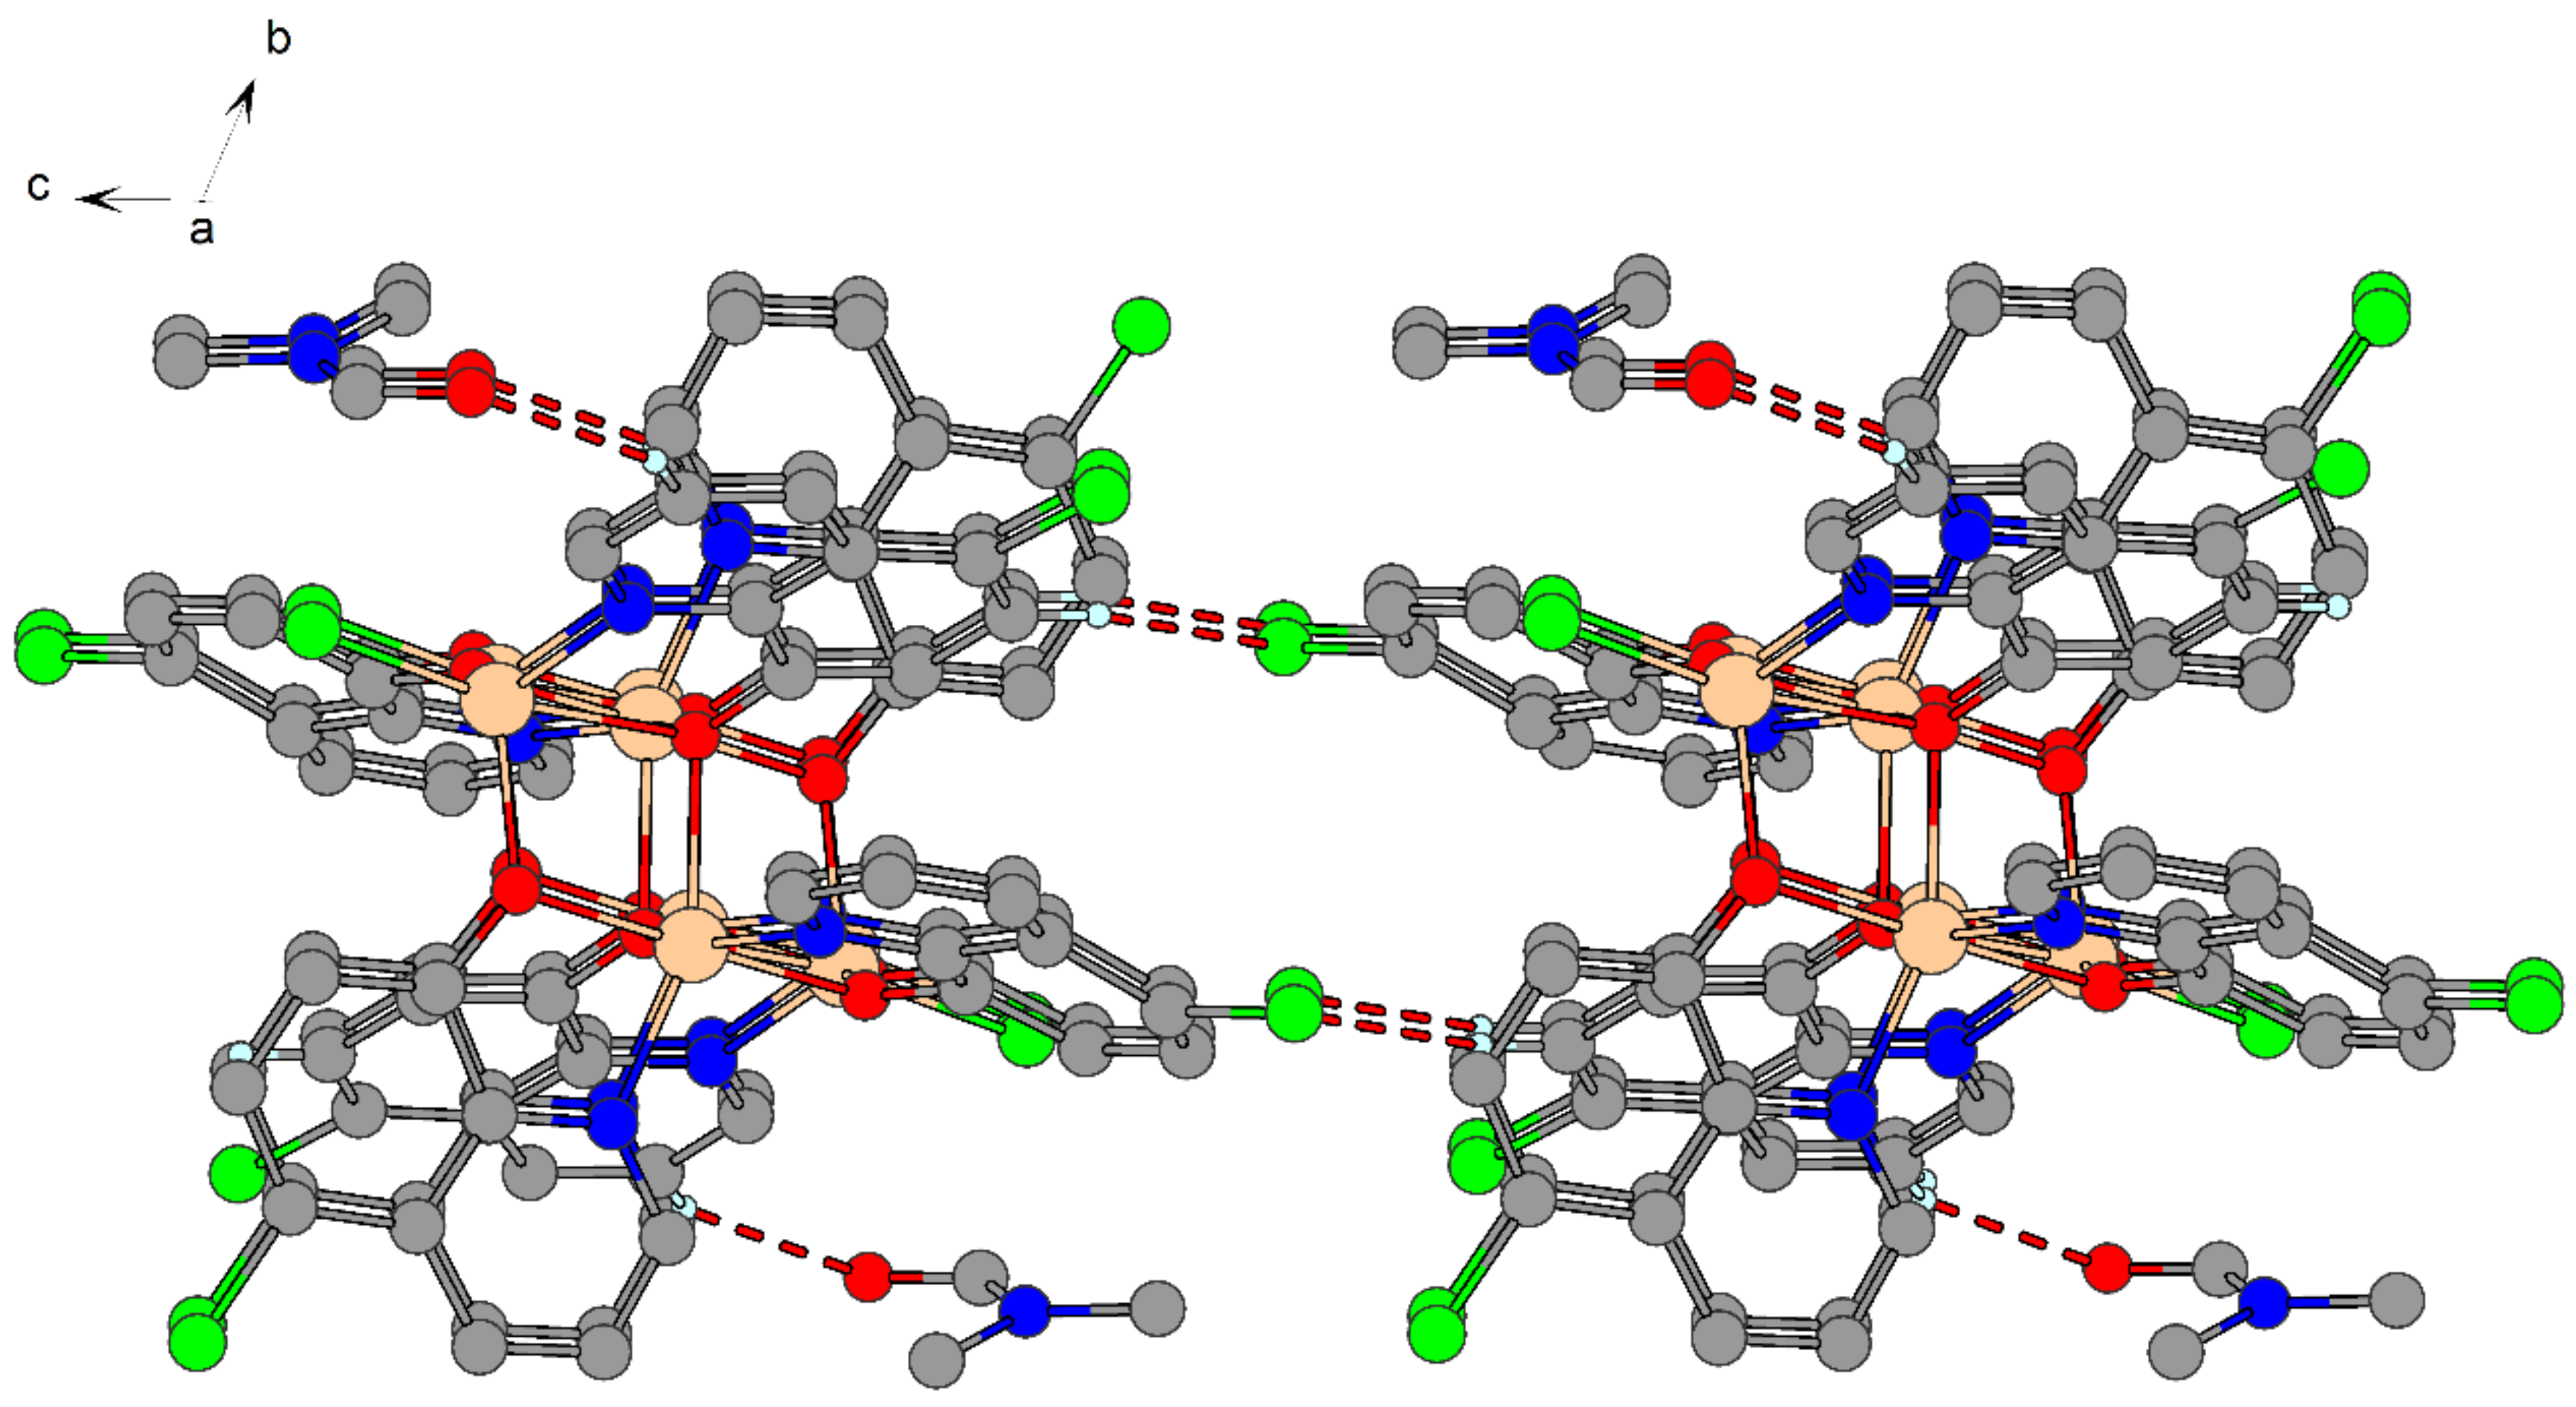
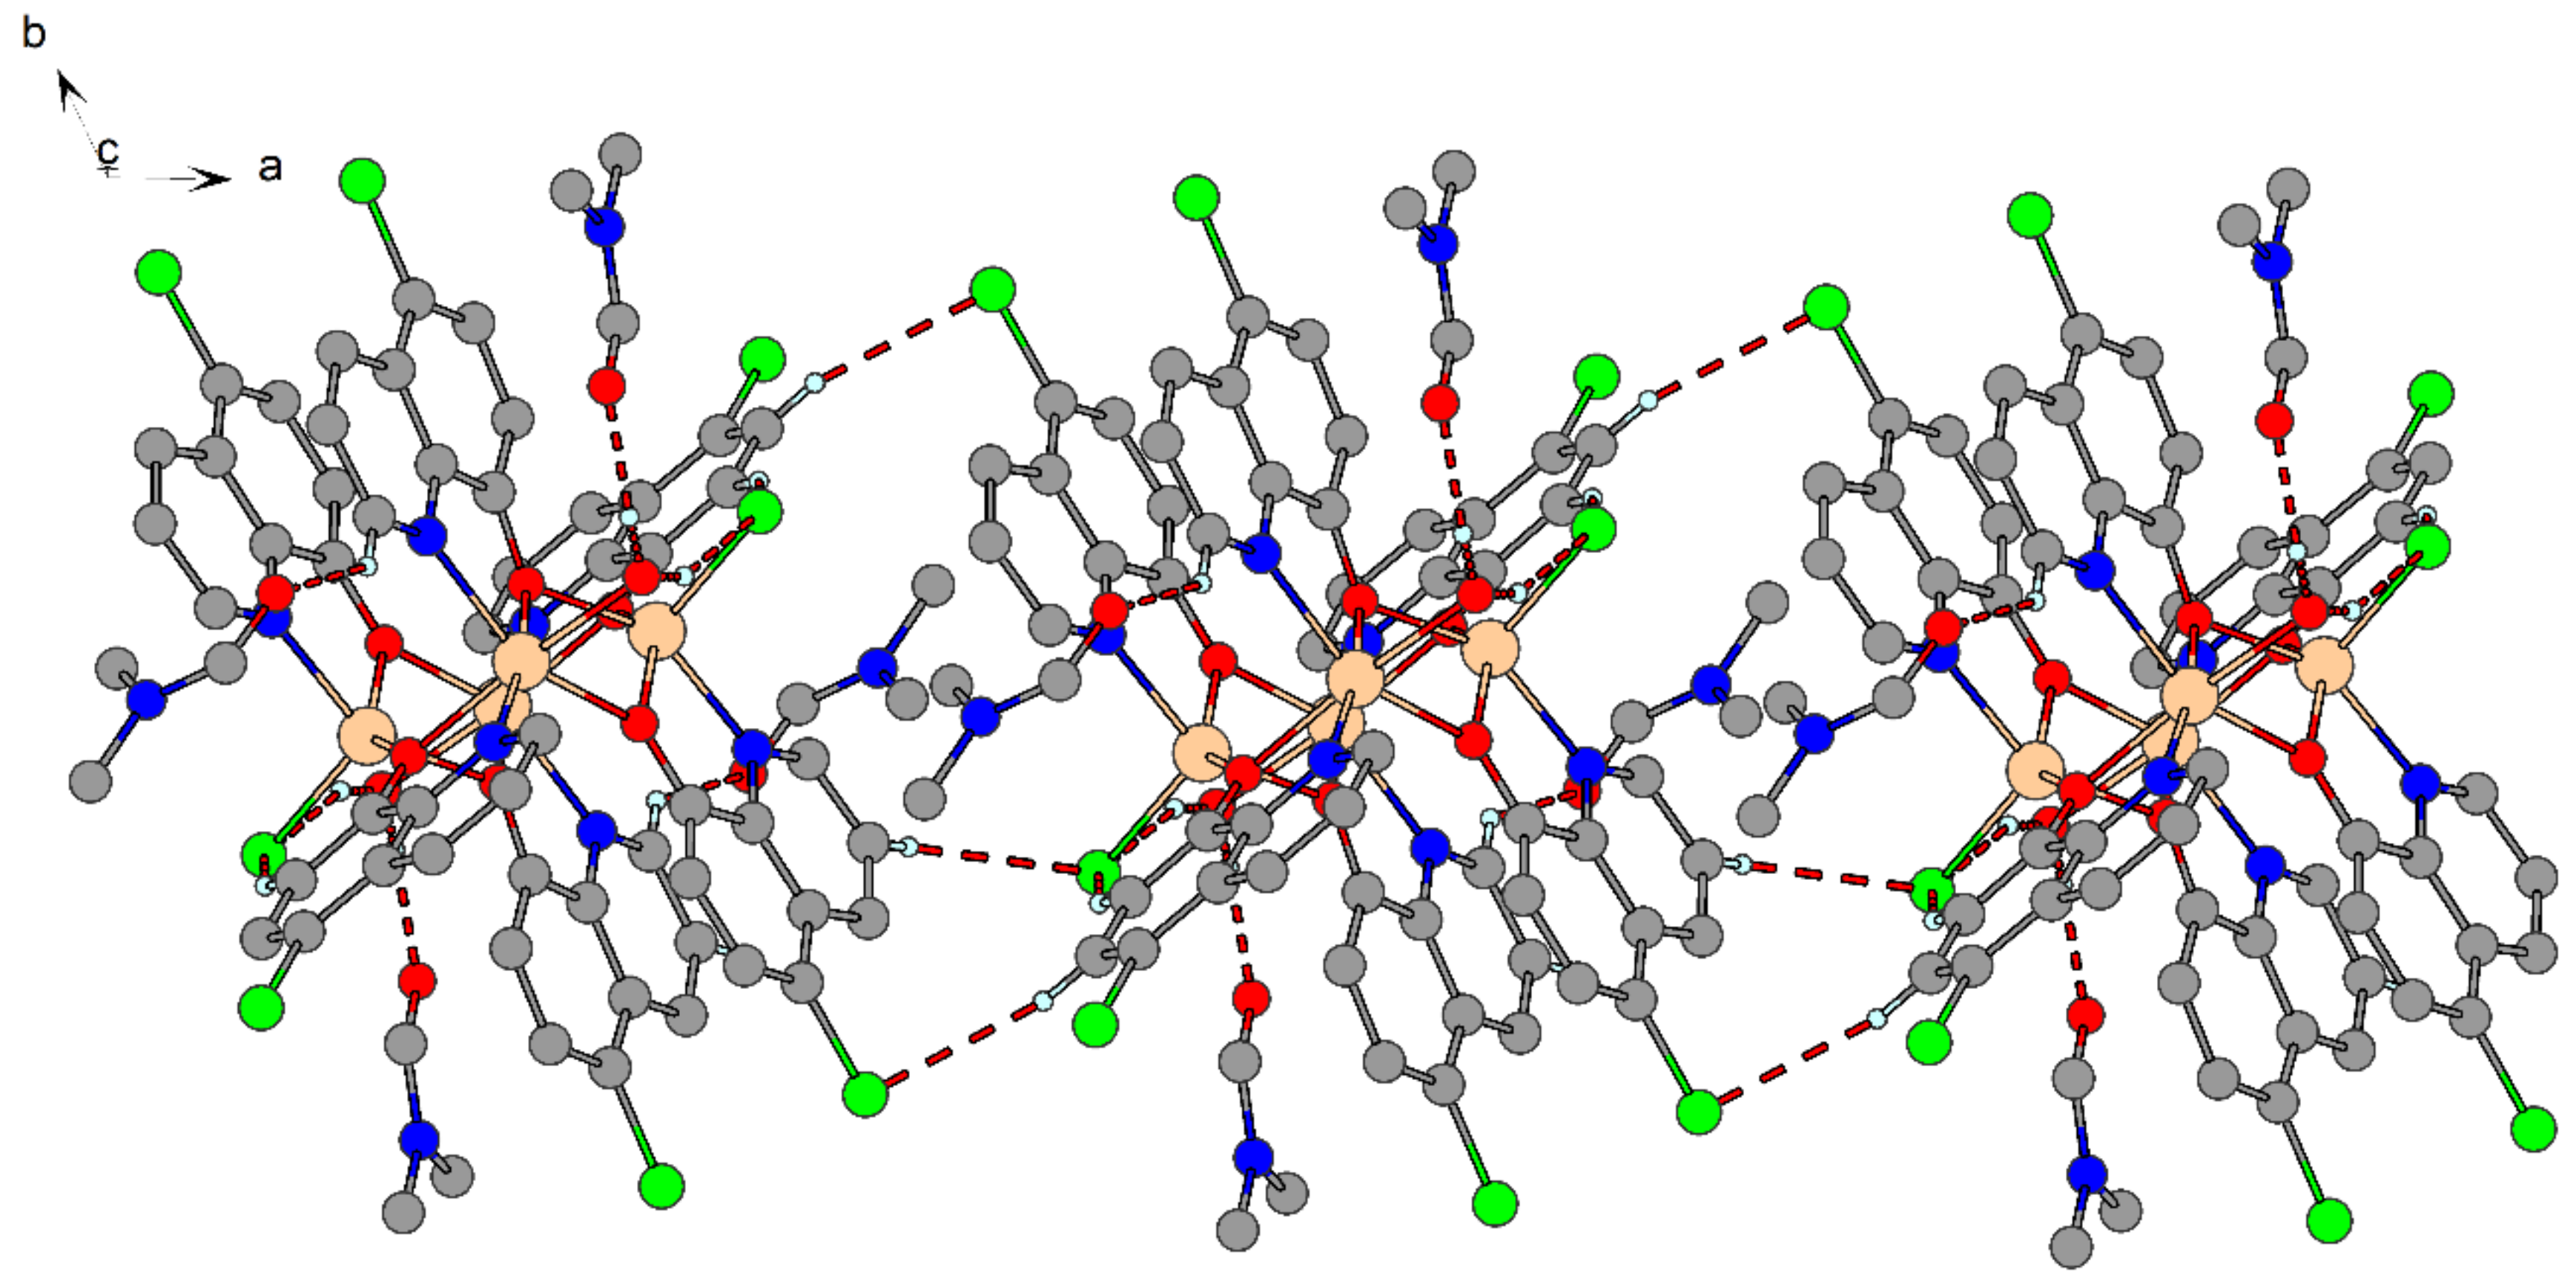
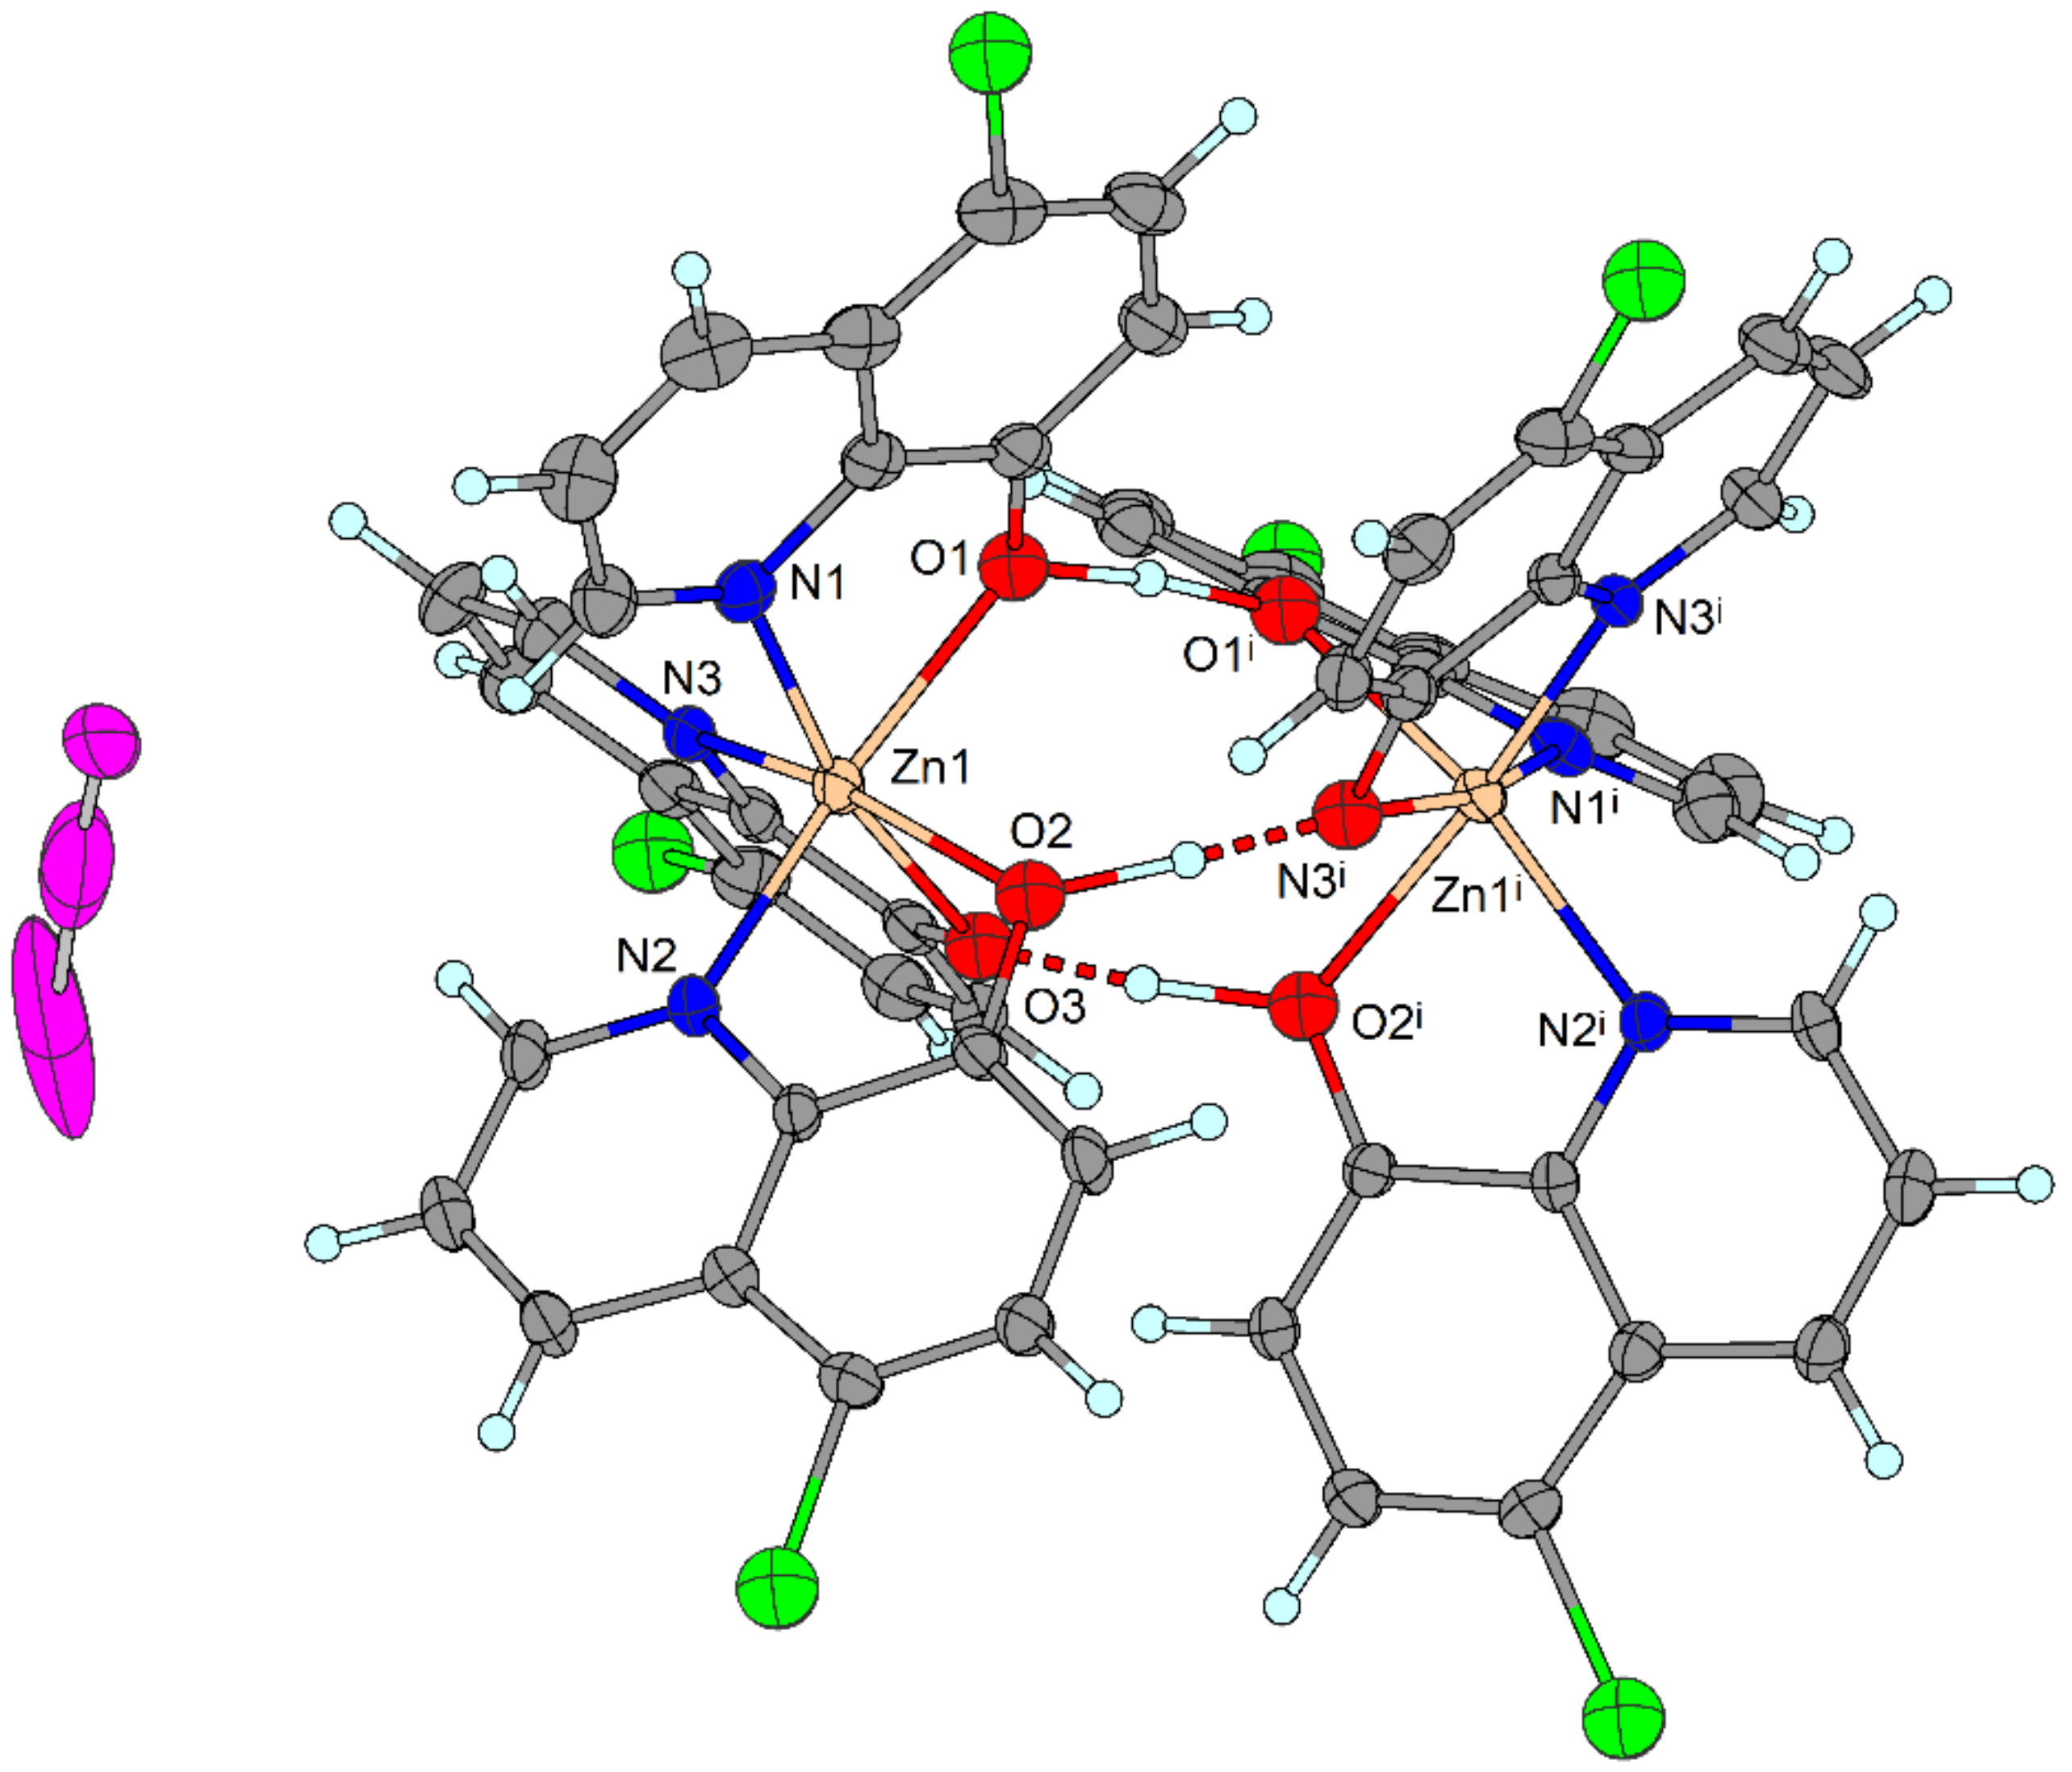
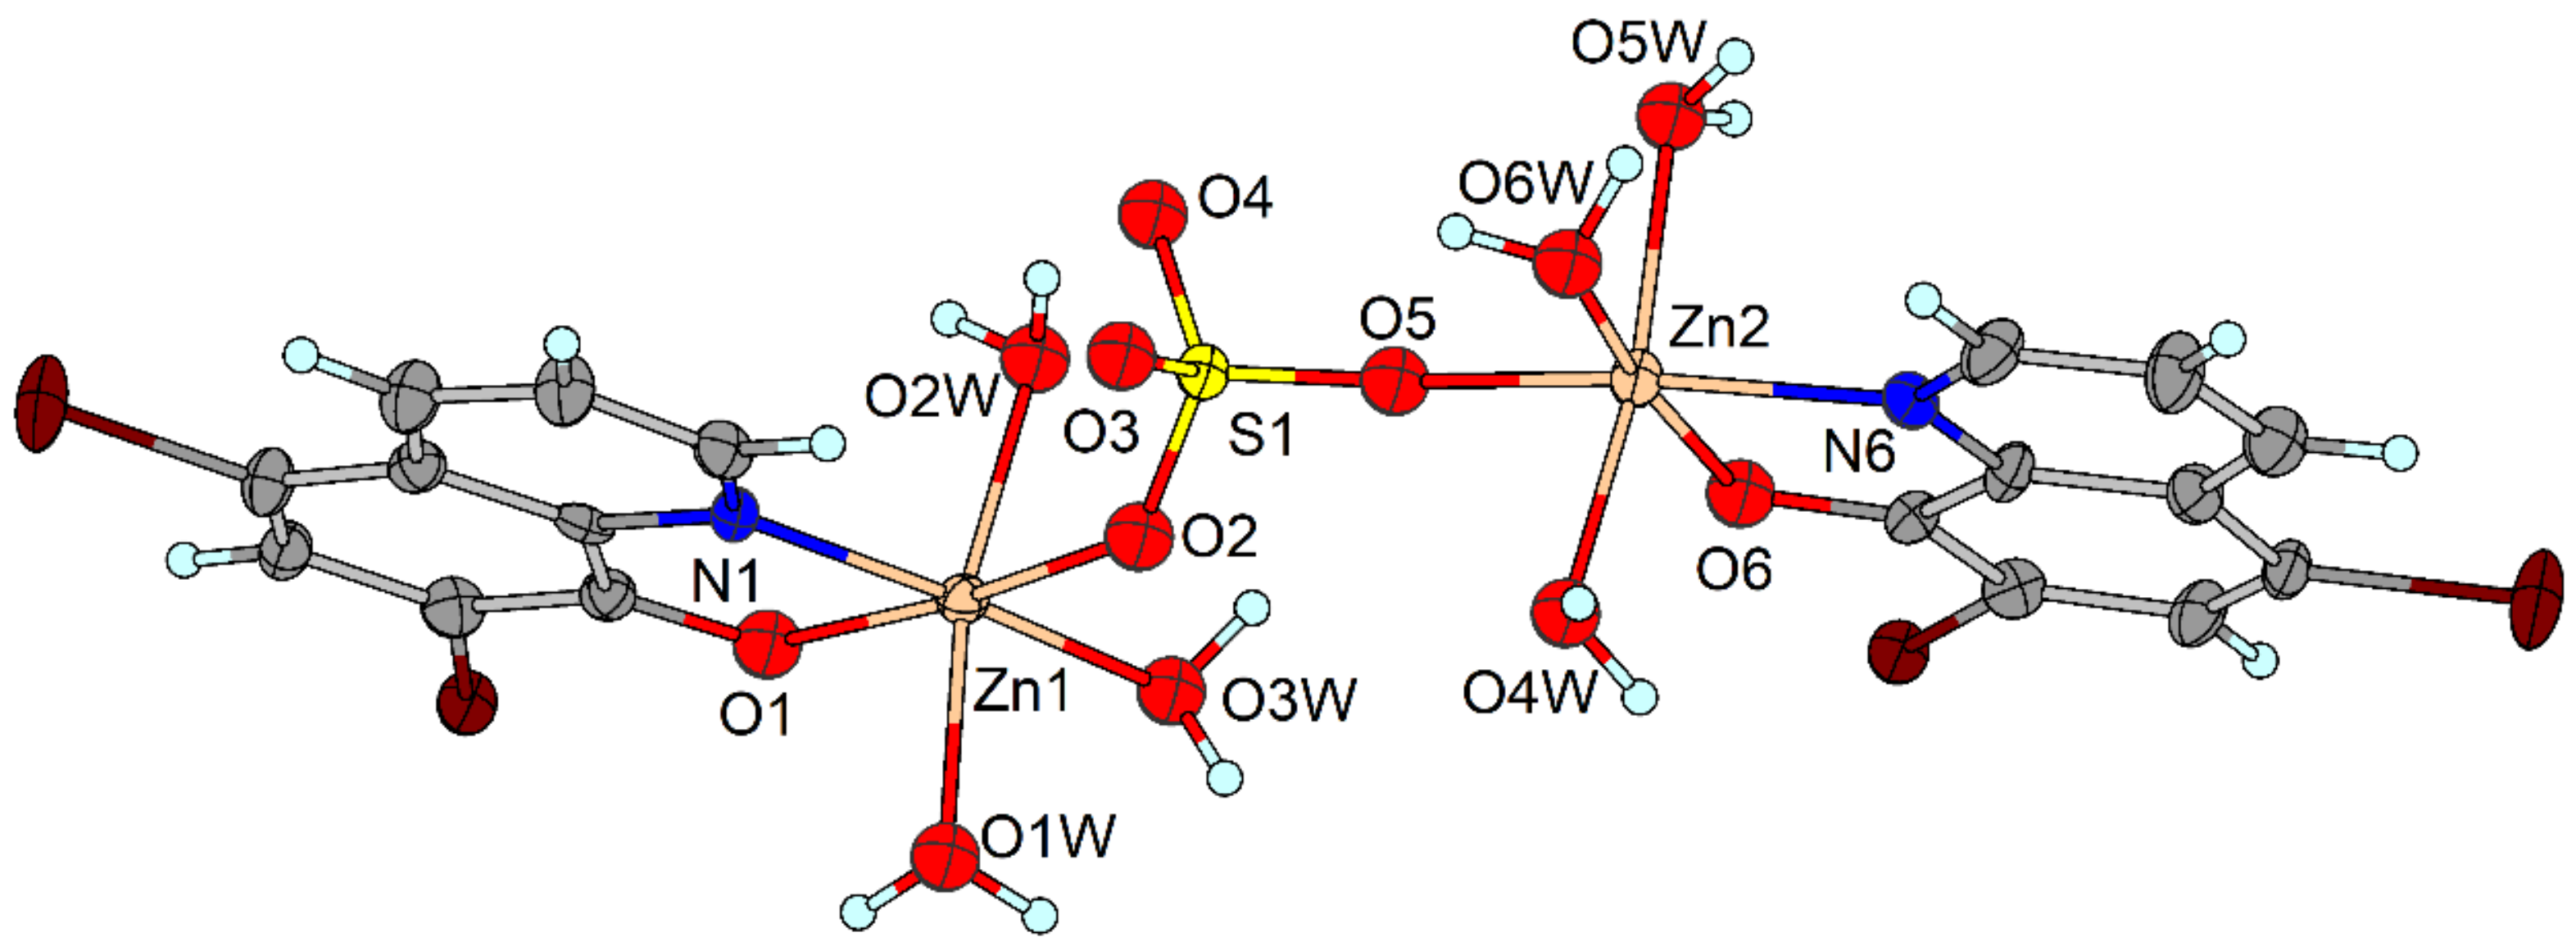
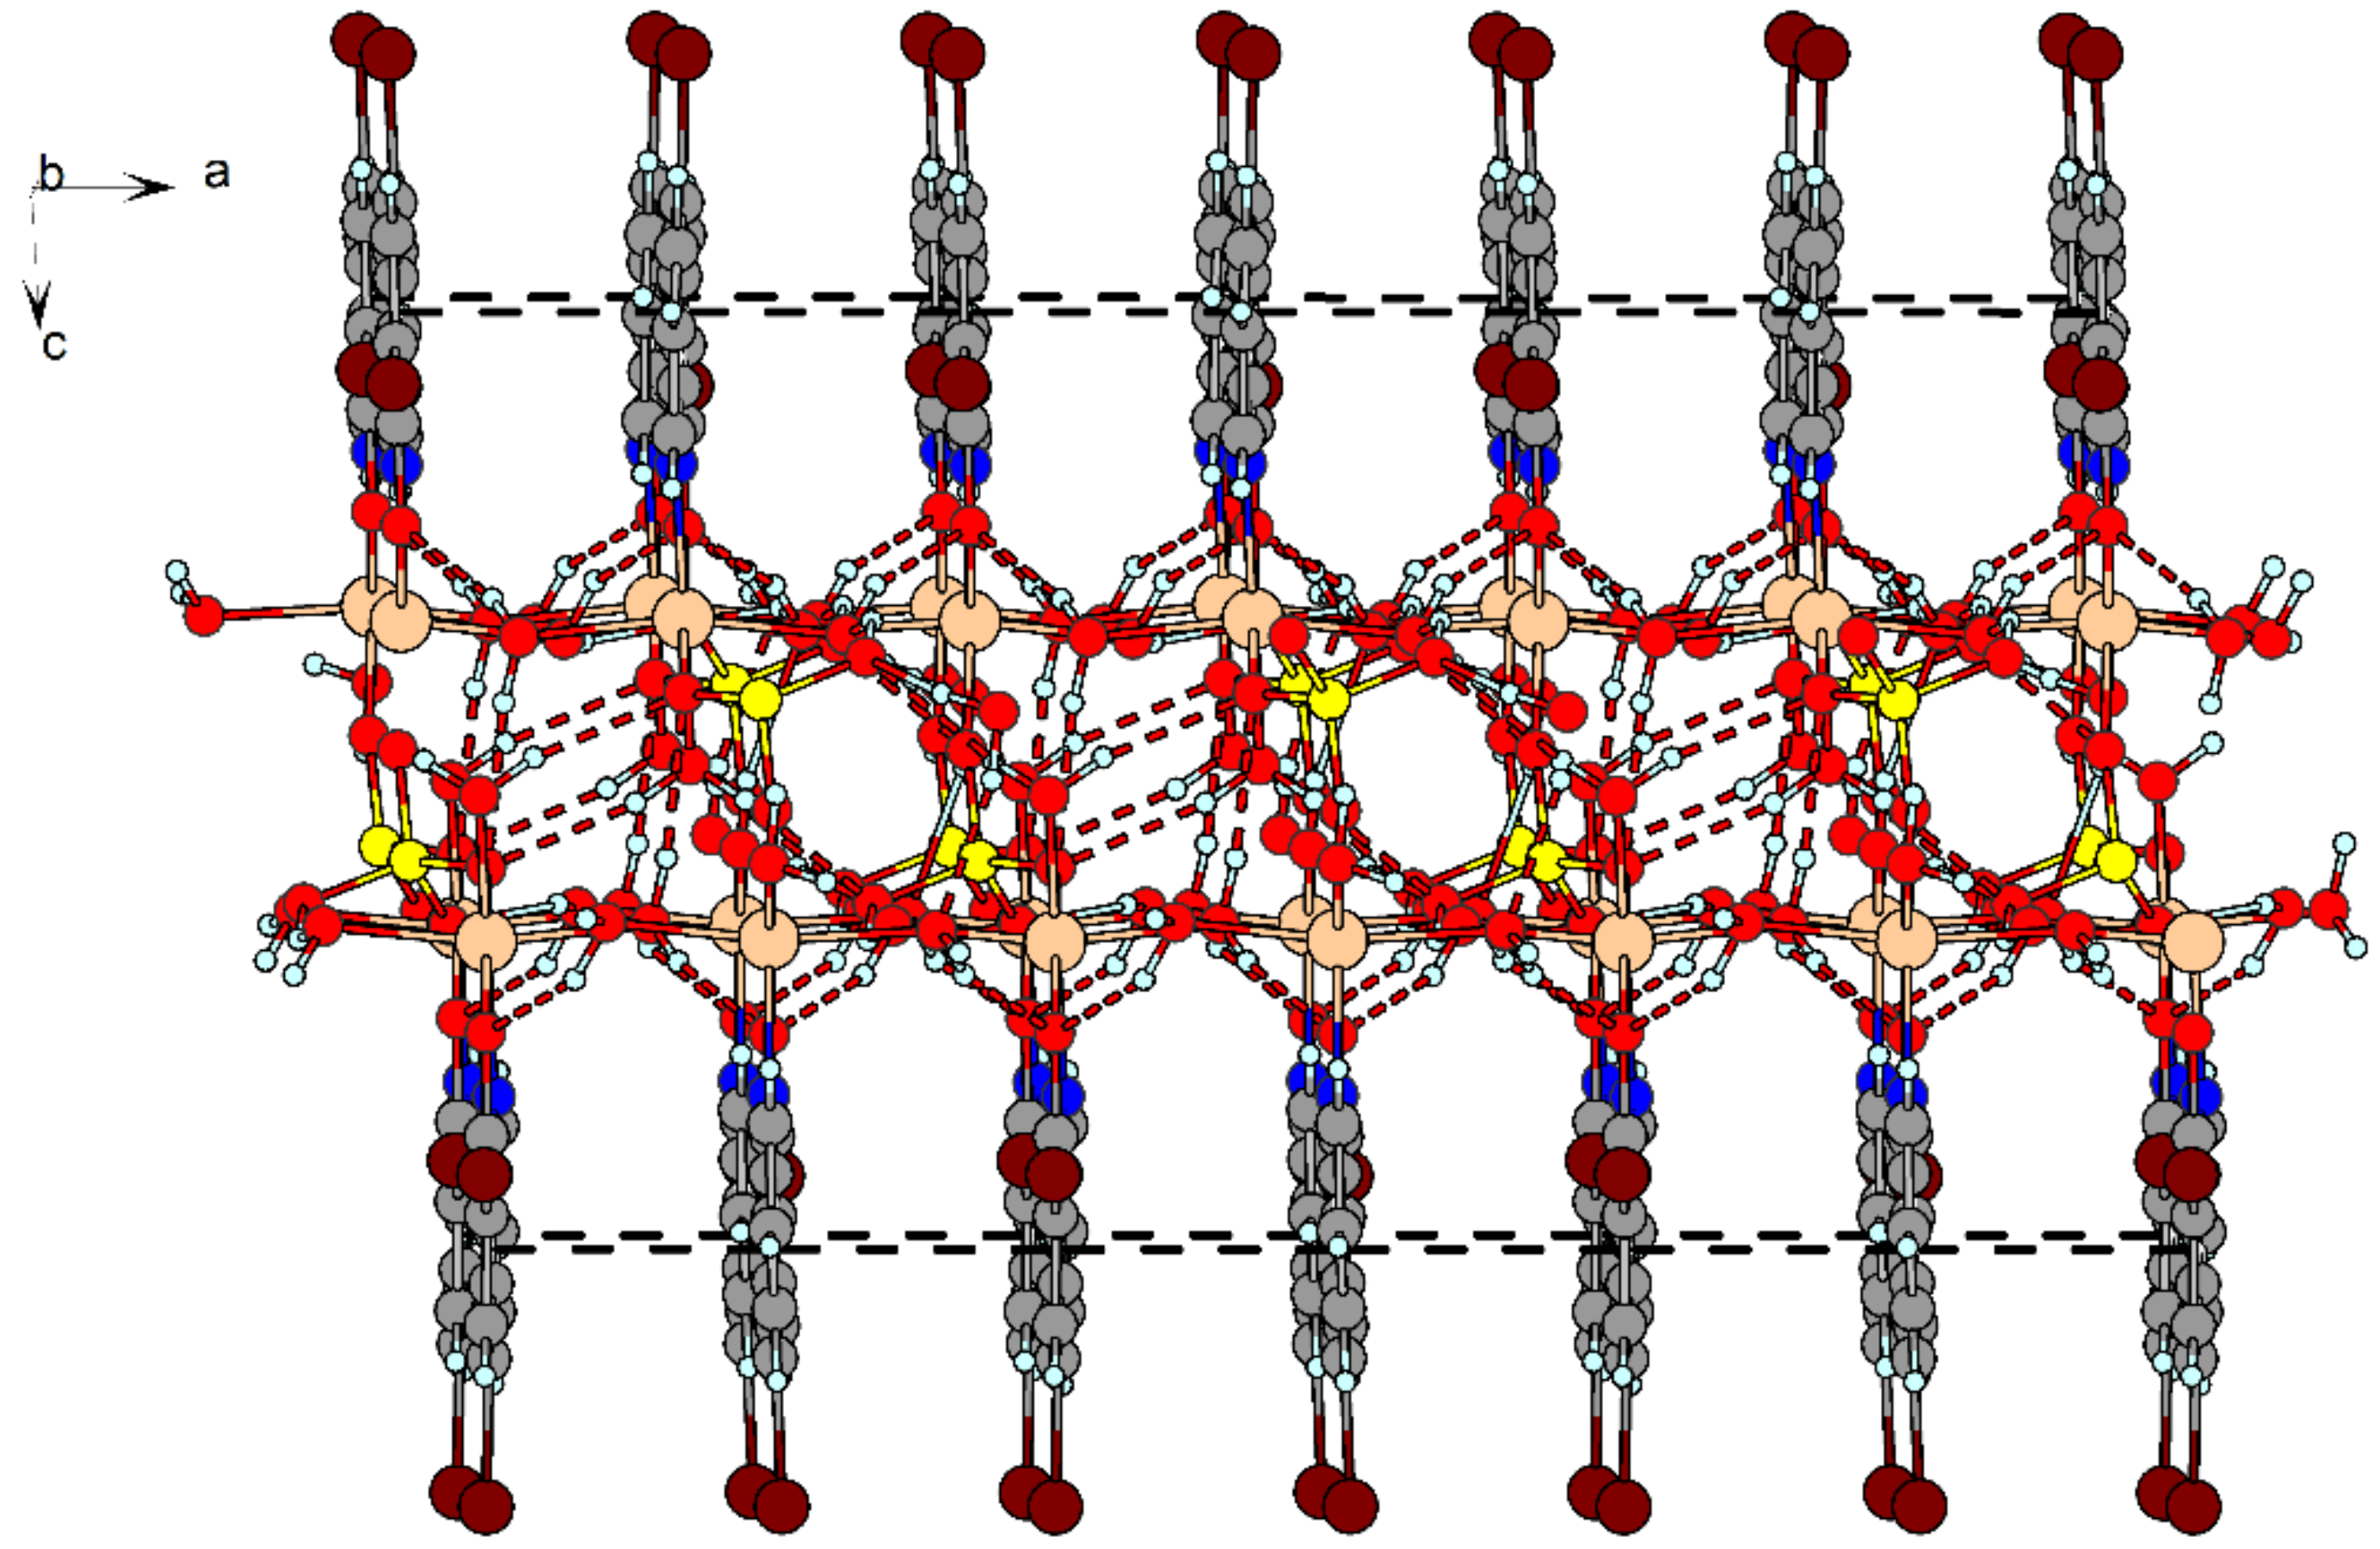
2.4. X-ray Structure Analysis

The [Zn4Cl2(ClQ)6]·2DMF (1) and [Zn4Cl2(ClQ)6(H2O)2]·4DMF (2) complexes are similar tetranuclear molecular compounds with a complicated type of structure. They crystallize in the triclinic P1 space group. In both complexes, there are two pairs of crystallographically independent zinc atoms. Zn1 atoms are pentacoordinated in both structures by N2 and O2 atoms of one chelate ClQ ligand, with O2 atom being a bridge between Zn1 and Zn2 atoms. Other two coordination places are occupied by bridging O1 and O3 atoms of the other two ClQ chelate-bridging ligands, while the fifth place is occupied by the chloride ligand, Cl1. Zn2 atoms are hexacoordinated in both structures; however, coordination spheres around the Zn2 atoms in both structures are different. In both structures, two chelate-bridging ClQ ligands coordinate to the Zn2 atoms through N1 and N3, and O1 and O3 atoms, which are bridges to the Zn1 atoms. The last two coordination places in 1 are occupied by two bridging oxygen atoms of another two ClQ ligands (Figure 5), while only one place is occupied by the bridging oxygen atom of another ClQ ligand in 2 and the last coordination place is occupied by the O4 atom of a water molecule (Figure 5). In summary, there are two tridentate and four bidentate oxygen atoms of the six ClQ ligands in 1 and each Zn1-Zn2 pair is bridged by two oxygen atoms of two different ClQ ligands. Thus, there are four double-oxygen bridges between Zn1 and Zn2 atoms in 1 (Figure 5). On the other hand, all six ClQ oxygen atoms are bidentate in 2 and thus there are only two double-oxygen bridges between Zn1 and Zn2 atoms, while the remaining two bridges are single-oxygen bridges only.
Based on bond angles (Table 2), the shapes of coordination polyhedra around Zn2 atoms in 1 and 2 are distorted octahedrally. On the other hand, Zn1 atoms are coordinated in a trigonal bipyramidal or square pyramidal shape, respectively, as suggested by the τ parameter [28] and program SHAPE [29] (Table S2).
Bond distances around the zinc atoms in both structures are listed in Table 2. It can be seen that the Zn-O and Zn-N distances within the chelate rings are in the range of 2.0789(12)–2.1525(16) Å, while distances between Zn atoms and bridging oxygen atoms are shorter, 2.0134(12)–2.0463(13) Å, except for the Zn1i-O2 bond (2.2779(13) Å; i = −x + 1, −y + 1, −z + 1) in the structure of 1 which length is comparable to Zn1-Cl1 in 1 and 2 (2.2766(5) and 2.3149(5) Å, respectively). In addition, a water molecule in 2 is coordinated with a Zn2-O4 bond length being 2.2044(13) Å. All mentioned distances and angles are similar to those described in the literature for other tetranuclear zinc complexes [27,30].
Outside the tetranuclear complex species there are two or four solvated molecules of DMF in 1 and 2, respectively, which are joined with the complexes by hydrogen bonds stabilizing both structures. These and other hydrogen bonds present in the structure of both complexes are gathered in Table 3 and are shown in Figure 6 and Figure 7. Due to these hydrogen bonds, a layered structure parallel with the (011) plane in 1 and a chain-like structure along the c axis in 2 is formed.
The further stabilization of both structures arises from π-π interactions between aromatic rings. Data characterizing π-π interactions are given in Table S3.
Complex 3 crystallizes in the monoclinic space group I2/c. In its structure, there is a binuclear [Zn2(ClQ)3(HClQ)3] + cation (Figure 8, Table 4) in which both Zn atoms are hexacoordinated by three N,O-chelate bonded ligands. Three of them (ClQ) are anionic with deprotonated hydroxyl groups, while remaining three ligands (HClQ) contain protonated hydroxyl groups and are neutral. The hydrogen atoms of these hydroxyl groups are involved in strong hydrogen bonds, which link the two mononuclear Zn complex units into the binuclear cation. One of the hydrogen atoms lies on a two-fold rotation axis and is thus shared equally by O1 and O1i oxygen atoms (i = −x + 1, y, −z + 1.5). The remaining two hydrogen atoms involved in hydrogen bonds are shared unequally, and corresponding covalent bonds are elongated and are thus only slightly shorter than hydrogen bonds (Table 5). The positive charge of the binuclear cation is balanced by a triiodide anion. Selected bond lengths and angles are gathered in Table 4 and are similar to those in 1, 2 and 5 (below), as well as in other similar zinc complexes [31,32].
The further stabilization of the structure arises from π-π interactions between parallel aromatic rings of neighboring complexes. Due to these interactions a zig-zag chain parallel with the a axis is formed (Figure S7). Data characterizing π-π interactions are given in Table S4.
The complexes [Zn2(dClQ)2(H2O)6(SO4)] (4) and [Zn2(dBrQ)2(H2O)6(SO4)] (5) crystallize in the triclinic P1 space group and their structures are very similar. They are formed by binuclear complexes in which two Zn-species are bridged by a sulphate group (Figure 9). Both Zn atoms in the binuclear complexes are hexacoordinated by a corresponding N,O-bidentate chelate XQ ligand, three oxygen atoms of water molecules and one oxygen atom of the sulphate group. Interestingly, in 4 there are four crystallographically independent binuclear complexes. However, due to the extremely small crystals of 4, their diffraction power was low, and thus the quality of the obtained data enabled us to present only an isotropic model of its structure without hydrogen atoms. Therefore, we discuss neither bond distances and angles nor nonbonding interactions in this complex.
Bond distances around both Zn atoms in 5 are normal (Table 6) and are close to the bond lengths observed in the above-described complexes and also in other Zn–HXQ complexes described in the literature [20,31,32]. Coordination polyhedra around Zn1 and Zn2 atoms are distorted octahedra, as represented by N-Zn-O and O-Zn-O trans-angles spanning from 165.6(3) to 173.8(3)°, while cis-angles are in a range 79.1(3) to 97.8(3)°. The shape of the coordination polyhedra is also confirmed by octahedral distortion parameter Σ and the results of the program SHAPE (Table S2).
Water molecules are involved in hydrogen bonds (Table 7), forming a hydrophilic layer parallel with the (001) plane (Figure 10). On the borders of this layer there are hydrophobic dBrQ ligands, and between neighboring ligands π-π interactions stabilize the two-dimensional structure of 5 (Figure 10, Table S5).

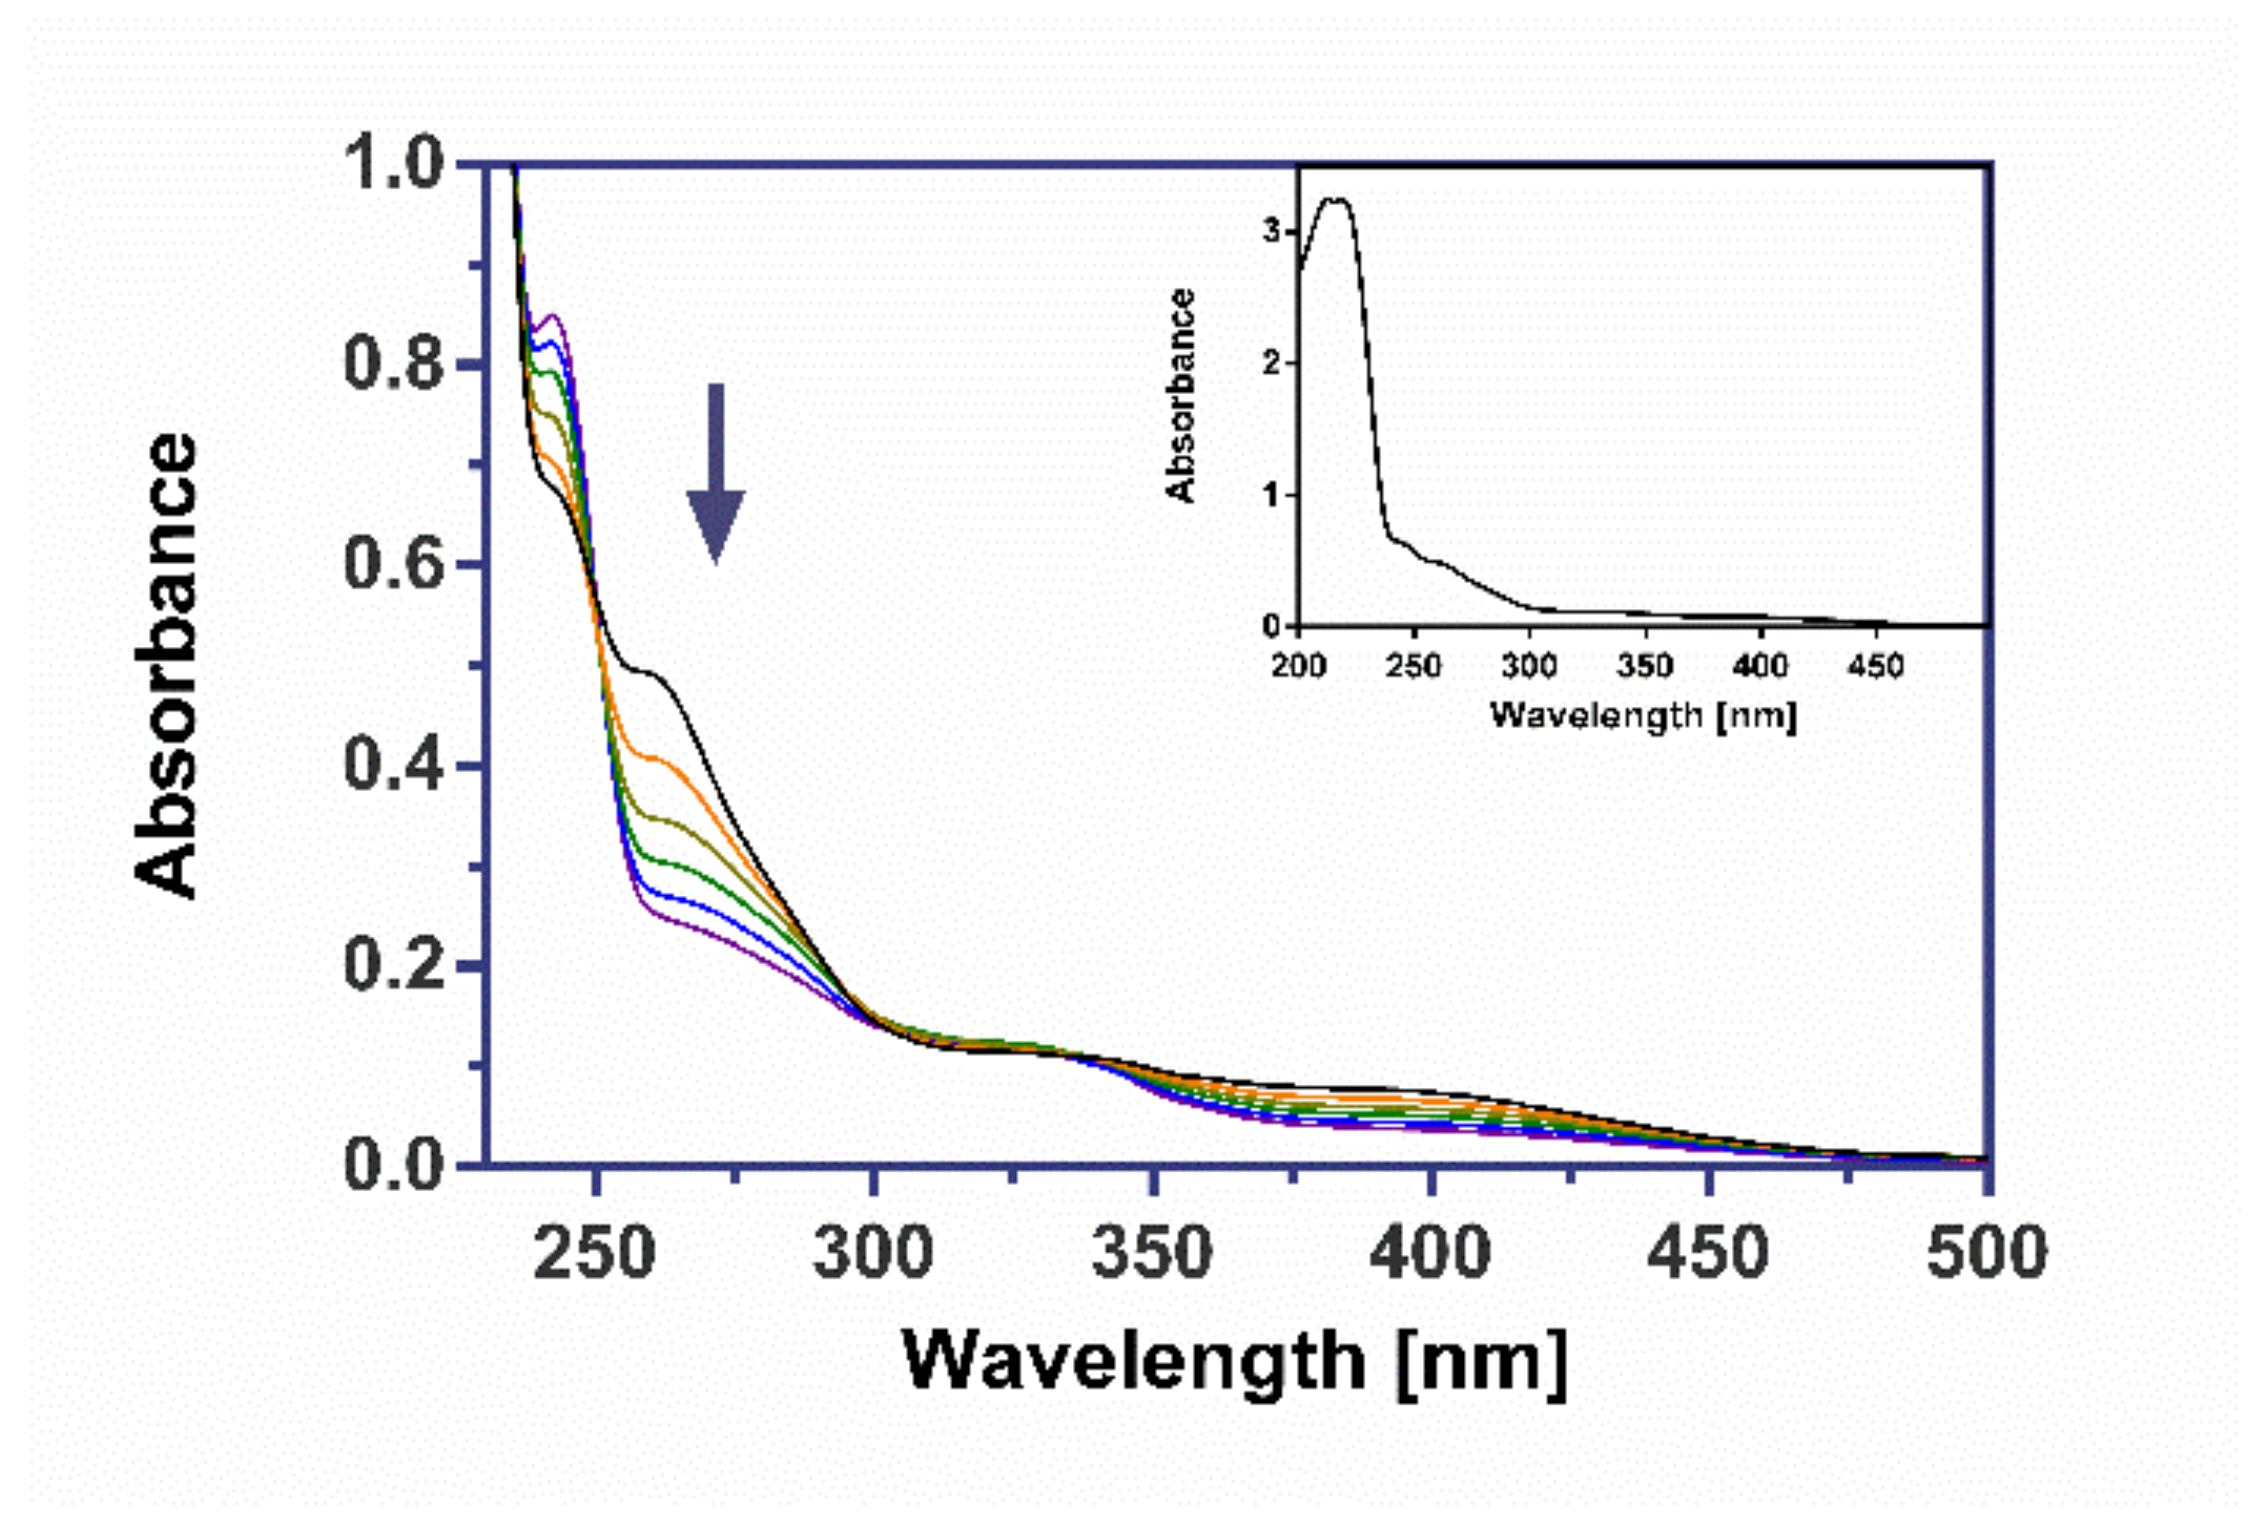
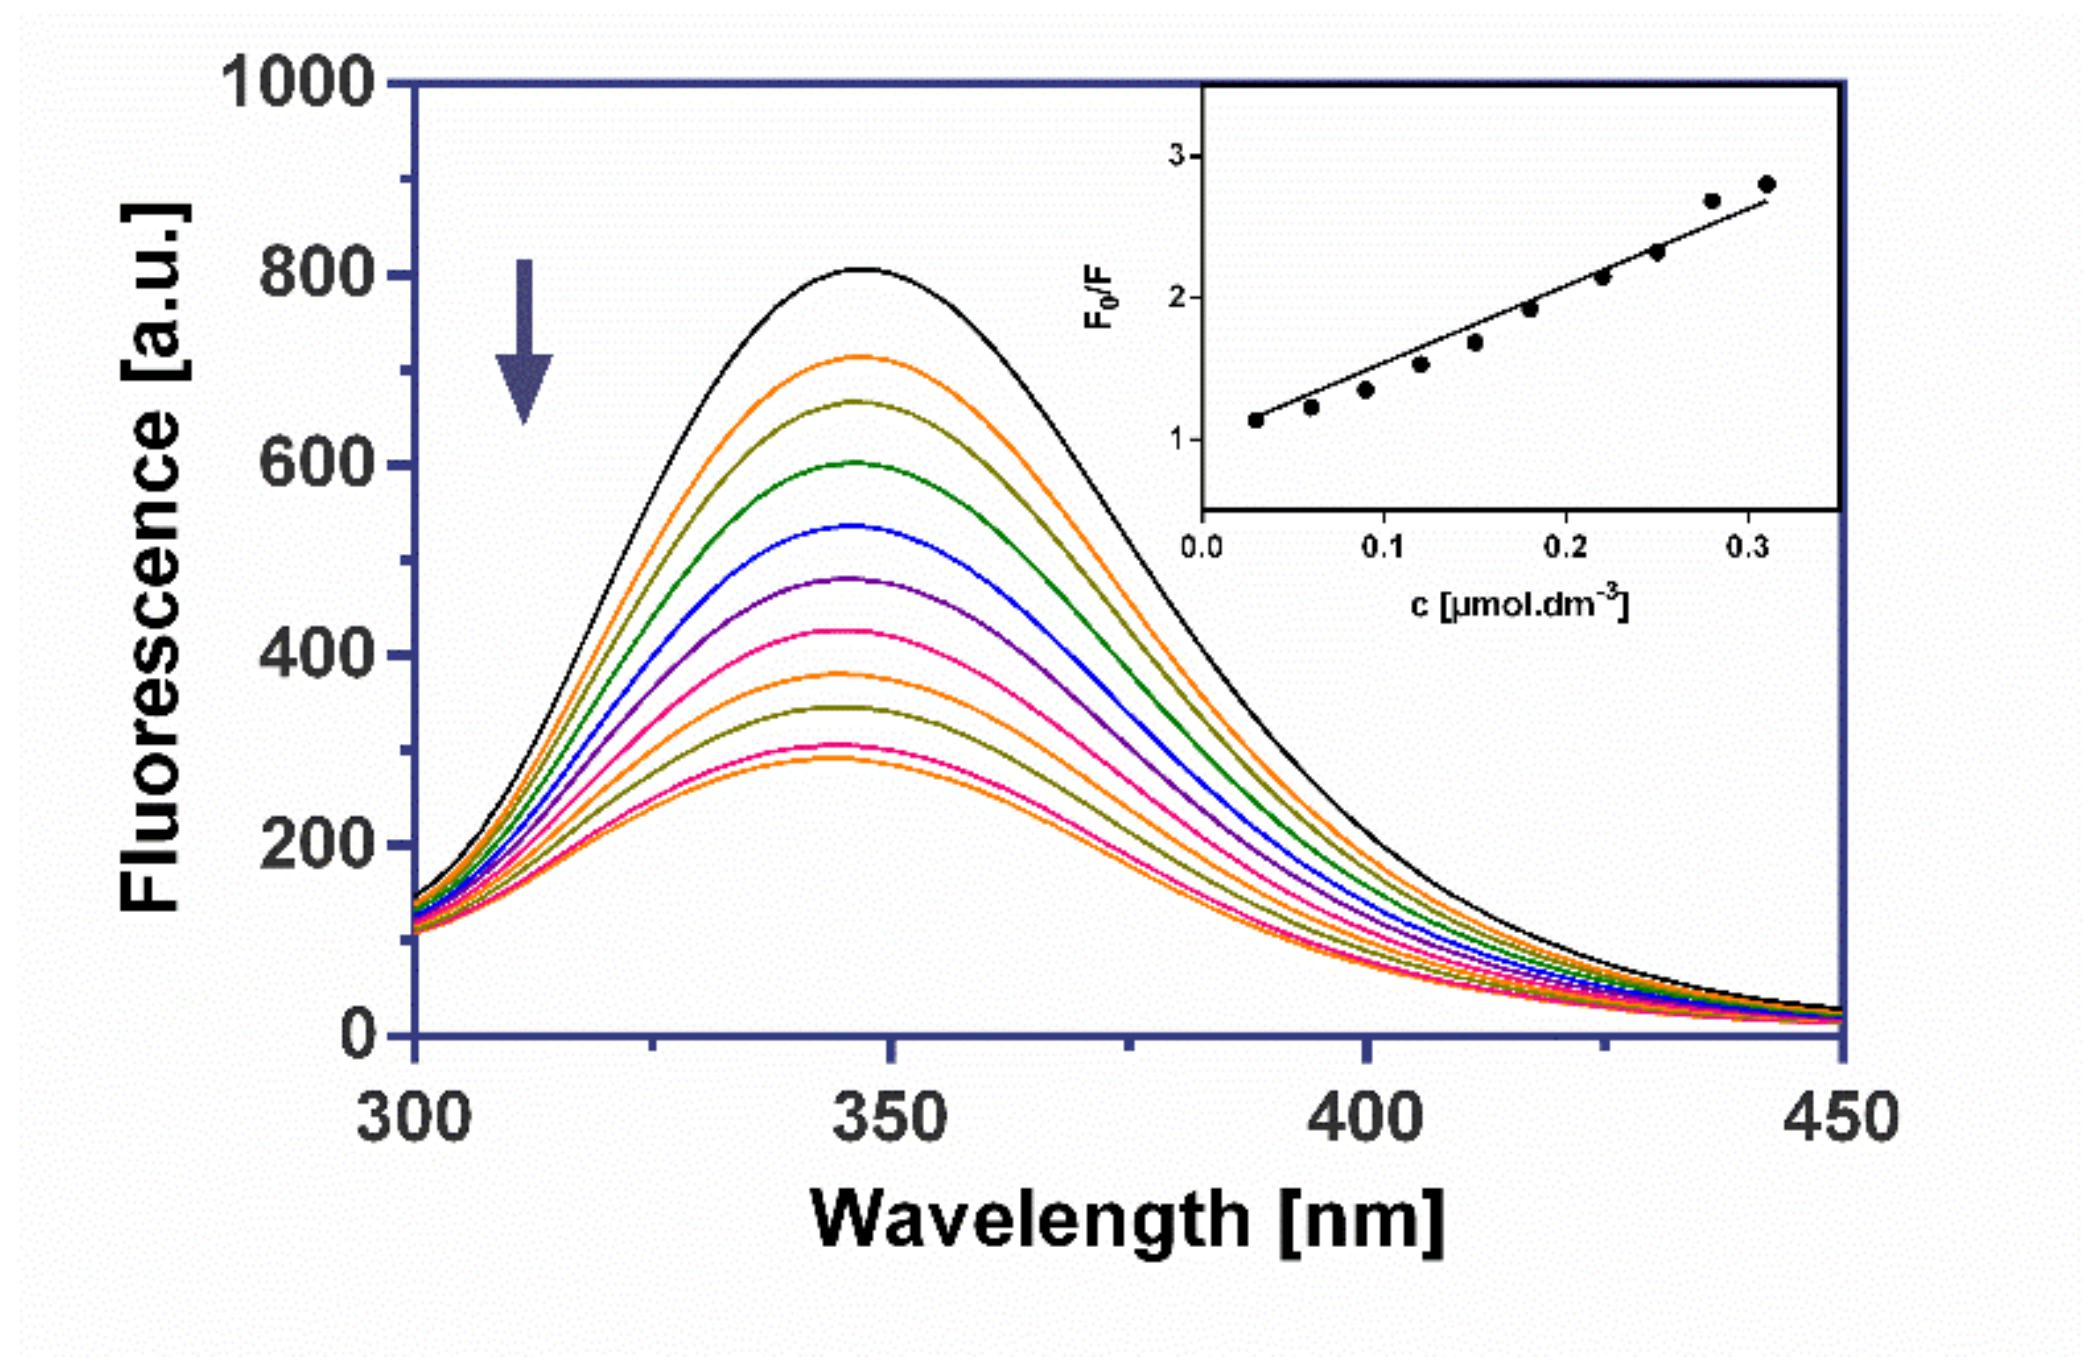
2.5. The DNA Binding Potency

The UV-vis spectrometry is one of the basic techniques for analyzing small molecule–DNA interactions. The UV-vis titrations were realized at a fixed concentration of investigated zinc complexes with HClQ ligand (13) and varying concentrations of calf thymus DNA (ctDNA). The absorbance maxima of complexes 13 show reduced absorbance intensity (hypochromism) upon titration with ctDNA (Figures S8 and S9 and Figure 11). Hypochromic effect is noticed when molecules bind into DNA-supporting helix stabilization by the insertion of the flat aromatic part between base pairs [2]. This determined hypochromicity is associated with the intercalative binding mode of studied complexes [33]. The most obvious hypochromicity was recorded for complex 3 (about 46%) (Table 8). This means that the dinuclear complex 3, which shows a promising cytotoxic effect (see Section 2.7), binds better into DNA compared to the tetranuclear complexes 1 and 2.
We tried to examine the actual binding mode of the Zn(II) complexes with DNA by competitive fluorometric dye displacement assay with Ethidium bromide (EB) also. EB is often used as a DNA intercalating agent, which displays maximum emission at about 602 nm upon binding to double helical DNA [34]. The fluorescence emission spectra of the DNA-EB system was measured from 565 nm to 700 nm with incremental amounts of complexes 13 (Figures S10 and S11 and Figure 12).
Table 8 shows Stern–Volmer quenching constants (Ksv), which are estimated by the linear regression of the Fo/F against quencher concentration. Obtained Ksv are in the range from 3.4 × 10³ M−1 to 1.06 × 10⁴ M−1. Similar Ksv constants were found for complexes [Zn(bpy)(Gly)]NO3 and [Zn(phen)(Gly)]NO3 [35]. Since the calculated Ksv values are quite low, we assume that the complexes are only weak intercalators.

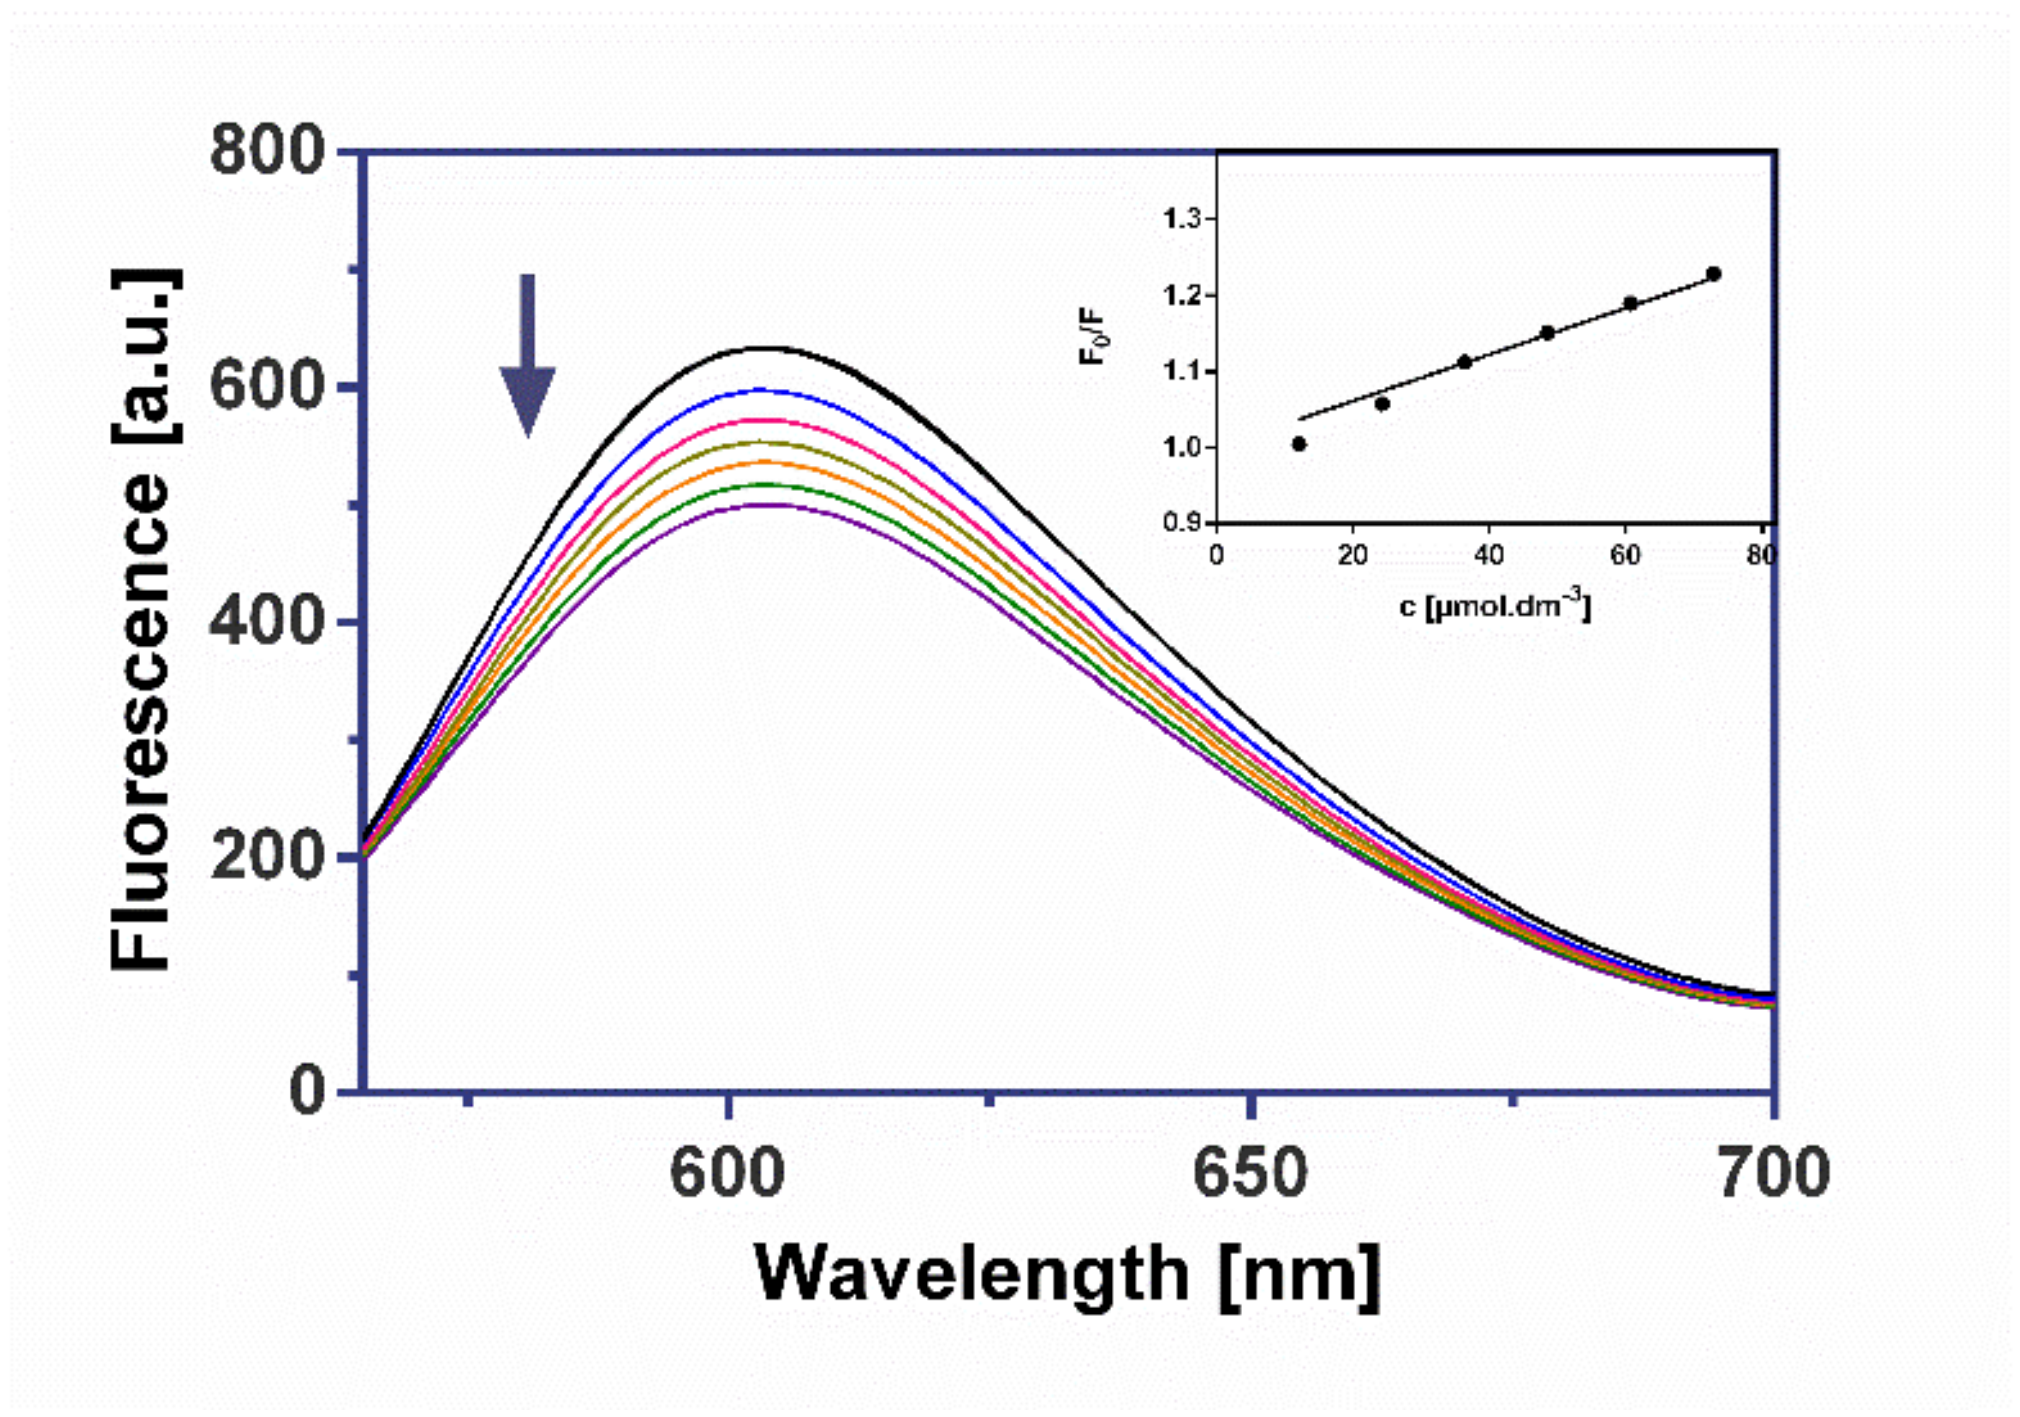
2.6. BSA Interaction Study

The bovine serum albumin (BSA) works as a model protein to explore drug–protein interactions due to its structural similarities with human serum albumin (HSA). In vivo, the BSA serves as a transporter for biologically efficient drugs and also for endogenous molecules. The binding of biologically effective drugs to serum albumins is an important criterion for pharmacokinetics [36].
The changes noticed in the fluorescence emission spectra of BSA with various concentrations of Zn(II) complexes are presented in Figures S12 and S13 and Figure 13.
Upon the addition of 13, we have observed a substantial quenching of the fluorescence intensity of BSA at 348 nm. The decrease in fluorescence intensity indicates the formation of certain complexes between the Zn(II) complexes and BSA. The fluorescence quenching is also described by the Stern–Volmer relationship. The values of the parameters Ksv for BSA binding are listed in Table 8. The highest Ksv value (5.44 × 10⁶ M−1) was found for the complex 3, which shows the highest cytotoxicity against all cell lines. All estimated Ksv values were about 100 times higher than that found by Butkus et al. for small zinc complexes [37].

2.7. Antiproliferative Activity

The robust screening test was used to analyze antiproliferative activity of the zinc complexes in various cancer cell lines (Table 9). As the data clearly showed, based on IC50 values, the most cytotoxic complexes were 3 and 4 but unfortunately with poor selectivity towards normal kidney fibroblasts. Good cytotoxic potential and higher selectivity was shown by complex 5 on all cancer cell lines except HeLa. Complexes 1 and 2 showed the lowest cytotoxic IC50 values on MCF-7 and HCT116 cells and average IC50 concentration on other cell lines. As can be seen from the IC50 values, 3 and 4 exhibited higher cytotoxic effect than cisplatin against all cancer cell lines except HCT116. In general, HeLa cells were most resistant to the tested complexes. The ligands used in synthesis showed cell-dependent cytotoxicity in the range of 5 to 103 µM concentration. In general, binuclear complexes 35 showed higher cytotoxic activity compared to their free ligands against all cancer cell lines. Tetranuclear complexes 1 and 2 showed the lowest efficiency from the complexes and ligands, probably due to their bigger size preventing their entrance to the cells. As the results showed, changing the structure of the complexes did not lead to an improvement in their cytotoxicity or selectivity in comparison with our mononuclear zinc complexes [20].

2.8. Antimicrobial Activity

The antibacterial activity of the prepared complexes was tested against Gram-positive (S. aureus) and Gram-negative (E. coli) bacteria. The RIZD (percentage of relative inhibition zone diameter) was performed. Only 5 showed in RIZD test inhibition against Gram-positive bacteria S. aureus. The inhibition was 66.97% (Table 10), whereas the inhibition of gentamicin sulphate as positive control was 100%. Oher complexes are not suitable for antibacterial activity in concentrations of 33.6 µM. Concentration was the same as gentamicin sulphate. In the case of 2 and 3, we observed problems with dissolution and after a few minutes it started flocculation.

3. Materials and Methods

3.1. Materials and Chemicals

Reagents were obtained from the following commercial sources: HClQ—95% from Sigma-Aldrich (Darmstadt, Germany); HdClQ—99%, HdBrQ—98%, and N,N-dimethylformamide—99% from Alfa Aesar (Kandel, Germany); ethanol—96% from BGV (Hniezdne, Slovakia), zinc(II) iodide—98% from Fisher Chemical (Loughborough, UK); zinc sulphate heptahydrate— p.a. from Lachema (Neratovice, Czech Republic); KOH—p.a. from ITES (Vranov, Slovakia); methanol—p.a.; and zinc(II) chloride—98% from Centralchem (Bratislava, Slovakia). All mentioned chemicals were used as received.

3.2. Syntheses

3.2.1. Synthesis of [Zn4Cl2(ClQ)6]·2DMF (1)

HClQ (179 mg, 1 mmol) was dissolved in DMF (10 mL). Soon afterwards a solution of zinc chloride (136 mg, 1 mmol ZnCl2 in 10 mL of ethanol) was added and mixed for a while at room temperature. After one month at room temperature, orange crystals of 1 were formed, filtered off and dried on air.
[Zn4Cl2(ClQ)6]·2DMF (1): Anal. Calc. for C60H44Cl8N8O8Zn4 (1550.11 g·mol−1): C, 46.35; H, 2.53; N, 6.64%. Found: C, 46.04; H, 2.56; N, 6.91%. Yield: 111.09 mg (43%). 1H NMR (DMSO-d6): δ = 8.74 (1H, br s, H-2), 8.54 (1H, d, J 8.5 Hz, H-4), 7.95 (1H, s, HDMF-1), 7.75 (1H, dd, J 8.5, 4.5 Hz, H-3), 7.50 (1H, d, J 8.5 Hz, H-6), 6.73 (1H, br s, H-7), 2.89 (3H, s, HDMF-4), 2.73 (3H, s, HDMF-3) ppm. 13C NMR (DMSO-d6): δ = 162.3 (C-8, CDMF-1), 145.6 (C-2), 139.7 (C-8a), 135.0 (C-4), 130.0 (C-6), 126.6 (C-4a), 122.8 (C-3), 111.6 (C-7), 109.0 (C-5), 35.8 (C-4DMF), 30.8 (C-3DMF) ppm. IR (ATR, cm−1): 3047(vw), 2921(w), 2853(w), 1671(s), 1599(m), 1575(m), 1495(m), 1458(m), 1381(m), 1364(m), 1305(m), 1253(m), 1240(m), 1199(w), 1159(w), 1129(w), 1083(m), 1043(m), 961(m), 935(w), 838(m), 810(w), 783(m), 735(s), 672(m), 647(w), 638(w), 613(w), 590(w), 541(m), 504(m), 450(m).

3.2.2. Synthesis of [Zn4Cl2(ClQ)6(H2O)2]·4DMF (2)

HClQ (263 mg, 1.46 mmol) was dissolved in a mixture of DMF (7.5 mL) and ethanol (15 mL). KOH (29 mg, 1 mmol KOH in 1 mL water) was added afterwards, and the formed solution was cooled down to approximately −10 °C. Additionally, zinc chloride solution, (136 mg, 1 mmol ZnCl2 in 10 mL of ethanol) cooled down to approximately −10 °C, was added and the reaction mixture was mixed for couple of minutes. After keeping the solution in the fridge for around four months, yellow crystals of 2 were formed, filtered off and dried in air.
[Zn4Cl2(ClQ)6(H2O)2]·4DMF (2): Anal. Calc. for C66H62Cl8N10O12Zn4 (1732.42 g·mol−1): C, 45.76; H, 3.61; N, 8.08%. Found: C, 45.91; H, 3.13; N, 7.88%. Yield: 88.53 mg (21%). 1H NMR (DMSO-d6): δ = 8.74 (1H, br s, H-2), 8.54 (1H, dd, J 8.4, 1.5 Hz, H-4), 7.95 (1H, s, HDMF-1), 7.75 (1H, dd, J 8.4, 4.4 Hz, H-3), 7.50 (1H, d, J 8.4 Hz, H-6), 6.74 (1H, d, J 8.4 Hz, H-7), 2.89 (3H, s, HDMF-4), 2.73 (3H, s, HDMF-3) ppm. 13C NMR (DMSO-d6): δ = 162.3 (C-8, CDMF-1), 145.7 (C-2), 140.2 (C-8a), 135.0 (C-4), 130.0 (C-6), 126.6 (C-4a), 122.8 (C-3), 111.7 (C-7), 109.0 (C-5), 35.8 (CDMF-4), 30.8 (CDMF-3) ppm. IR (ATR, cm−1): 3075(vw), 2923(w), 2847(w), 1672(m), 1649(m), 1598(m), 1573(m), 1495(m), 1457(m), 1398(w), 1378(m), 1364(m), 1320(m), 1257(w) 1241(w), 1200(w), 1155(w), 1129(w), 1100(w), 1087(m), 1044(m), 956(m), 885(w), 862(w), 834(w), 820(m), 784(m), 739(m), 666(m), 656(w), 636(m), 613(m), 541(m), 501(m), 451(m), 429(m).

3.2.3. Synthesis of [Zn2(ClQ)3(HClQ)3]I3 (3)

ZnI2 (159 mg, 0.5 mmol) in ethanol (10 mL) was added drop by drop to the solution of HClQ (89 mg, 0.5 mmol) in ethanol (10 mL) under stirring. After one month at room temperature, dark brown crystals of 3 were formed, filtered off and dried in air.
[Zn2(ClQ)3(HClQ)3]I3 (3): Anal. Calc. for C54H33Cl6I3N6O6Zn2 (1586.09 g·mol−1): C, 40.89; H, 2.10; N, 5.30%. Found: C, 40.72; H, 2.29; N, 4.98%. Yield: 87.23 mg (66%). 1H NMR (DMSO-d6): δ = 10.19 (1H, br s, OHHClQ), 8.95 (1H, br s, H-2HClQ), 8.66 (1H, br s, H-2ClQ), 8.52 (2H, br s, H-4HClQ, H-4ClQ), 7.74 (2H, br s, H-3HClQ, H-3ClQ), 7.60 (1H, br s, H-6HClQ), 7.51 (1H, br s, H-6ClQ), 7.08 (1H, br s, H-7HClQ), 6.72 (1H, br s, H-7ClQ) ppm. IR (ATR, cm−1): 3062(w), 1633(w), 1580(m), 1500(m), 1463(m), 1453(w), 1393(m), 1361(m), 1319(m), 1261(m), 1239(w), 1206(w), 1155(w), 1107(w), 1059(w), 955(w), 868(w), 820(m), 807(w), 777(m), 730(m), 660(m), 629(m), 575(w), 534(m), 510(w), 485(m), 458(w), 430(m).

3.2.4. Synthesis of [Zn2(dClQ)2(H2O)6(SO4)] (4)

ZnSO4·7H2O (144 mg, 0.5 mmol) in methanol (10 mL) was added drop by drop to the solution of HdClQ (107 mg, 0.5 mmol) in DMF (10 mL) under stirring. After one month at room temperature, yellow crystals of 4 were formed, filtered off and dried in air.
[Zn2(dClQ)2(H2O)6(SO4)] (4): Anal. Calc. for C18H20Cl4N2O12SZn2 (761.01 g·mol−1): C, 28.41; H, 2.65; N, 3.68; S, 4.21%. Found: C, 28.22; H, 2.48; N, 3.39; S, 3.90%. Yield: 62.78 mg (33%). 1H NMR (DMSO-d6): δ = 8.79 (1H, br s, H-2 of minor form), 8.55 (1H, br s, H-2), 8.50 (d, J 8.4 Hz, H-4), 7.70 (2H, m, H-3, H-6). 13C NMR (DMSO-d6): δ = 158.2 (C-8), 146.1 (C-2), 140.0 (C-8a), 135.1 (C-4), 129.5 (C-6), 125.7 (C-4a), 122.7 (C-3), 114.8 (C-7), 108.5 (C-5). IR (ATR, cm−1): 3056(vs), 1624(m), 1566(m), 1491(m), 1455(m), 1395(m), 1377(w), 1364(m), 1290(w), 1249(w), 1231(w), 1110(w), 1052(m), 963(m), 885(w), 862(m), 803(m), 780(m), 740(m), 665(m), 593(w), 503(w), 432(w).

3.2.5. Synthesis of [Zn2(dBrQ)2(H2O)6(SO4)] (5)

ZnSO4·7H2O (144 mg, 0.5 mmol) in methanol (10 mL) was added drop by drop to the solution of HdBrQ (151 mg, 0.5 mmol) in DMF (10 mL) under stirring. After one month at room temperature, yellow crystals of 5 were formed, filtered off and dried in air.
[Zn2(dBrQ)2(H2O)6(SO4)] (5): Anal. Calc. for C18H20Br4N2O12S1Zn2 (938.82 g·mol−1): C, 23.03; H, 2.15; N, 2.98; S, 3,42%. Found: C, 23.45; H, 2.13; N, 2,97; S, 3.31%. Yield: 110.31 mg (47%). 1H NMR (DMSO-d6): minor form: δ = 8.76 (1H, br s, H-2), 8.44 (1H, br s, H-4), 7.92 (1H, s, H-6), 7.75 (1H, br s, H-3) ppm. 1H NMR (DMSO-d6): major form: δ = 8.47 (1H, br s, H-2), 8.41 (1H, d, J 8.5 Hz, H-4), 7.92 (1H, s, H-6), 7.70 (1H, br s, H-3) ppm. 13C NMR (DMSO-d6): minor form: δ = 159.8 (C-8), 145.9 (C-2), 140.0 (C-8a), 137.6 (C-4), 134.6 (C-6), 127.3 (C-4a), 123.2 (C-3), 105.3 (C-7), 97.7 (C-5) ppm. 13C NMR (DMSO-d6): major form: δ = 159.8 (C-8), 145.9 (C-2), 140.0 (C-8a), 137.4 (C-4), 134.7 (C-6), 127.3 (C-4a), 123.2 (C-3), 105.3 (C-7), 97.7 (C-5) ppm. IR (ATR, cm−1): 3186(m), 3072(vw), 1632(m), 1556(m), 1484(m), 1455(m), 1389(m), 1359(s), 1284(w), 1247(w), 1221(w), 1121(w), 1106(w), 1050(m), 985(w), 943(m), 863(m), 800(w), 777(m), 741(m), 684(m), 660(m), 577(w), 500(w), 428(w).

3.3. Physical Measurements

The infrared spectra of the prepared complexes were recorded on a Nicolet 6700 FT-IR spectrophotometer from Thermo Scientific equipped with a diamond crystal Smart Orbit™ in the range 4000–400 cm−1. Elemental analyses of C, H, N and S were obtained on CHNOS Elemental Analyzer Vario MICRO from Elementar Analysensysteme GmbH. NMR spectra were recorded at room temperature on a Varian VNMRS spectrometer operating at 599.87 MHz for 1H and 150.84 MHz for 13C. Spectra were recorded in DMSO-d6 and the chemical shifts were referenced to the residual solvent signal (1H NMR 2.50 ppm, 13C NMR 39.5 ppm). The 2D gCOSY, gHSQC and gHMBC (optimized for a long-range coupling of 8 Hz) methods were employed.

3.4. X-ray Structure Analysis

The data collection for 1, 2, 3 and 4 was carried out on SuperNova diffractometer from Rigaku OD equipped with Atlas2 CCD detector; for 5 a Rigaku XtaLAB Synergy, Dualflex diffractometer equipped with Hybrid Pixel Array Detector (HyPix-6000HE) was used. CrysAlisPro software was used for data collection and cell refinement, data reduction and absorption correction [38]. Crystal structure of 3 was solved and refined by JANA2020 [39], other structures were solved and refined by SHELXT [40] and subsequent Fourier syntheses using SHELXL-2018 [41], respectively, implemented in WinGX program suit [42]. Anisotropic displacement parameters were refined for all non-H atoms, except for heavily disordered triiodide anion in the canals formed in the crystal structure of 3. The maxima found in the difference Fourier map were assigned as iodine and their thermal movement is described by refinement of the 4th order anharmonic ADP for each atom using JANA2020 program. Hydrogen atoms of HXQ and DMF molecules were placed in calculated positions and refined riding on their parent C atoms. H atoms of hydroxyl groups in 3 and water molecules in 2 and 5 involved in hydrogen bonds were found in a Fourier difference map and refined as riding model. A geometric analysis was performed using SHELXL-2018, PLATON [43] was used to analyze π-π interaction, while DIAMOND [44] was used for molecular graphics. A summary of crystal data and structure refinement for all complexes is presented in Table 11.

3.5. DNA/BSA Binding Studies

3.5.1. UV-vis Absorption Study

UV-vis spectrophotometric measurements were carried out on a Varian Cary 100 UV-vis spectrophotometer at room temperature (24 °C) in 10 mM Tris buffer (pH 7.4) using quartz cuvettes with 10 mm light path in the range of 230-500 nm. The complexes were dissolved in DMSO, while the stock solution of ctDNA was prepared in Tris–EDTA buffer (pH 7.4). The DNA concentration per nucleotide was determined by absorption spectroscopy using the molar absorption coefficient (6600 M−1 cm−1) at 260 nm. An equal volume of nucleic acid was added to both the sample and reference cuvettes to eliminate any interference due to the absorbance of DNA itself.

3.5.2. Ethidium Bromide Displacement Assay

The fluorescence emission spectra were measured using a Varian Cary Eclipse spectrofluorometer at room temperature (24 °C) in 10 mM Tris buffer (pH 7.4). The fluorescence spectra were measured at an excitation wavelength of 510 nm and slit width 10 nm for the excitation and emission beams. The emission spectra were recorded in the range 565–700 nm and analyzed according to the classical Stern–Volmer equation:
F 0 F = 1 + K S V · Q
where F0 and F represent the fluorescence intensities in the absence and presence of the quencher, KSV is the Stern–Volmer quenching constant and [Q] is the concentration of the quencher [33].

3.5.3. BSA Binding Experiments

The fluorescence spectra were recorded using a Varian Cary Eclipse spectrofluorometer at a temperature of 25 °C in 0.01 M phosphate-buffered saline (pH 7.4). The excitation wavelength (λex) for BSA was 280 nm and slit width 10 nm for the excitation and emission beams. The spectroflorometric titrations with increasing concentrations of the zinc complexes were recorded in the range 300–450 nm.

3.6. In Vitro Antitumor Activity

3.6.1. Cell Lines and Cell Culture

The human cancer cell lines purchased from ATCC (American Type Culture Collection; Manassas, VA, USA): HCT116 (human colorectal carcinoma) and HeLa (human cervical adenocarcinoma) were cultured in RPMI 1640 medium (Biosera, Kansas City, MO, United States), and A549 (human alveoral adenocarcinoma), MCF-7 (human Caucasian breast adenocarcinoma), Caco-2 (human colorectal adenocarcinoma) and MDA-MB-231 (human breast adenocarcinoma) were maintained in growth medium consisting of high glucose Dulbecco´s Modified Eagle Medium (DMEM) + sodium pyruvate (Biosera). The human kidney fibroblasts (Cos-7) were cultured in DMEM medium (Biosera). All media were supplemented with a 10% fetal bovine serum (FBS; Invitrogen, Carlsbad, CA, USA), 1X HyClone™ antibiotic/antimycotic solution (GE Healthcare, Little Chalfont, UK) and maintained in an atmosphere containing 5% CO2 in humidified air at 37 °C. Prior to each experiment, cell viability was greater than 95%.

3.6.2. Assessment of Cytotoxicity

The antiproliferative effect of zinc complexes (concentrations of 10, 50, 100 µM) was determined by resazurin assay in HCT116, Caco-2, A549, MCF-7, MDA-MB-231, HeLa and Cos-7 cells. Tested cells (1 × 10⁴/well) were seeded in 96-well plates. After 24 h, final zinc complex concentrations prepared from DMSO stock solution were added, and incubation proceeded for the next 72 h. Ten microliters of resazurin solution (Merck, Darmstadt, Germany) at a final concentration of 40 µM was added to each well at the end-point (72 h). After a minimum of 1 h incubation, the fluorescence of the metabolic product resorufin was measured by the automated CytationTM 3 cell imaging multi-mode reader (Biotek, Winooski, VT, USA) at 560 nm excitation/590 nm emission filter. The results were expressed as a fold of the control, where control fluorescence was taken as 100%. All experiments were performed in triplicate. The IC50 values were calculated from these data.

3.7. Antimicrobial Activity

3.7.1. Microorganisms Used

The tested bacteria (S. aureus CCM 4223 and E. coli CCM 3988) were obtained from the Czech collection of microorganisms (CCM, Brno, Czech Republic).

3.7.2. Agar Well-Diffusion Method

The antibacterial properties of the complexes 15 and their ligands HClQ, HdClQ and HdBrQ were evaluated by the agar well diffusion method by slightly modified process compared to [45]. Firstly, each compound was dissolved in a small amount of 100% DMSO and then dissolved to 33.6 µM solution. As a positive control, gentamicin sulphate (Biosera, Nuaille, France) with a concentration of 50 µg/mL was used.
Bacteria were cultured overnight, aerobically at 37 °C in LB medium (Sigma-Aldrich, Saint-Louis, MO, USA) with agitation. The inoculum from these overnight cultures was prepared by adjusting the density of culture to equal that of the 0.5 McFarland standard (1–2 × 10⁸ CFU/mL) by adding a sterile saline solution. These bacterial suspensions were diluted 1:300 in liquid plate count agar (HIMEDIA, Mumbai, India), resulting in a final concentration of bacteria approximately 5 × 10⁵ CFU/mL, and 20 mL of this inoculated agar was poured into a Petri dish (diameter 90 mm). Once the agar was solidified, five mm diameter wells were punched in the agar and filled with 50 μL of samples. Gentamicin sulphate with a concentration of 50 μg/mL was used as a positive control. The plates were incubated for 18–20 h at 37 °C. Afterward, the plates were photographed, and the inhibition zones were measured by the ImageJ 1.53e software (U. S. National Institutes of Health, Bethesda, MD, USA). The values used for the calculation are mean values calculated from 3 replicate tests.
The antibacterial activity was calculated by applying the formula reported in [45]:
%RIZD = [(IZD sample − IZD negative control)/IZD gentamicin] × 100
where RIZD is the relative inhibition zone diameter (%) and IZD is the inhibition zone diameter (mm). As a negative control, the inhibition zones of 5% DMSO equal to 0 were taken. The inhibition zone diameter (IZD) was obtained by measuring the diameter of the transparent zone.

4. Conclusions

In this work, we have prepared five new Zn(II) complexes, [Zn4Cl2(ClQ)6]·2DMF (1), [Zn4Cl2(ClQ)6(H2O)2]·4DMF (2), [Zn2(ClQ)3(HClQ)3]I3 (3), [Zn2(dClQ)2(H2O)6(SO4)] (4) and [Zn2(dBrQ)2(H2O)6(SO4)] (5) (HClQ = 5-chloro-8-hydroxyquinoline, HdClQ = 5,7-dichloro-8-hydroxyquinoline and HdBrQ = 5,7-dibromo-8-hydroxyquinoline), which were characterized by IR spectroscopy, elemental analysis and single crystal X-ray structure analysis. Complexes 1 and 2 are tetranuclear molecular complexes with a complicated type of structure. Dinuclear complex 3 is an ionic compound and dinuclear complexes 4 and 5 have a similar molecular type of structure. The complexes 1 and 2 have symmetric structures in solution and 1H NMR spectra display only one set of signals, corresponding to the appropriate units, and no fluxional phenomena were observed for these complexes. The broadened 1H NMR signals of 3 arise from its low solubility and the presence of some particulate matter in the solution, but, on the other hand, the broadened 1H NMR signals of 4 and 5 are due to the presence of a dynamic exchange process in solution. The time-dependent 1H NMR spectra confirmed the stability of the studied complexes within 72 h. This study also provides information about the DNA binding mode and BSA binding potency of zinc complexes. According to the fairly low Ksv constant for EB displacement, we conclude that these complexes are only weak intercalators. We have also found that complex 3, which shows considerable cytotoxic capacity, has the highest affinity to BSA of all the measured complexes. This outcome can be important for further potential pharmacokinetic measurements. The antiproliferative activity of the prepared complexes was studied using in vitro MTT assay against the HeLa, A549, MCF-7, MDA-MB-231, HCT116 and Caco-2 cancer cell lines and on Cos-7 non-cancerous cell line. The most sensitive to the tested complexes was Caco-2 cell line. Among the tested complexes, complex 3 showed the highest cytotoxicity against all cell lines. Complexes 3 and 4 showed better activity than cisplatin in almost all cases. Unfortunately, all complexes showed only poor selectivity to normal cells, except for complex 5, which showed a certain level of selectivity. Only complex 5 showed antibacterial potential with a concentration of 33.6 µM.

Supplementary Materials

The following supporting information can be downloaded at: https://www.mdpi.com/article/10.3390/inorganics11020060/s1, Figure S1. 1H NMR (600 MHz, DMSO-d6) spectrum of complex 3; Figure S2. 1H (600 MHz, DMSO-d6) and 13C (150 MHz, DMSO-d6) NMR spectrum of complex 5; Figure S3. Time-dependent 1H NMR (600 MHz, DMSO-d6) spectra of complex 2; Figure S4. Time-dependent 1H NMR (600 MHz, DMSO-d6) spectra of complex 3; Figure S5. Time-dependent 1H NMR (600 MHz, DMSO-d6) spectra of complex 4; Figure S6. Time-dependent 1H NMR (600 MHz, DMSO-d6) spectra of complex 5; Figure S7. Part of the one-dimensional structure of 3 viewed along the c axis with π-π interactions (black dashed lines); Figure S8. UV-vis spectrum of complex 1 (6.14 × 10⁻⁶ M) with ctDNA. The arrow indicates changes in absorbance upon increasing DNA concentration. Inset: UV-vis absorption spectrum of 1; Figure S9. UV-vis spectrum of complex 2 (6.14 × 10⁻⁶ M) with ctDNA. The arrow indicates changes in absorbance upon increasing DNA concentration. Inset: UV-vis absorption spectrum of 2; Figure S10. Fluorescence spectrum of DNA-EB complex in the absence (black line) and presence of complex 1. Inset: The corresponding Stern-Volmer plot for quenching process of EB by 1; Figure S11. Fluorescence spectrum of DNA-EB complex in the absence (black line) and presence of complex 2. Inset: The corresponding Stern-Volmer plot for quenching process of EB by 2; Figure S12. Fluorescence quenching spectra of BSA in presence of complex 1. Inset: The corresponding Stern-Volmer plot for 1 at 25 °C; Figure S13. Fluorescence quenching spectra of BSA in presence of complex 2. Inset: The corresponding Stern-Volmer plot for 2 at 25 °C; Table S1. 13C NMR (150 MHz, DMSO-d6) chemical shifts δC [ppm] for complexes 15. Table S2. Data describing different polyhedral distortions for 15; Table S3. Cg···Cg distances and angles (Å, °) characterizing π-π interactions in 1 and 2; Table S4. Cg···Cg distances and angles (Å, °) characterizing π-π interactions in 3; Table S5. Cg···Cg distances and angles (Å, °) characterizing π-π interactions in 5.

Author Contributions

Conceptualization, I.P. and M.H.; investigation, M.H., M.K., M.G., Ľ.T., M.V., D.S., S.S., E.S., M.L., V.K., J.K. and I.P.; resources, M.K., M.G., E.S., M.L. and I.P.; writing—original draft preparation, M.H., M.K., M.G., M.V., D.S., E.S. and I.P.; Writing—Review and Editing, M.H. and I.P.; visualization, M.H., M.V. and D.S.; supervision, I.P.; project administration, I.P.; funding acquisition, M.K., E.S., M.L. and I.P. All authors have read and agreed to the published version of the manuscript.

Funding

The financial support of Slovak grant agencies, VEGA 1/0126/23, 1/0037/22, 1/0653/19 and APVV-18-0016, as well as P.J. Šafárik University in Košice (VVGS-PF-2020-1425, VVGS-2021-1772 and VVGS-PF-2022-2134), are gratefully acknowledged. Moreover, this publication is the result of the project implementation: “Open scientific community for modern interdisciplinary research in medicine (OPENMED)”, ITMS2014 +: 313011V455, supported by the Operational Programme Integrated Infrastructure, funded by the ERDF. CzechNanoLab project LM2018110 funded by MEYS CR is gratefully acknowledged for the financial support of the measurements at LNSM Research Infrastructure. We also thank the Research Infrastructure NanoEnviCz project, supported by the Ministry of Education, Youth and Sports of the Czech Republic, Project No. LM2018124 for instrumentation.

Data Availability Statement

CCDC 2219114–2219118 contain the supplementary crystallographic data for 15. These data can be obtained free of charge via http://www.ccdc.cam.ac.uk/conts/retrieving.html, or from the Cambridge Crystallographic Data Centre, 12 Union Road, Cambridge CB2 1EZ, UK; fax: (+44) 1223-336-033; or e-mail: deposit@ccdc.cam.ac.uk.

Conflicts of Interest

The authors declare no conflict of interest. The funders had no role in the design of the study; in the collection, analyses, or interpretation of data; in the writing of the manuscript; or in the decision to publish the results.

References

  1. Sung, H.; Ferlay, J.; Siegel, R.L.; Laversanne, M.; Soerjomataram, I.; Jemal, A.; Bray, F. Global Cancer Statistics 2020: GLOBOCAN Estimates of Incidence and Mortality Worldwide for 36 Cancers in 185 Countries. CA Cancer J. Clin. 2021, 71, 209–249. [Google Scholar] [CrossRef]
  2. Peng, K.; Liang, B.B.; Liu, W.; Mao, Z.W. What blocks more anticancer platinum complexes from experiment to clinic: Major problems and potential strategies from drug design perspectives. Coord. Chem. Rev. 2021, 449, 214210. [Google Scholar] [CrossRef]
  3. Dasari, S.; Tchounwou, B.P. Cisplatin in cancer therapy: Molecular mechanisms of action. Eur. J. Pharmacol 2014, 740, 364–378. [Google Scholar] [CrossRef] [Green Version]
  4. Medici, S.; Peana, M.; Nurchi, V.M.; Lachowicz, J.I.; Crisponi, G.; Zoroddu, M.A. Noble metals in medicine: Latest advances. Coord. Chem. Rev. 2015, 284, 329–350. [Google Scholar] [CrossRef]
  5. Afzal, O.; Kumar, S.; Haider, M.R.; Ali, M.R.; Kumar, R.; Jaggi, M.; Bawa, S. A review on anticancer potential of bioactive heterocycle quinoline. Eur. J. Med. Chem. 2015, 97, 871–910. [Google Scholar] [CrossRef]
  6. Gupta, R.; Luxami, V.; Paul, K. Insights of 8-hydroxyquinolines: A novel target in medicinal chemistry. Bioorgan. Chem. 2021, 108, 104663. [Google Scholar] [CrossRef]
  7. Colson, P.; Rolain, J.M.; Lagier, J.C.; Brouqui, P.; Raoult, D. Chloroquine and hydroxychloroquine as available weapons to fight COVID-19. Int. J. Antimicrob. Agents 2020, 55, 105932. [Google Scholar] [CrossRef]
  8. Amolegbe, S.A.; Adewuyi, S.; Akinremi, C.A.; Adediji, J.F.; Lawal, A.; Atayese, A.O.; Obaleye, J.A. Iron(III) and copper(II) complexes bearing 8-quinolinol with amino-acids mixed ligands: Synthesis, characterization and antibacterial investigation. Arab. J. Chem. 2015, 8, 742–747. [Google Scholar] [CrossRef] [Green Version]
  9. Scarim, C.B.; Lira de Farias, R.; Vieira de Godoy Netto, A.; Chin, C.M.; Leandro dos Santos, J.; Pavan, F.R. Recent advances in drug discovery against Mycobacterium tuberculosis: Metal-based complexes. Eur. J. Med. Chem. 2021, 214, 113166. [Google Scholar] [CrossRef]
  10. Pippi, B.; Lopes, W.; Reginatto, P.; Silva, F.É.K.; Joaquim, A.R.; Alves, R.J.; Silveira, G.P.; Vainstein, M.H.; Andrade, S.F.; Fuentefria, A.M. New insights into the mechanism of antifungal action of 8-hydroxyquinolines. Saudi Pharm. J. 2019, 27, 41–48. [Google Scholar] [CrossRef]
  11. Yadav, P.; Shah, K. Quinolines, a perpetual, multipurpose scaffold in medicinal chemistry. Bioorg. Chem. 2021, 109. [Google Scholar] [CrossRef] [PubMed]
  12. Saadeh, H.A.; Sweidan, K.A.; Mubarak, M.S. Recent advances in the synthesis and biological activity of 8-hydroxyquinolines. Molecules 2020, 25, 4321. [Google Scholar] [CrossRef] [PubMed]
  13. Zhiwei, R.; Songbai, X.; Qi, H. 5,7-Dihalo-8-quinolinol complex inhibits growth of ovarian cancer cells via the downregulation of expression of Wip1. Trop. J. Pharm. Res. 2020, 19, 1417–1422. [Google Scholar] [CrossRef]
  14. Mrozek-Wilczkiewicz, A.; Kuczak, M.; Malarz, K.; Cieślik, W.; Spaczyńska, E.; Musiol, R. The synthesis and anticancer activity of 2-styrylquinoline derivatives. A p53 independent mechanism of action. Eur. J. Med. Chem. 2019, 177, 338–349. [Google Scholar] [CrossRef] [PubMed]
  15. Cherdtrakulkiat, R.; Boonpangrak, S.; Sinthupoom, N.; Prachayasittikul, S.; Ruchirawat, S.; Prachayasittikul, V. Derivatives (halogen, nitro and amino) of 8-hydroxyquinoline with highly potent antimicrobial and antioxidant activities. Biochem. Biophys. Rep. 2016, 6, 135–141. [Google Scholar] [CrossRef] [Green Version]
  16. Rbaa, M.; Haida, S.; Tuzun, B.; Hichar, A.; Hassane, A.E.; Kribii, A.; Lakhrissi, Y.; Hadda, T.B.; Zarrouk, A.; Lakhrissi, B.; et al. Synthesis, characterization and bioactivity of novel 8-hydroxyquinoline derivatives: Experimental, molecular docking, DFT and POM analyses. J. Mol. Struct. 2022, 1258, 132688. [Google Scholar] [CrossRef]
  17. Budimir, A.; Humbert, N.; Elhabiri, M.; Osinska, I.; Biruš, M.; Albrecht-Gary, A.M. Hydroxyquinoline based binders: Promising ligands for chelatotherapy? J. Inorg. Biochem. 2011, 105, 490–496. [Google Scholar] [CrossRef]
  18. Farkasová, V.; Drweesh, S.A.; Lüköová, A.; Sabolová, D.; Radojević, I.D.; Čomić, L.R.; Vasić, S.M.; Paulíková, H.; Fečko, S.; Balašková, T.; et al. Low-dimensional compounds containing bioactive ligands. Part VIII: DNA interaction, antimicrobial and antitumor activities of ionic 5,7-dihalo-8-quinolinolato palladium(II) complexes with K+ and Cs+ cations. J. Inorg. Biochem. 2017, 167, 80–88. [Google Scholar] [CrossRef]
  19. Litecká, M.; Hreusová, M.; Kašpárková, J.; Gyepes, R.; Smolková, R.; Obuch, J.; David, T.; Potočňák, I. Low-dimensional compounds containing bioactive ligands. Part XIV: High selective antiproliferative activity of tris(5-chloro-8-quinolinolato)gallium(III) complex against human cancer cell lines. Bioorgan. Med. Chem. Lett. 2020, 30, 127206. [Google Scholar] [CrossRef]
  20. Kuchárová, V.; Kuchár, J.; Lüköová, A.; Jendželovský, R.; Majerník, M.; Fedoročko, P.; Vilková, M.; Radojević, I.D.; Čomić, L.R.; Potočňák, I. Low-dimensional compounds containing bioactive ligands. Part XII: Synthesis, structures, spectra, in vitro antimicrobial and cytotoxic activities of zinc(II) complexes with halogen derivatives of quinolin-8-ol. Polyhedron 2019, 170, 447–457. [Google Scholar] [CrossRef]
  21. Vranec, P.; Potočňák, I. Low-dimensional compounds containing bioactive ligands. Part III: Palladium(II) complexes with halogenated quinolin-8-ol derivatives. J. Mol. Struct. 2013, 1041, 219–226. [Google Scholar] [CrossRef]
  22. Vranec, P.; Potočňák, I.; Sabolová, D.; Farkasová, V.; Ipóthová, Z.; Pisarčíková, J.; Paulíková, H. Low-dimensional compounds containing bioactive ligands. V: Synthesis and characterization of novel anticancer Pd(II) ionic compounds with quinolin-8-ol halogen derivatives. J. Inorg. Biochem. 2014, 131, 37–46. [Google Scholar] [CrossRef]
  23. El-Dissouky, A.; Fahmy, A.; Amer, A. Complexing Ability of some r-Lactone Derivatives. Thermal, Magnetic and Spectral Studies on Cobalt(II), Nickel(I1) and Copper(I1) Complexes and their Base Adducts. Inorganica Chim. Acta 1987, 133, 311–316. [Google Scholar] [CrossRef]
  24. Ananthanarayanan, V. Studies on the vibrational spectrum of the so4- Ion in Crystalline M2′M″(SO4)2· 6H2O (M′ =K or NH4 and M″ =Mg, Zn, Ni, or Co): Observations on the symmetry of the sulfate ion in crystals. J. Chem. Phys. 1968, 48, 573–581. [Google Scholar] [CrossRef]
  25. Arjunan, V.; Mohan, S.; Ravindran, P.; Mythili, C.V. Vibrational spectroscopic investigations, ab initio and DFT studies on 7-bromo-5-chloro-8-hydroxyquinoline. Spectrochim. Acta-Part A Mol. Biomol. Spectrosc. 2009, 72, 783–788. [Google Scholar] [CrossRef] [PubMed]
  26. Arici, K. Vibrational Spectra of 4-hydroxy-3-cyano-7-chloro-quinoline by Density Functional Theory and ab initio Hartree-Fock Calculations. Int. J. Chem Technol. 2017, 1, 24–29. Available online: http://dergipark.gov.tr/ijct (accessed on 26 October 2017). [CrossRef] [Green Version]
  27. Zhang, H.R.; Liu, Y.C.; Chen, Z.F.; Guo, J.; Peng, Y.X.; Liang, H. Crystal Structures, Cytotoxicity, Cell Apoptosis Mechanism, and DNA Binding of Two 8-Hydroxylquinoline Zinc(II) Complexes. Russ. J. Coord. Chem. 2018, 44, 322–334. [Google Scholar] [CrossRef]
  28. Addison, A.W.; Rao, T.N.; Reedijk, J.; Van Rijn, J.; Verschoor, G.C. Synthesis, structure, and spectroscopic properties of copper(II) compounds containing nitrogen–sulphur donor ligands; the crystal and molecular structure of aqua [1,7-bis(N-methylbenzimidazol-2′-yl)-2,6-dithiaheptane]copper(II) perchlorate. J. Chem. Soc. Dalton Trans. 1984, 7, 1349–1356. [Google Scholar] [CrossRef]
  29. Llunell, M.; Casanova, D.; Cirera, J.; Alemany, P.; Alvarez, S. SHAPE, Version 2.1; Universitat de Barcelona: Barcelona, Spain, 2013. [Google Scholar]
  30. Khakhlary, P.; Baruah, J.B. Studies on cluster, salt and molecular complex of zinc-quinolinate. Chem. Sci. J. 2015, 127, 215–223. [Google Scholar] [CrossRef] [Green Version]
  31. Liu, Y.C.; Wei, J.H.; Chen, Z.F.; Liu, M.; Gu, Y.Q.; Huang, K.-B.; Li, Z.Q.; Liang, H. The antitumor activity of zinc(II) and copper(II) complexes with 5,7-dihalo-substituted-8-quinolinoline. Eur. J. Med. Chem. 2013, 69, 554–563. [Google Scholar] [CrossRef]
  32. Zhang, H.R.; Liu, Y.C.; Meng, T.; Qin, Q.P.; Tang, S.F.; Chen, Z.F.; Zou, B.Q.; Liu, Y.N.; Liang, H. Cytotoxicity, DNA binding and cell apoptosis induction of a zinc(II) complex of HBrQ. MedChemComm 2015, 6, 2224–2231. [Google Scholar] [CrossRef]
  33. Drweesh, E.A.; Kuchárová, V.; Volarevic, V.; Miloradovic, D.; Ilic, A.; Radojević, I.D.; Raković, I.R.; Smolková, R.; Vilková, M.; Sabolová, D.; et al. Low-dimensional compounds containing bioactive ligands. Part XVII: Synthesis, structural, spectral and biological properties of hybrid organic-inorganic complexes based on [PdCl4]2− with derivatives of 8-hydroxyquinolinium. J. Inorg. Biochem. 2022, 228, 111697. [Google Scholar] [CrossRef] [PubMed]
  34. Palmeira-Mello, M.V.; Caballero, A.B.; Lopez-Espinar, A.; Guedes, G.P.; Caubet de Souza, A.M.T.A.; Lanznaster, M.; Gamez, P. DNA-interacting properties of two analogous square-planar cis-chlorido complexes: Copper versus palladium. J. Biol. Inorg. Chem. 2021, 26, 727–740. [Google Scholar] [CrossRef] [PubMed]
  35. Mansouri-Torshizi, H.; Khosravi, F.; Ghahghaei, A.; Shahraki, S.; Zareian-Jahromi, S. Investigation on the interaction of newly designed potential antibacterial Zn(II) complexes with CT-DNA and HSA. J. Biomol. Struct. Dyn. 2018, 36, 2713–2737. [Google Scholar] [CrossRef]
  36. Yallur, B.C.; Katrahalli, U.; Krishna, P.M.; Hadagali, M.D. BSA binding and antibacterial studies of newly synthesized 5,6-Dihydroimidazo [2,1-b]thiazole-2-carbaldehyde. Spectrochim. Acta A Mol. Biomol. 2019, 222, 117192. [Google Scholar] [CrossRef] [PubMed]
  37. Butkus, J.M.; O’Riley, S.; Chohan, B.S.; Basu, S. Interaction of Small Zinc Complexes with Globular Proteins and Free Tryptophan. Int. J. Spectrosc. 2016, 2016, 1378680. [Google Scholar] [CrossRef] [Green Version]
  38. Rigaku. CrysAlisPRO, Version 1.0.43; Rigaku Oxford Diffraction: Yarnton, UK, 2020. [Google Scholar]
  39. Petříček, V.; Dušek, M.; Palatinus, L. Crystallographic Computing System JANA2006: General features. Z. Krist.-Cryst. Mater. Online 2014, 229, 345–352. [Google Scholar] [CrossRef]
  40. Sheldrick, G.M. SHELXT—Integrated space-group and crystal-structure determination. Acta Crystallogr. Sect. A Found. Adv. 2015, 71, 3–8. [Google Scholar] [CrossRef] [PubMed] [Green Version]
  41. Sheldrick, G.M. Crystal structure refinement with SHELXL. Acta Crystallogr. Sect. C Struct. Chem. 2015, 71, 3–8. [Google Scholar] [CrossRef] [PubMed] [Green Version]
  42. Farrugia, L.J. WinGX and ORTEP for Windows: An update. J. Appl. Crystallogr. 2012, 45, 849–885. [Google Scholar] [CrossRef]
  43. Spek, A.L. Structure validation in chemical crystallography. Acta Crystallogr. Sect. D Biol. Crystallogr. 2009, 65, 148–155. [Google Scholar] [CrossRef] [PubMed] [Green Version]
  44. Brandenburg, K. Diamond. Version 3.2K.; Crystal Impact GbR: Bonn, Germany, 2014. [Google Scholar]
  45. Rojas, J.J.; Ochoa, V.J.; Ocampo, S.A.; Muñoz, J.F. Screening for antimicrobial activity of ten medicinal plants used in Colombian folkloric medicine: A possible alternative in the treatment of non-nosocomial infections. BMC Complement. Altern. Med. 2006, 6, 2. [Google Scholar] [CrossRef] [PubMed] [Green Version]
Figure 1. Synthesis and formulae of 15. 1: bis(µ3-5-chloro-8-hydroxyquinolinato)-tetrakis(µ2-5-chloro-8-hydroxyquinolinato)-dichloride-tetra-zinc(II) bis-dimethylformamide solvate, [Zn4Cl2(ClQ)6]·2DMF; 2: bis(µ3-5-chloro-8-hydroxyquinolinato)-tetrakis(µ2-5-chloro-8-hydroxyquinolinato)-diaqua-dichloride-tetra-zinc(II) tetra-dimethylformamide solvate, [Zn4Cl2(ClQ)6(H2O)2]·4DMF; 3: tris(5-chloro-8-hydroxyquinolinato)-tris(5-chloro-8-hydroxyquinoline)-di-zinc(II) triiodide, [Zn2(ClQ)3(HClQ)3]I3; 4: catena-(µ2-sulphato)-haxaaqua-bis(5,7-dichloro-8-hydroxyquinolinato)-di-zinc(II), [Zn2(dClQ)2(H2O)6(SO4)]; 5: catena-(µ2-sulphato)-haxaaqua-bis(5,7-dibromo-8-hydroxyquinolinato)-di-zinc(II), [Zn2(dBrQ)2(H2O)6(SO4)].
Inorganics 11 00060 g001
Figure 2. FT–IR spectra of 15.
Inorganics 11 00060 g002
Figure 3. 1H (600 MHz, DMSO-d6) and 13C (150 MHz, DMSO-d6) NMR spectrum of complex 4.
Inorganics 11 00060 g003
Figure 4. Time-dependent 1H NMR (600 MHz, DMSO-d6) spectra of complex 1.
Inorganics 11 00060 g004
Figure 5. Molecular structure of 1 (up) and 2 (down). Solvated DMF molecules are omitted, symmetry code: i = −x, −y + 1, −z + 1. Displacement ellipsoids are drawn at 50% probability.
Inorganics 11 00060 g005
Figure 6. Part of the two-dimensional structure of 1 viewed along the a axis with hydrogen bonds (red dashed lines). Only hydrogen atoms involved in the hydrogen bonds are shown for clarity.
Inorganics 11 00060 g006
Figure 7. Part of the one-dimensional structure of 2 viewed along the c axis with hydrogen bonds (red dashed lines). Only hydrogen atoms involved in the hydrogen bonds are shown for clarity.
Inorganics 11 00060 g007
Figure 8. Molecular structure of 3, symmetry code: i = −x + 1, y, −z + 1.5. Displacement ellipsoids are drawn at 50% probability.
Inorganics 11 00060 g008
Figure 9. Molecular structure of 5. Displacement ellipsoids are drawn at 50% probability.
Inorganics 11 00060 g009
Figure 10. Part of the two-dimensional structure of 5 viewed along the b axis with hydrogen bonds (red dashed lines) and π-π interactions (black dashed lines).
Inorganics 11 00060 g010
Figure 11. UV-vis spectrum of complex 3 (6.14 × 10⁻⁶ M) with ctDNA. The arrow indicates changes in absorbance upon increasing DNA concentration. Inset: UV-vis absorption spectrum of 3.
Inorganics 11 00060 g011
Figure 12. Fluorescence spectrum of DNA–EB complex in the absence (black line) and presence of complex 3. Inset: the corresponding Stern–Volmer plot for quenching process of EB by 3.
Inorganics 11 00060 g012
Figure 13. Fluorescence quenching spectra of BSA in presence of complex 3. Inset: the corresponding Stern–Volmer plot for 3 at 25 °C.
Inorganics 11 00060 g013
Table 1. 1H NMR (600 MHz, DMSO-d6) chemical shifts δH [ppm] for 15.
δH (mult., J [Hz])
H-2H-3H-4H-6H-7
1 *ClQ8.74 (br s)7.75 (dd, 8.5, 4.5)8.54 (d, 8.5)7.50 (d, 8.5)6.73 (br s)
2 *ClQ8.74 (br s)7.75 (dd, 8.4, 4.4)8.54 (dd, 8.4, 1.5)7.50 (d, 8.4)6.74 (d, 8.4)
3ClQ8.66 (br s)7.74 (br s)8.52 (br s)7.51 (br s)6.72 (br s)
HClQ8.95 (br s)7.74 (br s)8.52 (br s)7.60 (br s)7.08 (br s)
4 **dClQ8.55 (br s)
8.79 (br s)
7.70 (m)8.50 (d, 8.4)7.70 (m)-
5 **dBrQ8.47 (br s)
8.76 (br s)
7.70 (br s)
7.75 (br s)
8.41 (d, 8.5)
8.44 (br s)
7.92 (s)
7.92 (s)
-
* 7.95 (s, HDMF), 2.89 (s, MeDMF) and 2.73 (s, MeDMF); ** chemical shifts for major form are in the first line and for the minor form in the second line.
Table 2. Selected bond distances and angles [Å, °] for 1 and 2.
12 12
Zn1-Cl12.2766 (5)2.3149 (5)O3-Zn1-O1106.79 (6)95.66 (5)
Zn1-O12.0153 (13)2.0388 (13)O3-Zn1-N2i106.90 (6)93.30 (5)
Zn1i-O22.2779 (13)2.0789 (12)O1-Zn1-N2i128.77 (6)148.68 (5)
Zn1-O32.0134 (12)2.0194 (12)O3-Zn1-Cl1109.17 (4)116.24 (4)
Zn1i-N22.1101 (17)2.1126 (16)O1-Zn1-Cl1106.28 (4)98.52 (4)
Zn2i-O12.0926 (13)2.0893 (12)N2i-Zn1-Cl197.67 (5)104.23 (4)
Zn2-O22.0809 (12)2.0463 (13)O3-Zn1-O2i78.82 (5)143.62 (5)
Zn2i-O2/O4i a2.2058 (12)2.2044 (13)O1-Zn1-O2i75.39 (5)77.12 (5)
Zn2-O32.1016 (13)2.1054 (12)N2i-Zn1-O2i74.63 (6)77.92 (5)
Zn2i-N12.0983 (15)2.1525 (16)Cl1-Zn1-O2i170.49 (4)100.13 (4)
Zn2-N32.0791 (15)2.0791 (15)O2-Zn2-N3100.07 (5)108.62 (6)
O2-Zn2-O1i78.25 (5)76.73 (5)
N3-Zn2-O1i102.75 (6)170.93 (6)
O2-Zn2-N1i153.47 (6)150.34 (5)
N3-Zn2-N1i98.11 (6)99.11 (6)
O1i-Zn2-N1i79.01 (5)77.27 (5)
O2-Zn2-O399.92 (5)99.00 (5)
N3-Zn2-O378.85 (6)79.48 (5)
O1i-Zn2-O3177.72 (5)92.56 (5)
N1i-Zn2-O3102.44 (5)96.15 (5)
O2-Zn2-O2i/O4i a78.62 (5)81.48 (5)
N3-Zn2-O2i/O4156.91 (6)92.26 (5)
O1i-Zn2-O2i/O499.55 (5)95.84 (5)
N1i-Zn2-O2i/O491.90 (5)87.24 (5)
O3-Zn2-O2i/O478.69 (5)171.46 (5)
Symmetry code: i = −x + 1, −y + 1, −z + 1. a Atom O4i from 2.
Table 3. Hydrogen bond interactions (Å, °) in 1 and 2.
ComplexD-H···Ad(D-H)d(H···A)d(D···A)<(DHA)
1C22-H22···O40 i0.952.323.127149.9
C26-H26···Cl1A ii0.952.773.633151.6
2C22-H22···Cl1 iii0.952.763.592146.2
C37-H37···Cl10.952.803.661151.2
C11-H11···O50.952.383.158138.3
C36-H36···Cl25 i0.952.713.631162.3
O4-H1O···O60.881.812.685171.2
O4-H2O···Cl1 iv0.862.443.247155.6
Symmetry codes: i = x + 1, y, z; ii = −x + 1, −y + 1, −z (1); i = x + 1, y, z; iii = x−1, y, z; iv = −x + 1, −y + 1, −z + 1 (2).
Table 4. Selected bond distances and angles [Å, °] for 3.
Zn1-O12.097 (3)O1-Zn1-O288.54 (11)
Zn1-O22.101 (3)O1-Zn1-O391.48 (10)
Zn1-O32.171 (3)O1-Zn1-N177.03 (12)
Zn1-N1 2.142 (3)O1-Zn1-N2165.42 (12)
Zn1-N22.098 (3)O1-Zn1-N393.46 (12)
Zn1-N32.089 (3)O2-Zn1-N193.25 (12)
O2-Zn1-N278.93 (12)
O2-Zn1-N3161.62 (12)
O3-Zn1-O284.24 (11)
O3-Zn1-N1168.32 (12)
O3-Zn1-N294.61 (11)
O3-Zn1-N377.46 (11)
N1-Zn1-N288.3 (3)
N3-Zn1-N1169.4 (3)
N3-Zn1-N284.5 (3)
Table 5. Hydrogen bond interactions [Å, °] for 3.
D-H···Ad (D-H)d (H···A)d (D···A)<(DHA)
O1-H1-O1 i1.2021.2022.399172
O2-H2···O3 i1.201.242.435174
Symmetry code: i = −x + 1, y, −z + 1.5.
Table 6. Selected bond distances and angles [Å, °] for 5.
Zn1-O1w2.079 (6)O1-Zn1-O2172.5 (2)
Zn1-O2w2.053 (6)N1-Zn1-O179.5 (3)
Zn1-O3w2.078 (6)N1-Zn1-O293.0 (3)
Zn1-N1 2.094 (7)O1w-Zn1-N193.5 (3)
Zn1-O12.118 (6)O1w-Zn1-O193.1 (2)
Zn1-O2 2.214 (6)O1w-Zn1-O287.9 (2)
Zn2-O5 2.060 (6)O2w-Zn1-O287.4 (2)
Zn2-O4w 2.061 (7)O2w-Zn1-O3w82.8 (2)
Zn2-O62.088 (6)O2w-Zn1-O1w167.9 (2)
Zn2-O6w 2.095 (7)O2w-Zn1-N197.8 (3)
Zn2-O5w2.112 (7)O2w-Zn1-O193.1 (3)
Zn2-N62.135 (7)O3w-Zn1-O1w86.4 (3)
O3w-Zn1-N1173.8 (3)
O3w-Zn1-O194.3 (2)
O3w-Zn1-O293.2 (2)
O4w-Zn2-O696.0 (3)
O4w-Zn2-N694.2 (3)
O4w-Zn2-O5w169.4 (3)
O4w-Zn2-O6w84.5 (3)
O5-Zn2-O4w88.3 (3)
O5-Zn2-O5w87.6 (3)
O5-Zn2-O686.6 (2)
O5-Zn2-O6w101.3 (3)
O5-Zn2-N6165.6 (3)
O5w-Zn2-N692.1 (3)
O6-Zn2-O5w93.5 (3)
O6w-Zn2-O5w86.7 (3)
O6-Zn2-O6w172.1 (3)
O6-Zn2-N679.1 (3)
O6w-Zn2-N693.0 (3)
Table 7. Hydrogen bond interactions [Å, °] in 5.
D-H···Ad (D-H)d (H···A)d (D···A)<(DHA)
O1w-H1O2···O6 ii0.871.892.740165.6
O1w-H2O2···O2 ii0.872.163.021173.0
O2w-H2O4···O6 i0.881.962.788157.2
O2w-H1O4···O40.881.972.738146.1
O3w-H1O3···O2 ii0.872.052.879159.3
O3w-H2O3···O4 i0.872.212.932139.3
O4w-H2O8···O1 ii0.872.052.789141.7
O4w-H1O8···O3 iv0.872.082.886153.6
O5w-H1O7···O1 i0.871.872.707160.7
O5w-H2O7···O3 iii0.871.992.787152.3
O6-H1O9···O5w iii0.872.012.855161.2
O6w-H2O9···O4 iii0.872.032.825151.5
Symmetry codes: i = −x + 2, −y + 1, −z + 1; ii = −x + 1, −y + 1, −z + 1; iii = −x + 2, −y + 2, −z + 1; iv = −x + 1, −y + 2, −z + 1.
Table 8. Spectral binding parameters of complexes 13.
Complexλmax1
[nm]
λmax2
[nm]
Δλmax2
[nm]
hypochromism at λmax2 [%]KsvEB
×104 [M−1]
KsvBSA
×106 [M−1]
1 215275216.321.062.04
2 218275121.720.620.68
3 219259446.540.345.44
Table 9. IC50 values [µM] for complexes 15, corresponding ligands and cisplatin in the various cell lines.
HeLaA549MCF-7MDA-MB-231HCT116Caco-2Cos-7
171.239.58.629.97.933.926.5
233.630.37.125.56.928.625.2
38.35.85.98.15.56.26.9
414.885.815.936.925.496.306.53
531.8325.705.938.106.8917.6336.76
HClQ39.6018.176.569.515.93103.6820.82
HdClQ33.1231.236.579.857.1038.8662.95
HdBrQ59.9179.7212.0347.1528.6685.0588.17
cisplatin18.8213.5021.6073.403.2823.2018.30
Table 10. Antibacterial activity of tested complexes. RIZD (%) means percentage of relative inhibition zone diameter. All complexes were tested against E. coli and S. aureus in three replicates (n = 3, ±SD). NA means no activity.
RIZD (%)12 345
E. coliNANANANANA
S. aureusNANANANA66.97
Table 11. Crystal data and structural refinement for 15.
Compound1234 a5
Empirical formulaC60H44Cl8N8O8Zn4C66H62Cl8N10O12Zn4C54H33Cl6I3N6O6Zn2C18H20Cl4N2O12S1Zn2C18H20Br4N2O12S1Zn2
Formula weight [g·mol−1]1550.111732.331586.1761.01938.8
Temperature [K]95 (2) 95 (2) 95 (2)95 (2)100 (2)
Wavelength [Å]1.541841.541841.541841.541841.54184
Crystal systemTriclinicTriclinicMonoclinicTriclinicTriclinic
Space groupP1P1I2/cP1P1
Unit cell dimensions [Å, °]a = 10.5958 (2)
b = 11.9402 (2)
c = 13.4286 (2)
α = 110.555 (1)
β = 106.214 (1)
γ = 97.530 (1)
a = 11.5637 (1)
b = 12.8889 (1)
c = 13.9496 (2)
α = 108.460 (1)
β = 103.392 (1)
γ = 107.652 (1)
a = 16.1712 (2)
b = 15.5676 (2)
c = 22.0518 (3)
β = 99.646 (1)
a = 10.2395 (2)
b = 18.4516 (5)
c = 27.6232 (11)
α = 75.983 (3)
β = 86.842 (2)
γ = 89.267 (2)
a = 7.1417 (2)
b = 10.3496 (4)
c = 17.6888 (8)
α = 89.915 (3)
β = 86.591 (3)
γ = 88.077 (2)
Volume [Å3]1477.08 (4)1751.46 (4)5472.98 (12)5055.9 (3) 1304.40 (9)
Z; density (calculated)
[g cm−3]
1; 1.7431; 1.6424; 1.92498; 1.9992; 2.390
Absorption coefficient [mm−1]5.7084.93517.537.61610.790
F(000)78088030723056908
Crystal shape, colorprism, orangeprism, yellowprism, dark brownplate, yellowplate, yellow
Crystal size [mm3]0.187 × 0.119 × 0.0580.154 × 0.113 × 0.0880.20 × 0.18 × 0.120.016 × 0.029 × 0.2040.042 × 0.056 × 0.086
θ range for data collection [°]3.753 to 76.2983.584 to 76.4663.45 to 74.563.285 to 74.1152.502 to 77.357
Index ranges−12 ≤ h ≤ 13,
−15 ≤ k ≤ 15,
−16 ≤ l ≤ 16
−14 ≤ h ≤ 14,
−16 ≤ k ≤ 16,
−17 ≤ l ≤ 17
−20 ≤ h ≤ 20,
−18 ≤ k ≤ 19,
−27 ≤ l ≤ 27
−12 ≤ h ≤ 10,
−23 ≤ k ≤ 21,
−30 ≤ l ≤ 34
−8 ≤ h ≤ 8,
−13 ≤ k ≤ 13,
−22 ≤ l ≤ 22
Reflections collected/
independent
54196/6102
[R (int) = 0.0240]
64538/7280
[R (int) = 0.0348]
52620/5599
[R (int) = 0.0319]
30212/19479
[R (int) = 0.0375]
12316/12316
[R (int) = 0.0705]
Data/restraints/
parameters
6102/0/4497280/0/4555590/0/39019479/0/74512316/0/361
Goodness-of-fit on F21.0221.0473.5791.0781.091
Final R indices [I>2σ(I)]R1 = 0.0276,
wR2 = 0.0683
R1 = 0.0282,
wR2 = 0.0721
R1 = 0.0567,
wR2 = 0.1826
R1 = 0.1206,
wR2 = 0.3232
R1 = 0.0527,
wR2 = 0.1657
R indices (all data)R1 = 0.0292,
wR2 = 0.0692
R1 = 0.0316,
wR2 = 0.0748
R1 = 0.0601,
wR2 = 0.1854
R1 = 0.1362,
wR2 = 0.3334
R1 = 0.0567,
wR2 = 0.1696
Largest diff. peak and hole [e Å−3]0.528 and −0.7790.491 and −0.5652.64 and −1.263.824 and −1.5571.502 and −0.960
a Only isotropic model.
Disclaimer/Publisher’s Note: The statements, opinions and data contained in all publications are solely those of the individual author(s) and contributor(s) and not of MDPI and/or the editor(s). MDPI and/or the editor(s) disclaim responsibility for any injury to people or property resulting from any ideas, methods, instructions or products referred to in the content.

