Article

Optical Proxies of Euxinia: Spectroscopic Studies of CDOM, Chlorophyll, and Bacteriochlorophylls in the Lagoon on Zeleny Cape (the White Sea)

1
Faculty of Physics, Lomonosov Moscow State University, Moscow 119991, Russia
2
Department of Biology, Lomonosov Moscow State University, Moscow 119991, Russia
3
Kharkevich Institute for Information Transmission Problems, Russian Academy of Sciences, Moscow 127051, Russia
*
Author to whom correspondence should be addressed.
Photonics 2023, 10(6), 672; https://doi.org/10.3390/photonics10060672
Submission received: 12 April 2023 / Revised: 28 May 2023 / Accepted: 29 May 2023 / Published: 9 June 2023
(This article belongs to the Special Issue Micro Fluorescence Detectors/Sensors and Their Applications)

Abstract

:
Along the shoreline of the White Sea, due to the post-glacial uplift of the coast, some water bodies with stable stratification have been formed. They have been classified as meromictic as they are at different stages of isolation from the Sea. As separation progresses, significant changes occur in the water column, including the composition of chromophoric dissolved organic matter (CDOM) and the structure of the aquatic microbial community. In this work, we searched for optical proxies of euxinia (anoxic conditions with accumulated hydrogen sulfide) in the water column of the meromictic lagoon on Zeleny Cape. The lagoon is separated from the White Sea basin by a shallow threshold that completely isolates the lagoon during low tide, but marine water enters the lagoon during high tide. The ecosystem in the lagoon is characterized by the marine salinity of water and a high organic matter content in the bottom water and sediments. In this study, spectral methods were used to obtain the depth distribution of CDOM, chlorophyll, and bacteriochlorophyll in the lagoon with strong water stratification and euxinic conditions in the bottom water. The measured optical CDOM characteristics were compared with hydrochemical data (water salinity, Eh, pH, dissolved oxygen), phytoplankton (oxygenic phototrophs), and green sulfur bacteria (anoxygenic phototrophs) distribution along the water column. The spectroscopic methods showed to have the advantages of not requiring water sample pre-treatment and allowing rapid sensing of CDOM and photosynthetic pigments at each horizon.

Graphical Abstract

1. Introduction

Euxinic conditions, or euxinia, occur when there is a sulfide accumulation and the resulting bottom water anoxia. Euxinic water bodies are usually strongly stratified, with the aerobic surface layer and the sulfide-rich bottom water. The combination of stratified waters and slow vertical mixing is essential to maintaining euxinic conditions [1]. Euxinia is quite rare in modern times; however, it existed in ancient seas and was an important characteristic during many key periods of the Earth’s history [2]. Euxinia is currently found in meromictic water bodies, such as some lakes and lagoons on the coast of the White, Barents, Japanese, Okhotsk Seas, and others, and the Black Sea is a large euxinic water body [1]. Nowadays, euxinic conditions are found on less than 0.5% of the seafloor [3].
On the coast of the White Sea, due to post-glacial uplift, some water bodies with stable stratification were formed, which are at different stages of isolation from the sea [4,5,6,7]. The hydrological feature of the meromictic water bodies found on the coast of the White Sea is a specific vertical stratification of the water column with a transition from surface fresh (or brackish) water to salt water at a depth caused by the overlay of marine water by fresh runoff. These meromictic water bodies were classified as coastal marine types according to their definition [8,9]. The upper layer with lower salinity involved in seasonal circulation is defined as mixolimnion, and the bottom stagnant water is defined as monimolimnion. Usually, the latter is anoxic. In meromictic reservoirs, at the oxic–anoxic interface (chemocline), a colored layer of water often appears due to the massive development of phototrophic microorganisms. These can be unicellular algae that concentrate near the source of biogenic elements diffusing from the anaerobic zone, or anoxygenic phototrophic bacteria that photooxidize hydrogen sulfide. The color of the water layer depends on the dominant microorganism and the pigments that make up their photosynthetic apparatus. In the case of purple sulfur bacteria, the water color is pink. For green-colored sulfur bacteria or unicellular green algae, the color is green, and for brown-colored green sulfur bacteria, it is brown-red. Another variation in the colored layers is formed by cryptophyte algae, which have red phycobilin (for example, phycoerythrin) or blue phycobilins (phycocyanin and allophycocyanin) as additional pigments. The layer with their massive development has the corresponding color [10]. On the coast of the White Sea, in most meromictic water bodies, colored interlayers marking the chemocline were found [4,11]. It has been noted that in water bodies that have recently separated from the sea and have not yet lost contact with it, this layer has red shades due to purple sulfur bacteria, the brown form of green sulfur bacteria Chlorobium phaeovibrioides, or the cryptophyte flagellates Rhodomonas sp. In long-separated water bodies, where the surface layer of water (mixolimnion) has already become fresh, an outbreak of green-colored Chlorobium phaeovibrioides occurs in the anaerobic part of the chemocline, and above the redox transition, green-colored algae, such as euglenoids or flagellates Micromonas sp., and sometimes blue-green colored cryptophyte algae Cryptomonas, can be found [11].
Along with the process of separation from the White Sea, significant changes occur in the water chemical properties and the structure of the aquatic community. These changes are a result of the microbial decomposition of plant residues and other biomaterials. This is also related to the peculiarities of the composition of dissolved organic matter (DOM) in water bodies. DOM is an essential component of natural water and represents one of the largest pools of carbon in the global biosphere [12,13]. It plays a critical role in many ecological processes [14,15,16,17,18]. The colored portion of the DOM (chromophoric dissolved organic matter, CDOM) of natural water is made up of humic substances, which are complex mixtures of heterogeneous organic compounds of biotic origin that have undergone extensive transformations. Humic substances are high-molecular-weight aromatic hydroxycarboxylic acids containing various functional groups, such as carboxylic and phenolic groups (which affect its solubility) and aromatic structures (which absorb light) [19]. They are capable of forming hydrogen bonds, actively participating in sorption processes, and entering into hydrophobic, ionic, and donor–acceptor interactions with various classes of organic compounds [19,20]. Humic substances are also capable of chelating organometallic substances, thereby sequestering toxic heavy metals. The ecological consequence of such binding includes changes in the form of the existence of toxic substances and their ability to migrate, a decrease in their bioavailability, and a reduction in their toxicity [21]. This is because the free form of the toxicant has the highest activity, while the bound substance loses its toxicity. Some phytoplankton, such as dinoflagellates, may be capable of using nitrogen derived from humic substances [22]. Chelation by humic compounds might also enhance the availability of iron to phytoplankton [19].
Humic substances play a crucial role in determining the water color and its optical properties [23,24,25,26,27,28,29]. The concentration of the CDOM in aquatic systems is influenced by numerous factors such as soil type, climatic conditions, hydrological regime, presence of vegetation, and the development of microorganisms [30]. The absorbance or absorption coefficient (calculated as absorbance divided by path length, multiplied by 2.303 to convert to natural log units) of humic substances in the UV range, usually measured at 350 nm, is an important parameter used to estimate the CDOM content in natural waters. Spectroscopic methods offer several advantages over traditional techniques, including the ability to measure water characteristics remotely via methods such remote LiDAR sensing [31,32,33,34,35] or satellite remote sensing [36,37,38]. These optical properties of CDOM are essential in many operational applications of ocean-color satellite sensing, such as natural fisheries, protected marine area selection and monitoring, ecosystem model data assimilation, aquaculture site selection and monitoring, water quality and eutrophication, hazard monitoring such as nuisance or harmful algal blooms, and more [39].
In this study, we aimed to identify the optical proxies that could indicate the presence of euxinia (conditions characterized by both anoxia and sulfide) at the lagoon on Zeleny Cape, a marine meromictic reservoir located on the White Sea coast. The ecosystem of the lagoon is part of a group of isolated lagoons with high levels of organic matter in their sediments. The lagoon is separated from the White Sea basin by a shallow threshold that completely isolates it during low tide. The main objectives of this study include using spectral methods to determine the depth distribution of CDOM, phytoplankton chlorophyll (Chl), and bacteriochlorophyll (Bchl) from anoxygenic bacteria in the lagoon, which experiences strong stratification and euxinic conditions in its bottom water.

2. Material and Methods

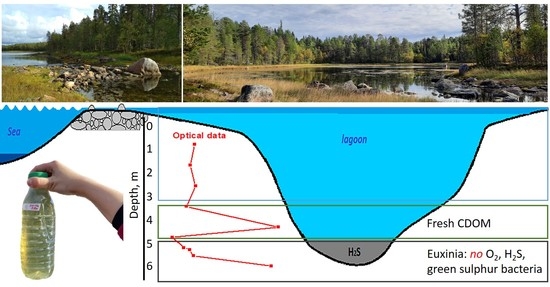
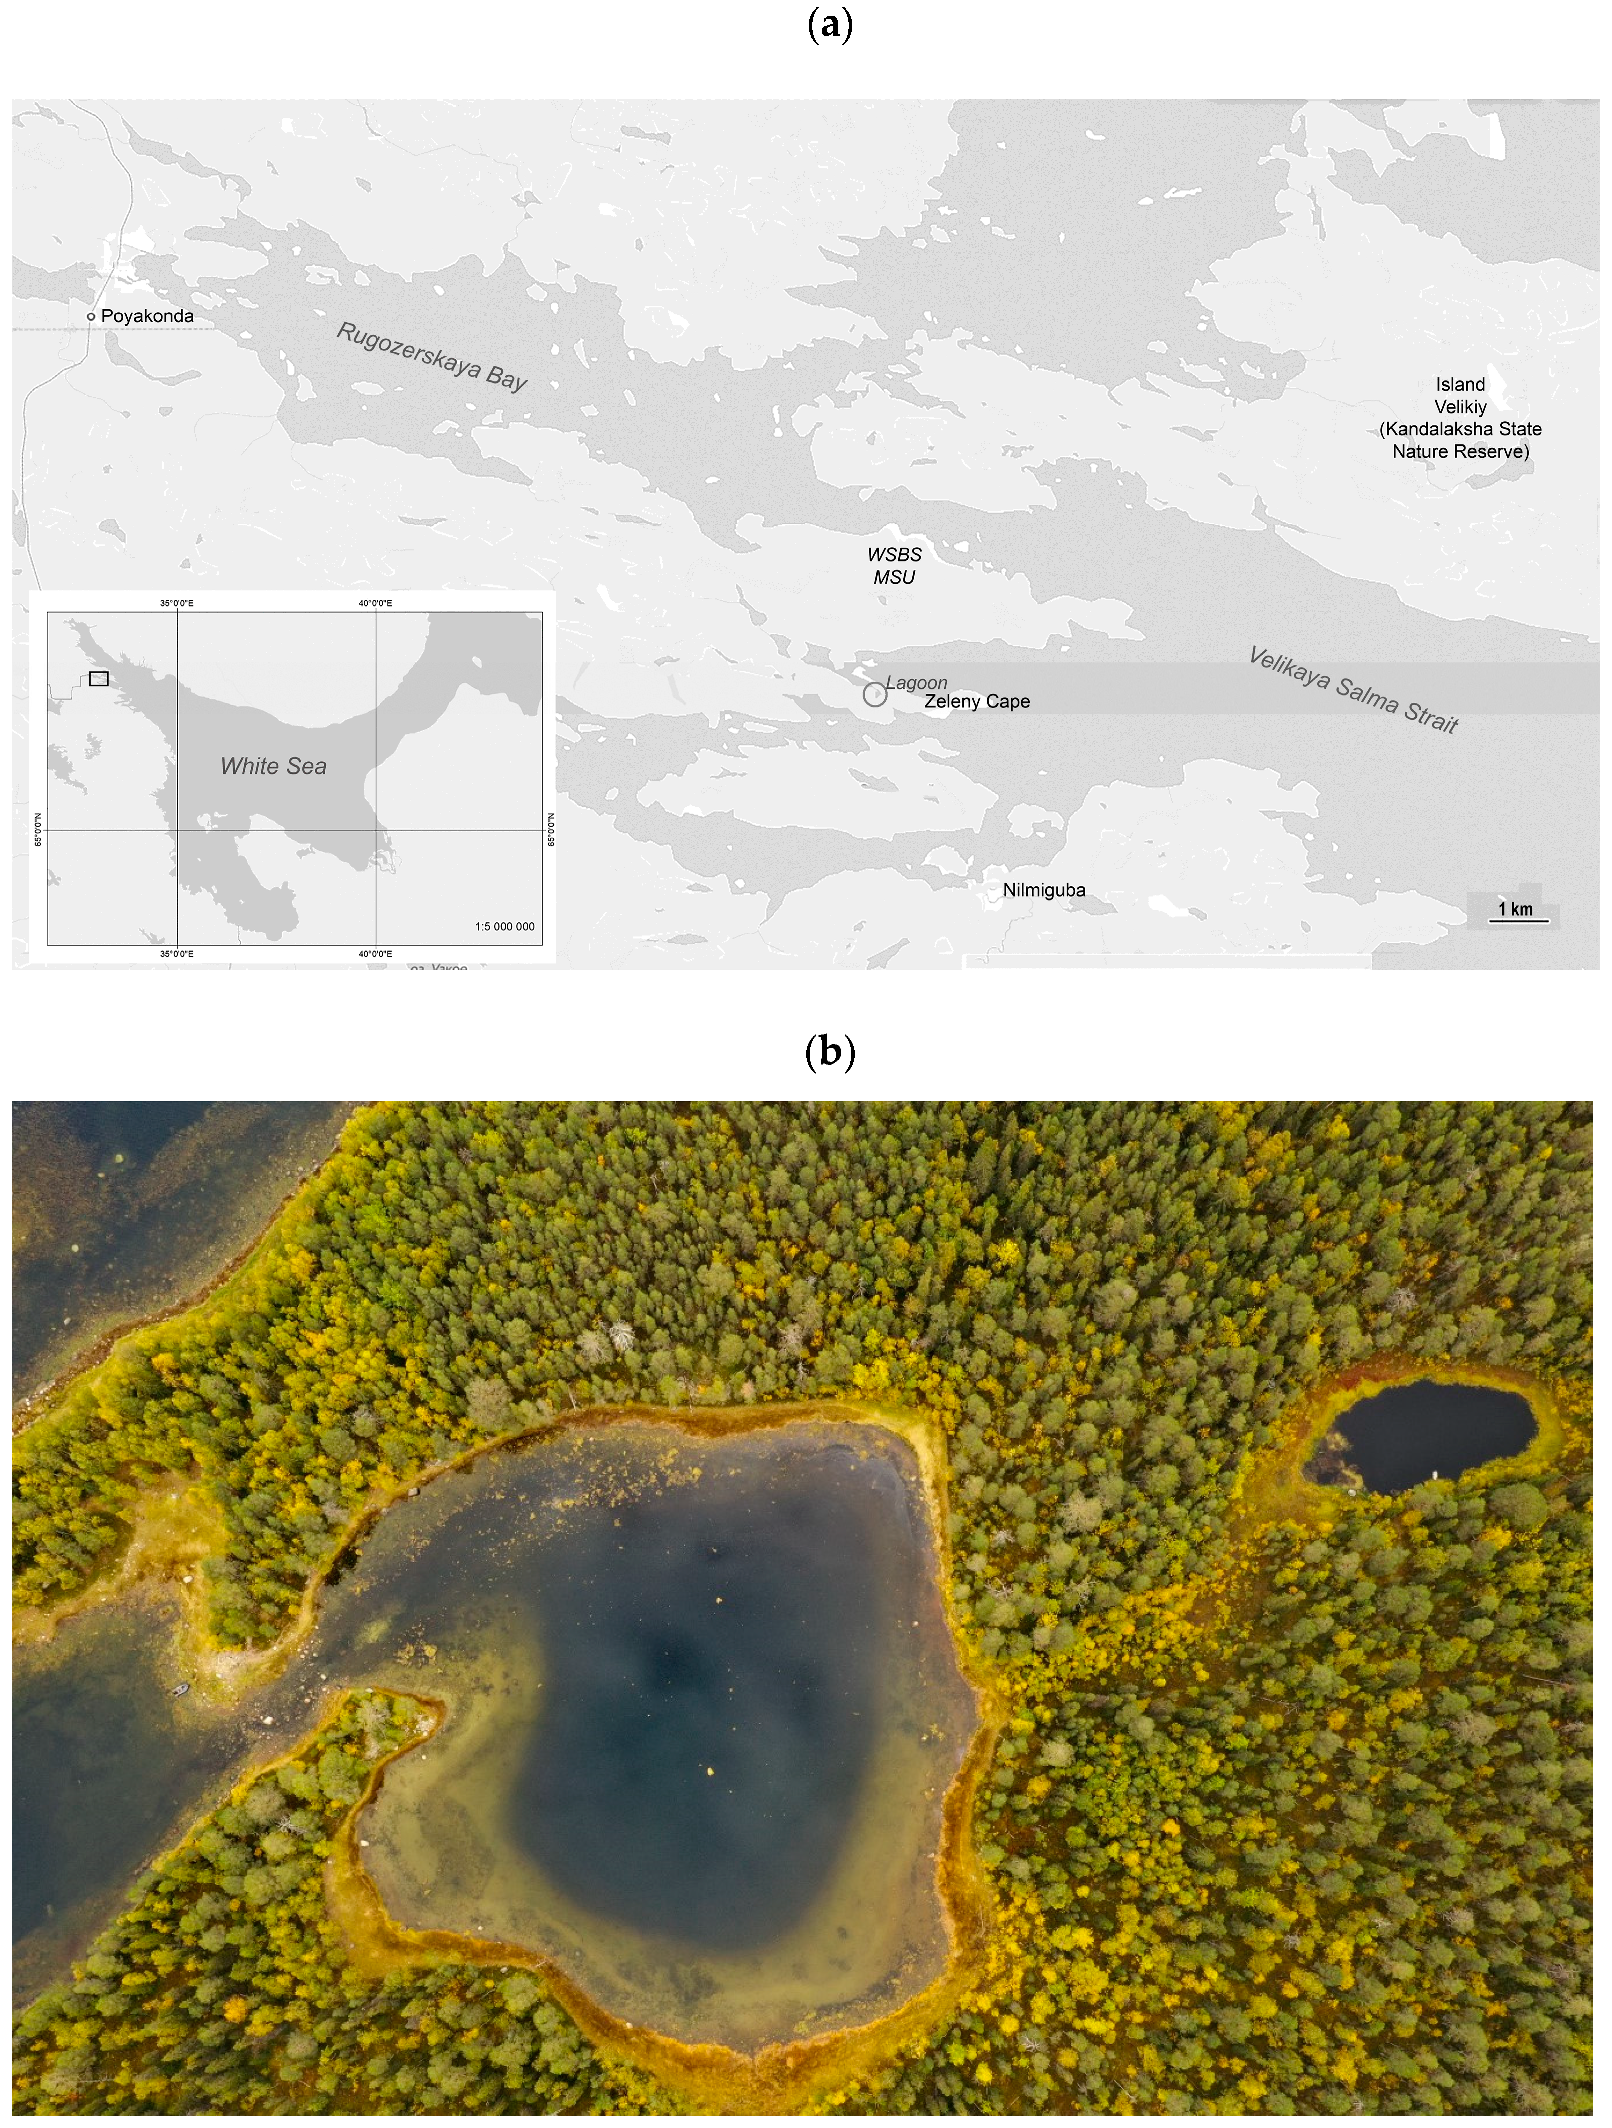
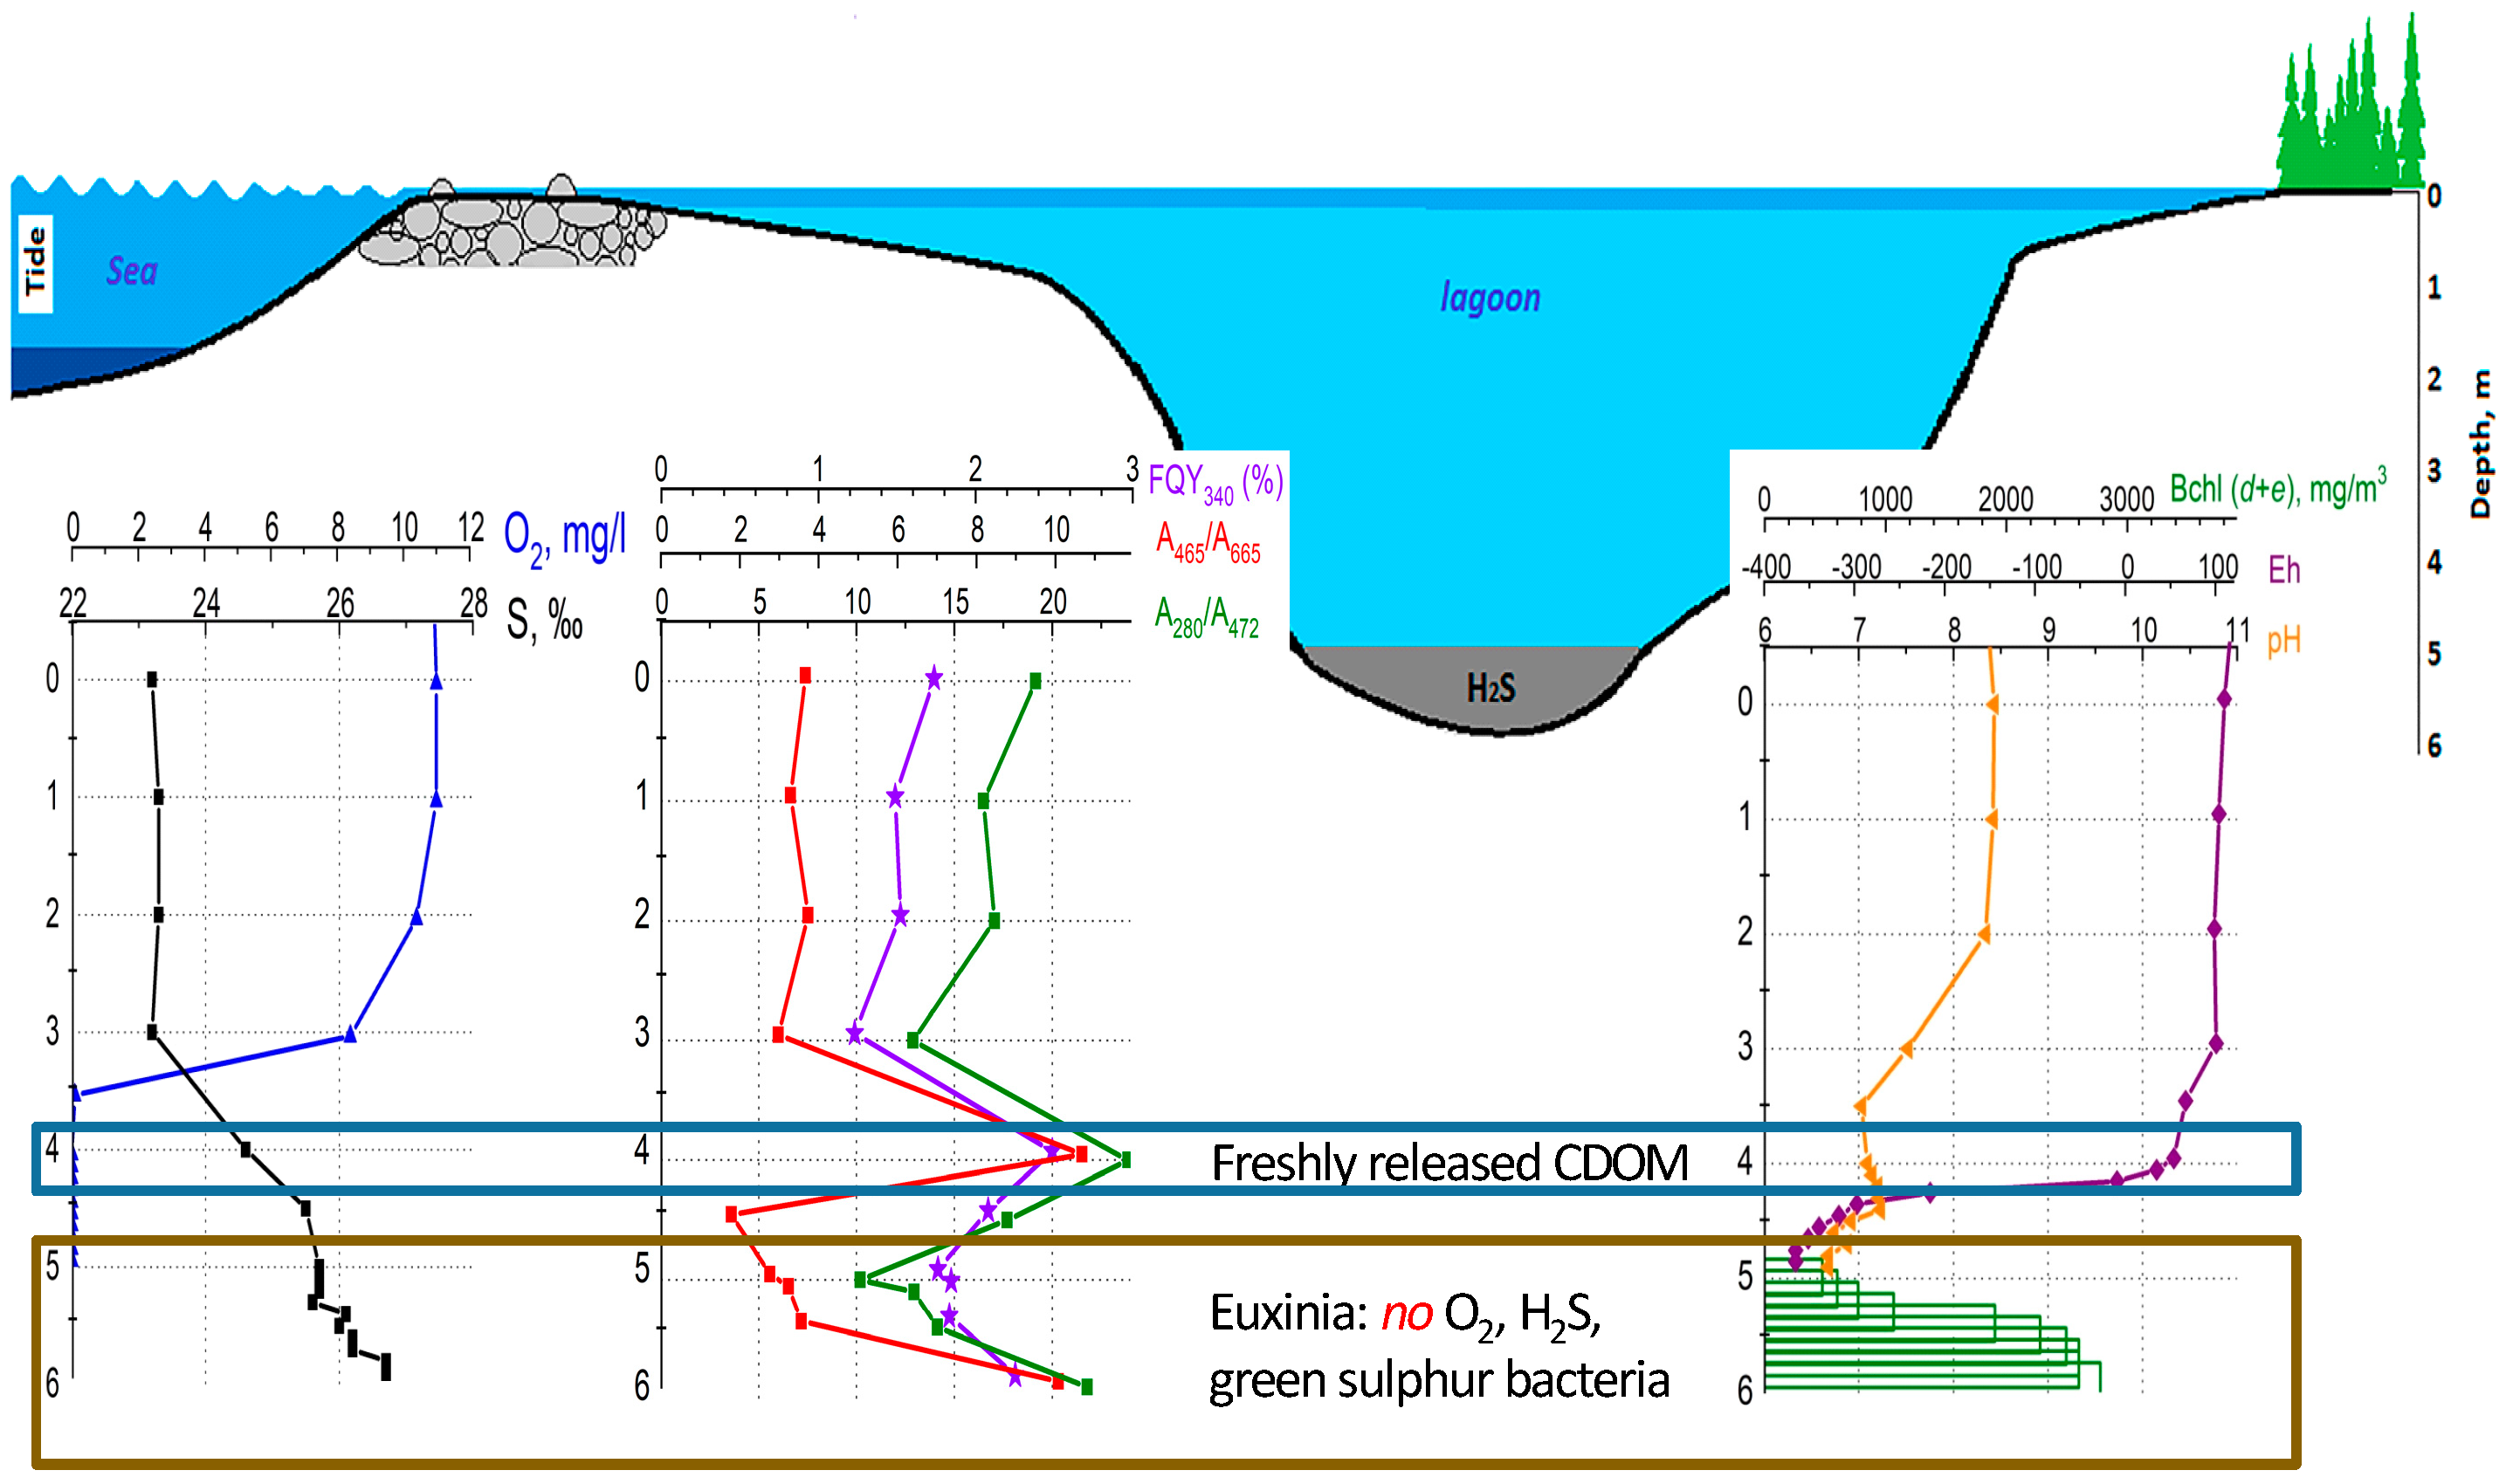
2.1. Lagoon on Zeleny Cape (Karelian Coast of the White Sea)

The lagoon on Zeleny Cape is situated in the Kandalaksha Bay, approximately 3 km away from the White Sea Biological Station (WSBS) of Lomonosov Moscow State University, at coordinates 66° 31′ 49″ N and 33° 05′ 55″ E (as shown in Figure 1). The lagoon has a total area of 17662 m2, an average diameter of 150 m, and a maximum depth of 6.5 m. The lagoon on Zeleny Cape is partially separated from the marine area by a shallow rocky sill. This sill opens completely during low tide and is submerged during high tide. The lagoon accumulates sediment from both the sea and the surrounding watershed, as well as organic substances of both autochthonous and allochthonous origin. These organic substances largely take the form of silt, which is reach in organic matter. The lagoon’s catchment area is quite small, only about 7 times the area of the water surface, and this fact determines the lagoon’s hydrological features. The volume of the surface runoff entering the lagoon is small and does not lead to a significant desalination of the upper layer. The difference in the water density necessary for stable water stratification (meromixis) is formed due to the accumulation of concentrated brine at the bottom during the freezing of sea water. In the near-bottom zone of the lagoon, there is a permanent sulfide zone (euxinia) with a boundary located at a depth of 4.0–5.5 m in different years. At this boundary, in the anaerobic part of the chemocline, a community of pigmented microorganisms develops during the ice-free period, including algae and anoxygenic phototrophic bacteria. Algal blooms are most often formed by red cryptophyte flagellates Rhodomonas sp. These algae are resistant to hydrogen sulfide and in some cases can descend into the hydrogen sulfide zone. Anoxygenic phototrophs can be mainly represented by green-colored and brown-colored green sulfur bacteria, as well as purple bacteria.

2.2. Water Sampling and Spectral Measurements

Natural water was sampled in September 2022 in the lagoon at Zeleny Cape at a location with a maximal depth of 6 m. It should be noted that beginning of September is the end of summer season at the White Sea, which is a period of the mature stratification with the most contrasting chemocline, with still warm weather and before the period of the autumn storms mixing water layers. Water samples were taken using a submersible pump from various horizons, 0, 1, 2, 3, 4, and 4.5 m, and starting from 5 m down to 5.9 m with a 0.1 m step. At that moment, the chemocline occupied a layer between 4.5 and 5.5 m. The water salinity S and redox potential Eh was measured using a YSI Pro conductometer. Before CDOM spectral measurements were taken, water was filtered with nylon filters with a pore size of 0.22 μm to separate suspended particles.
Absorption spectra were measured using a Solar PB2201 spectrophotometer. This was conducted for unfiltered water in cuvettes with an optical path length of 3 cm in order to register the absorption bands of bacteriochlorophyll and determine its concentration for filtered water in cuvettes with an optical path length of 1 or 3 cm for the analysis of CDOM. Long cuvettes provide more accurate measurements for the CDOM content at longer wavelengths. The absorbance values measured in different cuvettes were subsequently reduced to the absorbances at 1 cm.
The CDOM fluorescence emission spectra were recorded using a Solar CM2203 luminescence spectrometer under excitation with a wavelength λex varying from 250 to 500 nm with a step 10 nm. The emission spectra were recorded in the range from 270 to 515 nm (depending on the excitation wavelength) to 700 nm with a step of 1 nm. The spectral slits of both excitation and emission monochromator were set as 5 nm. Fluorescence spectra were measured using quartz cuvettes with an optical path length of 1 cm. The measured fluorescence spectra were corrected for the effect of the internal filter as:
I = I 0 10 ( D e x + D e m ) / 2
where Dex and Dem are the absorbances at the excitation and emission wavelengths [40]. The calculation of the fluorescence quantum yield Φ was carried out using the method of a reference compound using the quinine sulfate solution, which was previously used for the samples of natural water and commercial humic preparations [40].
The fluorescence of chlorophyll (Chl) a was measured using a Water-PAM (Walz, Effelrich, Germany) device. Fluorescence F0 allows an evaluation of the abundance of phytoplankton to take place as it is proportional to the content of Chl a in water [41]. The photosynthetic activity of phytoplankton was determined based on a parameter of the maximum quantum yield of the primary photochemical reaction in the Photosystem II as Fv/Fm = (FmF0)/Fm. Before measuring, water samples with phytoplankton were adapted in the dark for 15 min. Measurements of Chl a fluorescence were corrected for the presence of CDOM. Correction for the fluorescence of CDOM was conducted by subtracting the CDOM fluorescence values of the water filtered through a 0.2 μm pore size filter. The fluorometer was calibrated into Chl a concentration units using marine cultures of various densities.
The concentration of Bchl (d+e), the main photosynthetic pigments of green sulfur bacteria, both green-colored and brown-colored, was determined from the absorption spectra of unfiltered water according to [42,43]. The area of the long-wavelength absorption band of BChl in the spectral range of 650–800 nm was calculated from the spectra, and then the Bchl concentration was calculated using the formula with an empirically determined coefficient. Calibration of the fluorometer in units of the chlorophyll a (Chl a) concentration was carried out using marine cultures with different densities: the diatom Thalassiosira weissflogii (Grunow) for surface horizons and the cryptophyte alga Rhinomonas reticulata (I.A.N. Lucas) G. Novarino for phytoplankton from the 3 m layer and deeper.

3. Results

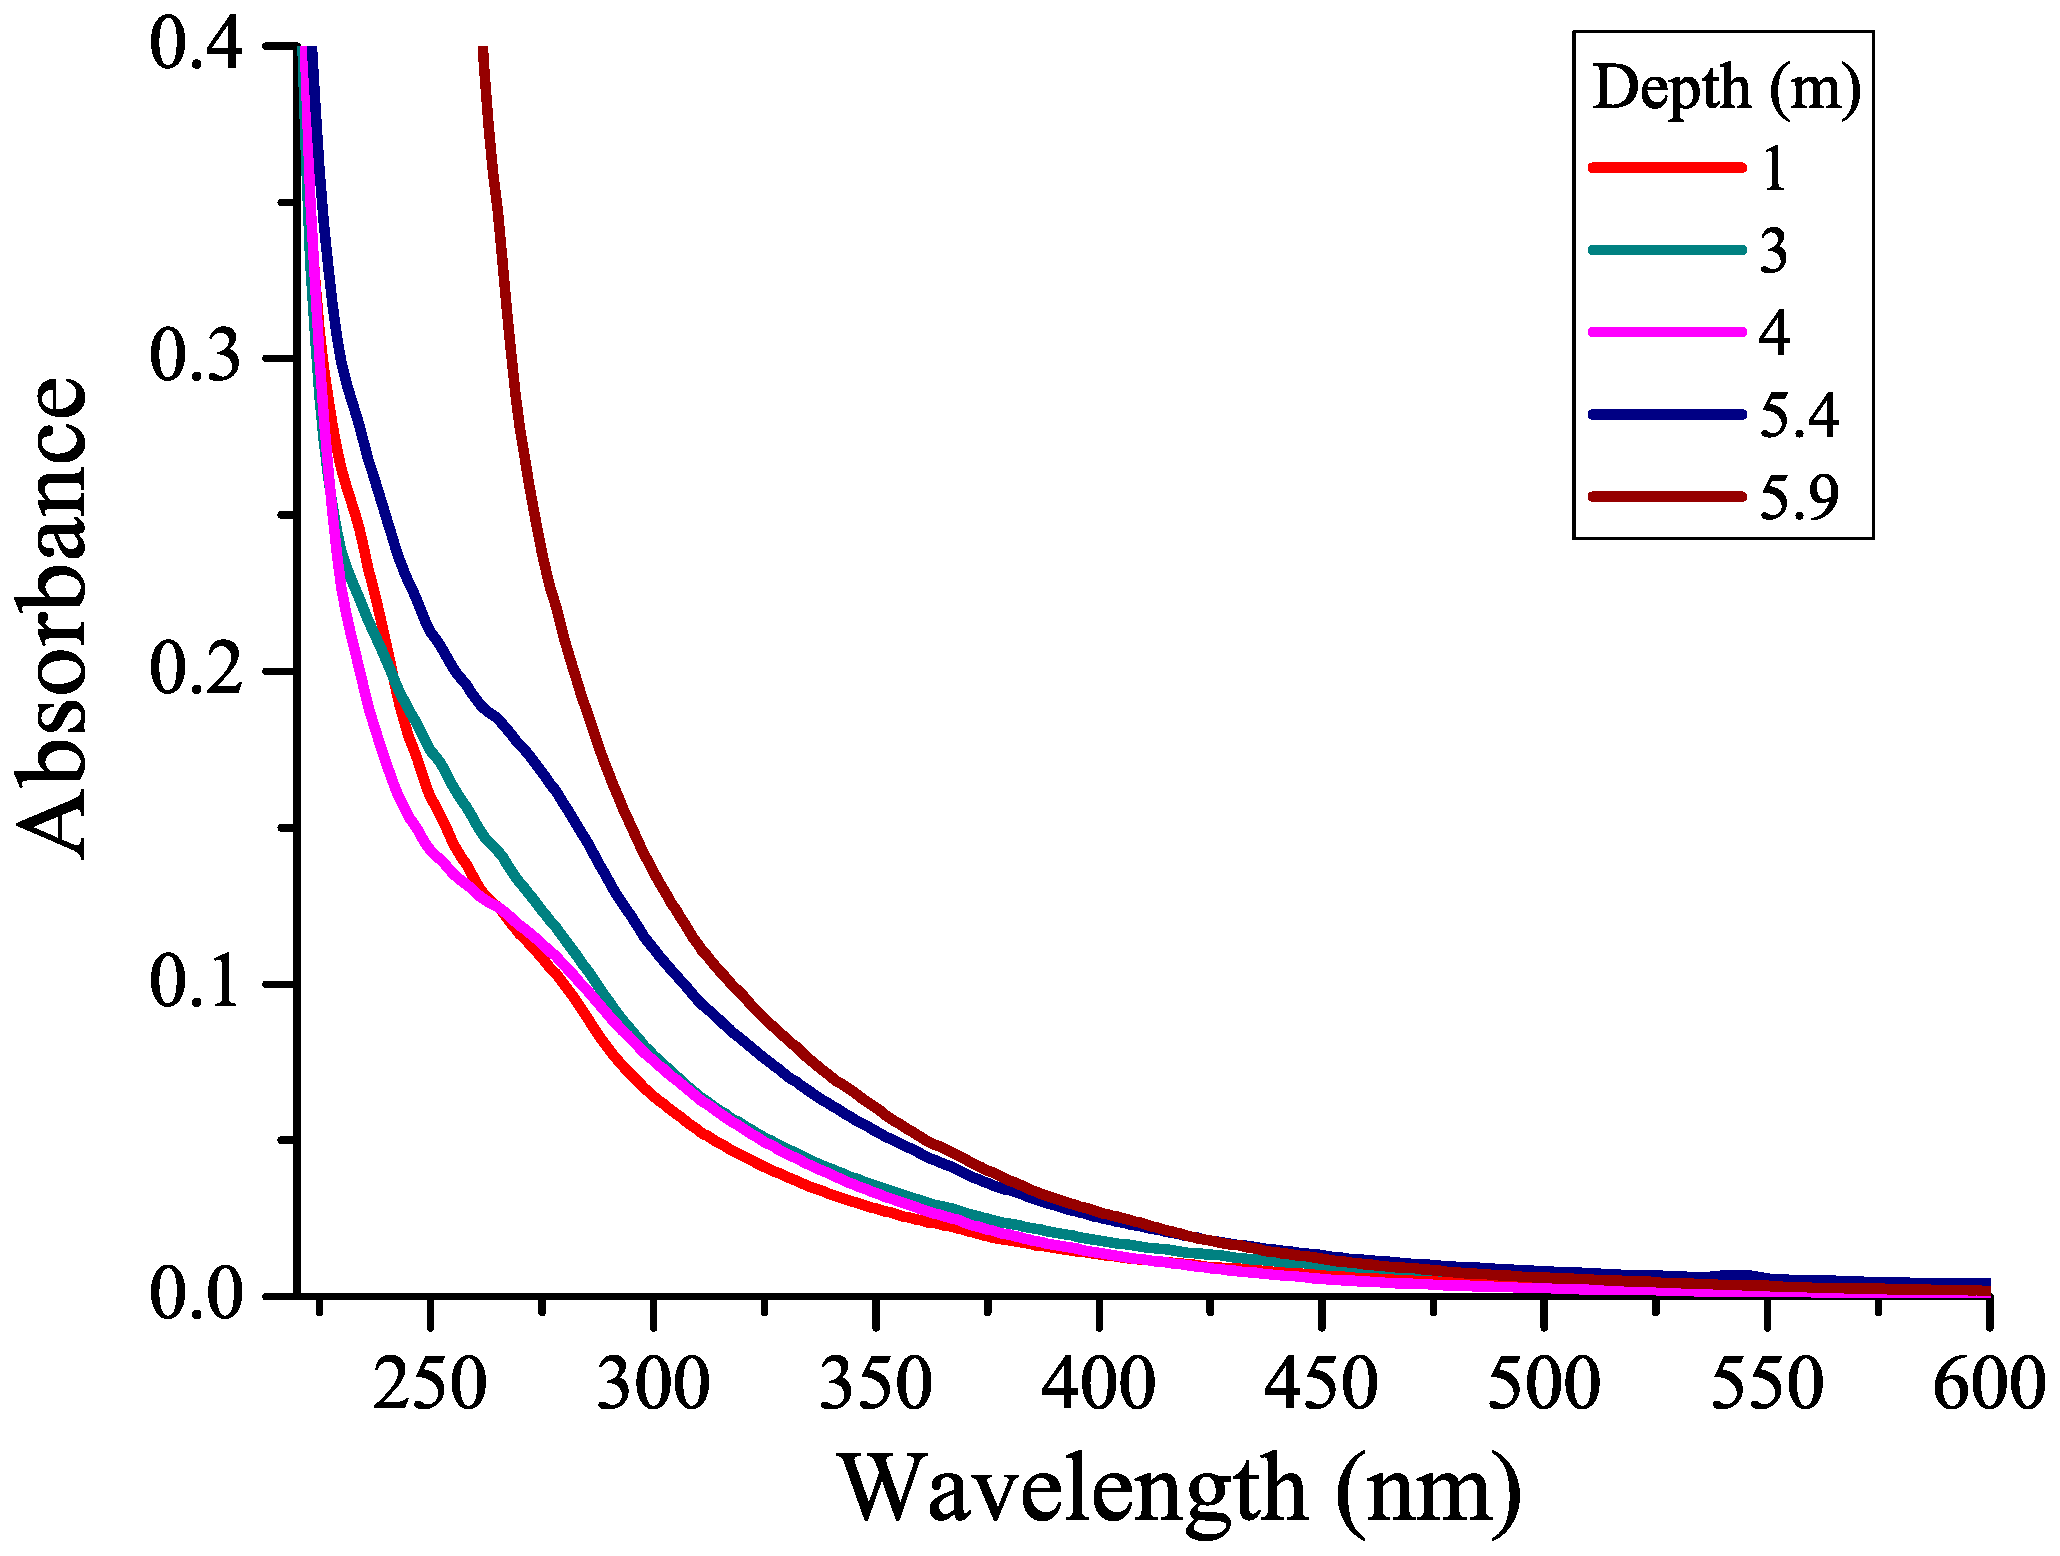
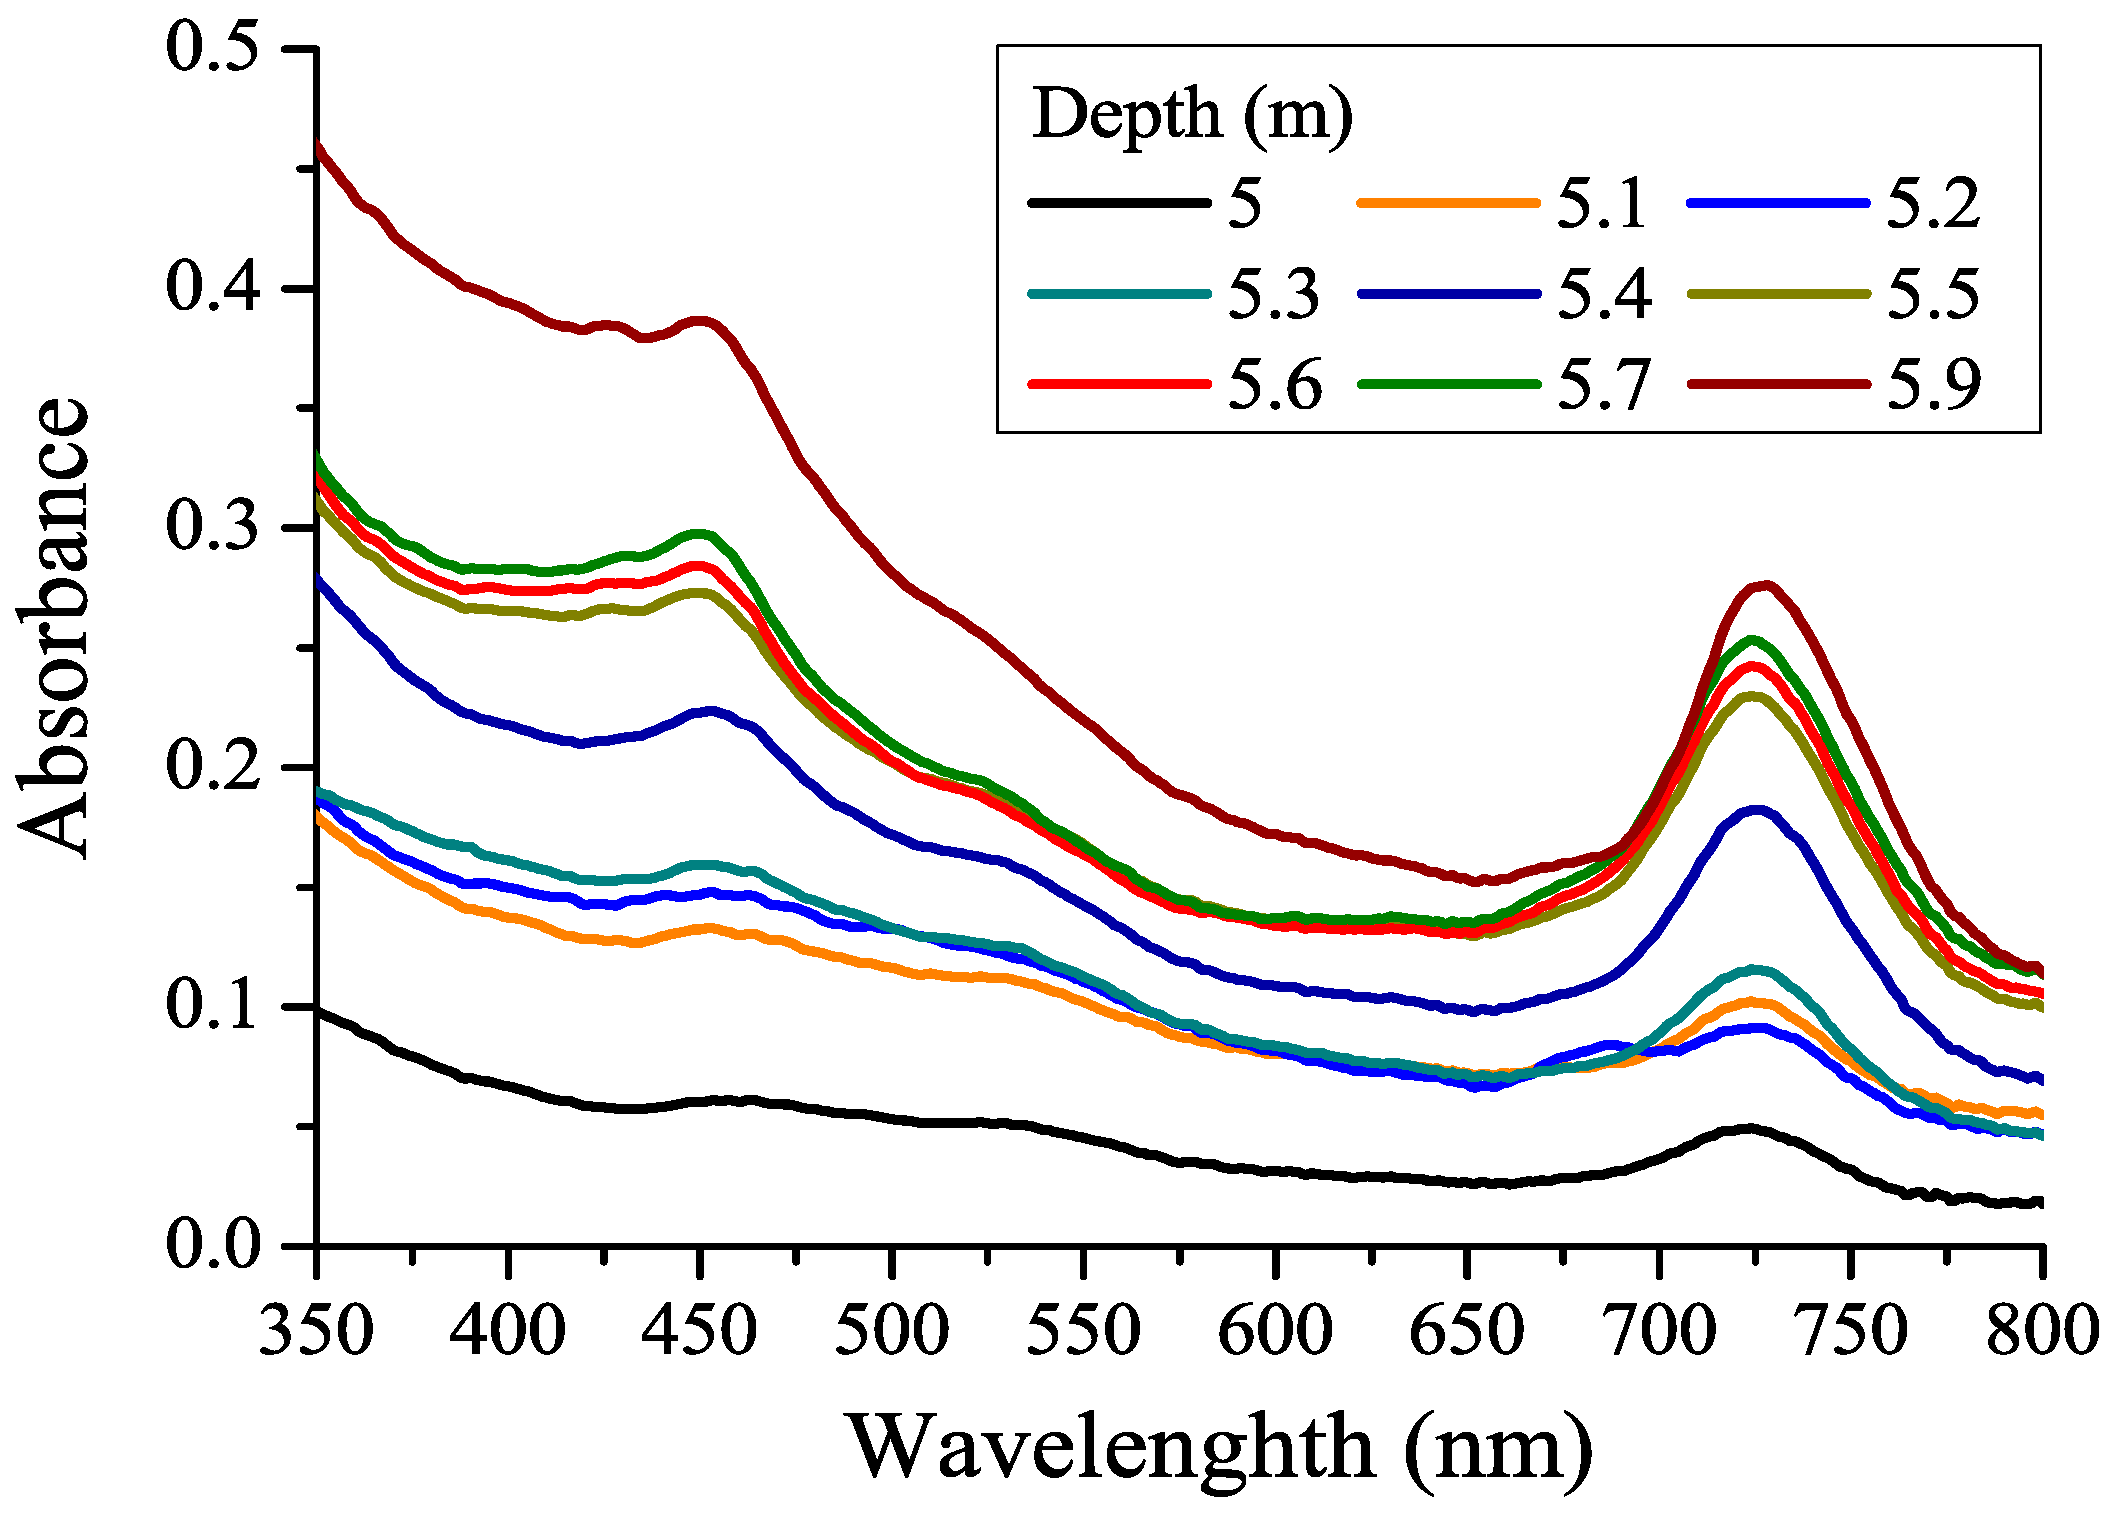
3.1. CDOM Absorption Spectra

The CDOM absorption spectra are shown in Figure 2 for several horizons. Some water samples in the figure have been omitted to better distinguish spectral curves. In all the samples studied, the CDOM absorbances decreased monotonically with increasing wavelength without any apparent absorption peaks, which is typical of naturally occurring CDOM in water [26,40]. A shoulder was observed at a wavelength of about 270 nm due to the absorption of phenolic or indole groups [44,45]. That shoulder was more pronounced at a depth of 4 m and between 5.4 and 5.8 m due to CDOM formed by microorganisms found at those water layers. In the water from the 5.9 m horizon, the absorption spectrum differed significantly from the others, suggesting higher absorbances due to the accumulation of CDOM in the bottom water.
Absorbance in the UV range reflects the concentration of CDOM: the higher the concentration of humic substances in water, the greater is absorbance. Most often, an absorbance (A350) or absorption coefficient at a wavelength of 350 nm is used to quantify CDOM [46].

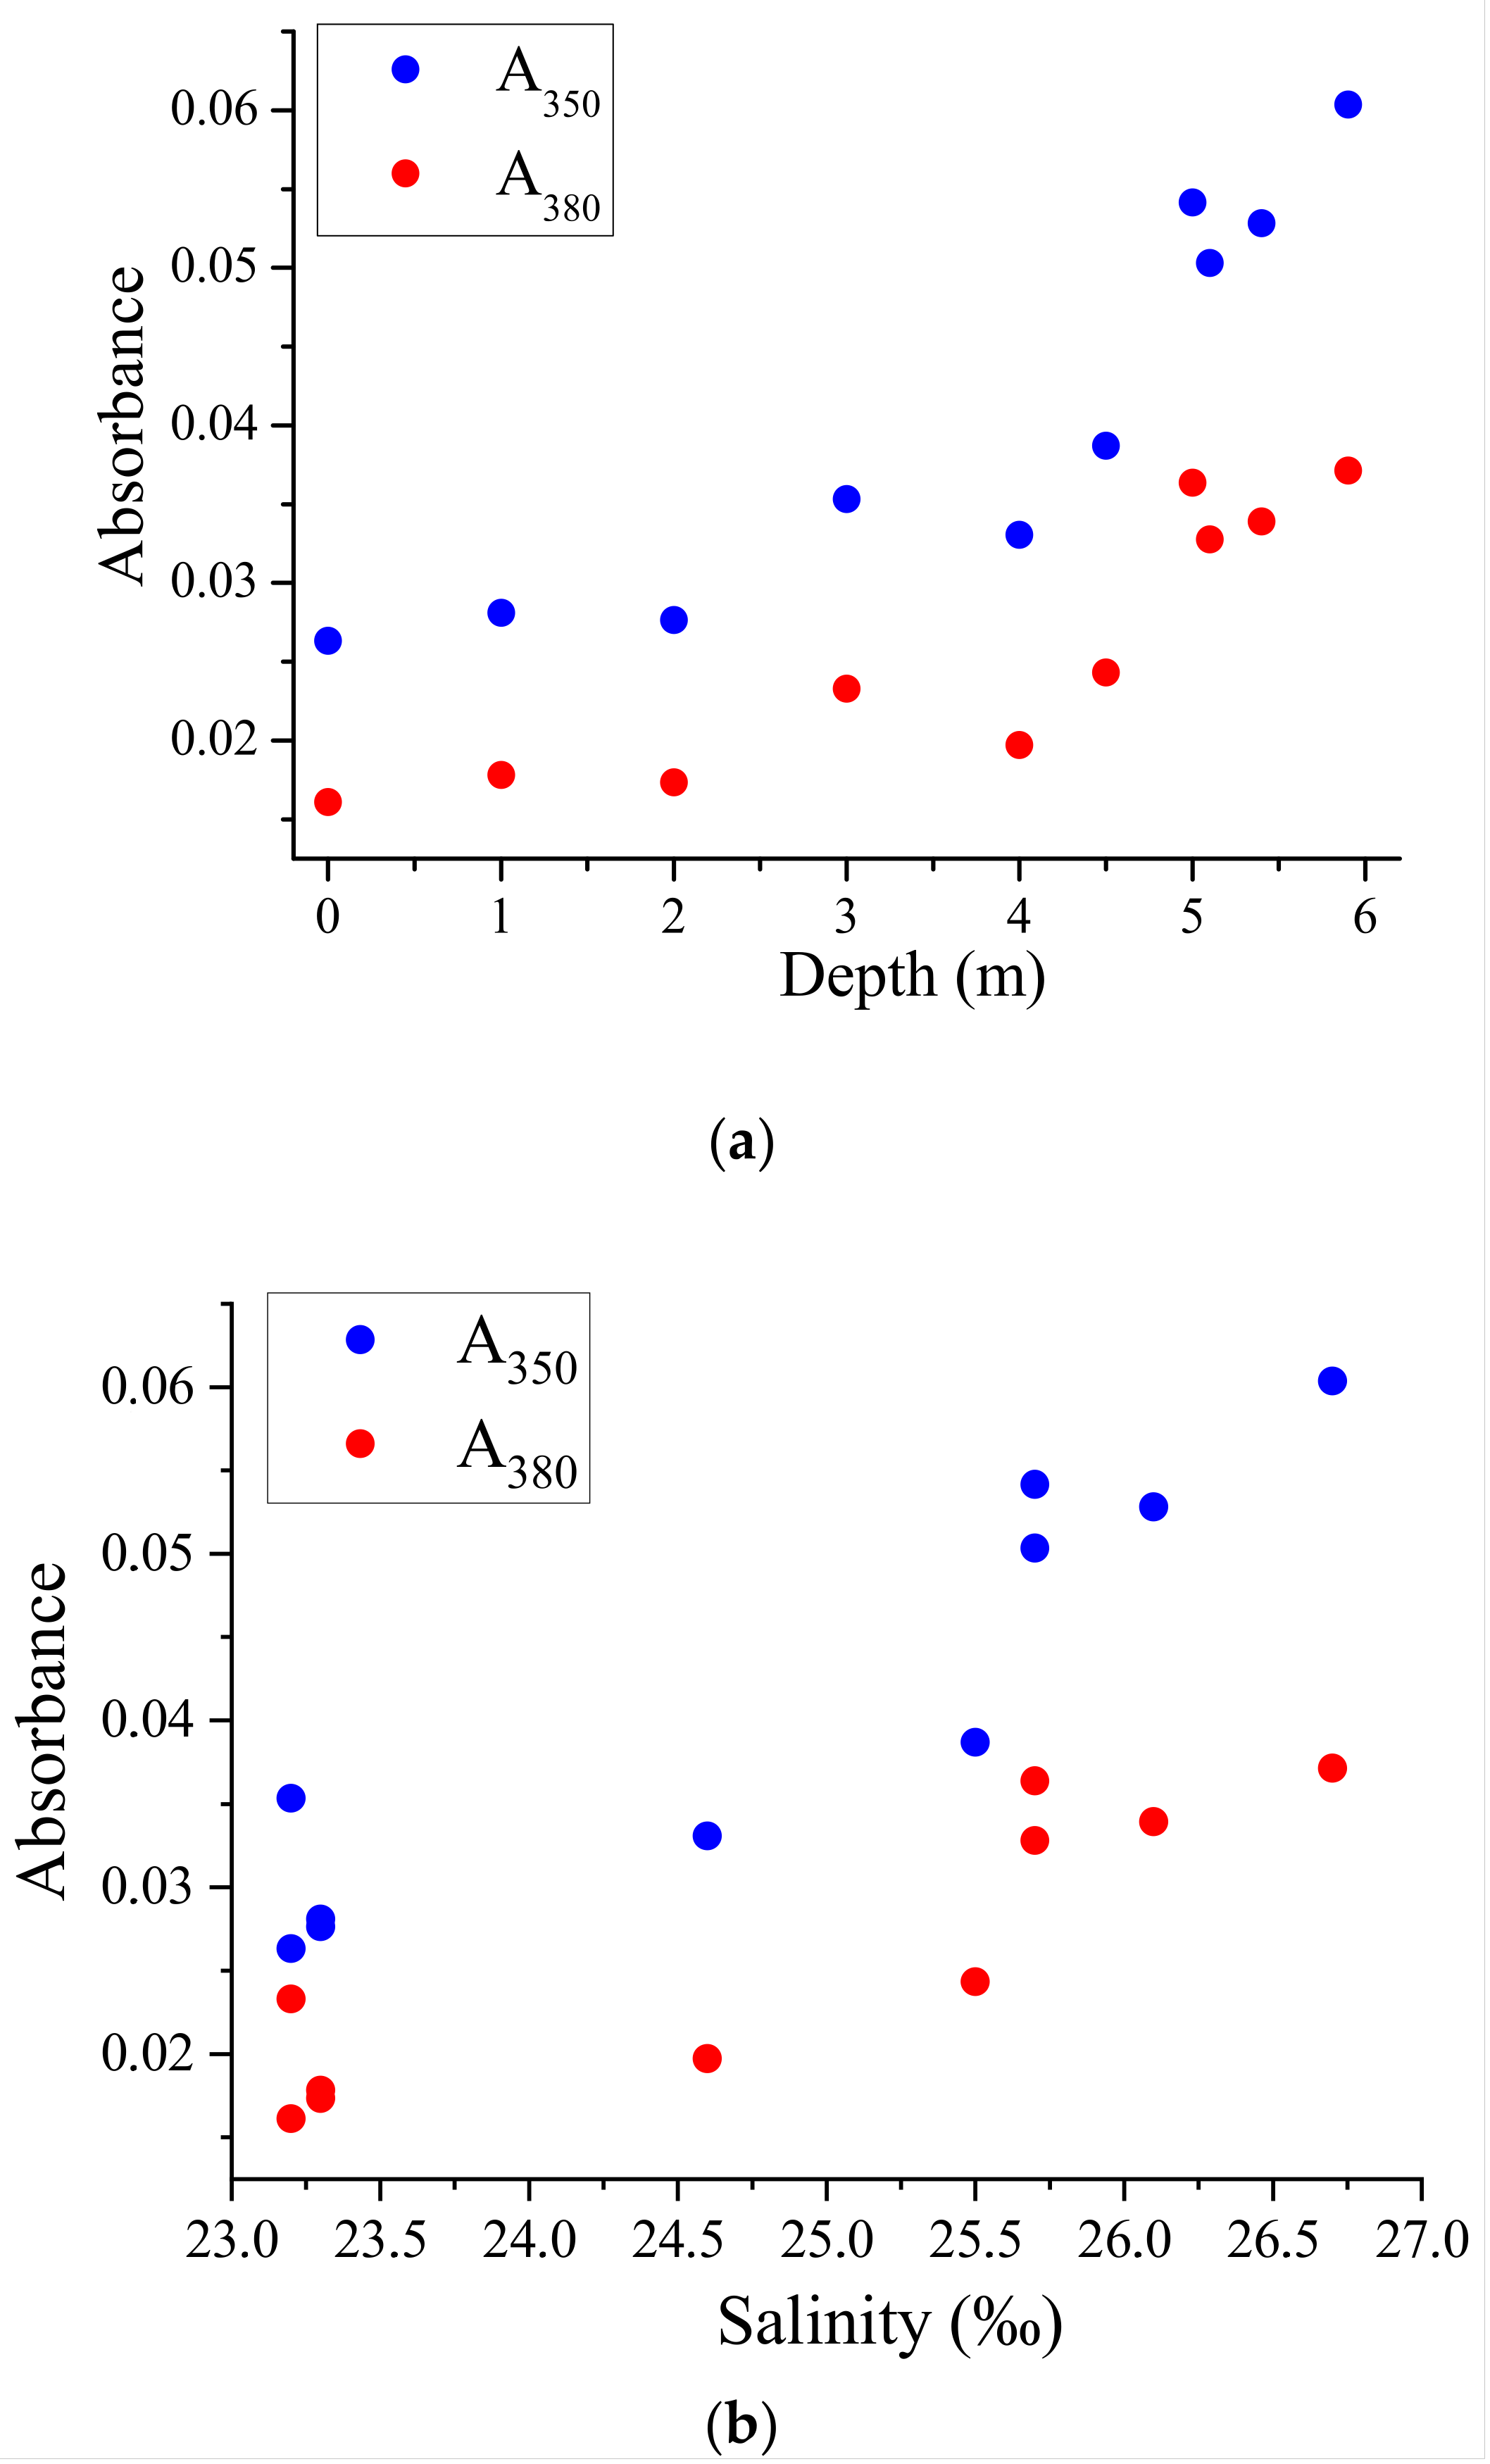
3.2. Correlation between CDOM Absorbances and Water Salinity

In meromictic water bodies isolated from the White Sea, autochthonous organic matter partly settles and is buried in the anaerobic zone, while the other part accumulates in surface waters [47]. The main source of humic substances is the soil of the catchment area [30,47,48]. Humic substances are washed out from the soil by fresh runoff, and when fresh water enters the reservoir and lingers in it, the color of its water becomes darker. It is known that in the Arctic region, low-salinity waters in mixing zones affected by river runoff usually have the maximum DOM content [46,49]. Freshwater streams, mainly of swamp origin, have a higher concentration of humic substances compared to marine water and large optical indices. Therefore, one could expect intermediate CDOM concentrations and averaged absorbances in semi-isolated reservoirs. In oceanology, a strong anticorrelation between water salinity and CDOM absorbance in the UV range was recorded for sea water mixed with fresh river runoff (in river estuaries) [50], which is also known in the White Sea [46,51]. One could expect a similar inverse relationship between the content of humic substances in the mixolimnion and the salinity of the water in it.
If we take filtered samples from the mixolimnion zone of different meromictic water bodies along the Karelian coast of the White Sea, we observe an inverse relationship between CDOM absorbances (A350 and A380) and water salinity (see Figure S1 in Supplementary Materials). The results obtained for various meromictic lakes confirm the hypothesis that the content of humic substances in the mixolimnion is related to water salinity due to the conservative mixing of fresh water with a high concentration of humic substances from terrestrial sources and salty sea water with a low CDOM concentration.
However, in the case of the water column in the lagoon on Zeleny Cape, we received different results. The absorbance values (A350 at 350 nm or A380 at 380 nm) increased with depth and salinity (Figure 3a,b). Water salinity was expressed per mille (‰).
This observation does not correspond to the mixing of water with different concentrations of DOM. Instead, the increasing dependence of A350 or A380 on salinity is a sign of meromixis (impaired water circulation). The surface water in the lagoon on Zeleny Cape is less saline, and the salinity increases by about 2‰ at depth. Simultaneously, the concentration of CDOM in water increases. This suggests that the CDOM in the lagoon on Zeleny Cape is not solely derived from terrestrial sources but also from within the water body itself. The lack of mixing and circulation in the meromictic water column results in the accumulation of CDOM and other dissolved substances, leading to an increase in absorbance values with depth and salinity. These findings highlight the importance of considering the unique characteristics of each water body when studying CDOM dynamics and its relationship with salinity.

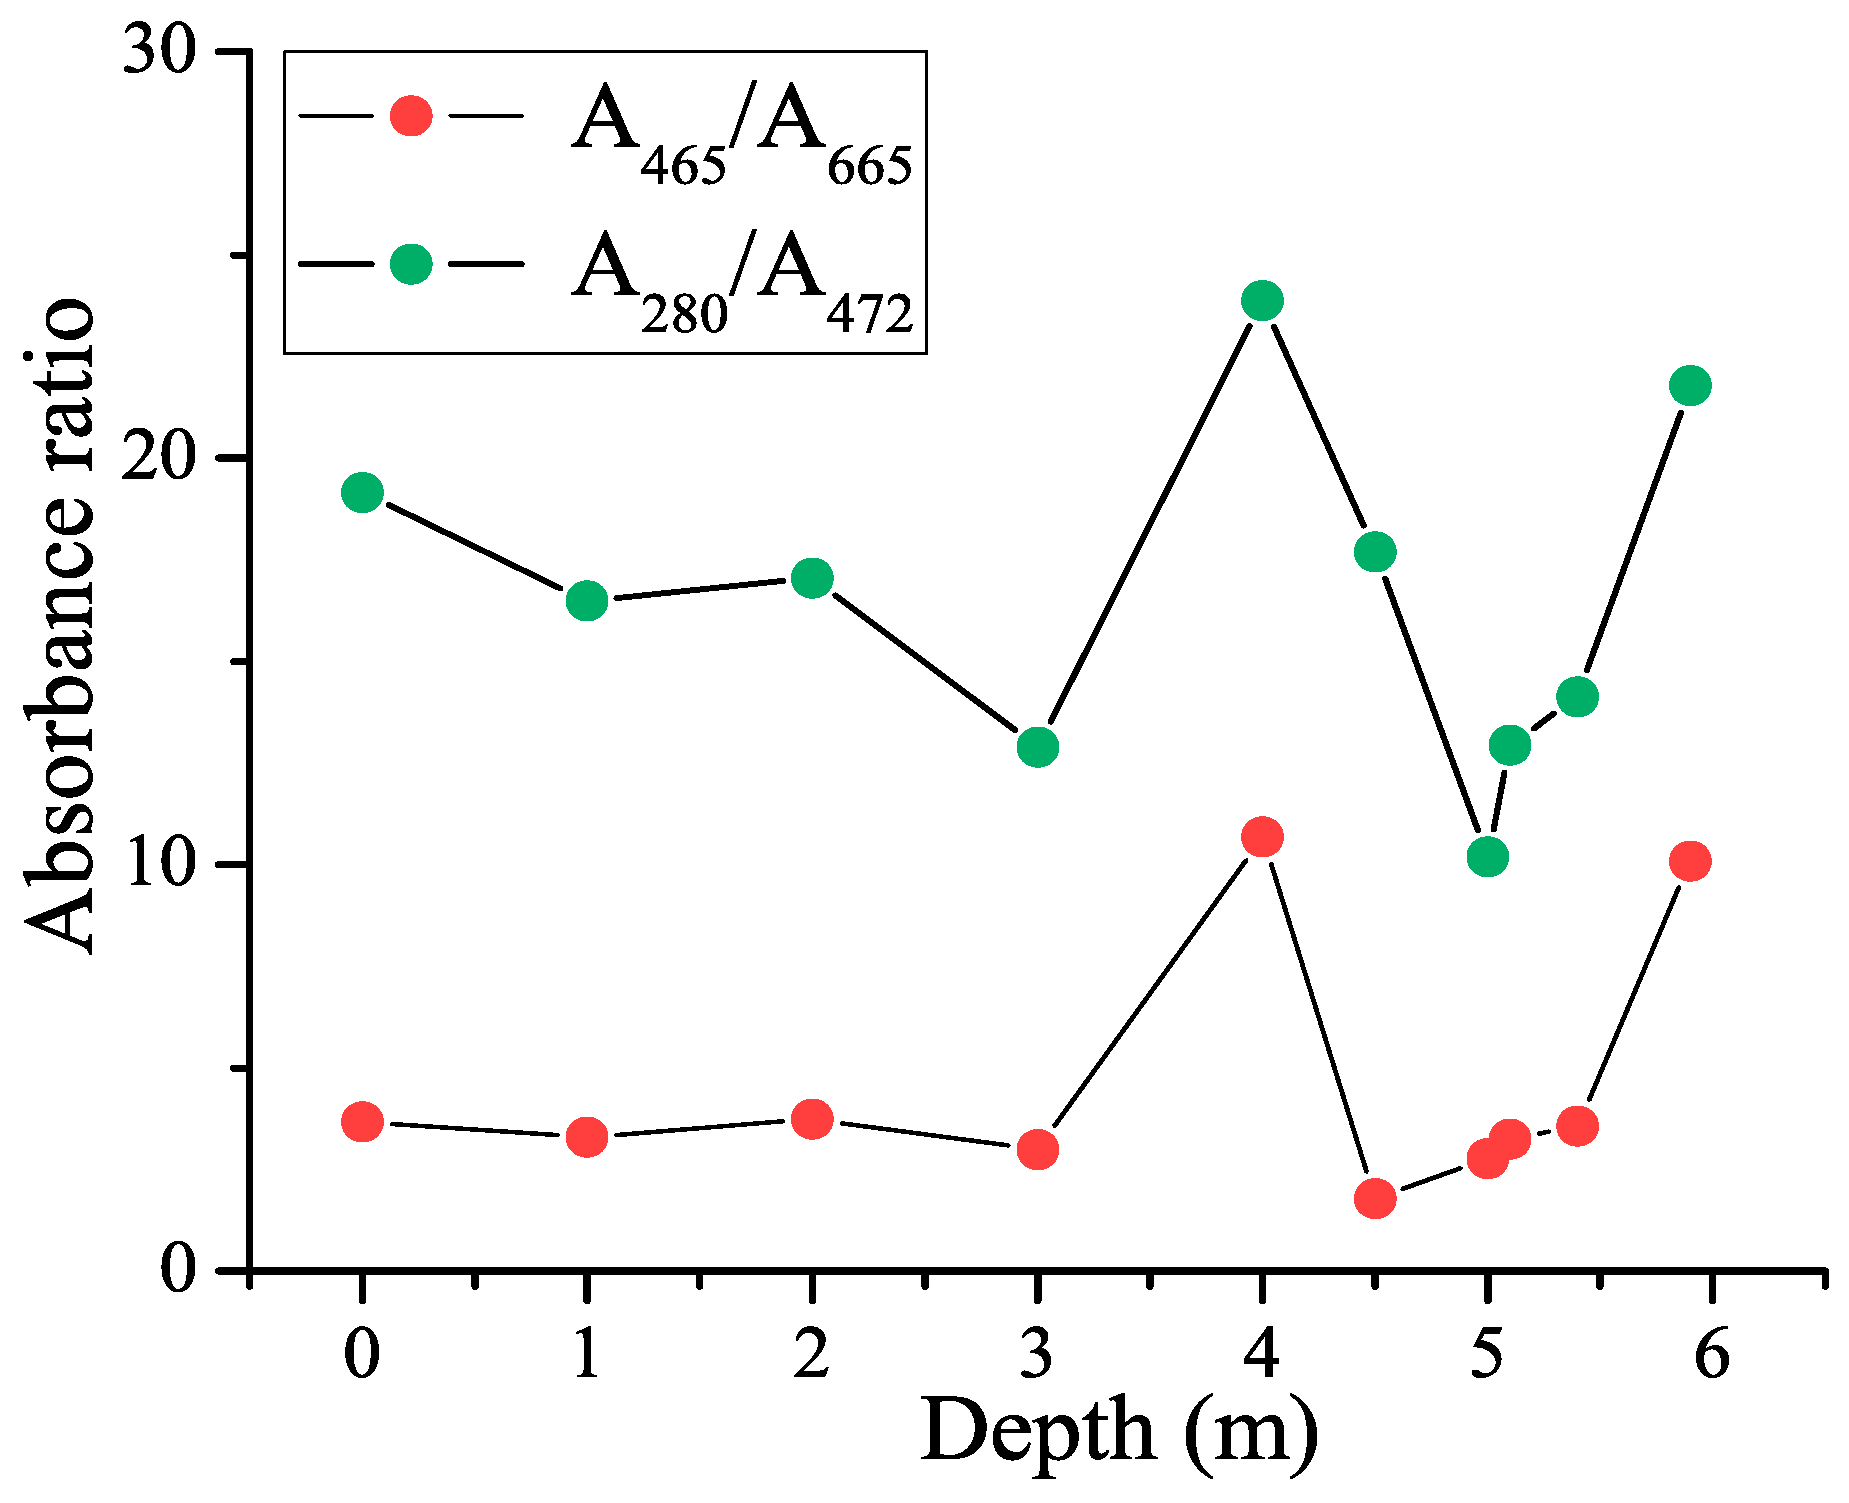
3.3. CDOM Absorbance Ratios

The CDOM absorption spectra depend not only on its concentration but also on the type of CDOM present in natural water [45,46,52] or the degradation of humic substances [16,17]. The absorption spectra of CDOM may differ in the shape of the spectral curve. Therefore, to characterize CDOM, absorbance ratios at different wavelengths or the slope of the absorption spectral curve in a certain spectral range may be used [26,44].
In addition to absorbances at individual wavelengths, the ratios of absorbances taken at selected wavelengths were calculated. The depth dependencies obtained for the A280/A472 and A465/A665 ratios are shown in Figure 4.
For the ratios shown in the figure, there is a local maximum at the 4 m horizon. These ratios characterize the relative concentrations of CDOM molecules with different molecular weights, namely, A280/A472 reflects the proportion between the lignins and other materials at the beginning of humification [53,54], and the A465/A665 ratio is used as a humification index since it is related to the age and the degree of aromatic carbon condensation in humic material [55,56]. Because we see a singularity of this curve at a depth of 4 m, we can conclude that there is an anomaly in the spectral properties of the aromatic component of CDOM, freshly released CDOM. One can see that this corroborates the appearance of a shoulder at 270 nm caused by the aromatic compounds of a phenolic nature (Figure 2). Later, we will compare this observation with the results of the analysis of the depth dependence of the CDOM fluorescence quantum yield. It should be noted that the depth in the location of sampling was 6 m, so the layer of sampling 5.9 m was just 10 cm above the bottom, and the water contained a concentrated amount of CDOM released from the residues of microorganisms sinking to the bottom. The high absorbance ratio at a depth of 5.9 m is probably due to this.

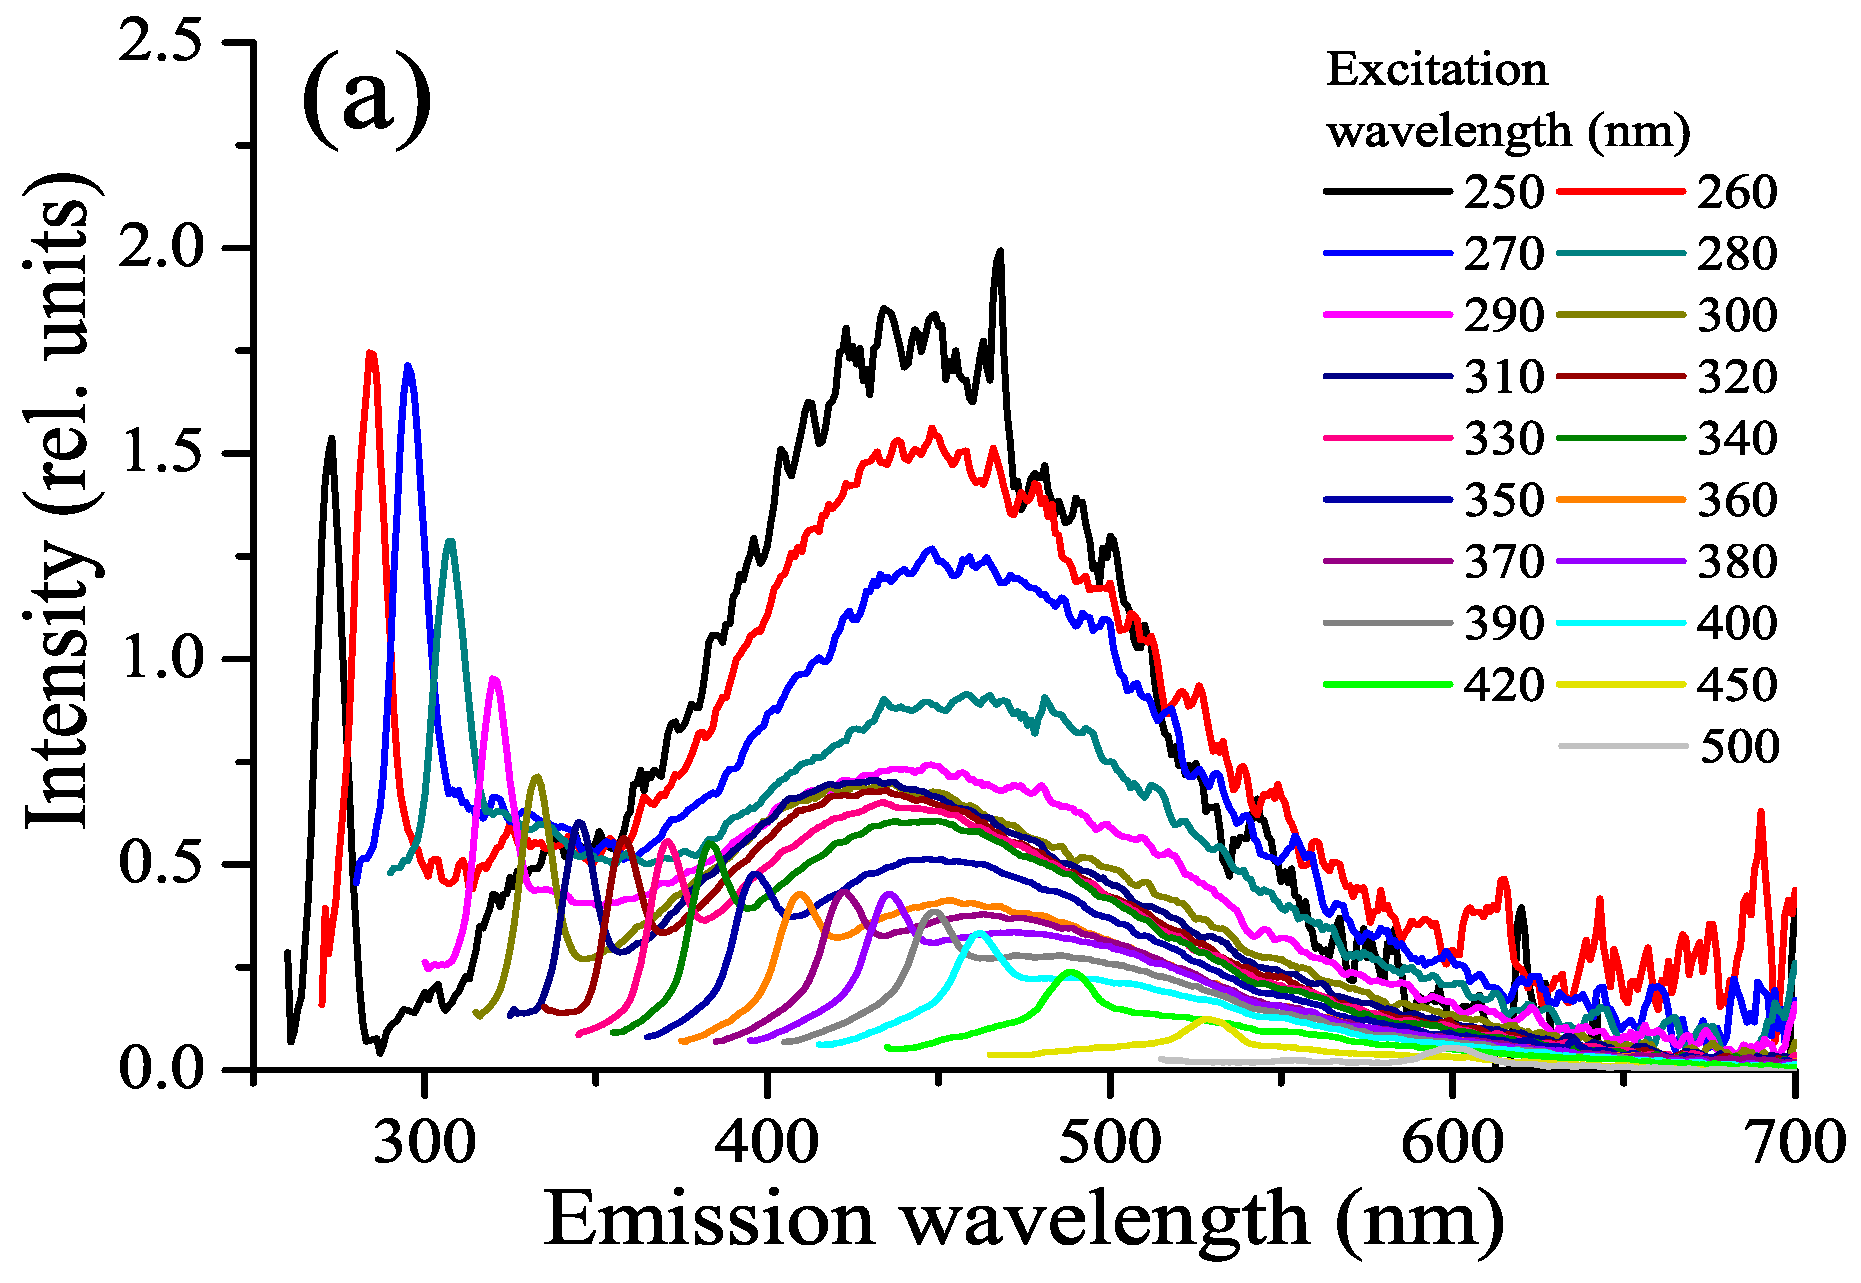
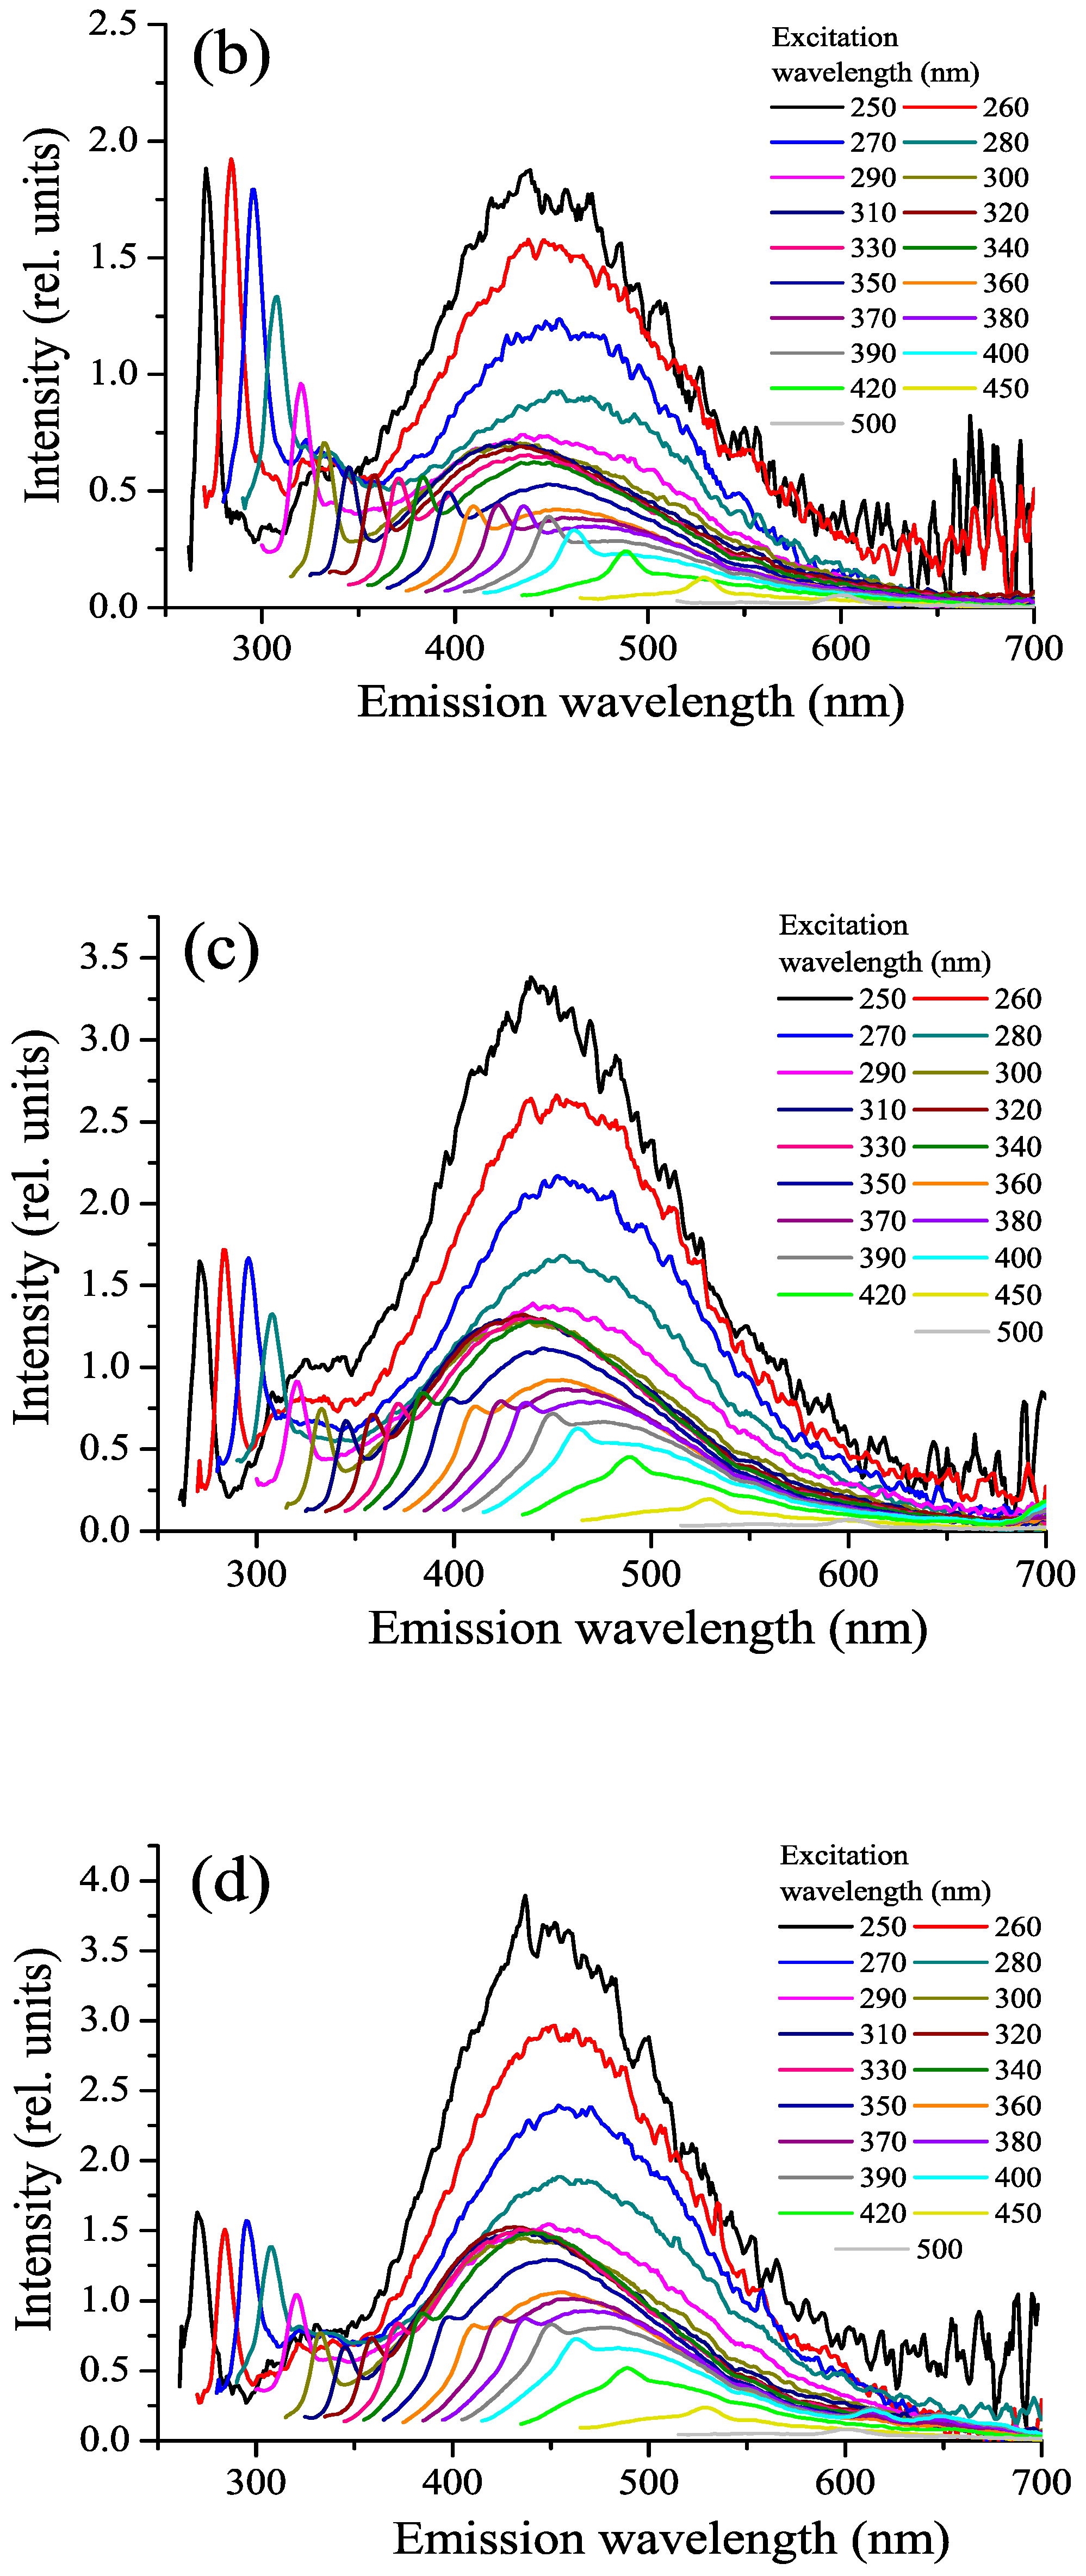
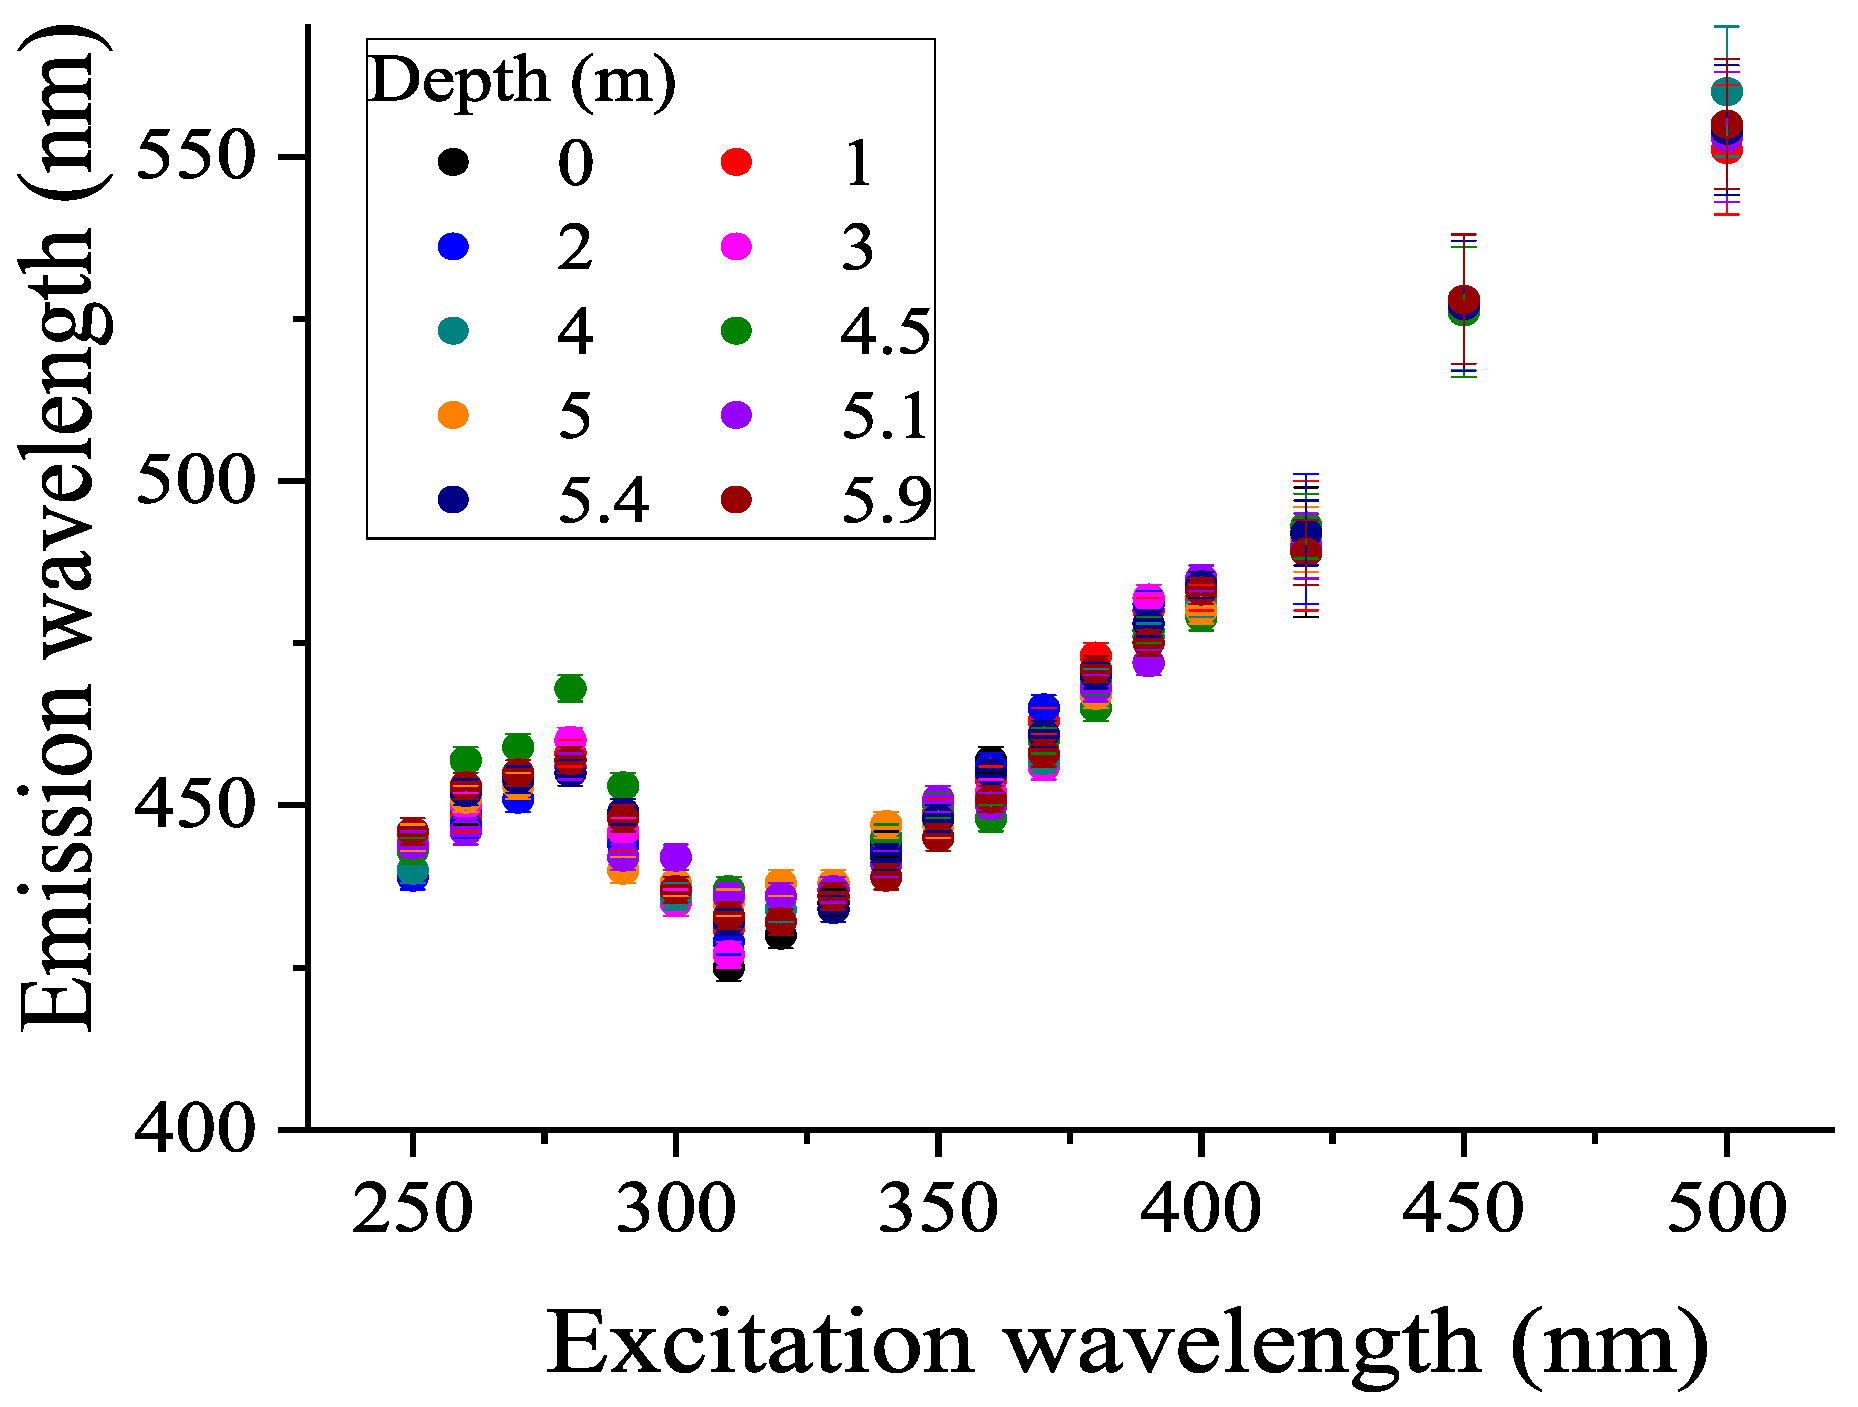
3.4. FDOM, Fluorophoric Fraction of CDOM

Excited in the UV or visible spectral range, CDOM demonstrates fluorescence emission due to the fluorophoric part of CDOM (FDOM). Figure 5 shows CDOM fluorescence spectra measured with various excitation wavelengths for CDOM from different horizons of the lagoon on Zeleny Cape.
The fluorescence emission spectrum of CDOM under UV excitation consists of two overlapping bands: a minor band, so called protein-like fluorescence [52,57], with an emission maximum in the range of 300–350 nm, due to the fluorescence of aromatic amino acids and phenolic compounds, and a more intense fluorescence of humic substances in the blue region [40,58,59]. In the fluorescence spectra of unfiltered water, UV fluorescence of microorganism cells can appear. The maximum fluorescence of humic substances depends on the excitation wavelength; as it increases from 270 to 310 nm, the maximum of the emission band shifts towards shorter wavelengths (“blue shift” of fluorescence) [40,52,60], and with a subsequent increase in the excitation wavelength, the wavelength of the maximum of the band monotonously grows. The value of the “blue shift” depends on the type of natural water and can characterize humic compounds in the composition of DOM. The fluorescence spectra of different types of natural water also differ in the values of the fluorescence quantum yield and its dependence on the wavelength of the exciting radiation [40,46].
The dependence of the wavelength of the spectrum maximum λmax on the excitation wavelength λex is shown in Figure 6. It can be seen from the figure that the dependence has a non-monotonous character; at an excitation wavelength of 250–270 nm, λmax increases and then decreases to 310 nm.
The shift of the maximum fluorescence emission band towards shorter wavelengths with a change in the excitation wavelength from 280 to 310 nm corresponds to the “blue shift” characteristic of natural humic compounds [40,45,60,61,62]. With a further increase in the excitation wavelength, the emission maximum shifts to the long-wavelength region. The fact that the dependence of λmax on the excitation wavelength turned out to be similar for different horizons indicates that the aromatic part responsible for CDOM fluorescence has a similar chemical nature at different depths, but closer to the bottom, the gradual accumulation of CDOM is observed.

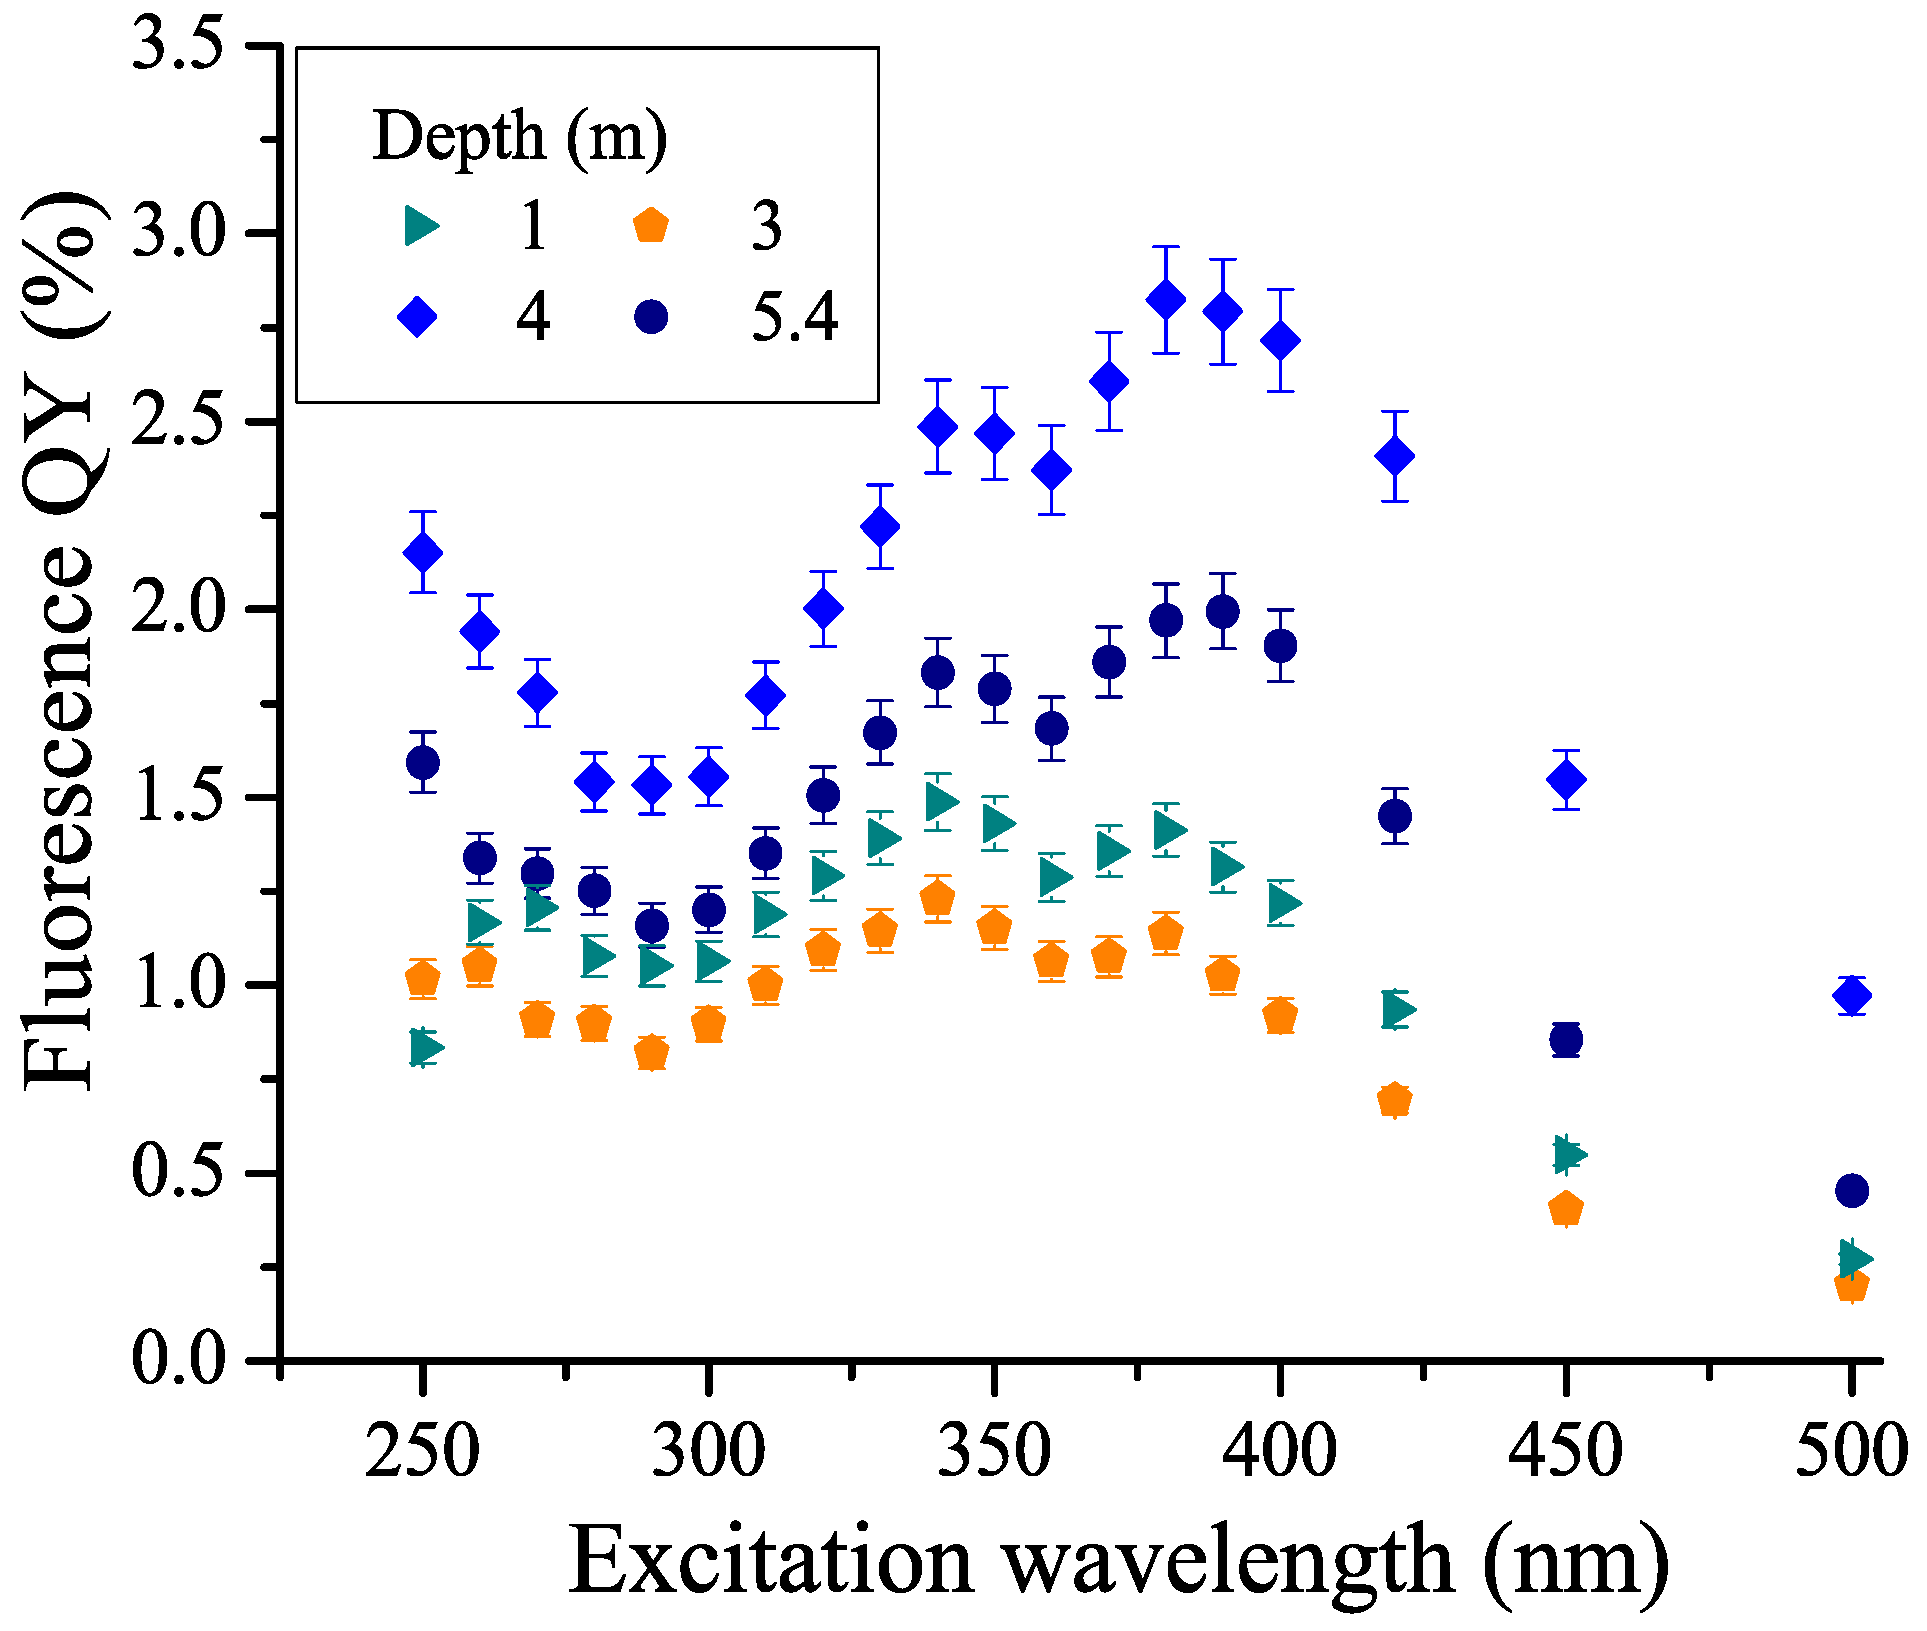
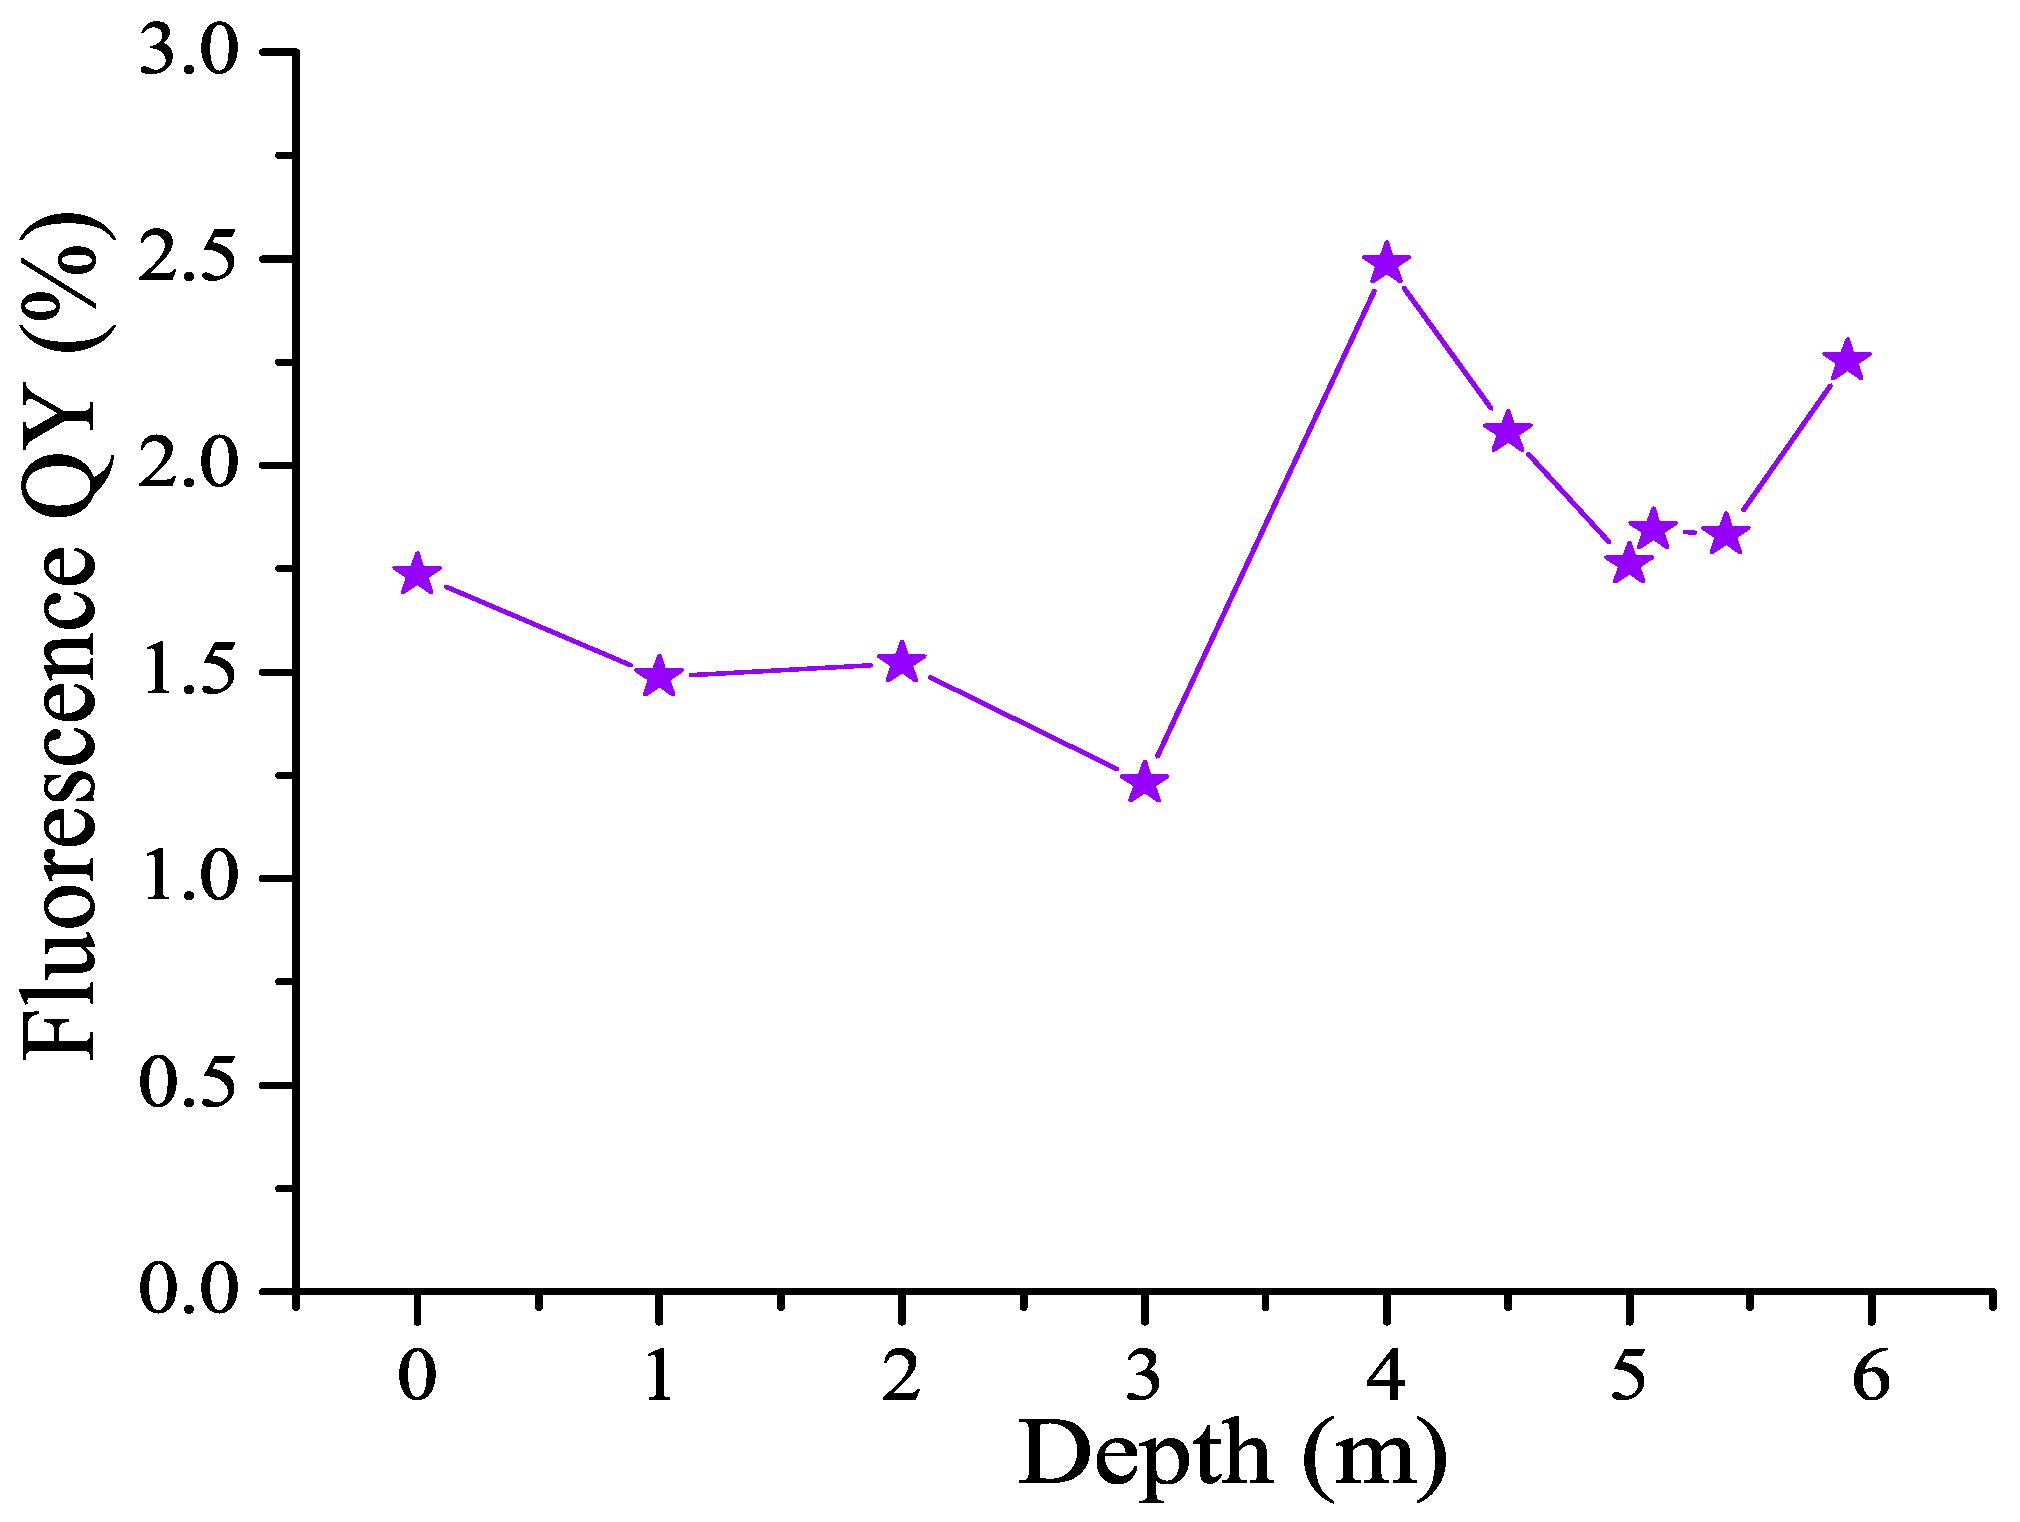
3.5. CDOM Fluorescence Quantum Yield (FDOM/CDOM) and Its Dependence on Depth

The CDOM fluorescence quantum yield Φ was calculated from the fluorescence emission spectra and absorbances at excitation wavelengths using the standard solution method. An aqueous solution of quinine sulfate was taken as a reference solution. Figure 7 shows the calculated dependences of the fluorescence quantum yield on the excitation wavelength Φ(λex) in water samples from different horizons of the lagoon. The dependence has a minimum at an excitation wavelength of ≈290 nm, as well as a small minimum at λex ≈ 360 nm; maxima are observed at λex ≈ 340 nm and 380 nm. It can be seen that the absolute value of the fluorescence quantum yield differs significantly in different water layers. Figure 8 demonstrates the fluorescence quantum yield for an excitation wavelength of 340 nm (QY340). The fluorescence quantum yield was calculated as the wavelength-integrated CDOM fluorescence divided by CDOM absorbance, so that the value can be interpreted as a ratio FDOM/CDOM. This depth dependence reaches a maximum at 4 m and a local minimum at 3 m, which characterize water layers with different CDOM properties. This finding corroborates the maximum in Figure 4 showing the ratio of the low-molecular and high-molecular parts of the aromatic CDOM components.

3.6. Depth Distribution of Chlorophyll and Photosynthetic Activity

At the time of sampling, there were two layers within a water column in the lagoon with active phytoplankton oxygenic photosynthesis (Table 1), as evidenced by the measurement data of chlorophyll (Chl) a fluorescence. The F0 parameter characterizes the Chl a amount and the total abundance of phytoplankton.
The dominance of autotrophic dinoflagellates from the genus Gymnodinium; a high number of unidentified small flagellates and cocci were found within the upper Chl a peak. High values of the Fv/Fm parameter (0.63) indicate the good physiological state of these algae at a horizon of 4 m. The second peak of Chl a fluorescence is located at a depth of 5–5.2 m; it is formed by the mass reproduction of cryptophyte flagellates Rhodomonas sp. These algae are capable of efficient photosynthesis (Fv/Fm = 0.76) in shady conditions and set especially high Fv/Fm values, which has been repeatedly observed before in this and other coastal stratified water bodies [10,11,63]. The decrease in the Chl a fluorescence parameter Fv/Fm in the intermediate zone between the two depth peaks may be due to the weakening of light intensity, negatively affecting the living conditions of phytoplankton, as well as eating by predators, which was recorded previously in a similar meromictic water body Lake Kislo-Sladkoe [64].

3.7. Depth Distribution of Bacteriochlorophylls of Green Sulfur Bacteria

Green sulfur bacteria (Chlorobiaceae) are a family of obligate anaerobic photolithoautotrophic bacteria that use hydrogen sulfide, hydrogen, and elemental sulfur as electron donors. The main photosynthetic pigments of green sulfur bacteria are two types of chlorosomal bacteriochlorophylls (Bchl d and Bchl e). Figure 9 shows the absorption spectra of unfiltered water from the lagoon with microorganisms in horizons below the chemocline, starting from 5 m.
The absorption band reaching its maximum at about 725 nm is the long-wavelength absorption band of the chlorosomal bacteriochlorophylls of green sulfur bacteria. At a horizon of 5.2 m, one can see the absorption Chl peak at 680 nm overlapping the major peak of Bchl, demonstrating the presence of Chl-containing phytoplankton (Rhodomonas sp.) at that depth. The concentration of Bchl (d+e), the main photosynthetic pigment of green sulfur bacteria, was determined from the area of the long-wavelength absorption band of BChl in the spectral range of 650–800 nm (Table 1) according to [42]. Starting from a 5.3 m concentration of Bchl, green sulfur bacteria grow, which indicates the presence of hydrogen sulfide in the deeper water layers. The concentration of Bchl (d+e) increases towards the bottom of the lagoon; it does not have a clearly defined maximum, which, in all likelihood, is associated with the settling and accumulation of dead bacterial cells in which pigments are retained. The Bchl (d+e) maximum concentration in the bottom water (2775 mg/m3) was about seven times higher than the Bchl (d+e) concentration at the same depth in the lagoon in September 2017 [65].

3.8. Discussion of Results: Optical Properties of CDOM, Chl, and Bchl as Proxies of Euxinia in Meromictic Water Bodies

If we put altogether the optical properties of CDOM (A280/A472 and FDOM/CDOM), Bchl of green sulfur bacteria, O2 concentration, redox potential, and the Eh and pH measurements, we could see apparent water stratification in the lagoon on Zeleny Cape (Figure 10).
In the lagoon on Zeleny Cape, the upper water layer, the mixolimnion, extends from the surface to a depth of 2 m, showing constant hydrochemical and optical characteristics. Since this lagoon is separated from the White Sea by a shallow threshold, marine water enters the lagoon during high tide, but the water catchment area is low; therefore, the salinity of the surface water is high, and the CDOM spectral characteristics are close to that of the marine type.
Typically, in meromictic water bodies, the CDOM spectral characteristics change along with an increasing depth due to the mixing of freshwater with the CDOM of a continental origin with saline water with marine CDOM. Therefore, for most meromictic water bodies, an anticorrelation of CDOM absorbances in the UV range (A350 or A350) with salinity is observed. A similar dependence of D350 on salinity was observed in the area where the Northern Dvina flows into the White Sea [46], as well as in the area where the water of White Sea mixes with the waster of the Barents Sea [51]. However, for the water column in the lagoon on Zeleny Cape, the absorbance values were increasing along with the depth (starting from 3 m down to the bottom), as well as with salinity. This is explained by the accumulation of CDOM in deepened waters.
In the chemocline zone at 4 m, signs of the appearance of the freshly released CDOM of autochthonous origin are observed: increased values of the fluorescence quantum yield (almost 3%), protein-like fluorescence in filtered samples, an apparent shoulder in the absorption spectrum in the 270 nm region, and the sharp increase in the absorbance ratios A280/A472 and A465/A665. Further, the concentration of CDOM increases along with the depth and reaches a maximum in the bottom water. This is likely due to the large microbial biomass in bottom water and bottom sediments, which is the source of CDOM formation.
Between 5 m and 5.2 m horizons, one can find simultaneously phytoplankton (Rhodomonas sp.) reaching maximum photosynthetic activity at 5.2 m water layer negative redox values, as well as anoxygenic phototrophic bacteria (Chlorobiaceae), of which the concentration is growing from 5 m down to the bottom of the lagoon. This layer, between 5 m and 5.2 m, we could characterize as an oxic–anoxic interface with the simultaneous existence of oxygenic photosynthesis (performed by cryptophytic algae) and anoxygenic photosynthesis (performed by green sulfur bacteria). Such an association between oxygenic and anoxygenic photosynthesis has been described recently for the chemocline of Lake Cadagno (the Swiss Alps) [66]. The genomic studies suggested the cooperation of photosynthetic algae with phototrophic sulfur bacteria via C, N, and S metabolism. In the lagoon on Zeleny Cape, we can apparently observe the microbial association of oxygenic and anoxygenic photosynthetic organisms using spectral approaches.
Further, the concentration of CDOM increases along with the depth towards the bottom of the lagoon. This is likely due to the large microbial biomass in the bottom water and sediments, the source of CDOM formation. The bottom layer is characterized by the apparent proxies of euxinia: the presence of hydrogen sulfide, negative redox values, and the development of green sulfur bacteria and anoxygenic photosynthetic bacteria.
The study of CDOM is of great importance for understanding ecological processes in water systems and developing methods for protecting the environment. Since CDOM of natural origin due to the presence of humic compounds absorbs UV light and emits fluorescence under UV excitation [57,58,67,68], its spectra are successfully used in its study in natural water [30,69,70]. Measuring the absorption spectra of the CDOM in natural water, one can obtain information about its concentration, roughly the chemical composition, and, for example, one can determine the presence of various functional groups, such as aromatic compounds or carbonyl groups (see, for example, [30,71]).

4. Conclusions

The results of the studies of CDOM absorbances in the near-UV range and their correlation with salinity indicate the absence of the mixing of submerged water layers in the lagoon on Zeleny Cape. The direct dependence of the CDOM absorbance in the UV range on salinity at different horizons (as opposed to the inverse dependence for the mixolimnion when mixing takes place), the depth dependence of the fluorescence quantum yield (FDOM/CDOM ratio), the ratios A280/A472 and A465/A665 demonstrating maximum values at the same water horizons as the maximum of fluorescence quantum yield, and the presence of a Bchl of green sulfur bacteria could all serve as the optical proxies of euxinia in the water column in the lagoon on Zeleny Cape. The monotonous increase in the CDOM concentration along with the depth reflects the distribution of living organisms that serve as a source of CDOM and the accumulation of their decomposition products in the anaerobic zone close to the bottom. This is confirmed by the monotonic increase in the CDOM content as well as the increasing concentration of Bchl (d+e) with the depth.
The advantages of spectroscopic methods are that they do not require the pre-treatment of water samples and are able to rapidly obtain information on the CDOM, Chl, and Bchl vertical distribution along the water column.

Supplementary Materials

The following supporting information can be downloaded at: https://www.mdpi.com/article/10.3390/photonics10060672/s1.

Author Contributions

Conceptualization, S.V.P. and E.D.K.; methodology, S.V.P. and E.D.K.; formal analysis, E.D.K., D.A.V., D.N.M. and S.V.P.; investigation, Y.G.S. and A.A.Z.; resources, E.D.K. and D.A.V.; writing—original draft preparation, S.V.P.; writing—review and editing, E.D.K., D.A.V., D.N.M. and Y.G.S.; visualization, S.V.P., Y.G.S. and A.A.Z.; supervision, S.V.P. All authors have read and agreed to the published version of the manuscript.

Funding

This research received no external funding.

Acknowledgments

We would like to express our deep gratitude to the staff of the White Sea Biological Station for the comprehensive support of the expeditions. The authors also thank Vasily Efimov, who provided the photograph of the lagoon.

Conflicts of Interest

The authors declare no conflict of interest.

References

  1. Meyer, K.M.; Kump, L.R. Oceanic Euxinia in Earth History: Causes and Consequences. Annu. Rev. Earth Planet. Sci. 2008, 36, 251–288. [Google Scholar] [CrossRef] [Green Version]
  2. Lyons, T.W.; Anbar, A.D.; Severmann, S.; Scott, C.; Gill, B.C. Tracking Euxinia in the Ancient Ocean: A Multiproxy Perspective and Proterozoic Case Study. Annu. Rev. Earth Planet. Sci. 2009, 37, 507–534. [Google Scholar] [CrossRef]
  3. Krasnova, E.D.; Pantyulin, A.N.; Belevich, T.A.; Voronov, D.A.; Demidenko, N.A.; Zhitina, L.S.; Ilyash, L.V.; Kokryatskaya, N.M.; Lunina, O.N.; Mardashova, M.V.; et al. Multidisciplinary studies of the separating lakes at different stage of isolation from the White Sea performed in March 2012. Oceanology 2013, 53, 714–717. [Google Scholar] [CrossRef]
  4. Krasnova, E.D.; Kharcheva, A.V.; Milyutina, I.A.; Voronov, D.A.; Patsaeva, S.V. Study of microbial communities in redox zone of meromictic lakes isolated from the White Sea using spectral and molecular methods. J. Mar. Biol. Assoc. 2015, 95, 1579–1590. [Google Scholar] [CrossRef]
  5. Mardashova, M.V.; Voronov, D.A.; Krasnova, E.D. Benthic communities of coastal water bodies at different stages of isolation from the White Sea in the vicinity of the White Sea Biological Station. Biol. Bull. 2020, 47, 1133–1152. [Google Scholar] [CrossRef]
  6. Krasnova, E.D. Ecology of Meromictic Lakes of Russia. 1. Coastal Marine Waterbodies. Water Resour. 2021, 48, 427–438. [Google Scholar] [CrossRef]
  7. Repkina, T.; Shilova, O.S.; Krasnova, E.; Entin, A.; Grigoriev, V.; Vakhrameyeva, E.; Losyuk, G.; Kublitskiy, Y.; Leontie, P.; Lugovoy, N.; et al. From the sea strait to the meromictic lake: Evolution and ecosystem of a water body at the fiard coast (lake Kislo-Sladkoe at the Karelian coast of the Kandalaksha bay, the White Sea, Russia). Quat. Int. 2023, 644–645, 96–119. [Google Scholar] [CrossRef]
  8. Hakala, A. Meromixis as a part of lake evolution—Observations and a revised classification of true meromictic lakes in Finland. Boreal Environ. Res. 2004, 9, 37–53. [Google Scholar]
  9. Stewart, K.M.; Walker, K.F.; Likens, G.E. Meromictic Lakes. In Encyclopedia of Inland Waters; Academic Press: Oxford, UK, 2009; pp. 589–602. [Google Scholar]
  10. Krasnova, E.D.; Pantyulin, A.N.; Matorin, D.N.; Todorenko, D.A.; Belevich, T.A.; Milyutina, I.A.; Voronov, D.A. Blooming of the cryptomonad alga Rhodomonas sp. (Cryptophyta, Pyrenomonadaceae) in the redox zone of the basins separating from the White Sea. Microbiology 2014, 83, 270–277. [Google Scholar] [CrossRef]
  11. Krasnova, E.; Matorin, D.; Belevich, T.; Efimova, L.; Kharcheva, A.; Kokryatskaya, N.; Losyuk, G.; Todorenko, D.; Voronov, D.; Patsaeva, S. The characteristic pattern of multiple colored layers in coastal stratified lakes in the process of separation from the White Sea. Chin. J. Oceanol. Limnol. 2018, 36, 1962–1977. [Google Scholar] [CrossRef]
  12. Hansell, D.A. Recalcitrant dissolved organic carbon fractions. Annu. Rev. Mar. Sci. 2013, 5, 421–445. [Google Scholar] [CrossRef] [PubMed]
  13. Hansell, D.A.; Carlson, C.A. Biogeochemistry of Marine Dissolved Organic Matter, 2nd ed.; Academic Press: San Diego, CA, USA, 2015. [Google Scholar]
  14. Jansson, M.; Bergström, A.K.; Blomqvist, P.; Isaksson, A.; Jonsson, A. Impact of allochthonous organic carbon on microbial food web carbon dynamics and structure in Lake Örträsket. Arch. Hydrobiol. 1999, 144, 409–428. [Google Scholar] [CrossRef]
  15. Jansson, M.; Hickler, T.; Jonsson, A.; Karlsson, J. Links between terrestrial primary production and bacterial production and respiration in lakes in a climate gradient in subarctic Sweden. Ecosystems 2008, 11, 367–376. [Google Scholar] [CrossRef]
  16. Khundzhua, D.A.; Patsaeva, S.V.; Terekhova, V.A.; Yuzhakov, V.I. Spectral characterization of fungal metabolites in aqueous medium with humus substances. J. Spectrosc. 2013, 2013, 538608. [Google Scholar] [CrossRef] [Green Version]
  17. Fedoseeva, E.; Stepanov, A.; Yakimenko, O.; Patsaeva, S.; Freidkin, M.; Khundzhua, D.; Terekhova, V. Biodegradation of humic substances by microscopic filamentous fungi: Chromatographic and spectroscopic proxies. J. Soils Sediments 2019, 19, 2676–2687. [Google Scholar] [CrossRef]
  18. Fedoseeva, E.V.; Patsaeva, S.V.; Khundzhua, D.A.; Pukalchik, M.A.; Terekhova, V.A. Effect of exogenic humic substances on various growth endpoints of Alternaria Alternata and Trichoderma Harzianum in the experimental conditions. Waste Biomass Valorization 2021, 12, 211–222. [Google Scholar] [CrossRef]
  19. Tranvik, L.J. Dystrophy in Freshwater Systems. In Reference Module in Earth Systems and Environmental Sciences; Elsevier: Amsterdam, The Netherlands, 2014. [Google Scholar] [CrossRef]
  20. Catrouillet, C.; Davranche, M.; Dia, A.; Coz, M.; Marsac, R.; Pourret, O.; Gruau, G. Geochemical modeling of Fe(II) binding to humic and fulvic acids. Chem. Geol. 2014, 372, 109–118. [Google Scholar] [CrossRef] [Green Version]
  21. Terekhova, V.A.; Fedoseeva, E.V.; Panova, M.I.; Chukov, S.N. Bioassay of humic products as potential remedies: A review. Eurasian Soil Sci. 2022, 55, 868–878. [Google Scholar] [CrossRef]
  22. Carlsson, P.; Segatto, A.; Granéli, E. Nitrogen bound to humic matter of terrestrial origin-a nitrogen pool for coastal phytoplankton? Mar Ecol Prog Ser. 1993, 97, 105–116. [Google Scholar] [CrossRef]
  23. Bricaud, A.; Morel, A.; Prieur, L. Absorption by dissolved organic matter of the sea (yellow substance) in the UV and visible domain. Limnol. Oceanogr. 1981, 26, 43–53. [Google Scholar] [CrossRef]
  24. McKnight, D.M.; Boyer, E.W.; Westerhoff, P.K.; Doran, P.T.; Kulbe, T.; Andersen, D.T. Spectrofluorometric characterization of dissolved organic matter for indication of precursor organic material and aromaticity. Limnol. Oceanogr. 2001, 46, 38–48. [Google Scholar] [CrossRef]
  25. Jaffe, R.; McKnight, D.; Maie, N.; Cory, R.; McDowell, W.H.; Campbell, J.L. Spatial and temporal variations in DOM composition in ecosystems: The importance of long-term monitoring of optical properties. J. Geophys. Res. 2008, 113, 04032. [Google Scholar] [CrossRef]
  26. Helms, J.R.; Stubbins, A.; Ritchie, J.C.; Minor, E.C.; Kieber, D.J.; Mopper, K. Absorption spectral slopes and slope ratios as indicators of molecular weight, source, and photobleaching of chromophoric dissolved organic matter. Limnol. Oceanogr. 2008, 53, 955–969. [Google Scholar] [CrossRef] [Green Version]
  27. Jørgensen, L.; Stedmon, C.A.; Tragh, T.; Markager, S.; Middleboe, M.; Sondergaard, M. Global trends in the fluorescence characteristics and distribution of marine dissolved organic matter. Mar. Chem. 2011, 126, 139–148. [Google Scholar] [CrossRef]
  28. Breves, W.; Reuter, R. Bio-optical properties of gelbstoff in the Arabian Sea at the onset of the southwest monsoon. Earth Planet. Sci. Proc. Indian Acad. Sci. 2012, 109, 415–425. [Google Scholar] [CrossRef] [Green Version]
  29. Lonborg, C.; Yokokawa, T.; Herndl, G.J.; Alvarez-Salgado, X.A. Production and degradation of fluorescent dissolved organic matter in surface waters of the eastern north Atlantic ocean. Deep Sea Res. I 2015, 96, 28–37. [Google Scholar] [CrossRef] [Green Version]
  30. Jian, Z.; Xu, J.; Huang, X.; Yang, W.; Hu, Q. Optical Absorption Characteristics, Spatial Distribution, and Source Analysis of Colored Dissolved Organic Matter in Wetland Water around Poyang Lake. Water 2021, 13, 274. [Google Scholar] [CrossRef]
  31. Reuter, R.; Willkomm, R.; Krieger, J.; Milchers, W.; Patsayeva, S.; Hengstermann, T. Measurement of gelbstoff in seawater from aircraft and on board research vessels using fluorescence techniques. In Lidar Techniques for Remote Sensing II; Werner, C., Ed.; 1995; Volume 2581, pp. 48–59. Available online: https://spie.org/Publications/Proceedings/Paper/10.1117/12.228520?SSO=1 (accessed on 28 May 2023).
  32. Harsdorf, S.; Reuter, R. Laser remote sensing in highly turbid waters: Validity of the lidar equation. In Environmental Sensing and Applications; SPIE: Washington, DC, USA, 1999; Volume 3821. [Google Scholar] [CrossRef]
  33. Barbini, R.; Colao, F.; Fantoni, R.; Fiorani, L.; Kolodnikova, N.; Palucci, A. Laser remote sensing calibration of ocean color satellite data. Ann. Geophys. 2009, 49. [Google Scholar] [CrossRef]
  34. Fiorani, L.; Angelini, F.; Colao, F.; Nuvoli, M.; Palucci, A. Laser radars for marine monitoring. In Proceedings of the XXII International Symposium on High Power Laser Systems and Applications, Frascati, Italy, 9–12 October 2019; p. 1104212. [Google Scholar] [CrossRef]
  35. Aruffo, E.; Chiuri, A.; Angelini, F.; Artuso, F.; Cataldi, D.; Colao, F.; Fiorani, L.; Menicucci, I.; Nuvoli, M.; Pistilli, M.; et al. Hyperspectral Fluorescence LIDAR Based on a Liquid Crystal Tunable Filter for Marine Environment Monitoring. Sensors 2020, 20, 410. [Google Scholar] [CrossRef] [Green Version]
  36. Kahru, M.; Mitchell, B.G. Seasonal and nonseasonal variability of satellite-derived chlorophyll and colored dissolved organic matter concentration in the California Current. J. Geophys. Res. 2001, 106, 2517–2529. [Google Scholar] [CrossRef]
  37. Fantoni, R.; Fiorani, L.; Palucci, A.; Okladnikov, I.G. New algorithm for CDOM retrieval from satellite imagery. In Technical Reports of the Italian Agency for New Technologies, Energy and the Environment; Renieri, A., Ed.; ENEA: Frascati, Italy, 2005. [Google Scholar]
  38. Aurin, D.; Mannino, A.; Lary, D.J. Remote Sensing of CDOM, CDOM Spectral Slope, and Dissolved Organic Carbon in the Global Ocean. Appl. Sci. 2018, 8, 2687. [Google Scholar] [CrossRef] [Green Version]
  39. Groom, S.; Sathyendranath, S.; Ban, Y.; Bernard, S.; Brewin, R.; Brotas, V.; Brockmann, C.; Chauhan, P.; Choi, J.-K.; Chuprin, A.; et al. Satellite Ocean Colour: Current Status and Future Perspective. Front. Mar. Sci. 2019, 6, 485. [Google Scholar] [CrossRef] [PubMed] [Green Version]
  40. Patsaeva, S.; Khundzhua, D.; Trubetskoj, O.A.; Trubetskaya, O.E. Excitation-dependent fluorescence quantum yield for freshwater chromophoric dissolved organic matter from northern Russian lakes. J. Spectrosc. 2018, 2018, 3168320. [Google Scholar] [CrossRef] [Green Version]
  41. Matorin, D.; Antal, T.; Ostrowska, M.; Rubin, A.; Ficek, D.; Majchrowski, R. Chlorophyll fluorimetry as a method for studying light absorption by photosynthetic pigments in marine algae. Oceanologia 2004, 46, 519–531. [Google Scholar]
  42. Emeliantsev, P.S.; Zhiltsova, A.A.; Krasnova, E.D.; Voronov, D.A.; Rymar, V.V.; Patsaeva, S.V. Quantification of chlorosomal bacteriochlorophylls using absorption spectra of green sulfur bacteria in natural water. Mosc. Univ. Phys. Bull. 2020, 75, 137–142. [Google Scholar] [CrossRef]
  43. Zhiltsova, A.A.; Filippova, O.A.; Krasnova, E.D.; Voronov, D.A.; Patsaeva, S.V. Comparative analysis of spectral methods for determining bacteriochlorophyll d concentration in green sulfur bacteria in water. Atmos. Ocean. Opt. 2022, 35, 562–568. [Google Scholar] [CrossRef]
  44. Yakimenko, O.; Khundzhua, D.; Izosimov, A.; Yuzhakov, V.; Patsaeva, S. Source indicator of commercial humic products: UV-vis and fluorescence proxies. J. Soils Sediments 2018, 18, 1279–1291. [Google Scholar] [CrossRef]
  45. Trubetskaya, O.E.; Richard, C.; Patsaeva, S.V.; Trubetskoj, O.A. Evaluation of aliphatic/aromatic compounds and fluorophores in dissolved organic matter of contrasting natural waters by SEC-HPLC with multi-wavelength absorbance and fluorescence detections. Spectrochim. Acta—Part A 2020, 238, 118450. [Google Scholar] [CrossRef]
  46. Drozdova, A.N.; Kravchishina, M.D.; Khundzhua, D.A.; Freidkin, M.P.; Patsaeva, S.V. Fluorescence quantum yield of CDOM in coastal zones of the Arctic seas. Intern. J. Remote Sens. 2018, 39, 9356–9379. [Google Scholar] [CrossRef]
  47. Romankevich, E.A. Geochemistry of Organic Matter in Ocean; Springer: Berlin/Heidelberg, Germany, 1986; p. 336. [Google Scholar] [CrossRef]
  48. Zaitseva, A.F.; Konyukhov, I.V.; Kazimirko, Y.V.; Pogosyan, S.I. Optical Characteristics and Distribution of Chromophoric Dissolved Organic Matter in Onega Bay (White Sea) during the Summer Season (Findings from an Expedition from June 22 to 26, 2015). Oceanology 2018, 58, 233–239. [Google Scholar] [CrossRef]
  49. Drozdova, A.N.; Nedospasov, A.A.; Lobus, N.V.; Patsaeva, S.V.; Shchuka, S.A. CDOM optical properties and DOC content in the largest mixing zones of the Siberian shelf seas. Intern. J. Remote Sens. 2021, 13, 1145. [Google Scholar] [CrossRef]
  50. Glukhovets, D.; Goldin, Y. Research of the relationship between salinity and yellow substance fluorescence in the Kara Sea. Fundam. I Prikl. Gidrofiz. 2018, 11, 34–39. [Google Scholar] [CrossRef]
  51. Pavlov, A.K.; Stedmon, C.A.; Semushin, A.V.; Martma, T.; Ivanov, B.V.; Kowalczuk, P.; Granskog, M.A. Linkages between the circulation and distribution of dissolved organic matter in the White Sea, Arctic Ocean. Cont. Shelf Res. 2016, 119, 1–13. [Google Scholar] [CrossRef] [Green Version]
  52. Patsayeva, S.; Reuter, R. Spectroscopic study of major components of dissolved organic matter naturally occurring in water. In Global Process Monitoring and Remote Sensing of the Ocean and Sea Ice; Deering, D.W., Gudmandsen, P., Eds.; SPIE: Washington, DC, USA, 1995; Volume 2586, pp. 151–160. [Google Scholar] [CrossRef]
  53. Domeizel, M.; Khalil, A.; Prudent, P. UV spectroscopy: A tool for monitoring humification and for proposing an index of the maturity of compost. Bioresour. Technol. 2004, 94, 177–184. [Google Scholar] [CrossRef]
  54. Albrecht, R.; Petit, J.L.; Terrom, G.; Périssol, C. Comparison between UV spectroscopy and NIRS to assess humification process during sewage sludge and green wastes co-composting. Bioresour. Technol. 2011, 102, 4495–4500. [Google Scholar] [CrossRef]
  55. Kononova, M.M. Soil Organic Matter, Its Nature, Its Role in Soil Formation and in Soil Fertility; Pergamon: Oxford, UK, 1966. [Google Scholar]
  56. Stevenson, F.J. Humus Chemistry: Genesis, Composition, Reactions; John Wiley and Sons: New York, NY, USA, 1994. [Google Scholar]
  57. Coble, P.G. Characterization of marine and terrestrial DOM in seawater using excitation—emission matrix spectroscopy. Mar. Chem. 1996, 51, 325–346. [Google Scholar] [CrossRef]
  58. Del Vecchio, R.; Blough, N.V. On the origin of the optical properties of humic substances. Environ. Sci. Technol. 2004, 38, 3885–3891. [Google Scholar] [CrossRef]
  59. Gosteva, O.Y.; Izosimov, A.A.; Patsaeva, S.V.; Yakimenko, O.S.; Yuzhakov, V.I. Fluorescence of aqueous solutions of commercial humic products. J. Appl. Spectrosc. 2012, 78, 884–891. [Google Scholar] [CrossRef]
  60. Wünsch, U.; Murphy, K.; Stedmon, C. Fluorescence Quantum Yields of Natural Organic Matter and Organic Compounds: Implications for the Fluorescence-based Interpretation of Organic Matter Composition. Front. Mar. Sci. 2015, 2, 98. [Google Scholar] [CrossRef] [Green Version]
  61. Donard, O.F.X.; Lamotte, M.; Belin, C.; Ewald, M. High-sensitivity fluorescence spectroscopy of Mediterranean waters using a conventional or a pulsed laser excitation source. Mar. Chem. 1989, 27, 117–136. [Google Scholar] [CrossRef]
  62. Fedoseeva, E.; Patsaeva, S.; Stom, D.; Terekhova, V. Excitation-dependent fluorescence helps to indicate fungal contamination of aquatic environments and to differentiate filamentous fungi. Photonics 2022, 9, 692. [Google Scholar] [CrossRef]
  63. Matorin, D.N.; Todorenko, D.A.; Voronov, D.A.; Goryachev, S.N.; Bratkovskaya, L.B.; Krasnova, E.D. Characteristics of the distribution and state of phytoplankton at various depths in Kislo-Sladkoe lake (White Sea). Mosc. Univ. Biol. Sci. Bull. 2022, 77, 165–171. [Google Scholar] [CrossRef]
  64. Mindolina, Y.; Selivanova, E.; Ignatenko, M.; Krasnova, E.; Voronov, D.; Plotnikov, A. Taxonomic composition of protist communities in the coastal stratified lake Kislo-Sladkoe (Kandalaksha Bay, White Sea) revealed by microscopy. Diversity 2023, 15, 44. [Google Scholar] [CrossRef]
  65. Grouzdev, D.; Gaisin, V.; Lunina, O.; Krutkina, M.; Krasnova, E.; Voronov, D.; Baslerov, R.; Sigalevich, P.; Savvichev, A.; Gorlenko, V. Microbial communities of stratified aquatic ecosystems of Kandalaksha bay (White Sea) shed light on the evolutionary history of green and brown morphotypes of Chlorobiota. FEMS Micriobiol. Ecol. 2022, 98, 103. [Google Scholar] [CrossRef] [PubMed]
  66. Saini, J.S.; Manni, M.; Hassler, C.; Cable, R.N.; Duhaime, M.B.; Zdobnov, E.M. Genomic insights into the coupling of a Chlorella-like microeukaryote and sulfur bacteria in the chemocline of permanently stratified Lake Cadagno. ISME J. 2023, 17, 903–915. [Google Scholar] [CrossRef]
  67. Chen, R.F.; Bada, J.L. The fluorescence of dissolved organic matter in seawater. Mar. Chem. 1992, 37, 191–221. [Google Scholar] [CrossRef]
  68. Determann, S.; Reuter, R.; Wilkomm, R. Fluorescent matter in the eastern Atlantic Ocean.2. Vertical profiles and relation to water masses. Deep Sea Res. I 1996, 43, 345–360. [Google Scholar] [CrossRef]
  69. Xiao, M.; Chen, Z.; Zhang, Y.; Wen, Y.; Shang, L.; Zhong, J. The Optical Characterization and Distribution of Dissolved Organic Matter in Water Regimes of Qilian Mountains Watershed. Int. J. Environ. Res. Public Health 2022, 19, 59. [Google Scholar] [CrossRef]
  70. Ma, S.; Zhang, X.; Xiong, Y.; Huang, G.; Han, Y.; Funari, V. Assessment of Eutrophication and DOC Sources Tracing in the Sea Area around Dajin Island Using CASI and MODIS Images Coupled with CDOM Optical Properties. Sensors 2021, 21, 4765. [Google Scholar] [CrossRef]
  71. Zhang, X.; Du, Y.; Mao, Z.; Bi, L.; Chen, J.; Jin, H.; Ma, S. Dissolved Organic Carbon Source Attribution in the Changjiang Outflow Region of the East China Sea. Sensors 2021, 21, 8450. [Google Scholar] [CrossRef]
Figure 1. The map of the area of Kandalaksha Bay with the location of the lagoon on Zeleny Cape (a) and photo of the lagoon on Zeleny Cape (b).
Photonics 10 00672 g001
Figure 2. CDOM absorption spectra from different horizons of the lagoon on Zeleny Cape.
Photonics 10 00672 g002
Figure 3. Dependence of the UV absorbances A350 and A380 on depth (a) and on water salinity (b) for water from different horizons of the lagoon on Zeleny Cape.
Photonics 10 00672 g003
Figure 4. Dependence of the CDOM absorbance ratios on depth in the lagoon on Zeleny Cape.
Photonics 10 00672 g004
Figure 5. CDOM fluorescence spectra: horizons 1 m (a), 3 m (b), 4 m (c), and 5.4 m (d) in the lagoon on Zeleny Cape.
Photonics 10 00672 g005aPhotonics 10 00672 g005b
Figure 6. Dependence of the emission wavelength of the CDOM fluorescence maximum on the excitation wavelength for different horizons in the lagoon on Zeleny Cape.
Photonics 10 00672 g006
Figure 7. The CDOM fluorescence quantum yield (FQY) as a function of excitation wavelength λex (water horizons 1 m, 3 m, 4 m, and 5.4 m) in the lagoon on Zeleny Cape.
Photonics 10 00672 g007
Figure 8. Depth distribution of fluorescence quantum yield (QY) for excitation wavelength 340 nm (QY340).
Photonics 10 00672 g008
Figure 9. Absorption spectra of unfiltered water from different horizons below the chemocline in the lagoon on Zeleny Cape (September 2022).
Photonics 10 00672 g009
Figure 10. Hydrochemical characteristics (salinity S, dissolved O2, pH, Eh), Bchl concentration, and optical proxies (A280/A472, A465/A665, and FQY340) in the lagoon on Zeleny Cape.
Photonics 10 00672 g010
Table 1. Chl a fluorescence parameters (F0, Fv/Fm), redox potential Eh, and Bchl (d+e) concentration in the lagoon on Zeleny Cape in September 2022.
Depth, m3.04.04.55.05.15.25.35.45.55.65.75.9
Chl F04916317441521753202----
Chl Fv/Fm0.520.630.330.220.760.7700
Eh, mV99101675435−9−216−297−317−339−351−365
O2, %94820.9000
Bchl (d+e) mg/m3000477690600 *106719052278249525982775
* Approximate data: at horizon 5.2 m, we observed overlapped bands of Chl and Bchl absorption.
Disclaimer/Publisher’s Note: The statements, opinions and data contained in all publications are solely those of the individual author(s) and contributor(s) and not of MDPI and/or the editor(s). MDPI and/or the editor(s) disclaim responsibility for any injury to people or property resulting from any ideas, methods, instructions or products referred to in the content.

