1. Introduction
Currently, large survey telescopes with superior imaging capabilities are required to map the universe in more detail. For example, it is necessary to detect the bending of light from distant galaxies to determine gravitational lensing, which aids in dark matter studies [
1,
2,
3]. However, to detect such subtle changes, the disturbance induced by the optical system must be minimal. Therefore, survey telescopes require excellent mirror configurations and near-perfect alignment for realizing fine gravitational-lensing observations.
For small telescopes, these requirements can be satisfied via mechanical adjustments. However, for larger telescopes, their systems must be actively realigned during observations due to their greater weight. For example, the Very Large Telescope (VLT) survey telescope (VST), a digital survey telescope (diameter of 2.6 m), adjusts the relative position error of its primary and secondary mirrors via real-time curvature sensing. The Visible and Infrared Survey Telescope for Astronomy (VISTA) (diameter of 4 m) has higher requirements for sky-survey efficiency and real-time mirror position correction. Therefore, high-bandwidth wavefront sensors are used to realize rapid and precise adjustments of the secondary mirror [
4,
5,
6].
It is also necessary to enhance the alignment of systems to improve the accuracy of the galaxy “redshift” measurements. Therefore, internal motion metrology is crucial for survey observations. When completed, the Large Synoptic Survey Telescope (LSST, Vera Rubin Observatory) (diameter of 8 m) will be the largest survey telescope in the world. Owing to its considerable camera size, the LSST requires additional active optical links to maintain alignment, prevent wavefront aberrations, and realize stellar images. Moreover, the LSST will use laser tracking for component position metrology; however, it cannot be used during observation.
The unit telescopes of the Very Large Telescope Interferometer (VLTI) are approximately 8 m in diameter, and they measure the non-common optical path using a wavefront sensing system. Thus, the quality of the optical system is greatly improved, with feedback available to enhance the image quality [
7,
8,
9]. However, such wavefront sensing systems require a bright guide star to be tracked, with their feedback speeds limited by the integration time. By contrast, internal motion metrology systems do not require a guide star or a guiding star configuration, making them faster and more robust.
The internal metrology system is used in VLTI during observation. Furthermore, the Giant Magellan Telescope (GMT) will use this metrology system in real-time. This internal metrology system overcomes the shortage of wavefront sensing [
10].
Currently, the in situ alignment of large-aperture survey telescopes requires laser tracking and bulk optical elements. Hence, such telescopes are limited due to volume and mass constraints. The optical fiber interconnection system was originally used in optical communications because of its low weight, small volume, flexible layout, and spatial filtering capabilities. Furthermore, the system has been employed to assemble and test large telescopes [
11,
12,
13,
14,
15,
16,
17]. Thus, there is a need to improve the imaging quality to enhance alignment accuracy at a lower weight, volume, power, and cost. Therefore, this study proposes a fiber-linked internal motion metrology system that addresses the limitations of current wavefront sensing systems by aiding in aligning the mirrors and large lenses in the telescope.
The remainder of this paper is organized as follows.
Section 2 discusses the principles of an internal alignment system based on optical fiber interconnection and the establishment of an internal measurement system model.
Section 3 discusses the testing of boundary influences (such as thermal and air turbulence).
Section 4 describes the desktop experiments conducted to verify the results of the coarse alignment and fine adjustment tests (amount of transmit, angle of rotation, and element positions).
2. Architecture and Basic Principles
2.1. Overview of the Alignment Process
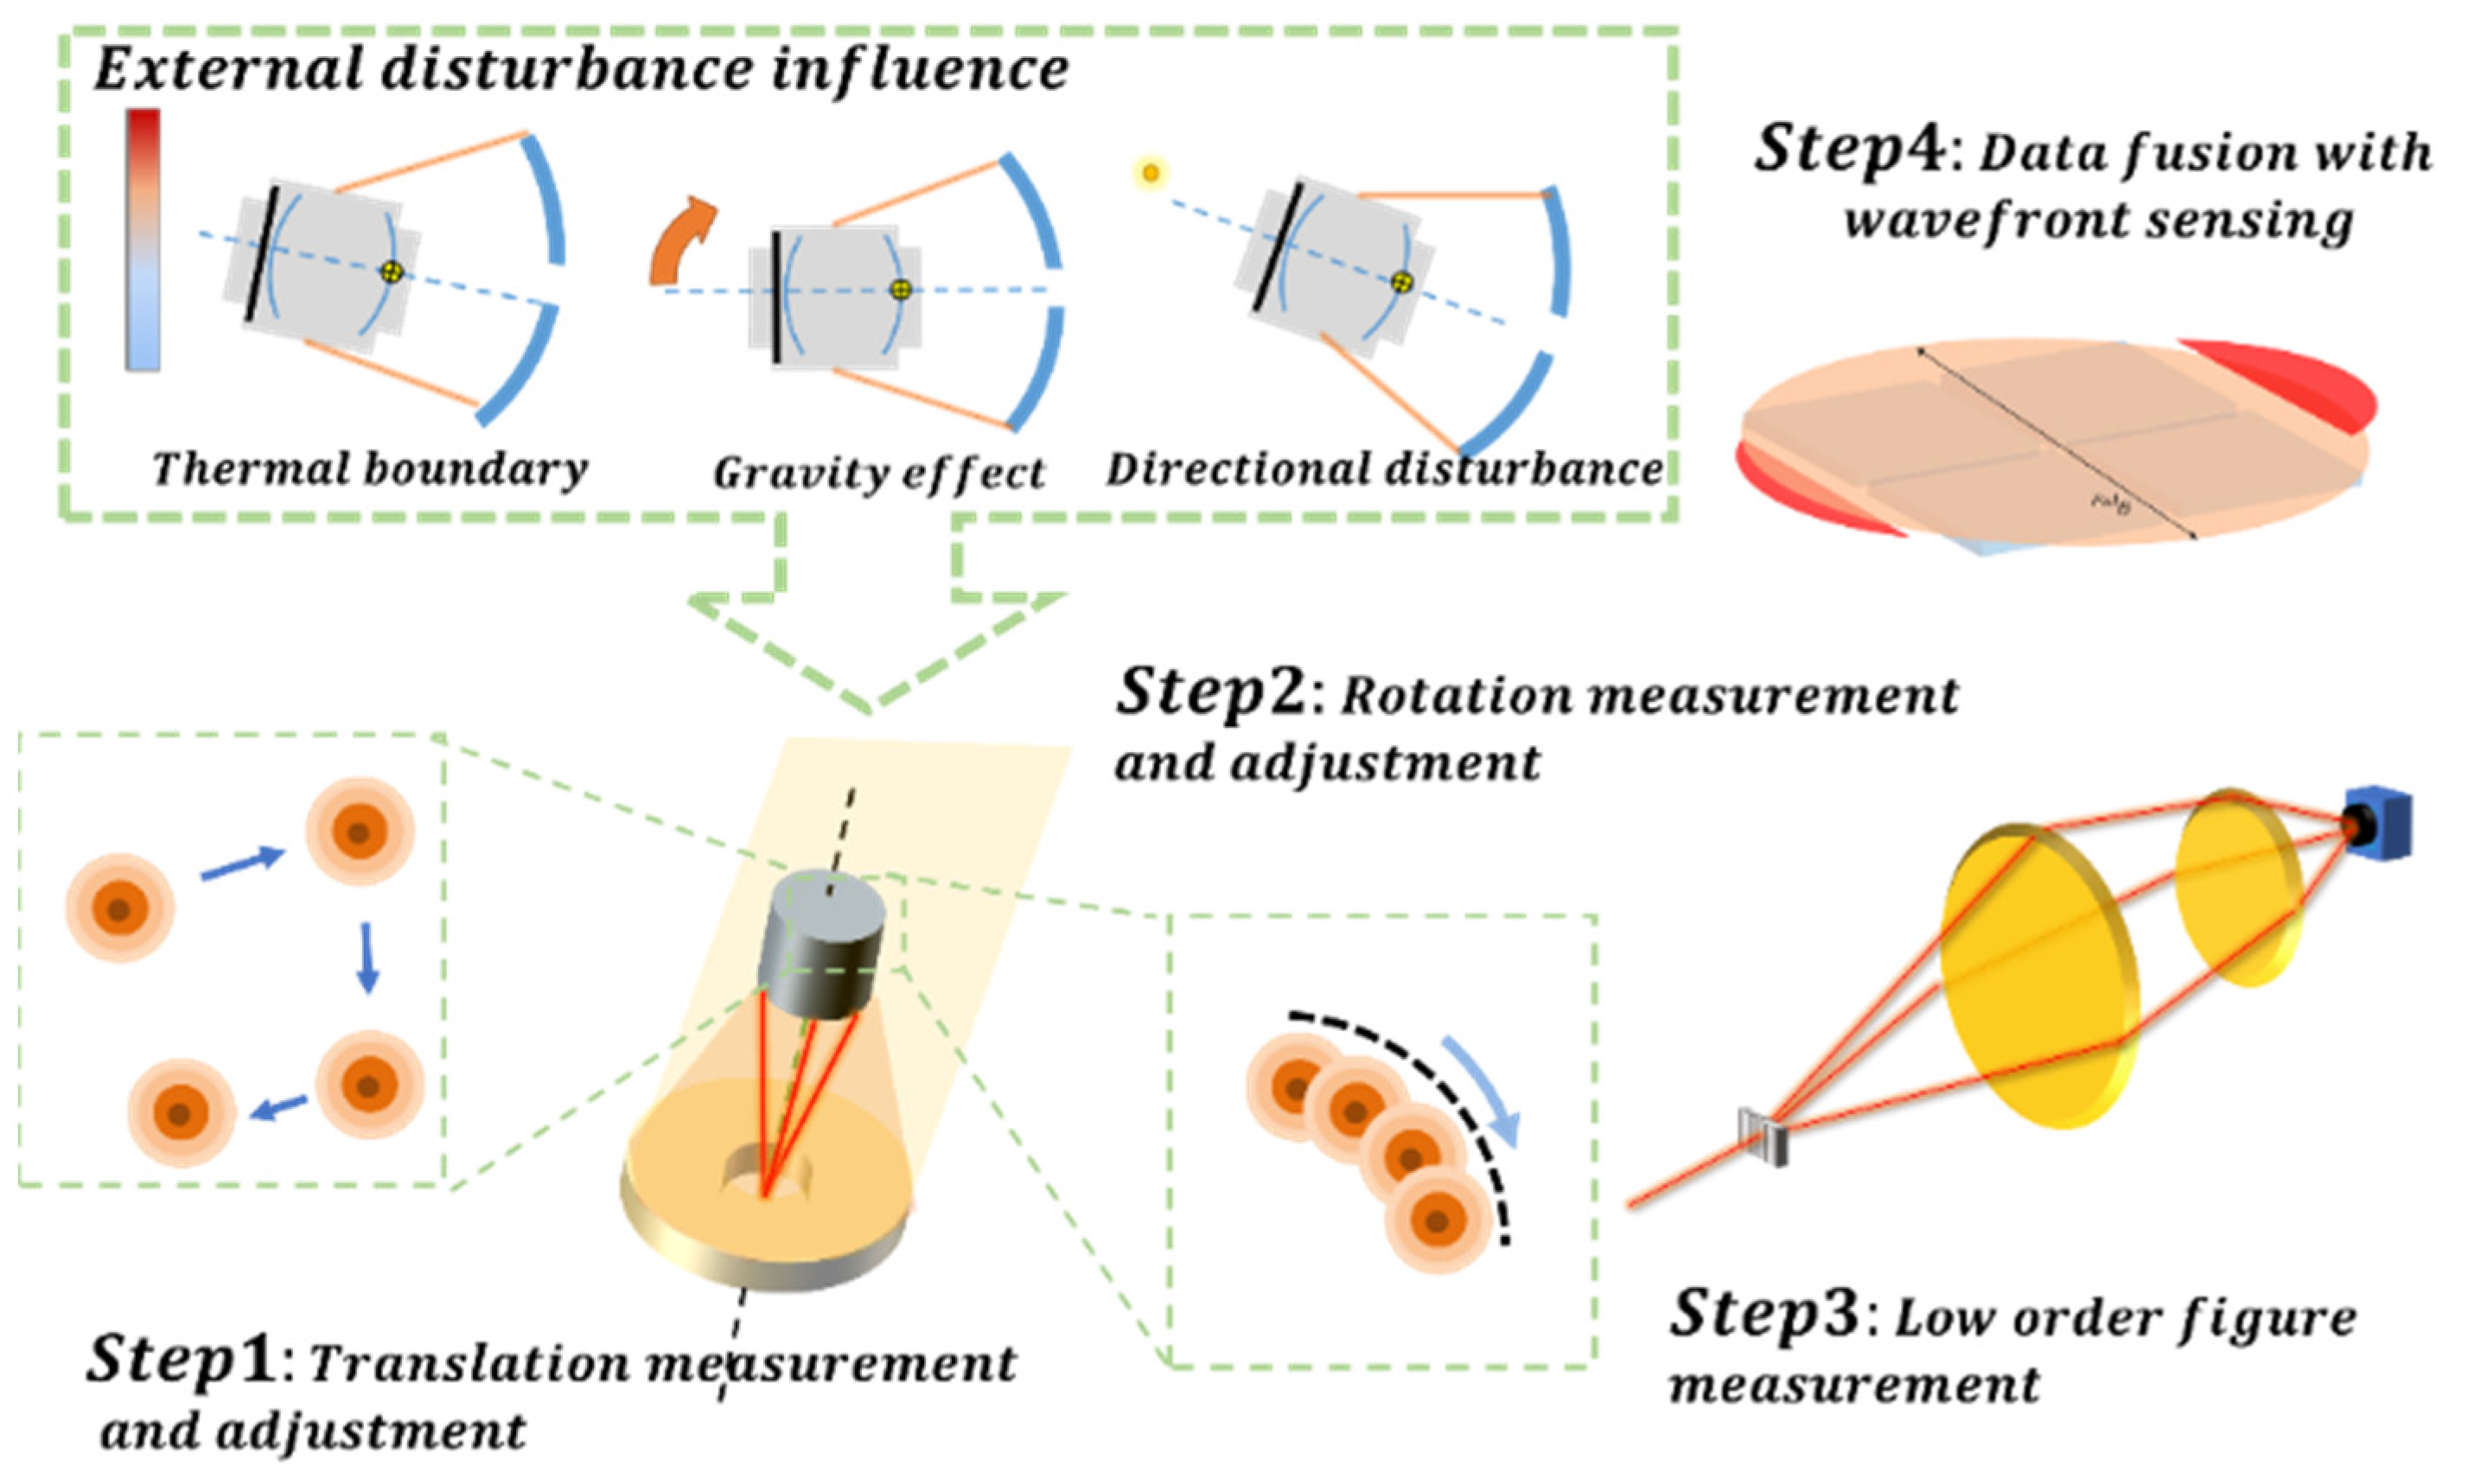
This study presents a complete in situ calibration method that ensures the optical system of a telescope remains aligned over long periods of operation under various conditions. Moreover, the proposed method does not rely on an external light source (such as a guide star), and measurements can be taken continuously, which makes it practical for real-world applications. For clarity, the proposed method is described using a large survey telescope, with its survey camera at the primary focus as an example.
The proposed system comprises a light source, optic fiber, and beam-splitter grating. The beam-splitter grating is used as a photonic laser beam projector, which projects multiple Gaussian beams onto the detector. In a large survey telescope, the beam-splitter grating is positioned at the central hole in the primary mirror. For a perfectly aligned symmetrical system, the spots produced by the Gaussian beams will be uniform circles. However, changes in temperature and the effects of gravity can cause the system to become misaligned, which influences the slope of the wavefront and the layout of the resulting spots. Therefore, real-time detection can be performed while the telescope is operating, with the system calibrated as required.
A schematic diagram of the calibration process for a large survey telescope is shown in
Figure 1. The calibration process can be divided into two stages, coarse and fine alignment, with a total of four steps. In the coarse alignment stage, the translation is determined by calculating the average position of the projected spots, and the necessary corrections are made (step 1). Then, the rotation is determined by fitting the spots to a circle with the necessary corrections made (step 2). In the fine alignment stage, a low-order wavefront is produced, and fine alignment is accomplished via wavefront aberration (step 3). Finally, the wavefront system is set to focus on higher-order aberrations (curvature sensing). Thus, the data from the internal metrology and wavefront sensing systems are combined to sense the state of the telescope (step 4).
The beam is projected by the fiber and grating. Due to the space filter effect of the fiber (similar to a pin hole), the beam spot can be considered a Gauss profile.
2.2. Coarse Alignment Stage
Coarse alignment is the process of aligning the light axis of the primary mirror and the correction lens to minimize vignetting. As shown in
Figure 1, the coarse alignment stage is divided into two steps: translation measurement/adjustment (step 1) and rotation measurement/adjustment (step 2).
Step 1 is the most direct. The average location of the laser spot array is calculated and used to determine the in-plain translation of the camera relative to the perfectly aligned position. Thus, the necessary corrections are straightforward.
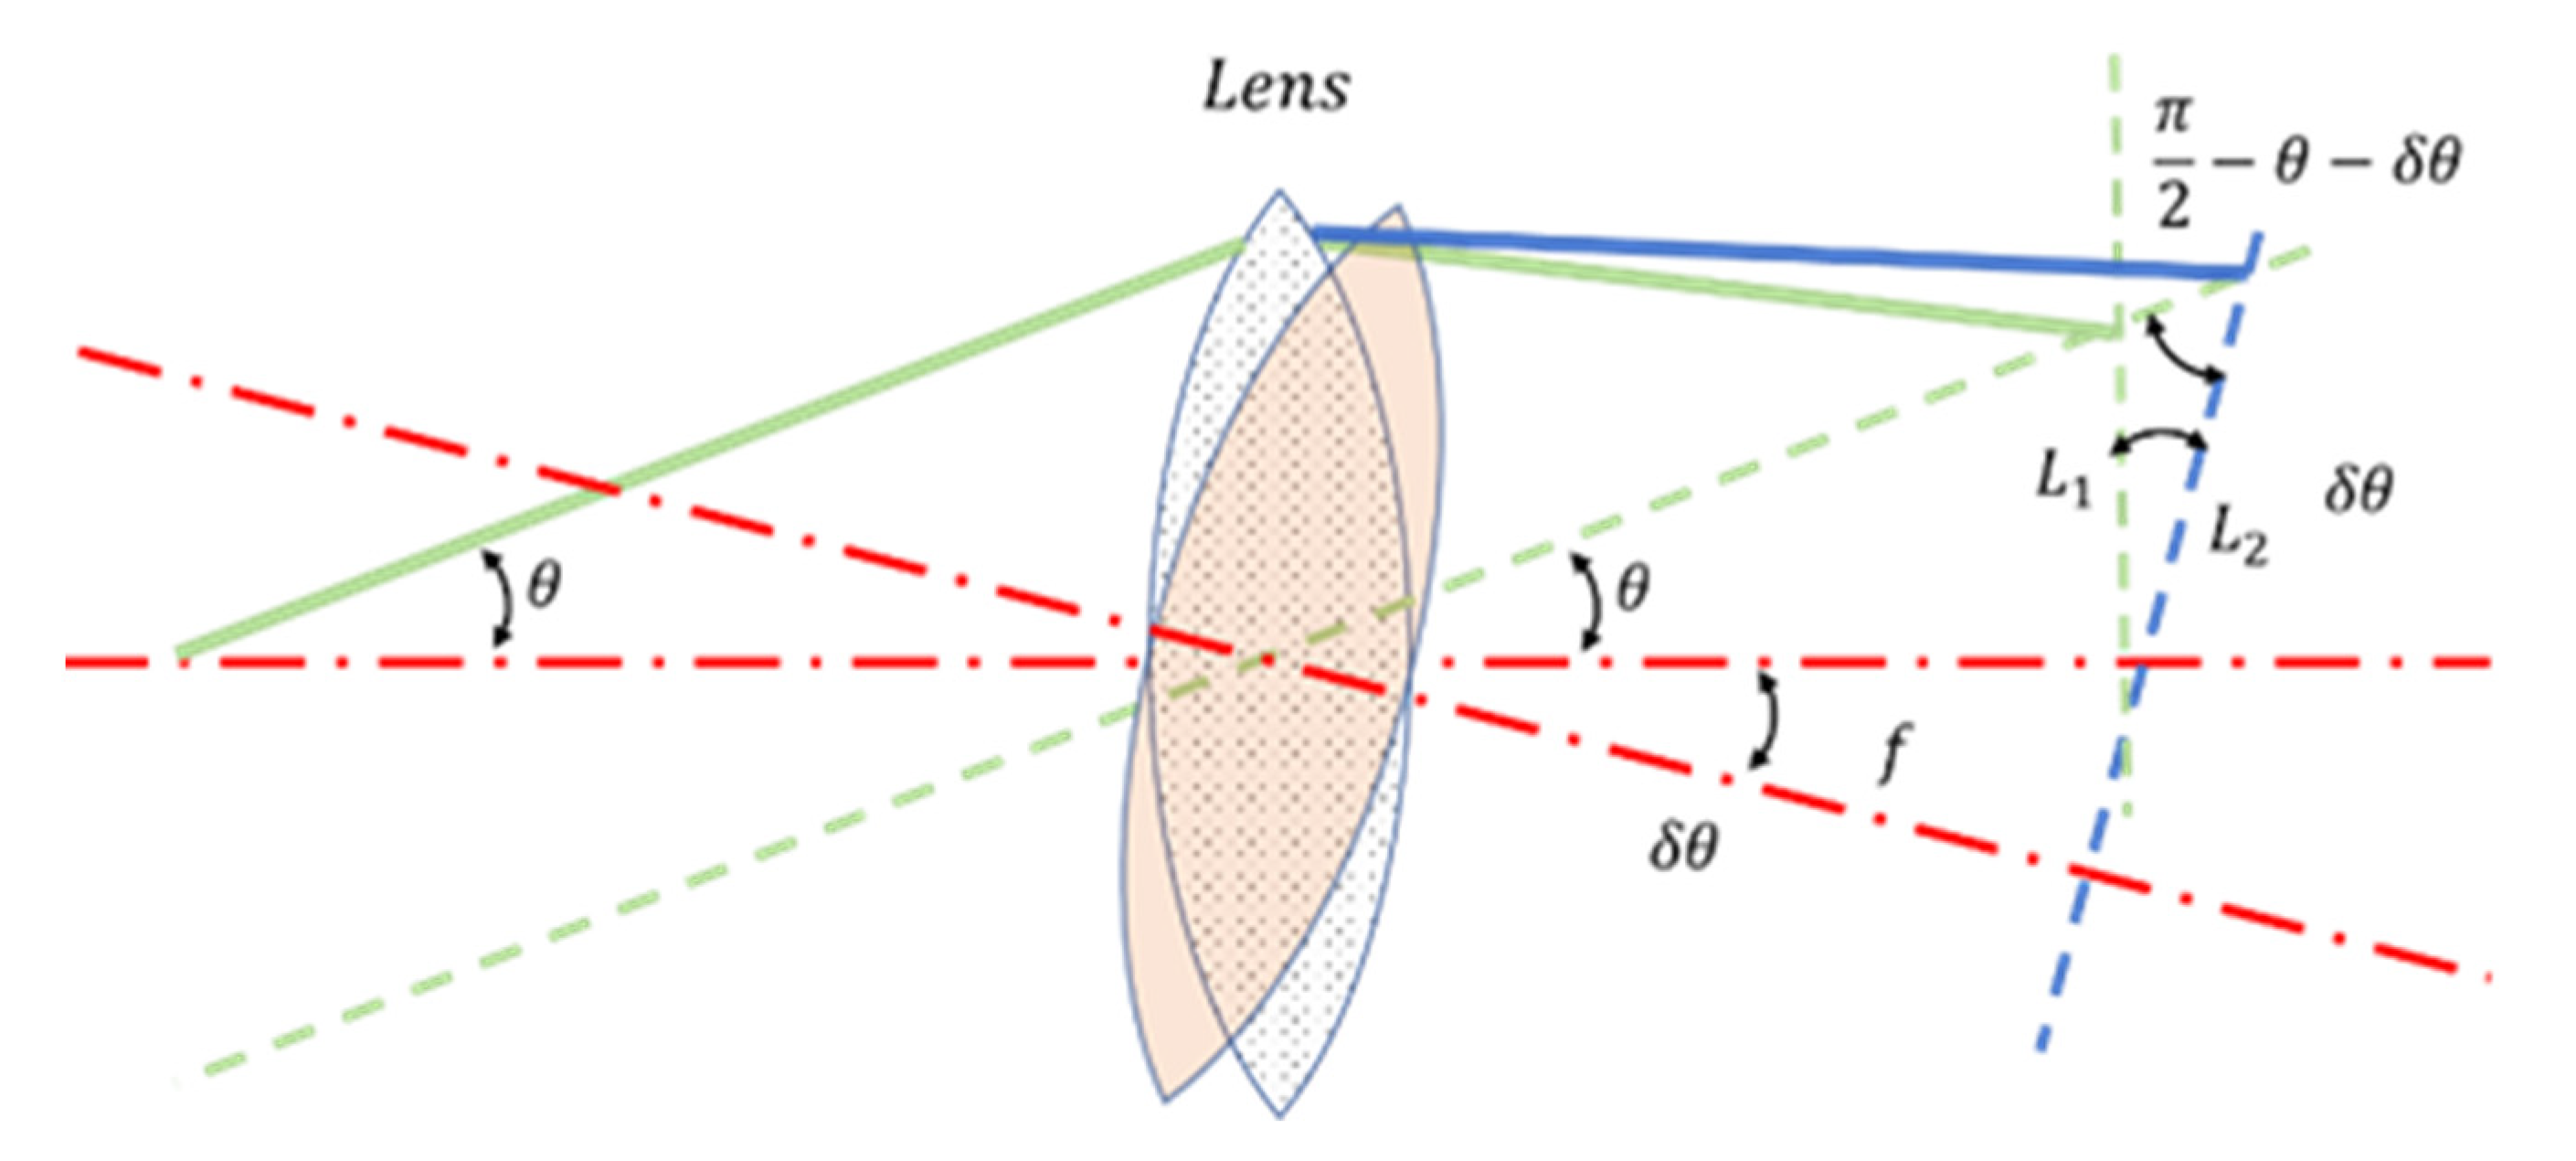
In Step 2, the rotation of the camera relative to the perfectly aligned position is determined. The relative positions of the focal plane (detector) and lens remain unchanged; therefore, the correction assembly can be modeled as a single lens (
Figure 2). Hence, the relationship between the incidence angle and the location of the laser spots is given by
Therefore, by rearranging Equation (3) we obtain
where
L1 and
L2 are the heights of the laser spots before and after rotation, respectively;
f is the focal length;
θ is the incidence angle before rotation; and
δθ is the angle of rotation.
2.3. Fine Adjustment Stage
In step 3, fine adjustment is achieved by monitoring the low-order wavefront, which is affected by the primary mirror and collimation of the correction lenses. During operation, the alignment of the telescope varies with the zenith angle. Therefore, the position of the laser spot array on the detector moves accordingly. Here, we introduce slope testing, where the change in intensity is used to approximate the gradient of the wavefront. Slope testing has good environmental adaptability and can be used to perform in situ, real-time mirror detection when the telescope is in operation. However, it cannot detect full apertures.
Using the Fourier complex light-field theory, the wavefront of a single wavelength
W(
u) can be expressed as
where
λ is the wavelength,
A is the amplitude of the single-phase spatial frequency component,
u is the spatial coordinate in the pupil,
f is the spatial frequency,
E is the aperture function, and
φ is the initial phase.
The intensity
I can be obtained by squaring the wavefront of the complex light-field mode, that is,
The change in intensity Δ
I can be expressed as
The slope measurement can be used to estimate the wavefront
using the equation
where
Wn(
u) denotes the
nth iteration of the wavefront in the fine alignment phase.
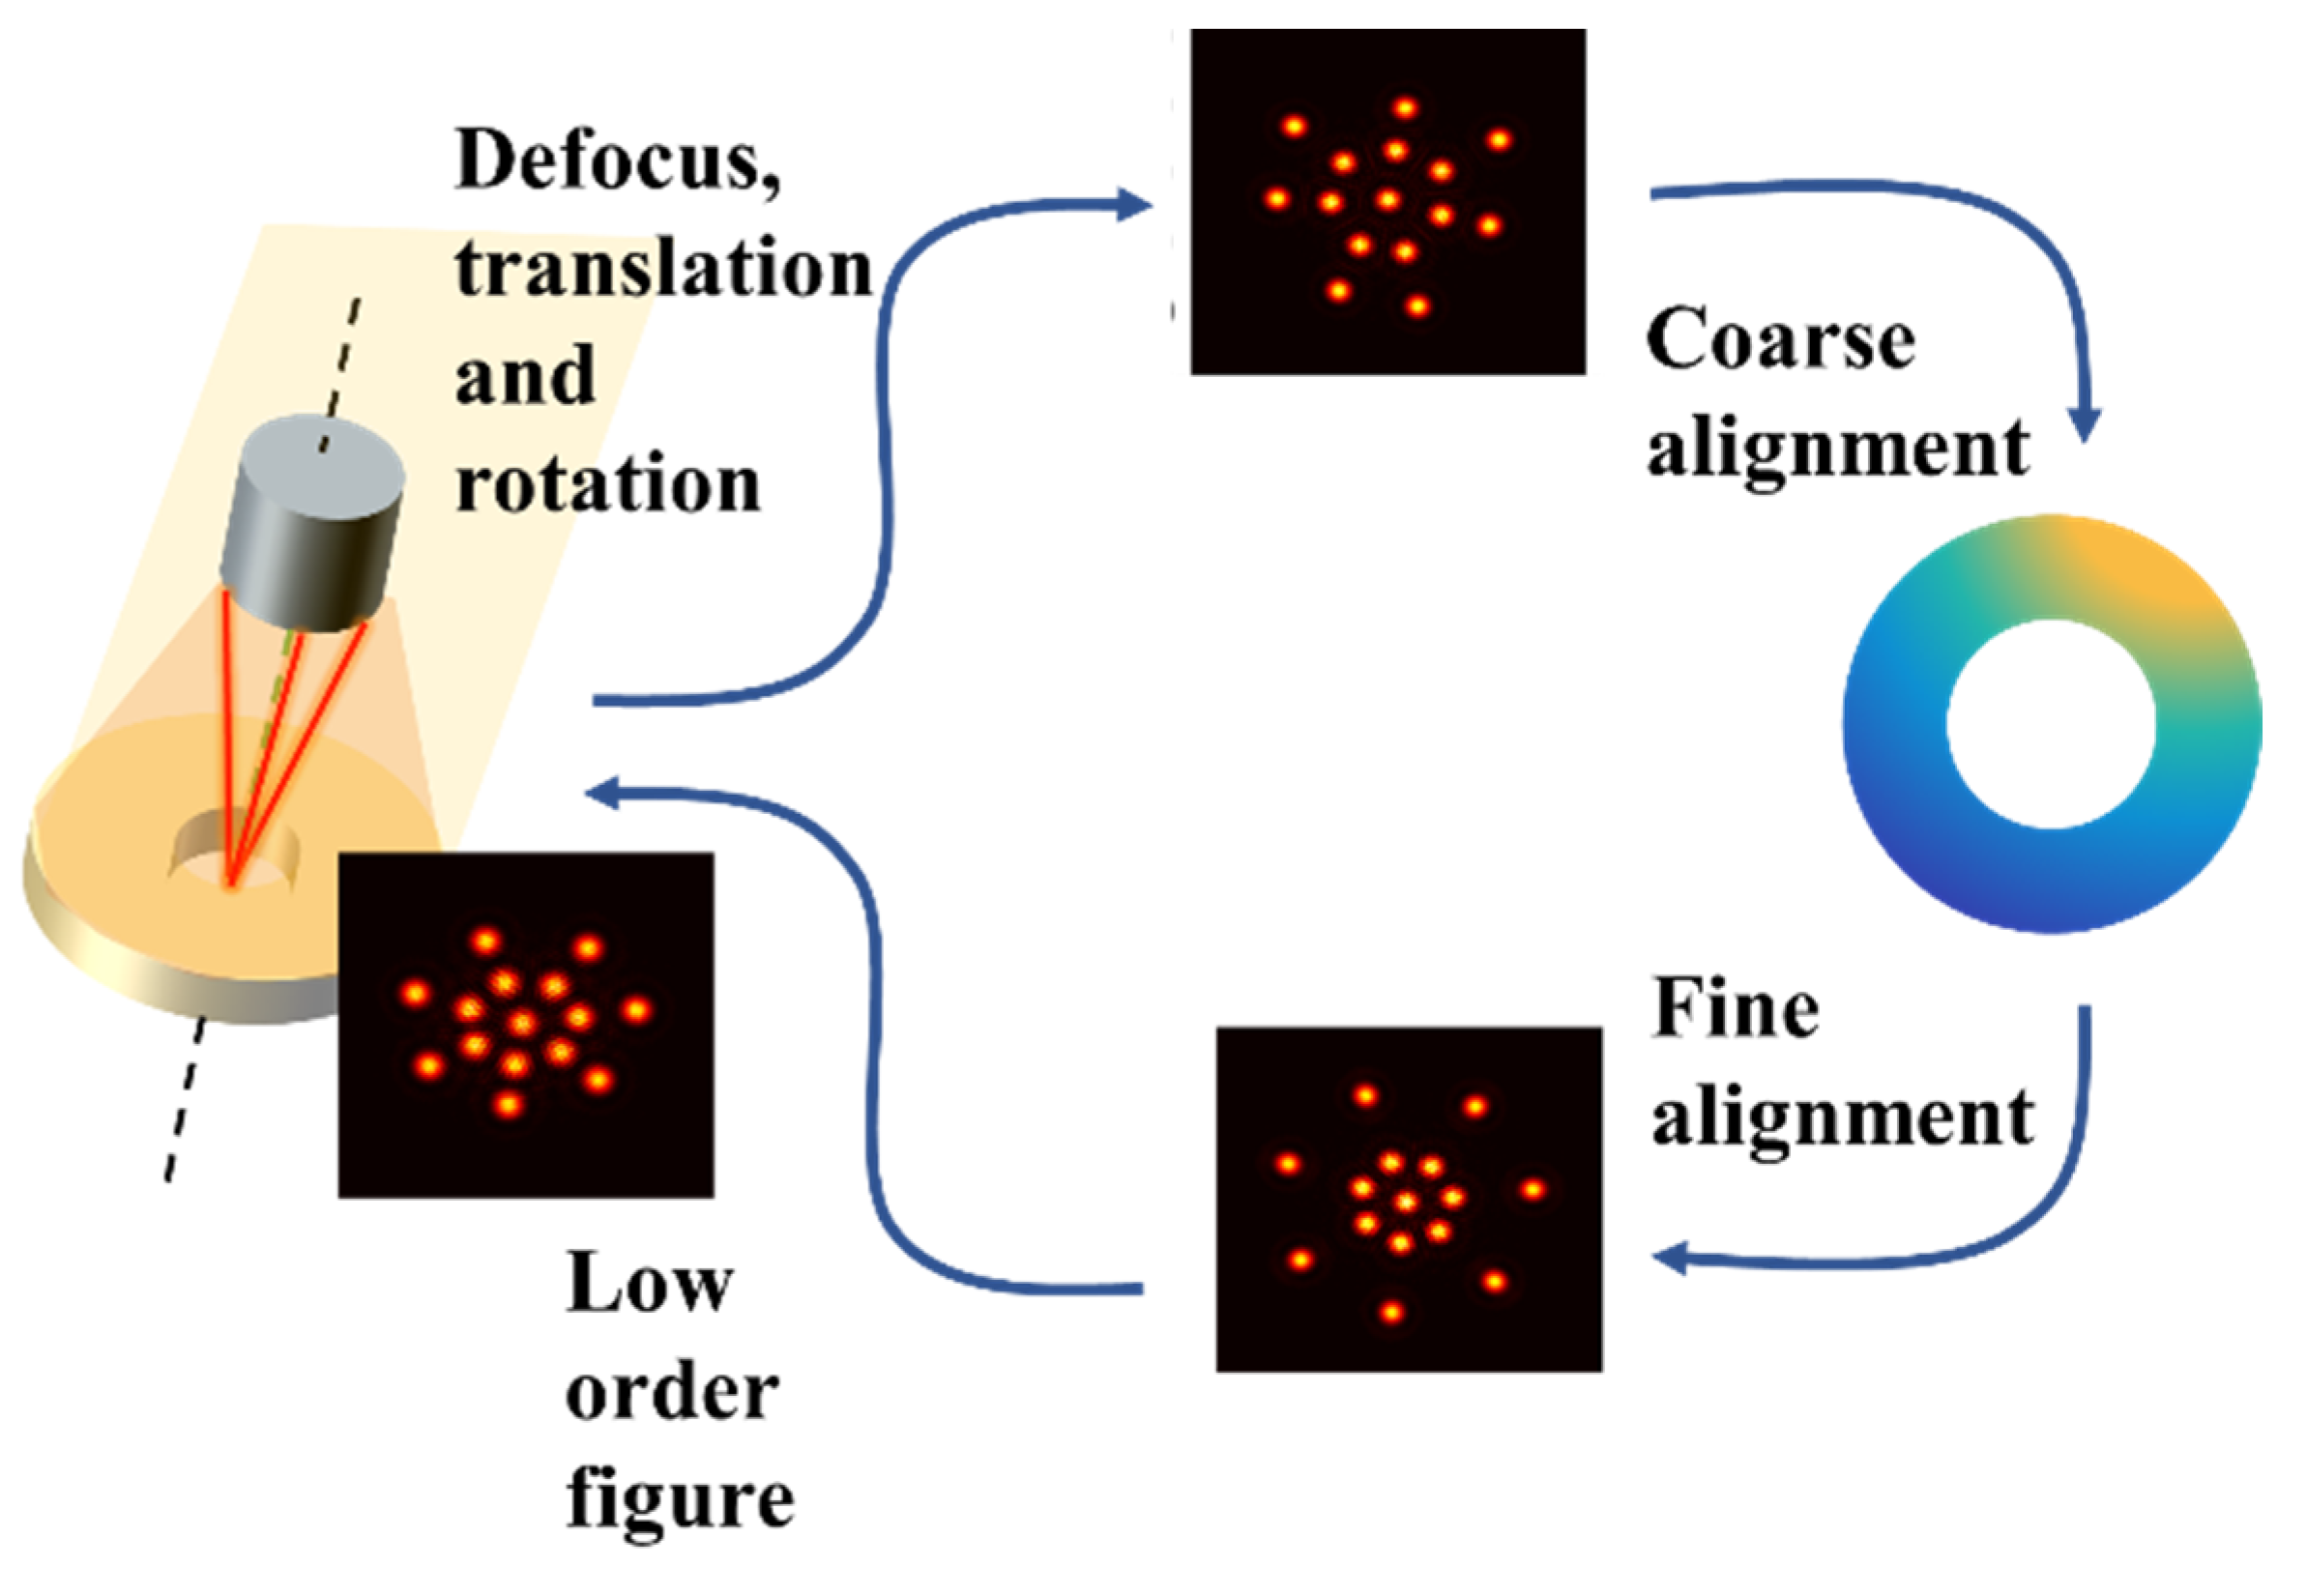
The telescope alignment process based on the internal measurement system is shown in
Figure 3.
2.4. Simulation of the Large Camera Alignment
As an example, the motion metrology of a large survey telescope was simulated, with the coarse adjustment and fine alignment processes applied. The simulation is processed under the layout of a survey telescope with a detector at primary focus, as shown in
Figure 3. The wavefront is corrected with the feedback of internal metrology.
First, the spots projected onto the detector by the photonic laser were simulated using the calculations for the spot positions shown in
Figure 3. Then, a low-pass image filter was used to process the images and measure the positions of the light spots. After coarse alignment, the spot positions were recorded by a detector, and this data was used to align the system. Next, the local slope was determined by offsetting different light points from the ideal position (calibration or theoretical calculation), with the misalignments of the system wavefront and the camera obtained via slope reconstruction.
The minus number of beams is 4, which identifies the degree of freedom in rotation of X(Rx), rotation of Y (Ry), and translation in Z. More beams only provide more details of the optical surface, which can help the telescope with mirror figure correction capability to check the radius or the low-order mirror figure (
Figure 3). Additionally, fewer beams mainly focus on the collimation of the telescope (
Figure 4).
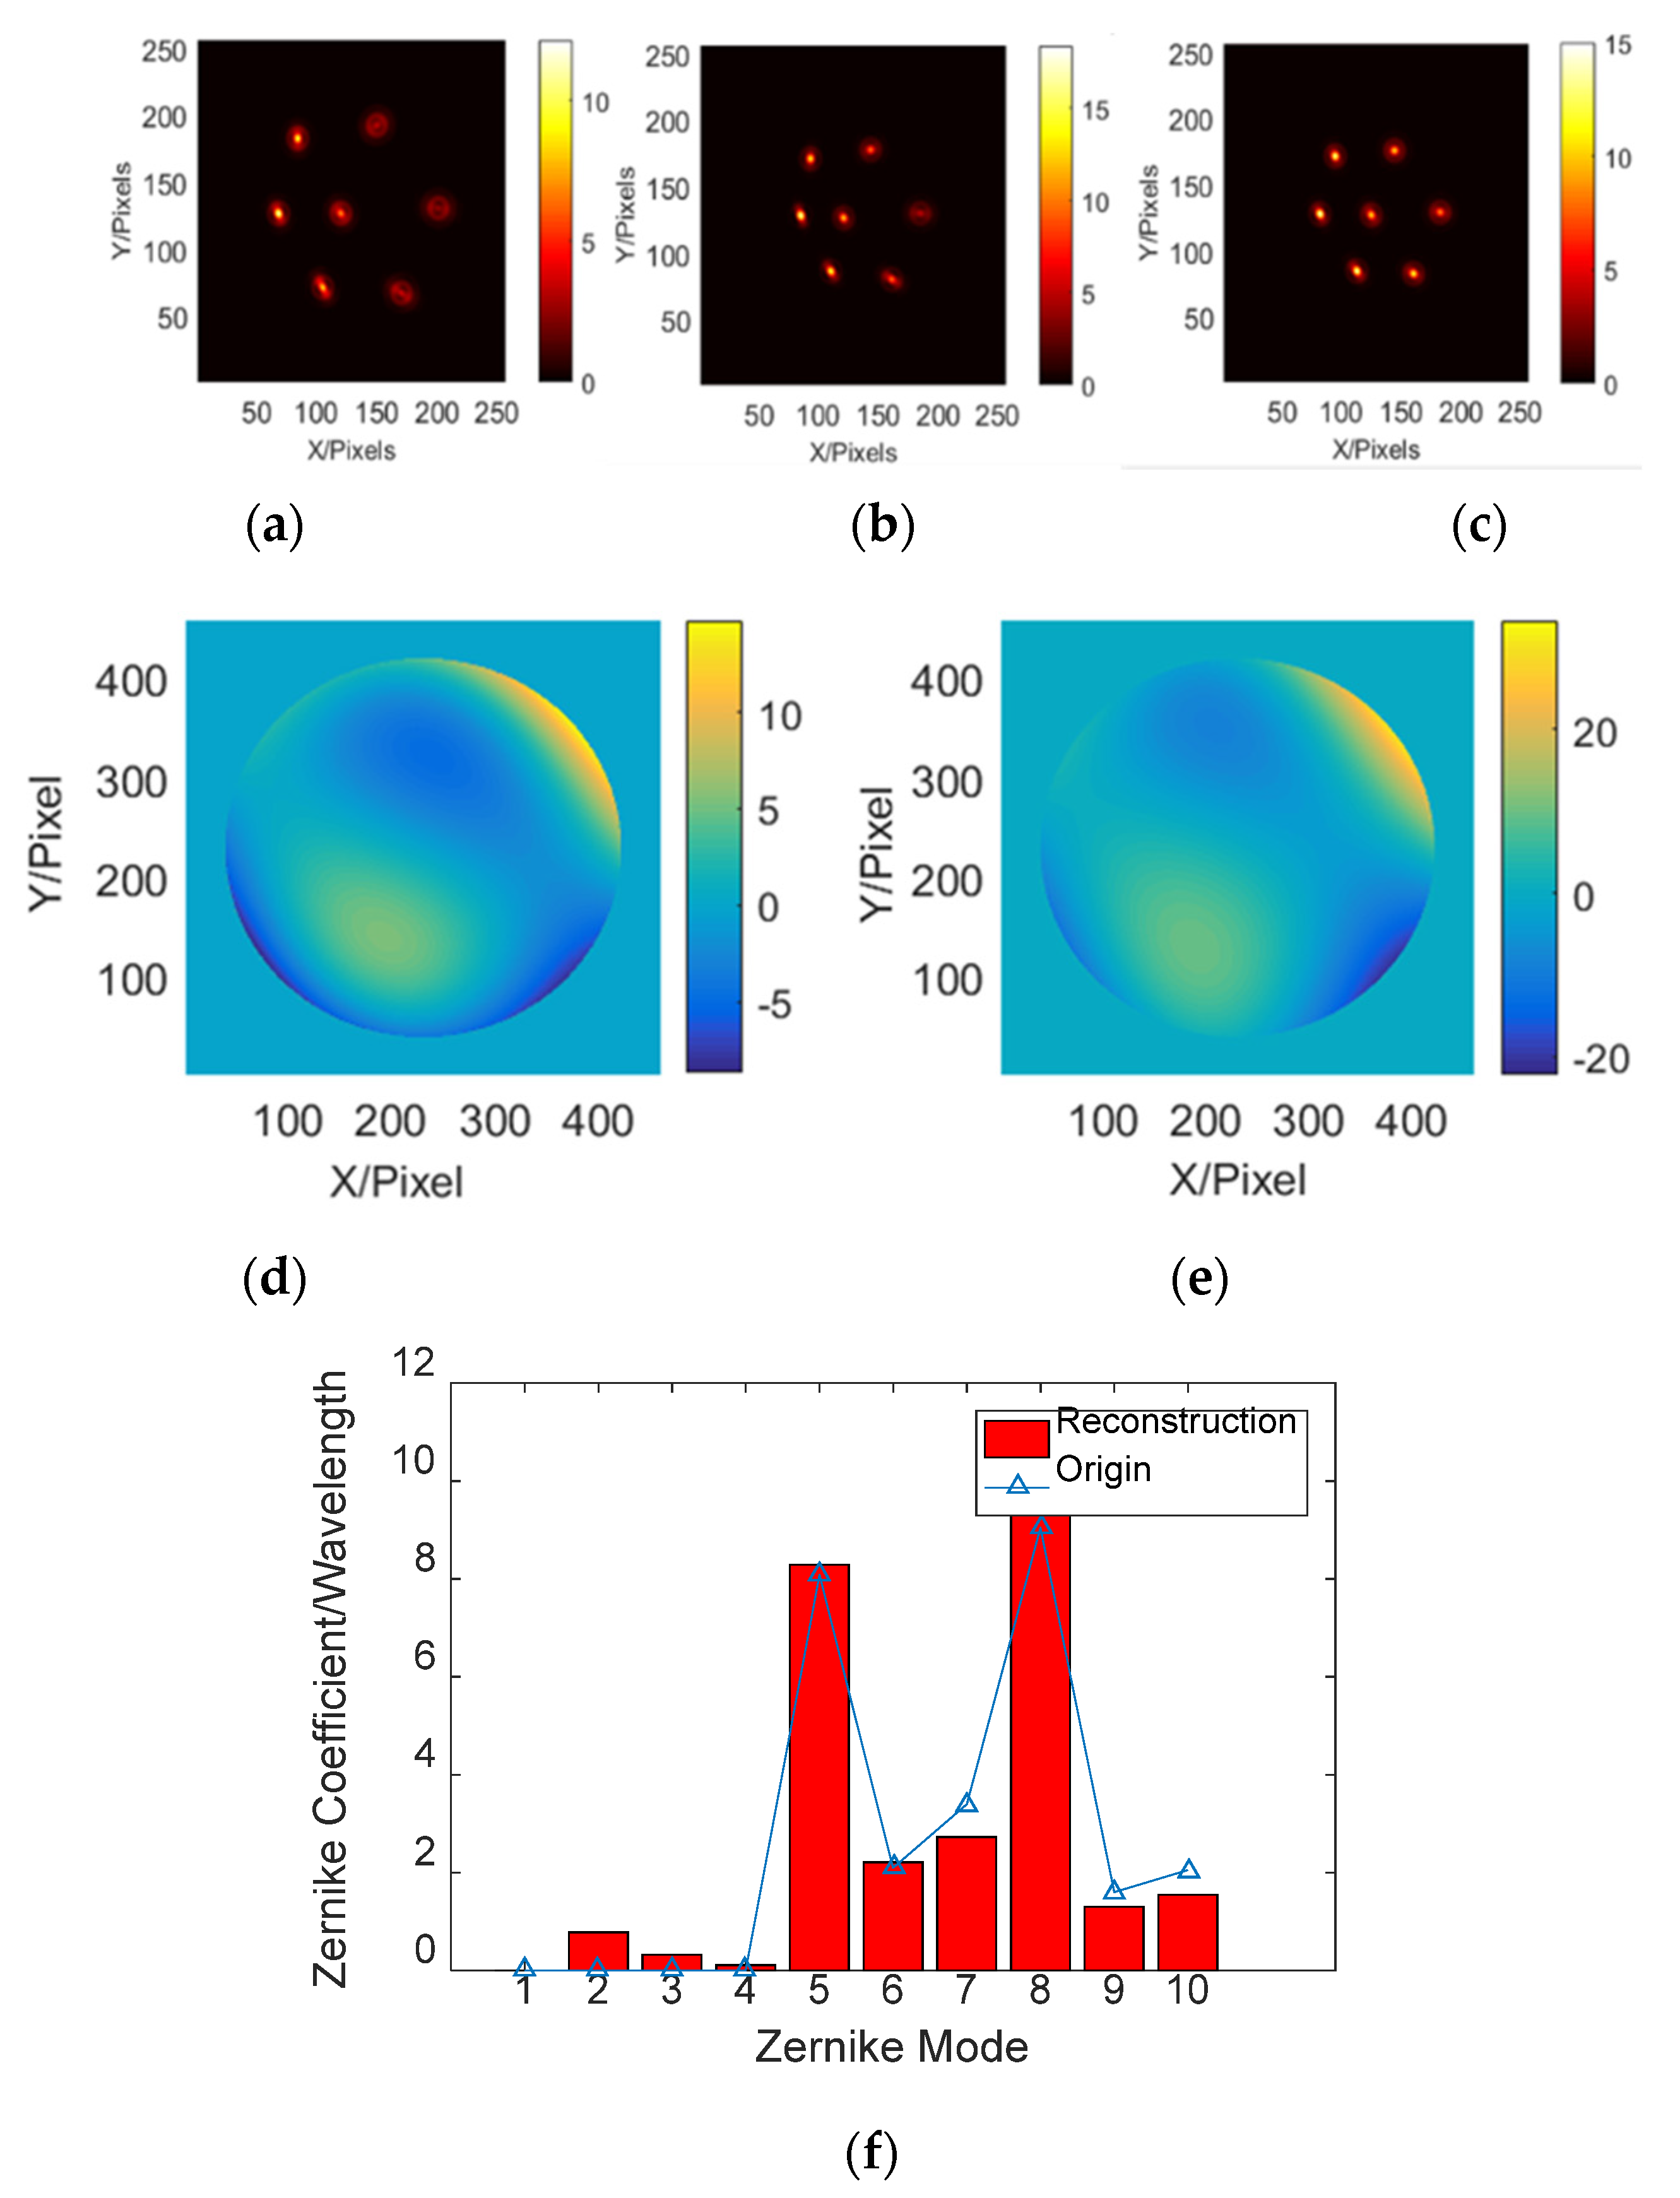
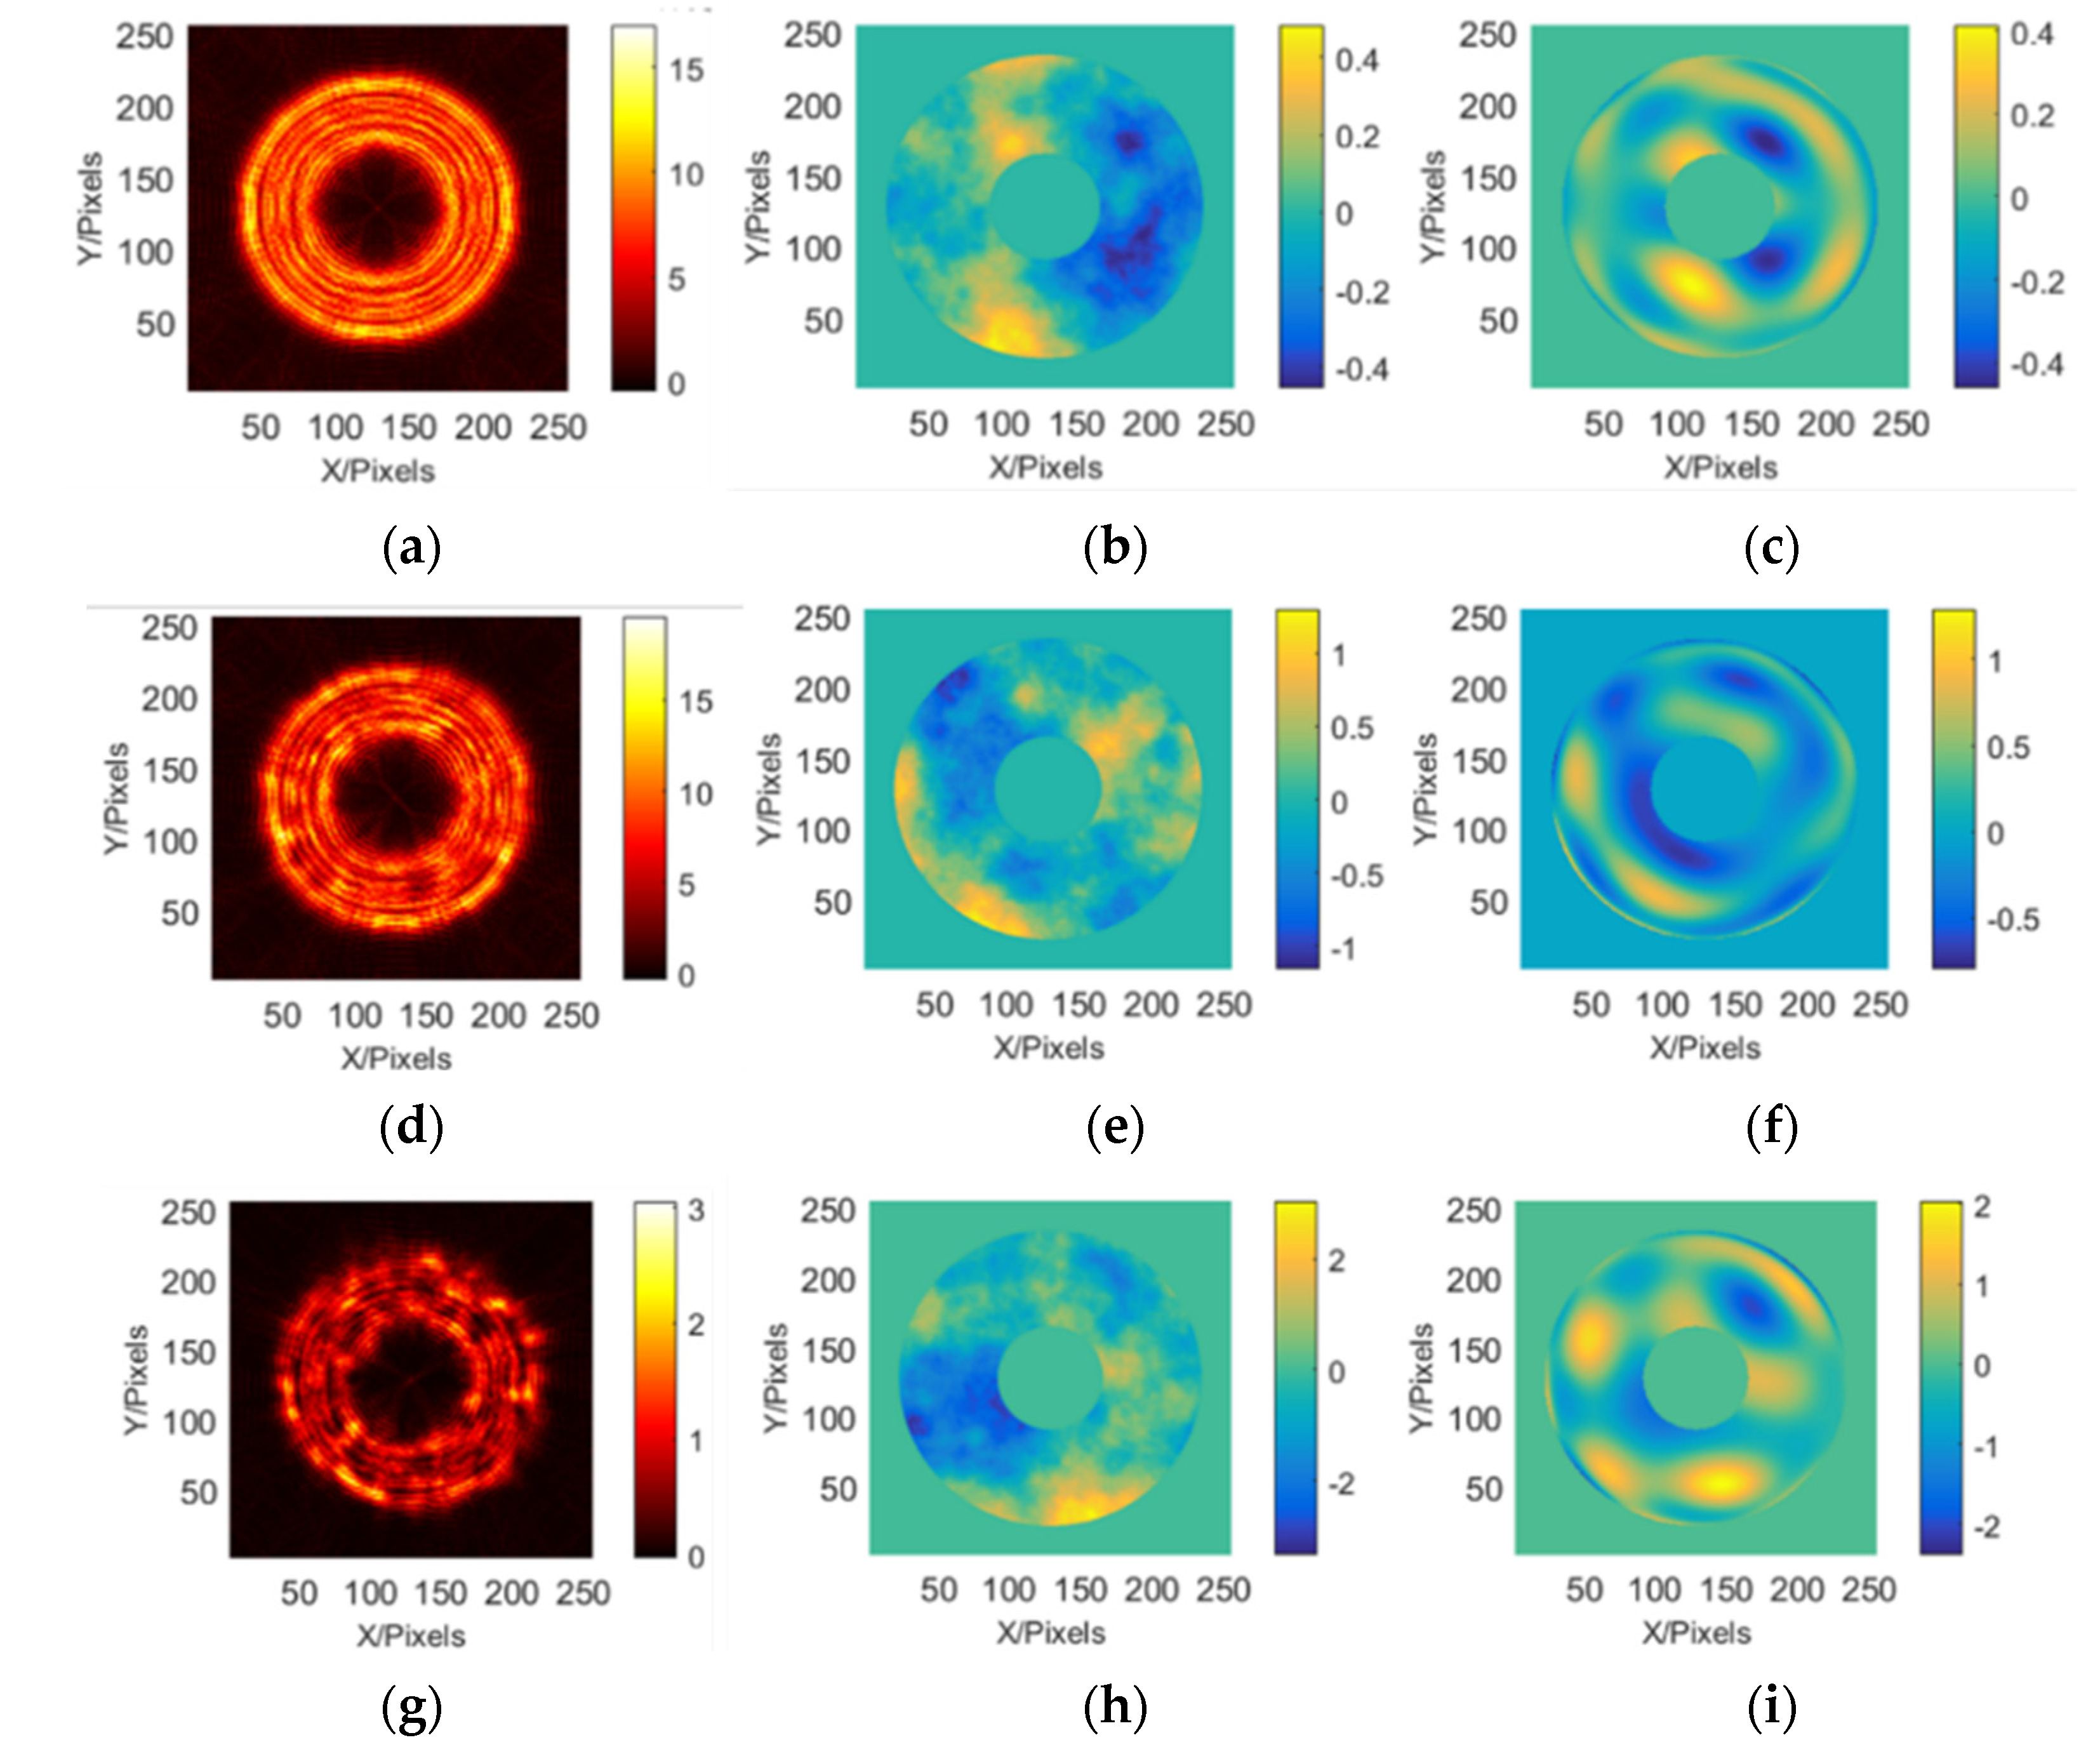
The locations of the spots on the detector were simulated to model the wavefront sensing process. The fine adjustments and figure calculations are shown in
Figure 4. The alignment accuracy was greater than 0.25λ (root mean square, RMS), where λ = 633 nm.
2.5. Combination of Internal Motion Metrology and Wavefront Sensing Systems
The internal motion metrology system can only estimate low-order wavefronts; hence, the high-order figures and camera observations were tested using a curvature sensing system.
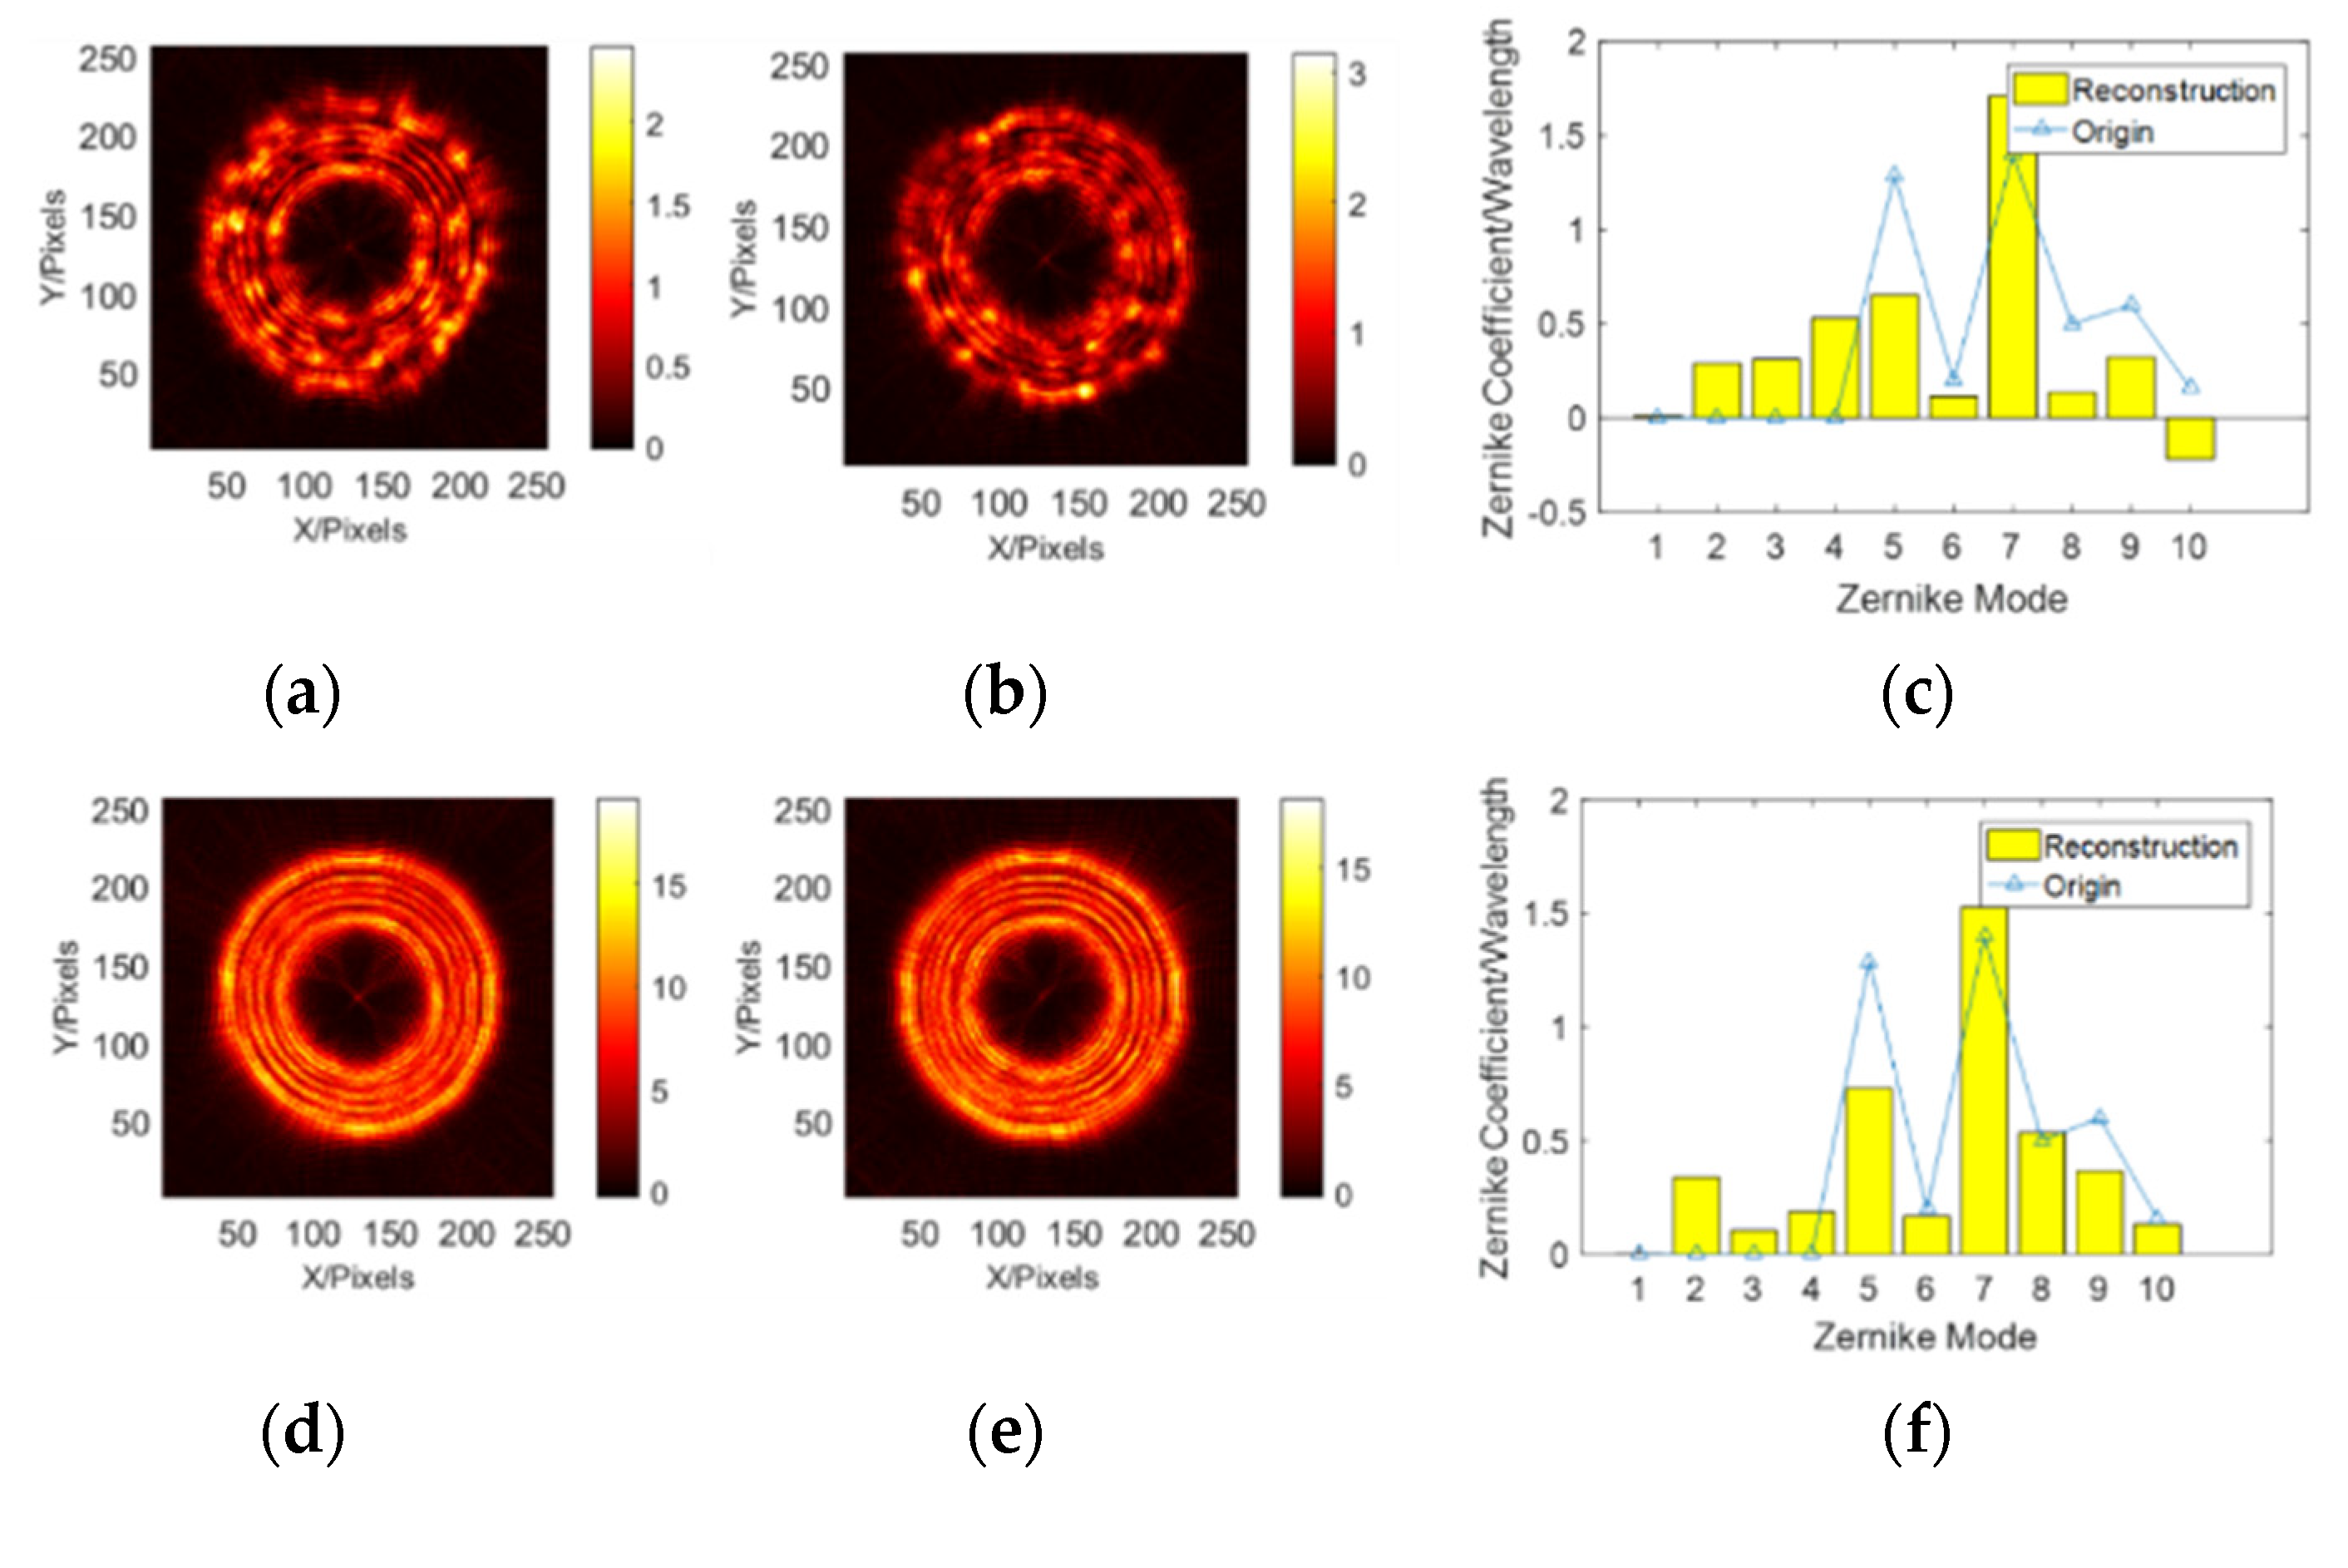
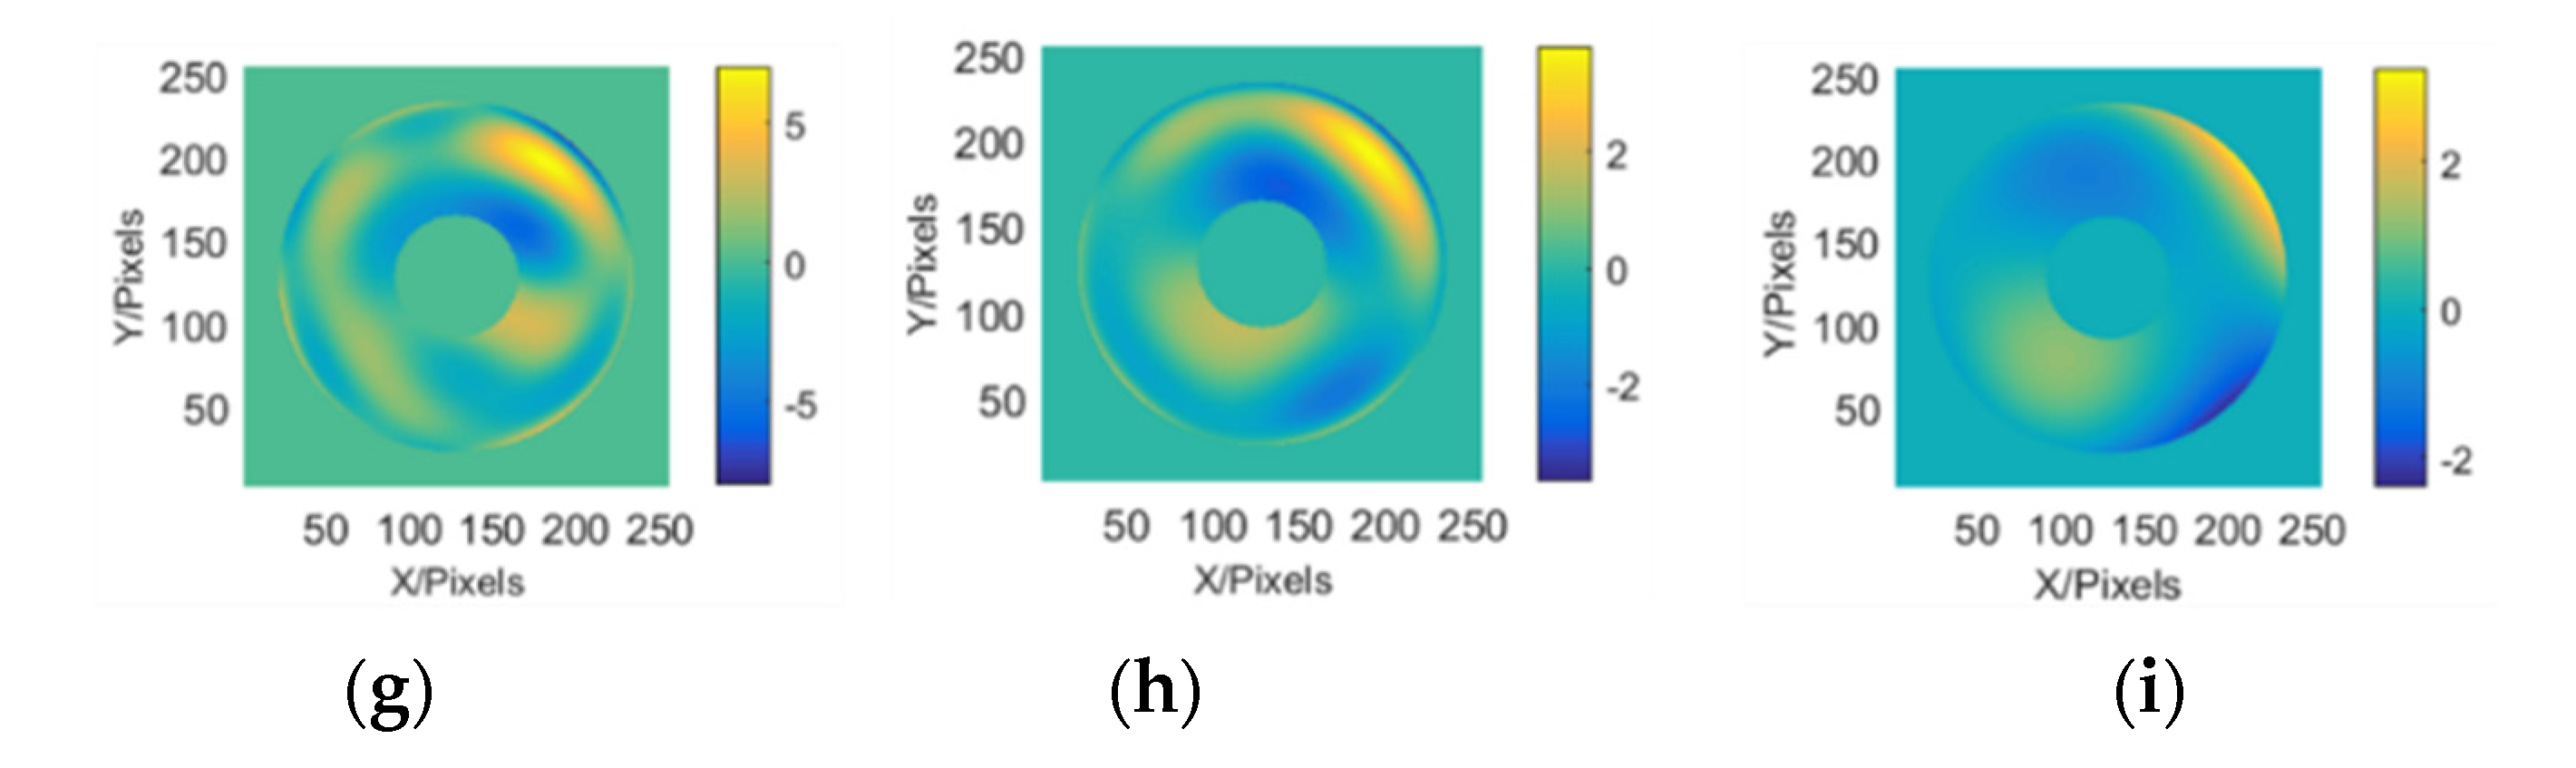
Wavefront aberrations owing to motion and atmospheric disturbances can be distinguished using the internal motion metrology system. Hence, it is not necessary to integrate over a long period of time to smooth out the effects of air turbulence. Atmospheric jitter is averaged using multiple guide stars in the near field. Therefore, the ability to suppress atmospheric disturbances is increased because the actual integration time through the superposition of defocused star point images remains unchanged. Furthermore, this can effectively improve the accuracy of the curvature sensing process.The results for camera observations are as shown in
Figure 5.
As shown in
Figure 6, the alignment accuracy was greater than 0.1
λ (RMS), where
λ = 633 nm. The corresponding wavefront diagrams in
Figure 6 show that this method can effectively suppress the degradation of the accuracy of the wavefront solution by atmospheric turbulence. The camera recordings under different coherence lengths are shown in
Figure 6, and the donut influence is illustrated.
3. Experimental Verification
The system’s flexibility can be increased, and its volume and weight can be reduced, as well as its costs, by using a fiber-linked internal motion metrology system. Based on this architecture, simulation analysis (in
Section 2) and experiments were conducted (in
Section 3).
Firstly, wavefront curvature sensing has been studied in previous work [
18]. Then, the experimental set up is similar to the simulation case in
Figure 3. As discussed in
Section 2, the combination of internal metrology and wavefront seeing can realize more detailed sensing, to achieve wider measurement rang in both spatial and temporal frequencies domain.
3.1. Coarse Alignment
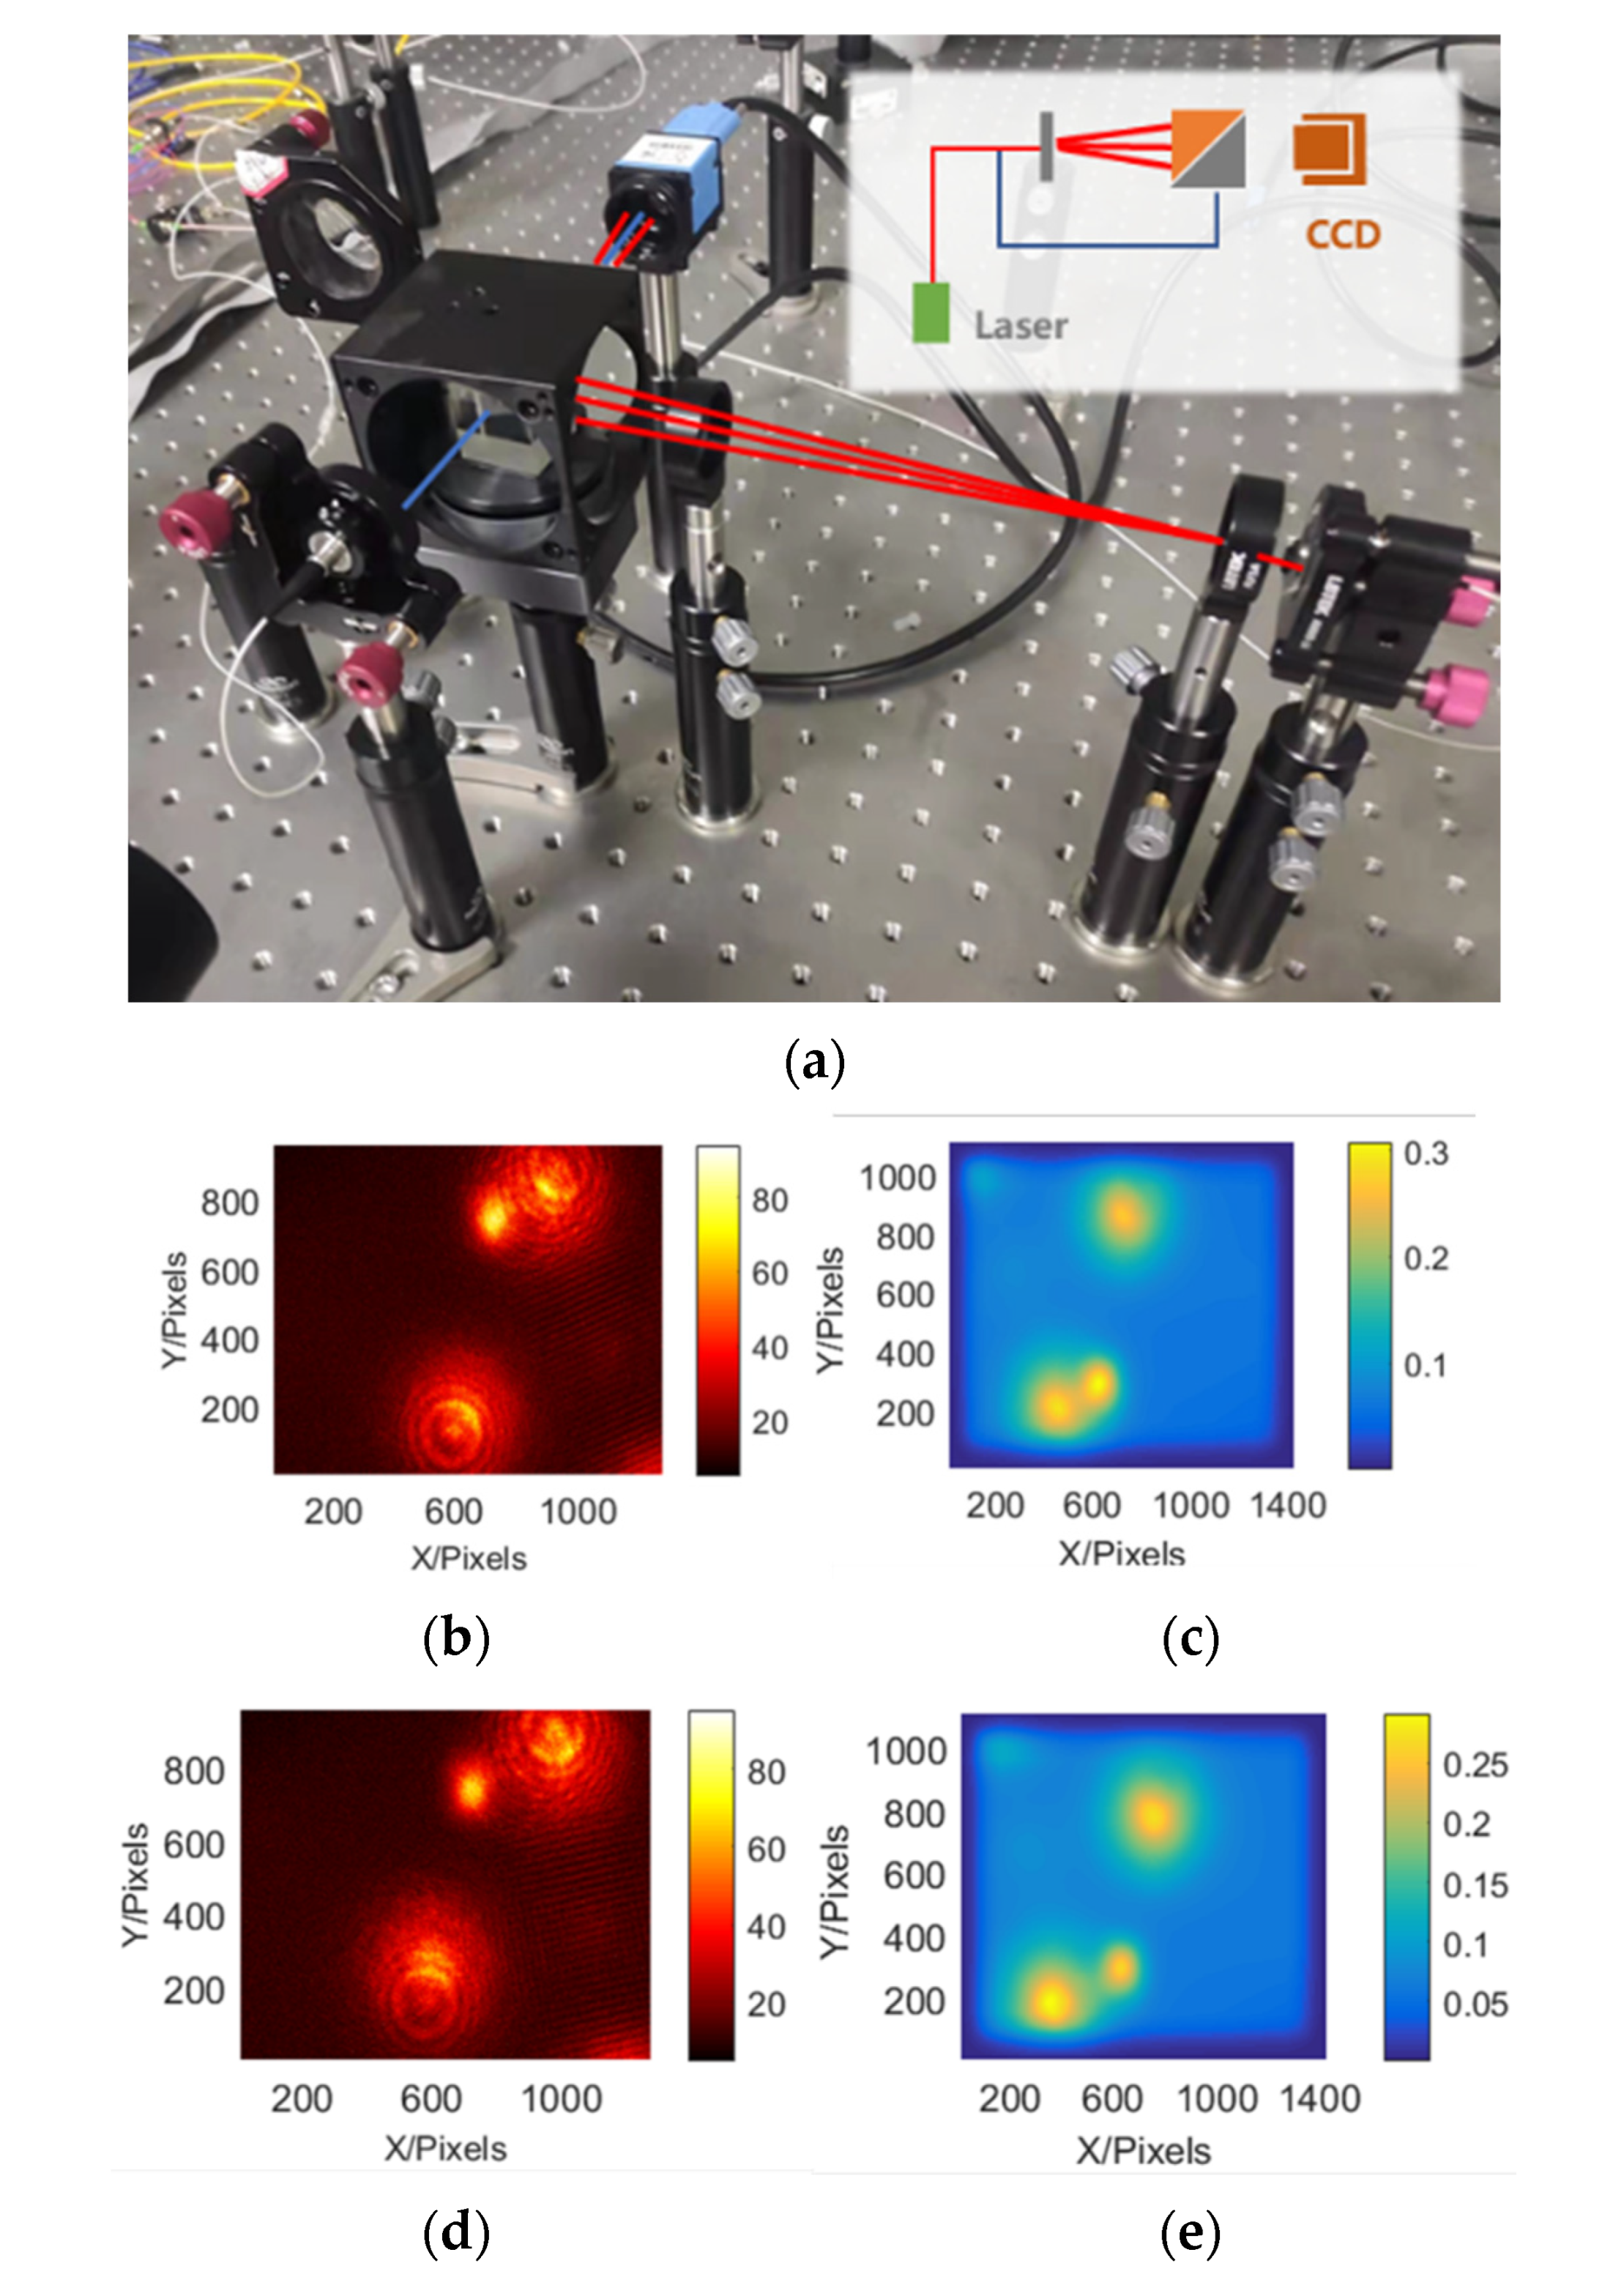
As shown in
Figure 7a, the coarse-alignment test system comprised a light source, a fiber with a 1:1 coupler, and a beam-splitter grating. The beam-splitter grating was used as a four-point photonic laser beam projector, which projected four Gaussian beams onto the detector. The test was divided into three parts. First, the accuracy of the position estimation was verified using a camera and a precision stage (i.e., cross-comparison image positioning and mechanical positioning). Second, the accuracy of the rotation angle estimation was verified using a turntable. Third, using sky observations, coupled results for the atmospheric disturbances and camera observations were obtained via wavefront sensing of the star images.
The results obtained using the motion mechanism and the motion metrology system were cross-checked. The light points were extracted from the defocused star point images and were later used for the subsequent sensing analysis. One of the laser spots was fixed, whereas the other spots rotated about a fixed axis, as shown in
Figure 7. The location and rotation estimates were accurate to within 10 μm and 5 arcsecs (enlarged to 0.8 m), respectively.
3.2. Fine Adjustment
In practical applications, the system decenter is adjusted first, followed by the defocus, and finally the tilt. Once these corrections have been completed, the residual error of the system is compared to the set residual error. If the residual error of the system is greater than the set residual error, then the next correction iteration is performed.
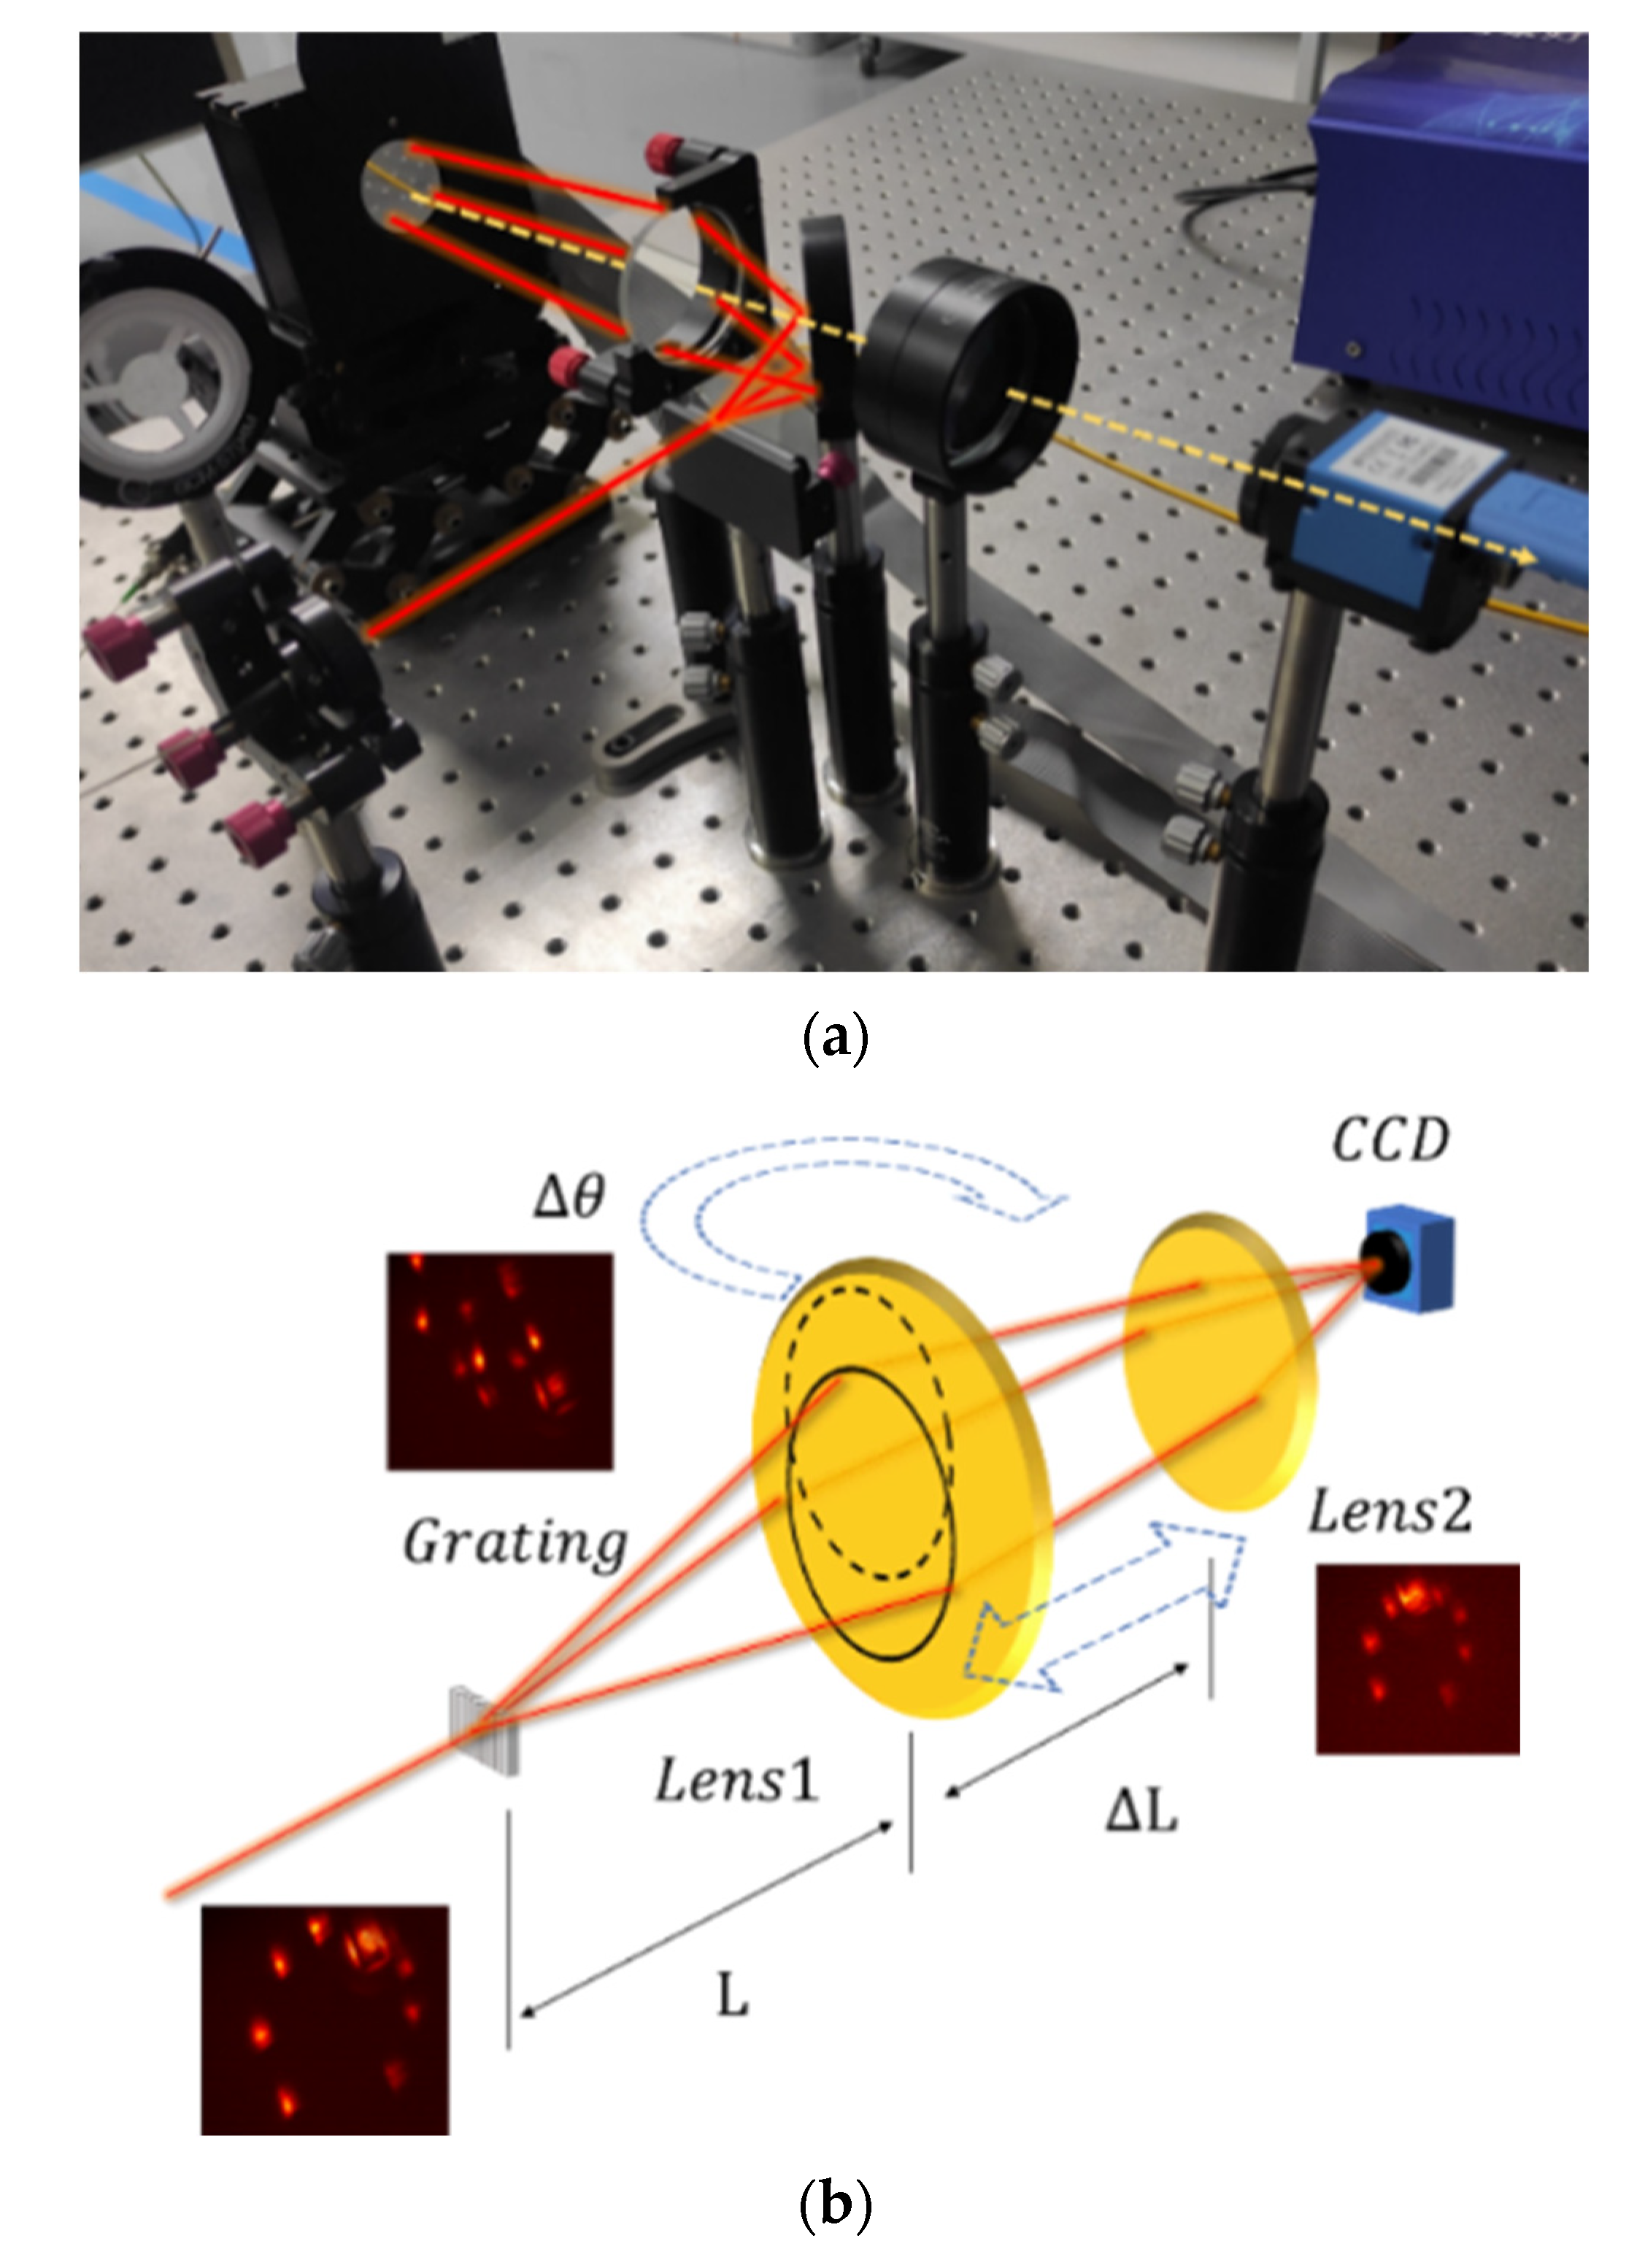
In the fine adjustment test, several lenses were used to simulate the correction lenses, a flat lens was used to simulate the primary mirror, and a charge-coupled device (CCD) was used to simulate the camera detector. The misalignment of the lenses was corrected, and the alignment was cross-checked using a Hartman sensor. The experimental results for low-order aberration detection are shown in
Figure 8. The estimation accuracy was greater than 0.1
λ, where
λ = 633 nm.
4. Conclusions
For a relative “small aperture” telescope, there is no need to build a specific system to align the system due to the smaller mass and higher stiffness. This internal motion monitor system is designed to bridge the gap between the high alignment accuracy requirement and the lack of a feedback loop to realize it. The internal motion metrology system can be used for coarse alignment to suppress vignetting to the level required for wavefront sensing. The system was applied for position feedback and closed-loop adjustment of a camera to achieve finer alignment. Moreover, the wavefront sensing system was used to detect the figure of a large mirror (an optical system other than the camera).
When wavefront sensing cannot be used, for example, when the sky area under observation changes rapidly, the internal motion data can be combined under the same working conditions to maintain the alignment of the system and improve the observation efficiency. This helps detect the primary focus component and allows the telescope to be calibrated during operation, which, in turn, helps prevent deviations due to shutdown calibration. The accuracies of the location and rotation estimates were greater than 10 μm and 5 arcsecs, respectively. The low-order spatial frequency error of the system (introduced by system misalignment and mirror deformations) was investigated. The accuracy was above 0.1λ (RMS), where λ = 633 nm. The results show that the spatial frequency can be improved by adjusting the diffractive element parameters. Therefore, the proposed method is applicable for in situ rapid calibration of large survey telescopes, ensuring that observation time is used effectively and enhances the quality of data.

 ,
, 


