1. Introduction
Optical fiber sensors are increasingly applied in different areas, from physical/mechanical sensing to immunosensing and chemical sensing approaches [
1]. Considering the latter approaches, optical fiber sensors present important advantages in hormone detection [
2], biomarker assessment [
3], determination of chemical compound concentrations [
4], bacterial detection [
5] and even disease detection [
6]. In this context, their advantages, such as their compactness, electromagnetic immunity, multiplexing capabilities and integration between the sensor element and data transmission, are key features in such sensor approaches, directly related to the widespread use of optical fiber sensor technologies [
7]. It is also worth mentioning that the possibility of remote sensing and galvanic isolation enables their use in environmental sensing applications [
8].
Sensor applications in the medical field are always a current demand in the biomedical field, where the use of such devices is becoming increasingly important due to major advances in sensor technology and assistive devices [
9]. Despite the myriad of applications in the biomechanical field (as discussed in [
10]), the use of such sensors in medical condition assessment [
11], hormone detection and general immunosensing [
12] is also highly desirable, not only for early diagnosis, but also for the treatment of diseases. In similar developments, the demands related to the detection of general chemical compounds and biological components have sharply increased due to the progress in environmental pollution mitigation and the development of sustainable technologies [
13]. Furthermore, the widespread use of the Internet of Things, in conjunction with the digitalization in agriculture, aquaculture and general food production, has also led to the development of sensors for biological and chemical compound detection.
Despite the different approaches to optical fiber sensing thoroughly discussed and proposed over the years, surface plasmon resonance (SPR)-based sensors are one of the main optical fiber sensing technologies for biochemical sensor development [
14]. These sensors rely on the interaction between photons and the electrons of a metal layer, leading to a group oscillation of these surface plasmons [
15]. Thus, there is a propagation of surface waves in the intersection between the metal (thin metal film) and the dielectric medium (optical fiber). The use of optical fibers for SPR sensor development provides significant advantages, including compactness and easy integration of the fiber into different structures and geometries [
16].
The general classification of biosensors includes catalytic and affinity sensors. The differences between both sensor types are related to the operation principle of the sensors, where the former sensor type is related to the use of a biocatalyst for the achievement of a steady-state concentration of a transducer-detectable species. In addition, affinity sensors are based on a receptor molecule that irreversibly binds to the desired analyte [
17], which can be, for example, antibodies (for immunosensors) and aptamers (for aptasensors) [
18]. If biosensors are integrated into optical fibers in the SPR approach, the principle of optical signal variation is based on the refractive index variations in the intersection between the metallic film and the optical fiber [
17]. Therefore, regardless of the approach to molecular detection or the employed bioreceptor, SPR-based biosensors are essentially refractometers in optical fibers, used to monitor the external refractive index, where the binding molecules or analytes lead to refractive index variations in the coating layer, which can be selectively tuned through fiber functionalization to increase the selectivity [
19]. Moreover, the changes in the external refractive index lead to a shift in the transmitted spectrum of the sensor device [
20].
SPR sensors in optical fibers have been thoroughly investigated with different geometries and assembly options. In this regard, long-period gratings (LPGs) and tilted fiber Bragg gratings (TFBGs) are used as grating devices in conjunction with the SPR signal to obtain highly sensitive sensors [
21,
22]. In addition, different geometries are also related to the region where the metallic film is applied, where there is the possibility of applying the metallic film at the tip of the optical fiber [
4] or in the lateral section of the fiber [
3]. In the latter approach, the metallic film is applied in a region with a structural modification of the fiber to enable the light interaction with the metallic film. However, aiming at an easier fabrication, in conjunction with the possibility of obtaining lower-cost sensors, D-shaped optical fibers are proposed for SPR sensing approaches [
23]. Due to their larger dimensions, polymer optical fibers (POFs) are an attractive option for D-shaped SPR sensors since the D-shape fabrication and light coupling are easier to carry out due to the large diameters of the POFs [
2].
Signal analysis of an SPR-based optical fiber sensor is carried out following different approaches, where the spectral feature variations are analyzed as a function of the refractive index variation. For this reason, the intensity variation in the peaks/dips of the spectrum can also be related to the refractive index (or analyte) variations [
24]. It is also worth mentioning that the intensity variations are generally sensitive to fluctuations in the light source optical power. Thus, wavelength shift analysis of SPR signatures is conventionally employed as it provides a more reliable response due to the insensitivity to optical power fluctuations. In addition, different signal processing methods, such as filtering curve envelopes and nonlinear transformations, can increase the reliability and general performance of SPR sensors [
2]. Multiple parameters can be used in the sensor performance analysis, including sensitivity, selectivity, limit of detection (LOD), accuracy, signal-to-noise ratio (SNR), repeatability and reproducibility, where these parameters can be analyzed as a function of the figure of merit (FoM), generally employed in SPR sensor analysis and comparison.
A current trend in optical fiber sensor development is the use of machine learning approaches for the extension of sensors’ capabilities and overall performance [
25]. In this regard, supervised approaches are commonly employed for the assessment of different parameters in distributed approaches [
26], as well as in soft sensor development using one measured parameter to estimate another [
27]. In addition, the use of neural networks, in conjunction with the distributed optical fiber developments, increases the sensor capability in multiparameter sensing, and spatial resolution [
28]. In unsupervised approaches, the data are not labeled, and clustering is performed to extract the important features in the sensors’ responses that can be used in the signal processing [
29].
This paper presents the development, analysis and application of SPR-based sensors in POFs. In this case, D-shaped POF samples were coated with a gold-palladium (Au-Pd) film, where the variability in the SPR signal was analyzed. Then, the sensors were subjected to refractive index variations, and the responses were compared and analyzed as a function of different spectral features and parameters. The experimental analysis enabled the application of machine learning approaches for the enhancement of the sensors’ performance using combinations of different features of the SPR spectra. In addition, the machine learning algorithms also resulted in different models of spectral feature responses as a function of the refractive index. Therefore, the contributions of this work are not only spectral feature modeling and multifeature analysis of SPR-based sensors, but also a general approach and model for SPR sensor responses with enhanced accuracy and overall sensing performance.
2. Materials and Methods
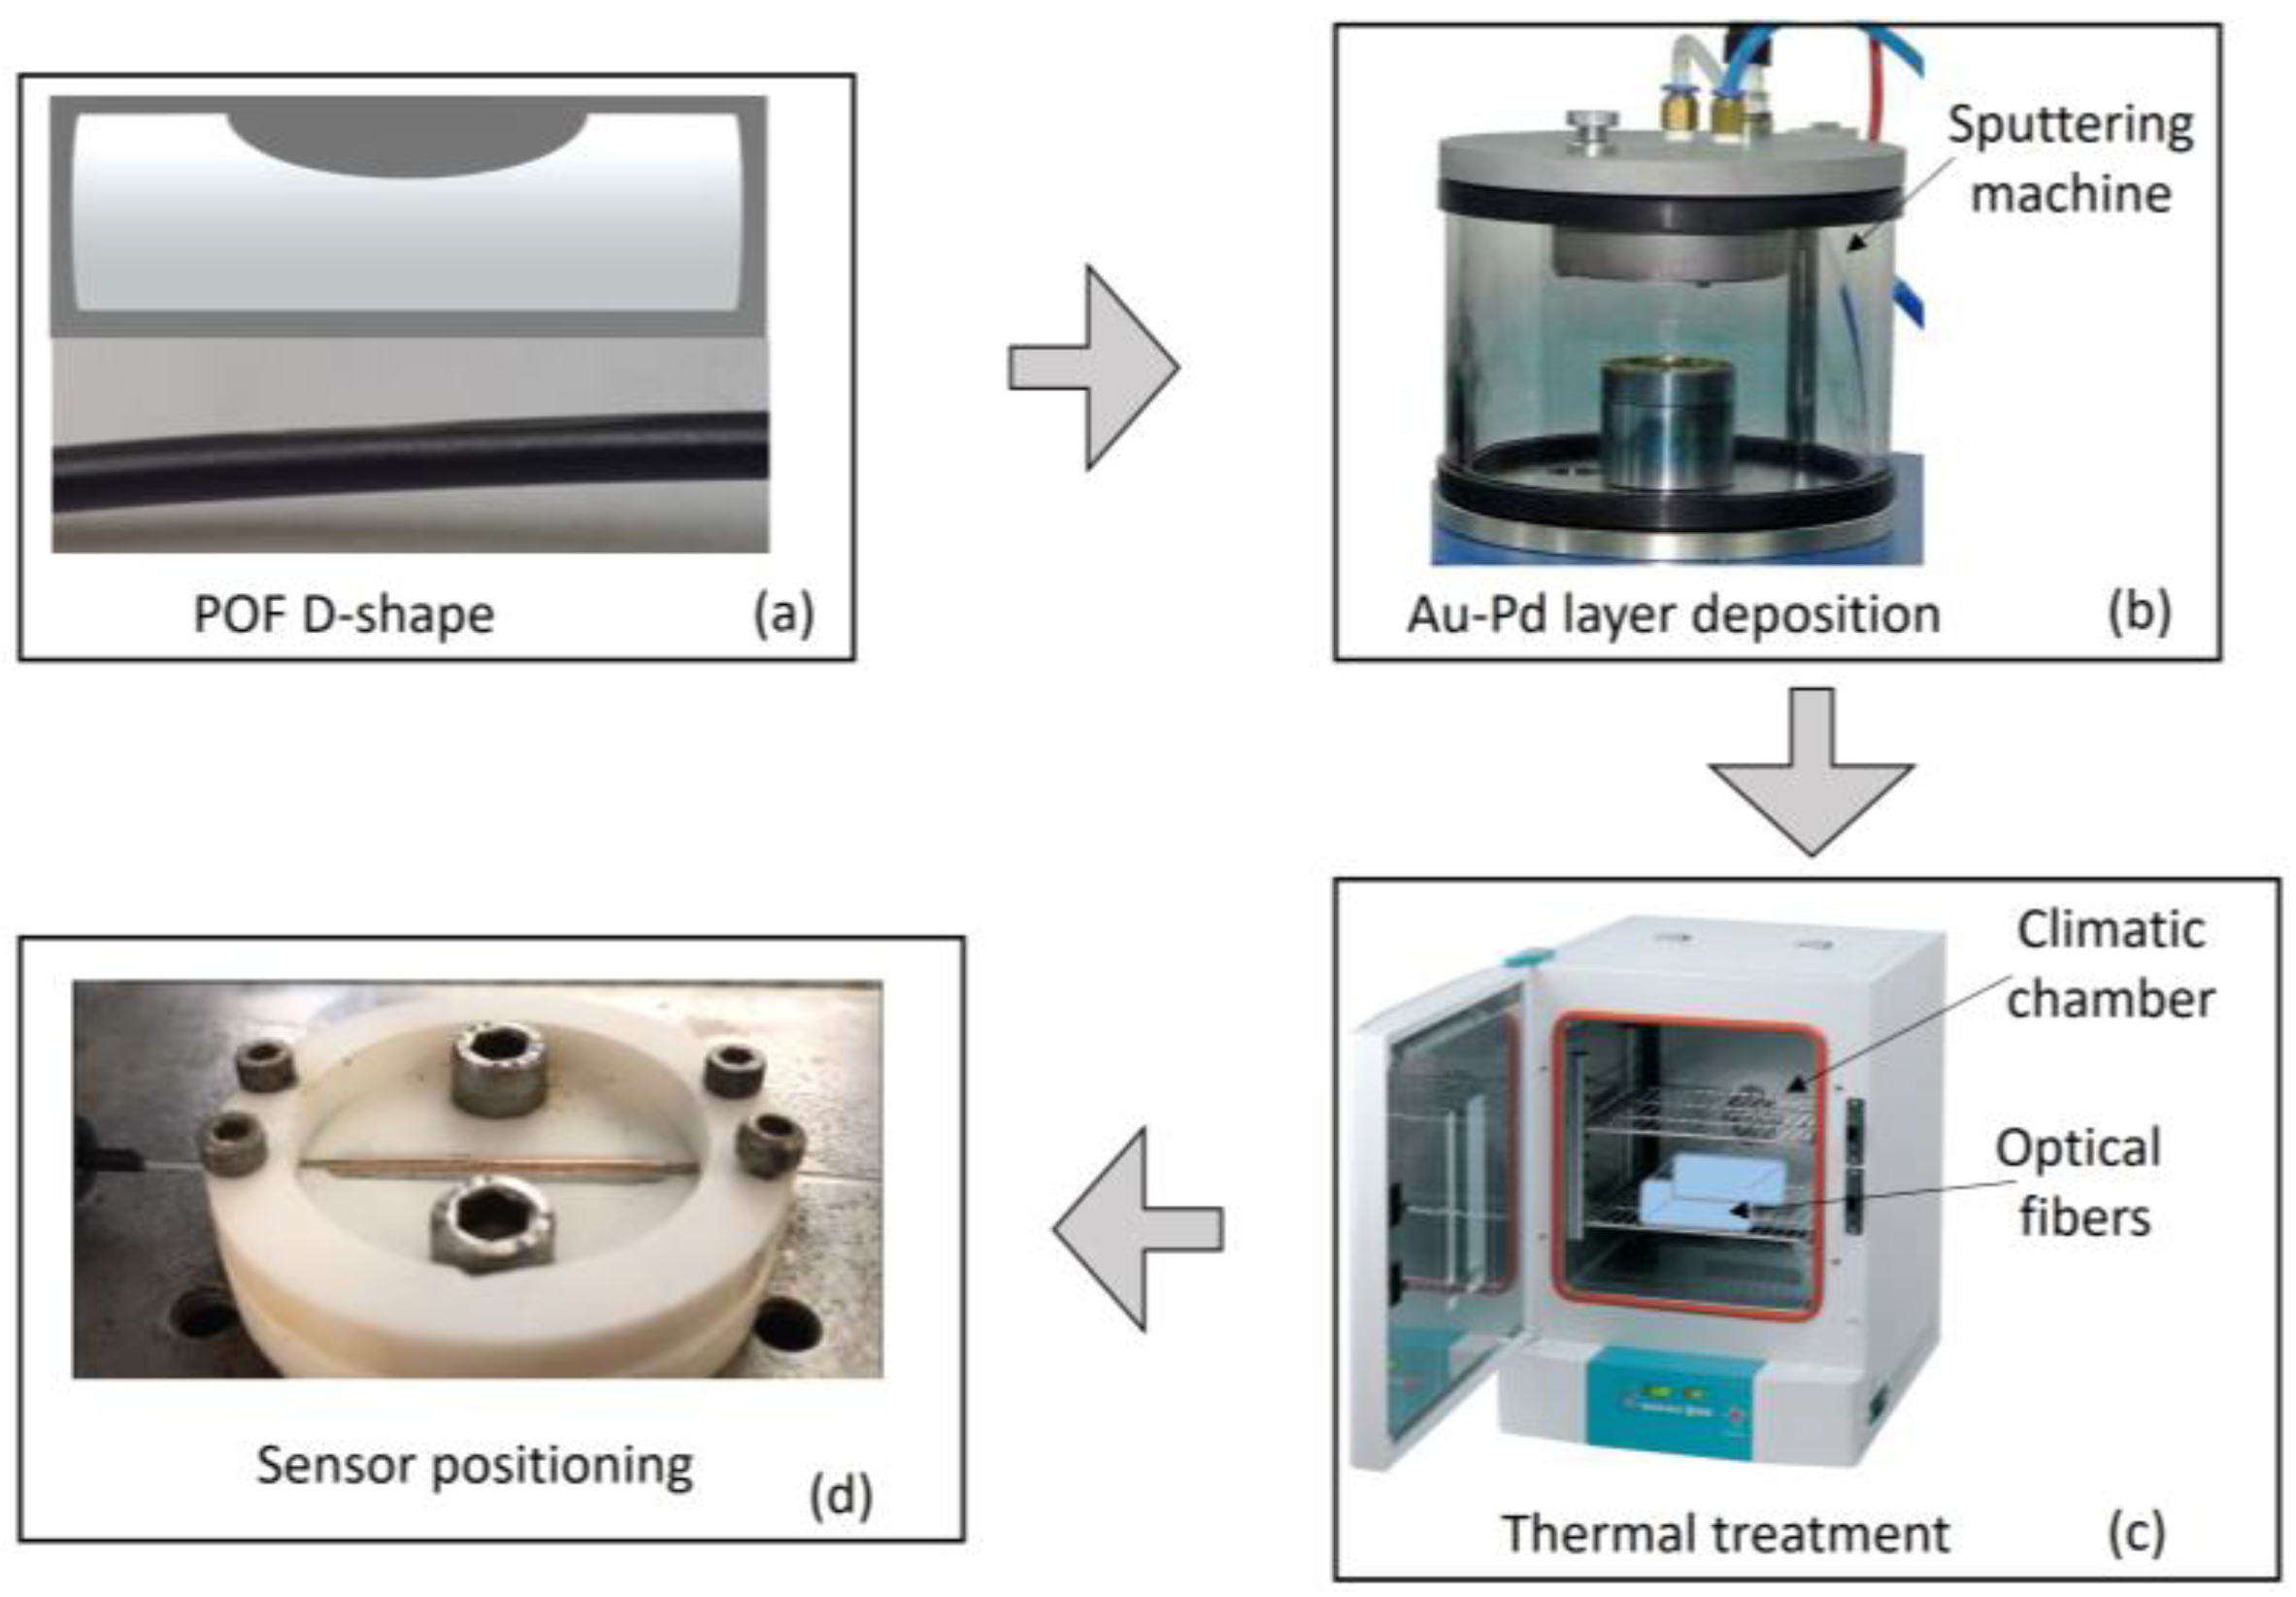
In this study, the POF employed in the SPR sensor development was a polymethyl methacrylate (PMMA) fiber with a 980 µm diameter and 10 µm cladding thickness. The optical fiber also had a polyethylene jacket for mechanical protection, which was stripped prior to the sensor application. In addition, all samples were D-shaped for the cladding removal, which also resulted in the removal of a small region of the POF’s core. In this regard, the D-shape fabrication was carried out by positioning the optical fiber in a V-groove support with a controlled length and depth, where the dimensions of the V-groove limited material removal using the micromachining approach. In this case, the D-shaped length and depth were 30 mm and 300 µm, respectively. The lateral section was produced using a rotary tool with sandpaper with a controlled grit size, resulting in a lateral section with a controlled surface roughness.
For the metallic film deposition, the sputtering technique was employed, where the POFs were cleaned in deionized water prior to the film application. The E5000 SEM coating unit was used in the metallic film deposition, which also used a sputter target composed of 99.99% Au. Considering this assembly, the POFs were positioned inside the sputtering chamber with the lateral section facing the region where the gold layer was deposited. The deposition time was controlled to ensure a controlled thickness of the Au layer, where the deposition time of 1 min was employed to obtain a metallic film thickness of 50 nm for all samples. It is important to mention that the Au-Pd layer was chosen due to its higher stability compared with a silver layer that presents higher oxidation, which can harm the sensor reproducibility, especially for practical applications [
30]. After the deposition of the gold layer in all three POF samples, the coated fibers were placed inside a climatic chamber for annealing at around 50 °C. This thermal treatment not only resulted in a reduction in the internal stress of the POFs, but also strengthened the adhesion of the Au film. It is worth noting that a 50 nm film thickness was chosen due to the possibility of achieving the optimal sensitivity with such a thickness, as thoroughly investigated in the literature [
31].
Figure 1 shows a schematic representation of the steps in the SPR sensor fabrication as well as the experimental setup for the SPR sensor analysis as a function of the refractive index variation. As previously mentioned (and presented in
Figure 1), the first step involved generating the D-shape of the POFs, followed by the metallic film deposition and, finally, the annealing treatment. For the experimental analysis, the SPR POF sensor was positioned inside a nylon container with a 300 µL volume (see
Figure 1). Then, the container was filled with different RI solutions, where the samples were based on glucose solutions with different refractive indices (RIs). The solutions were produced through the combination of glucose and deionized water in different concentrations, i.e., 5%, 10%, 20%, 30%, 40% and 50%. The RI of each sample was measured with a benchtop Refractometer Easy R40 (Mettler Toledo), where the RIs of the samples were around 1.3398, 1.3462, 1.3579, 1.3681, 1.3779 and 1.3863 for the 5%, 10%, 20%, 30%, 40% and 50% concentrations, respectively. In this case, a DH-2000-S-DUV-TTL halogen lamp (Ocean Optics, USA) was used as the light source, and the transmitted spectra were acquired using a FLAME-T-UV–vis spectrometer (Ocean Optics) with a detection range from 190 nm to 890 nm. The optical fiber sensor and components (light source and spectrometer) were connected using removable SMA connectors. For the experiments, the sensors were subjected to aqueous solutions with different RIs for 5 min. Then, the RI samples were cleaned sequentially using deionized water, where the deionized water was applied on the sensor and subsequently removed using a micropipette.
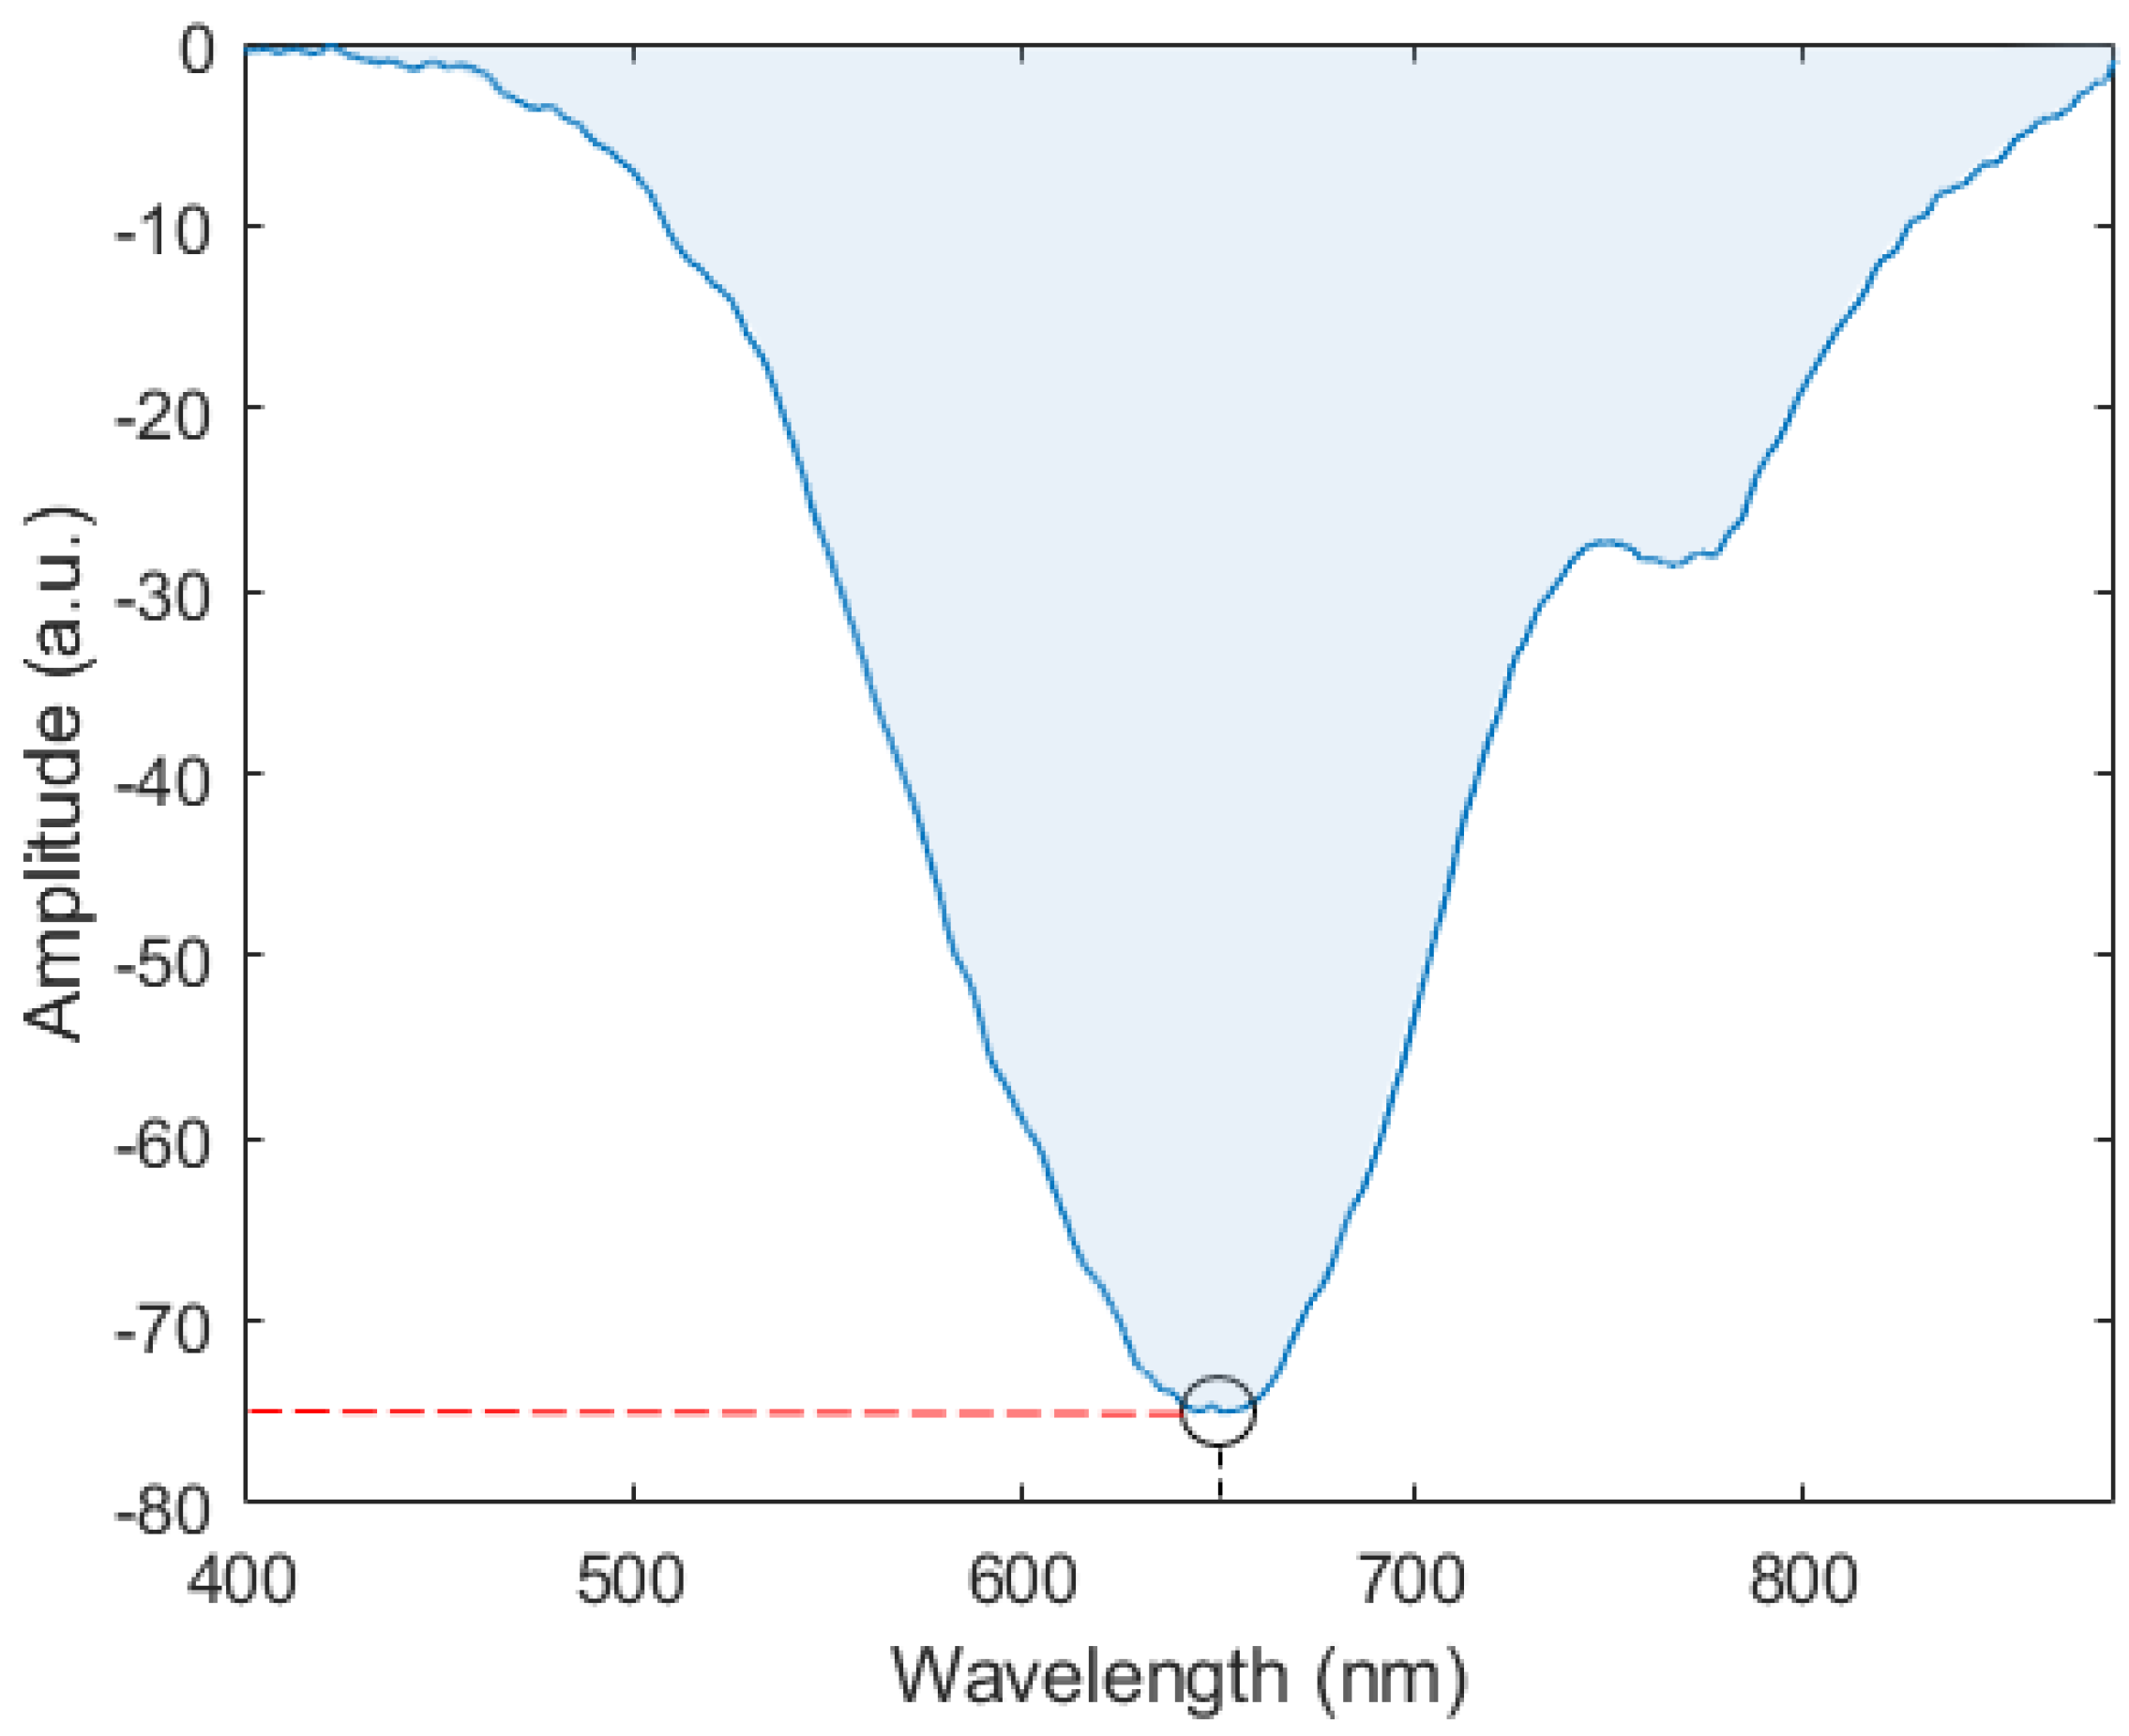
For the data analysis, the transmitted spectra obtained in air and for the optical source were subtracted from those of the SPR sensors in deionized water, presented as a function of the amplitude unit (a.u.), where such a unit shows negative values when there is a valley in the transmitted spectra related to the SPR signature. Then, the resulting spectra were analyzed as a function of different parameters, namely conventional parameters such as the wavelength shift and intensity of the SPR signature. Such parameters as well as the SPR signature are shown in
Figure 2. In addition, the area between the transmitted spectra and the
x-axis was analyzed as a function of the refractive index of the solution. It is also worth mentioning that the fast Fourier transform (FFT) was applied to each spectrum to obtain the peak amplitude, which also indicated a high correlation with the refractive index variation. The parameters used in the signal processing are schematically presented in the transmitted spectrum shown in
Figure 2. It is also worth mentioning that three measurement cycles were performed for each RI sample for all the manufactured sensors, which resulted in 54 spectrum samples for the statistical analyses. In addition, all analyses were performed in Python using the Jupyter Notebook.
The differences in the spectra in water and air were analyzed and compared. Thereafter, the transmitted spectra of three samples of SPR sensors were compared. In this case, it is important to mention that all the sensors were fabricated using the same parameters and procedures indicated above. However, there is inherent variability in the process and, due to the high sensitivity of the SPR signal to the metallic coating, minor variations in the coating can lead to major variations in the sensor spectra. Furthermore, we analyzed the responses of each sensor as a function of the refractive index with the different parameters presented in
Figure 2, namely the wavelength shift, intensity of the SPR signature, area below the curve and FFT amplitude. Using an unsupervised approach with the k-means algorithm and principal component analysis (PCA), the response features of the sensors were analyzed through clustering under different refractive index conditions, where 2 principal components, as a linear combination of all features, were used to reduce the data dimensionality. The results indicated the possibility of using a supervised approach for the general characterization of the SPR sensors with different signal-to-noise ratios and performance conditions.
3. Results and Discussion
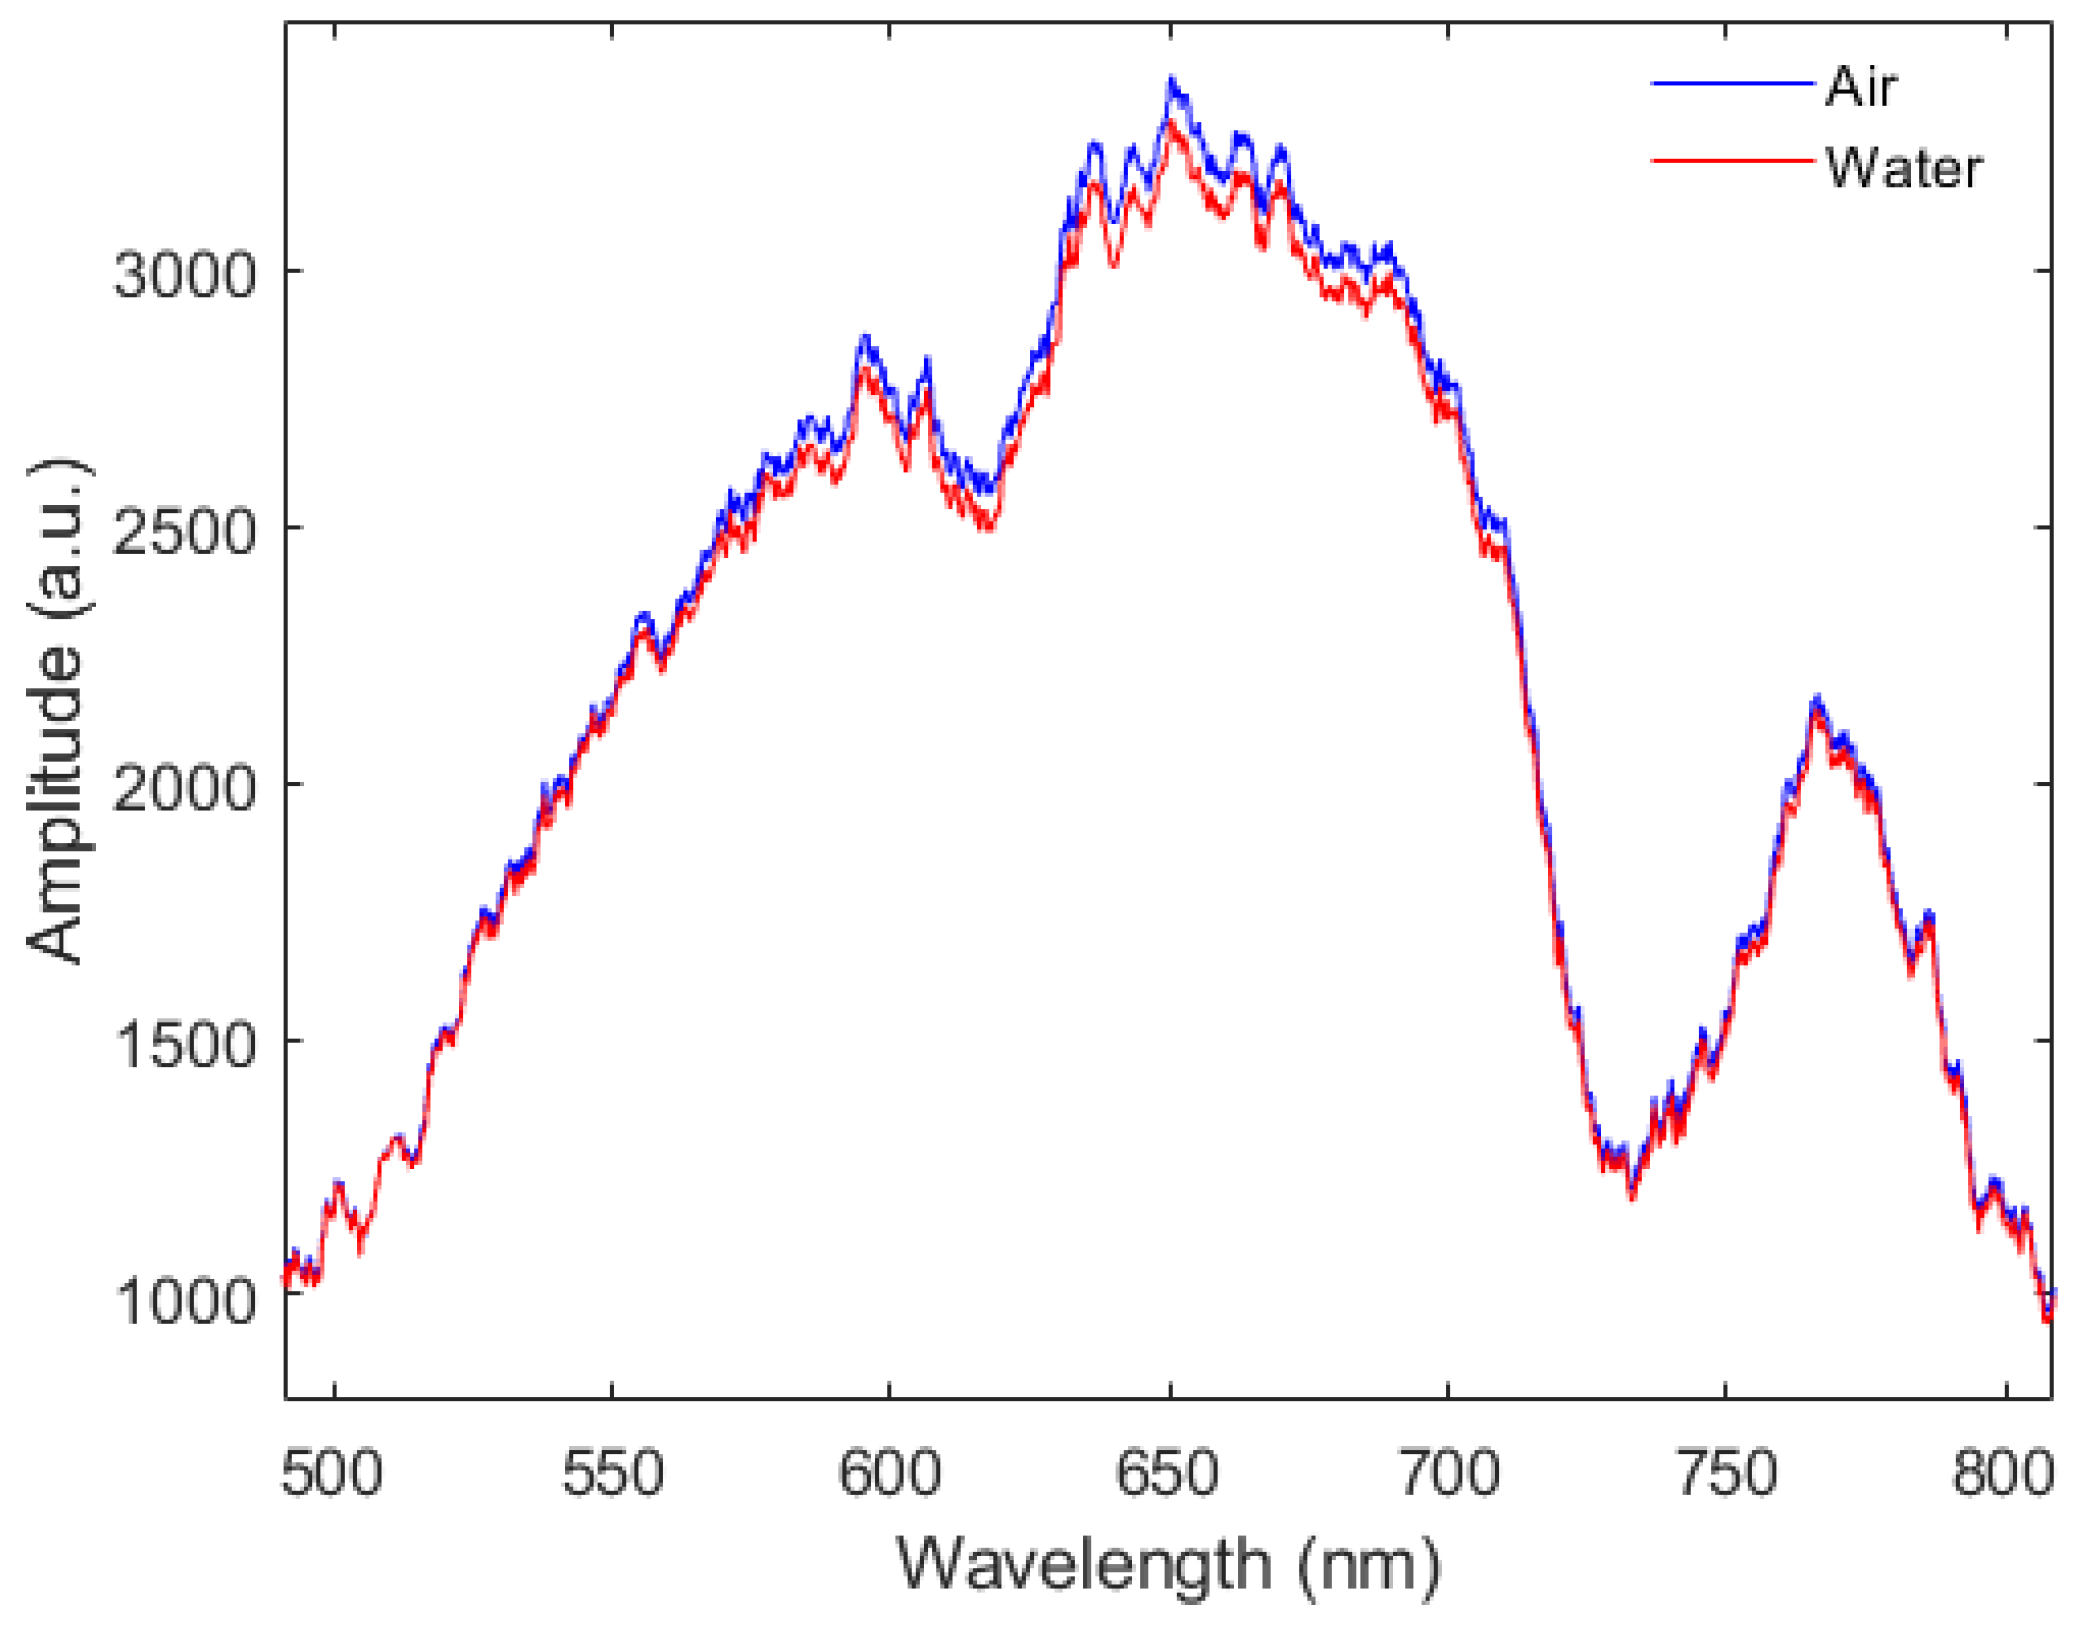
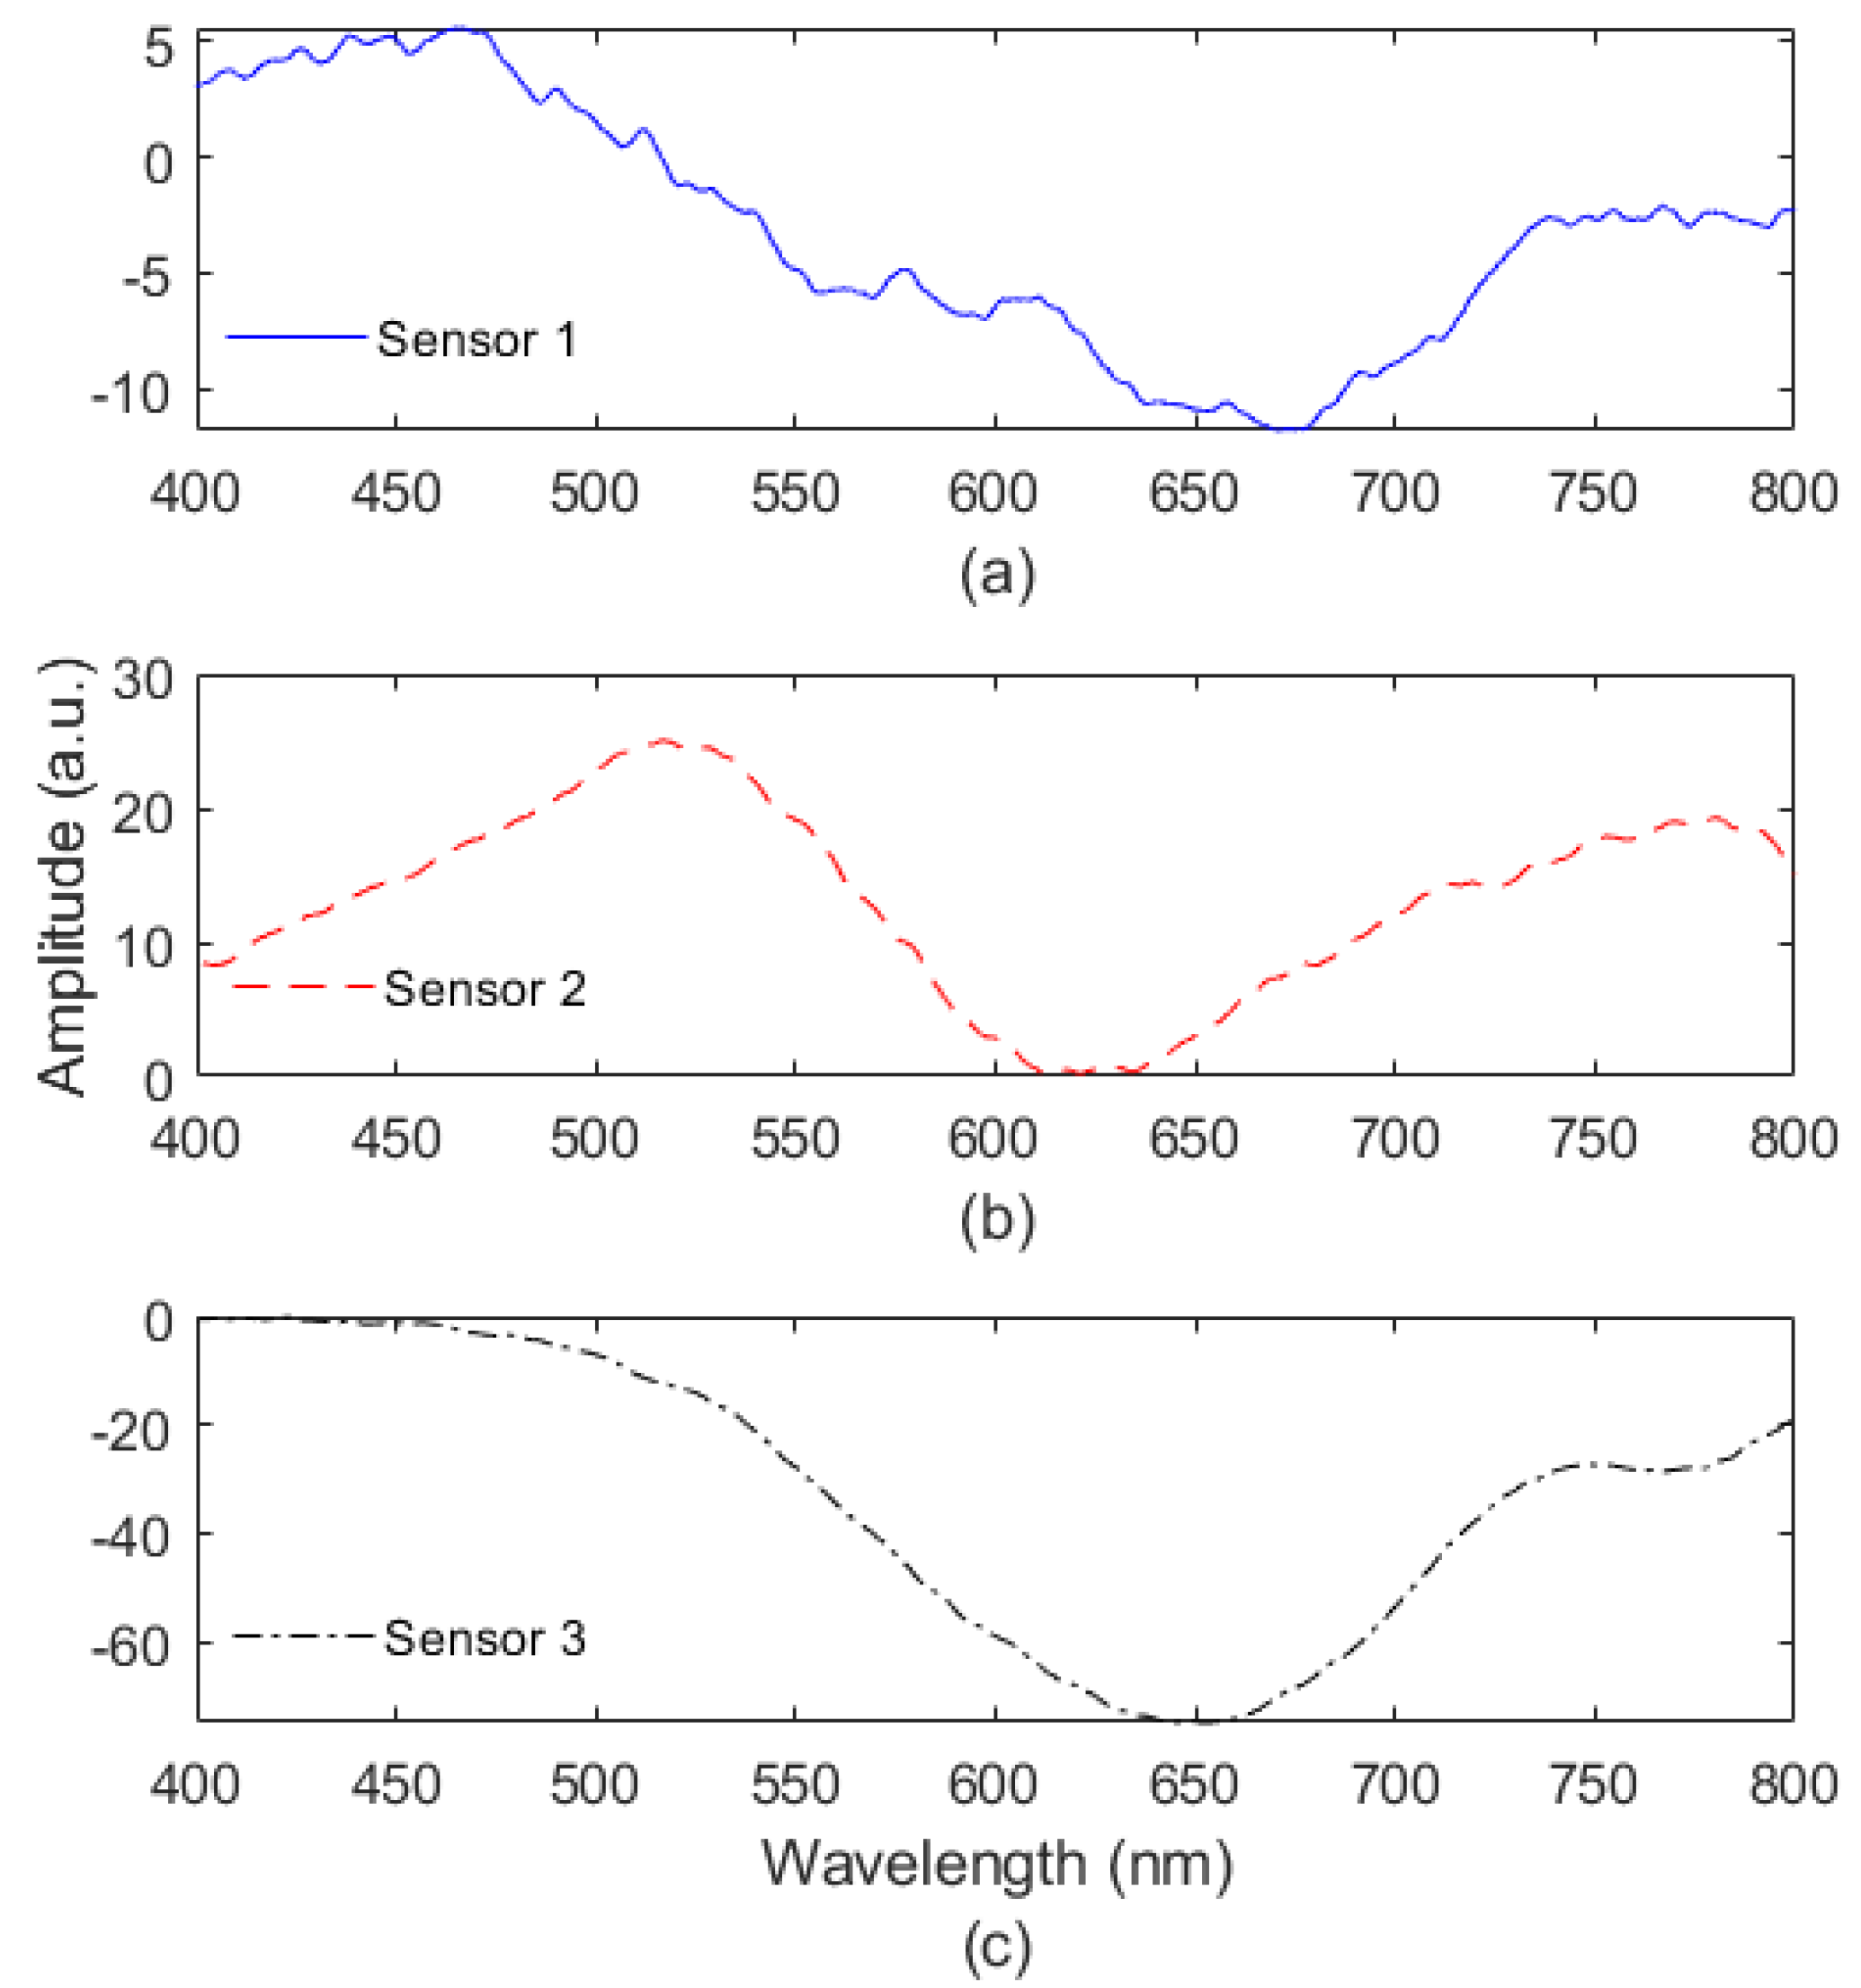
Figure 3 presents the transmitted spectra for two different conditions, i.e., the SPR sensor in air and the sensor in deionized water, for Sensor 1. The results indicated higher variation in the wavelength region around 620 nm, which was related to the SPR signature. Thus, the difference between both spectra resulted in the SPR signal of the proposed sensor. In order to compare the different samples,
Figure 4 shows the spectra of all three produced sensors, namely Sensors 1, 2 and 3. The comparison between the different samples indicated variability in the transmitted spectrum, which may be related to minor variations in the fabrication and coating. It is also important to mention that such high variations in the SPR sensor spectra can harm the sensor’s reproducibility considering real applications in which large-scale production of sensors is required. The different shapes of the curves are related to minor differences in the thin-film distribution in the sensing region that can influence the transmitted spectrum in the SPR region, especially considering the dip amplitude. Accordingly, Sensor 3 had a higher amplitude than Sensor 1, resulting in a smoother spectrum when the
y-axis scale was adjusted, as shown in
Figure 4. Moreover, the necessity of producing a higher number of sensors to obtain sensors with the desired properties can harm the claims relating to the low cost of SPR sensors in POFs. It is possible to verify the imperfections of the coating as well as the differences in its thickness using specialized equipment such as a scanning electron microscope (SEM). However, such an analysis is expensive due to the cost of the equipment and requirement for specialized professionals. In addition, SEM is a time-consuming technique that can harm the demands for fast fabrication in practical applications.
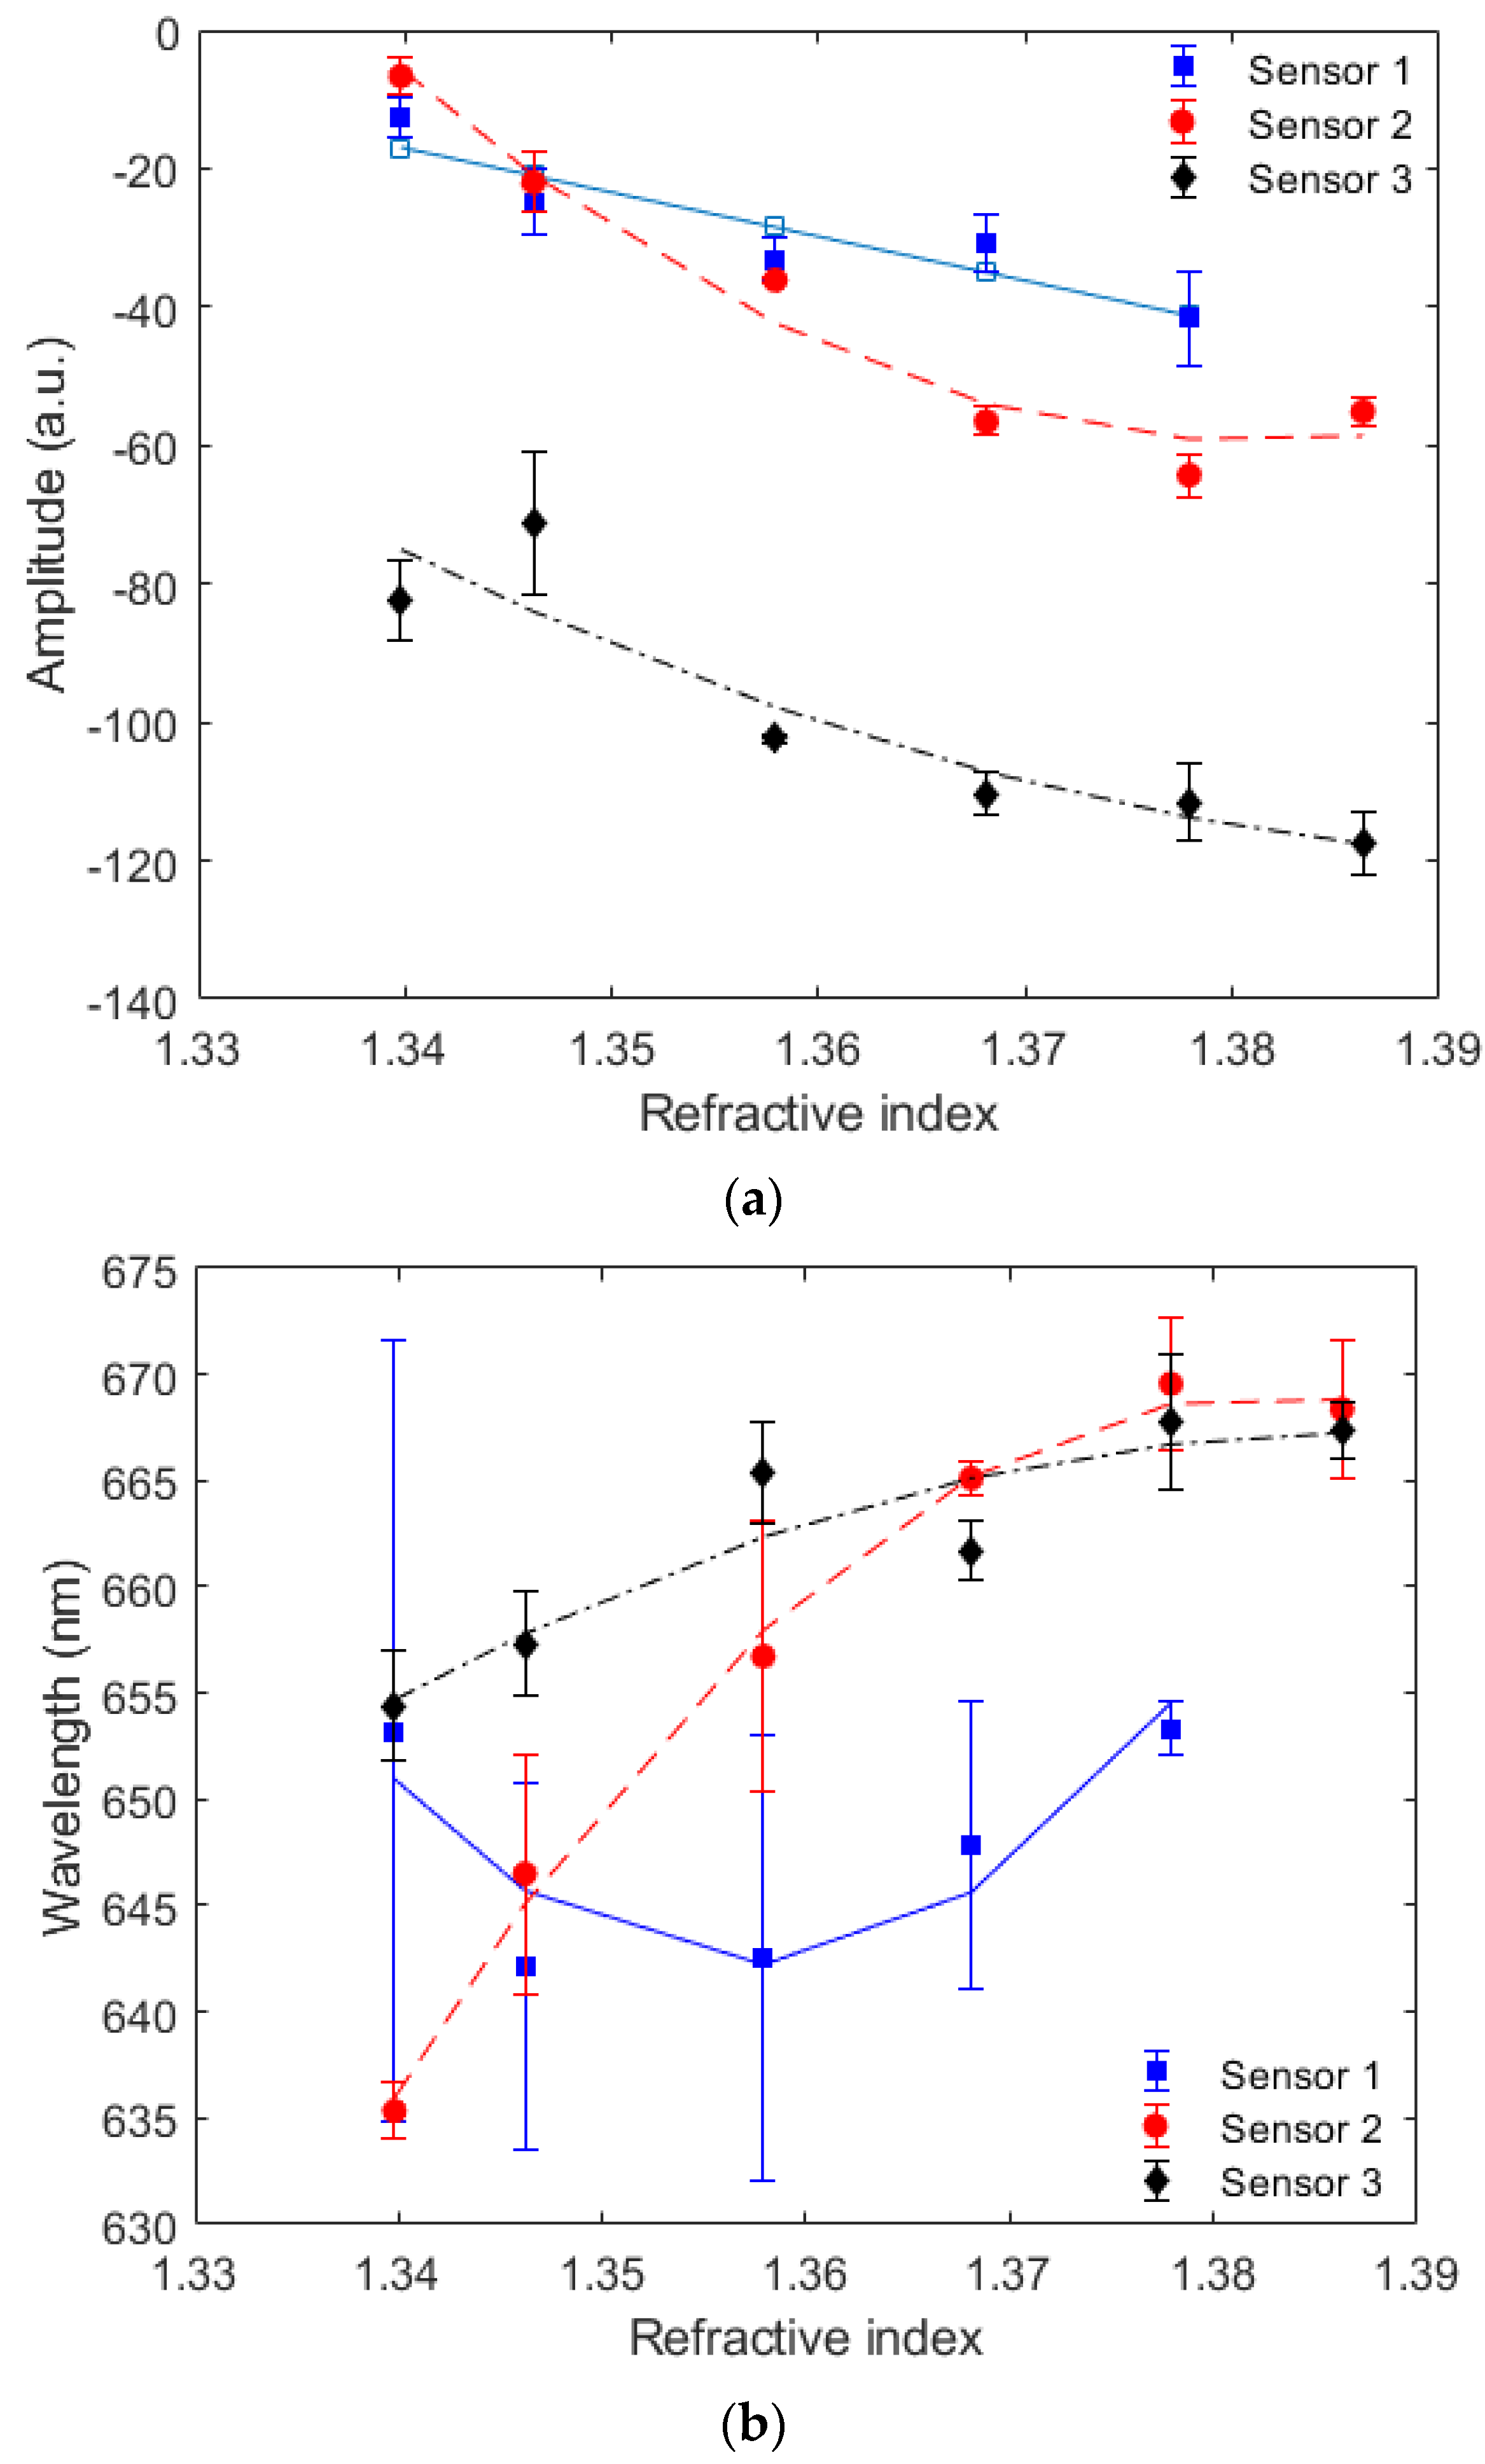
Generally, the wavelength shift and intensity variation are used in sensor analysis, where these parameters are related to the refractive index variations (in this case). In addition, the wavelength shift and optical power variations as a function of the refractive index are presented in
Figure 5 for all three sets of sensors. It is worth noting that Sensors 1, 2 and 3 presented a sensitivity of 294.11 nm/RIU, 736.05 nm/RIU and 286.76 nm/RIU to the wavelength shift, respectively. However, the sensors did not present a high linear correlation between the wavelength shift and the refractive index, where the maximum determination coefficient (R
2) was around 0.99 for Sensor 2. Similarly, the sensitivities of Sensors 1, 2 and 3 to the intensity variation as a function of the refractive index were 765.43 a.u./RIU, 1240.10 a.u./RIU and 991.26 a.u./RIU, respectively.
The results in
Figure 5 also indicate major differences in the sensor responses of the different samples. The comparison between the different sensors showed a maximum variation of 34.22 nm in the wavelength shift with a standard deviation of around 2.21 nm. Similar results were obtained in the analysis of the intensity variation, in which a standard deviation of around 4.99 a.u. was obtained. However, even when a single sample was analyzed, it was possible to observe variability between the different tests performed, where Sensor 1 showed the highest variation (standard deviation of 9.11 nm and 6.74 a.u. for the wavelength shift and intensity variation, respectively). Such intrasample variations indicated the necessity of using additional features to enhance the sensor performance, since such features can lead to higher precision and accuracy considering all sets of samples. The responses of Sensors 1, 2 and 3 were compared as a function of the full width at half maximum (FWHM), limit of detection (LOD) and figure of merit (FOM), where the FOM is defined as the ratio between the sensitivity and FWHM [
30]. The comparison of the different parameters of all the developed sensors indicated an FWHM of 90.5 nm, 77.7 nm and 81.2 nm for Sensors 1, 2 and 3, respectively. Moreover, the LOD was around 0.102 RIU, 0.003 RIU and 0.015 RIU for Sensors 1, 2 and 3. Finally, the FOM was obtained considering the sensitivities of each sensor, resulting in 3.25 for Sensor 1, 9.47 for Sensor 2 and 3.53 for Sensor 3. In order to provide a comparison between the proposed sensors and those previously presented in the literature,
Table 1 shows a comparison between the proposed sensors (especially Sensor 2) and some of the sensors presented in the literature.
In this case, to verify the possibility of using additional features for the assessment of the refractive index variation, the dataset of each sensor was combined with additional features, namely the area under the curve (AUC) and FFT amplitude of the wavelength. Thus, the dataset of each sample comprised the wavelength shift, intensity of the SPR signature, AUC and FFT amplitude. In addition, the datasets of each set of samples were merged to obtain a single dataset in which all three sensors were combined, considering all the experiments performed on the sensors.
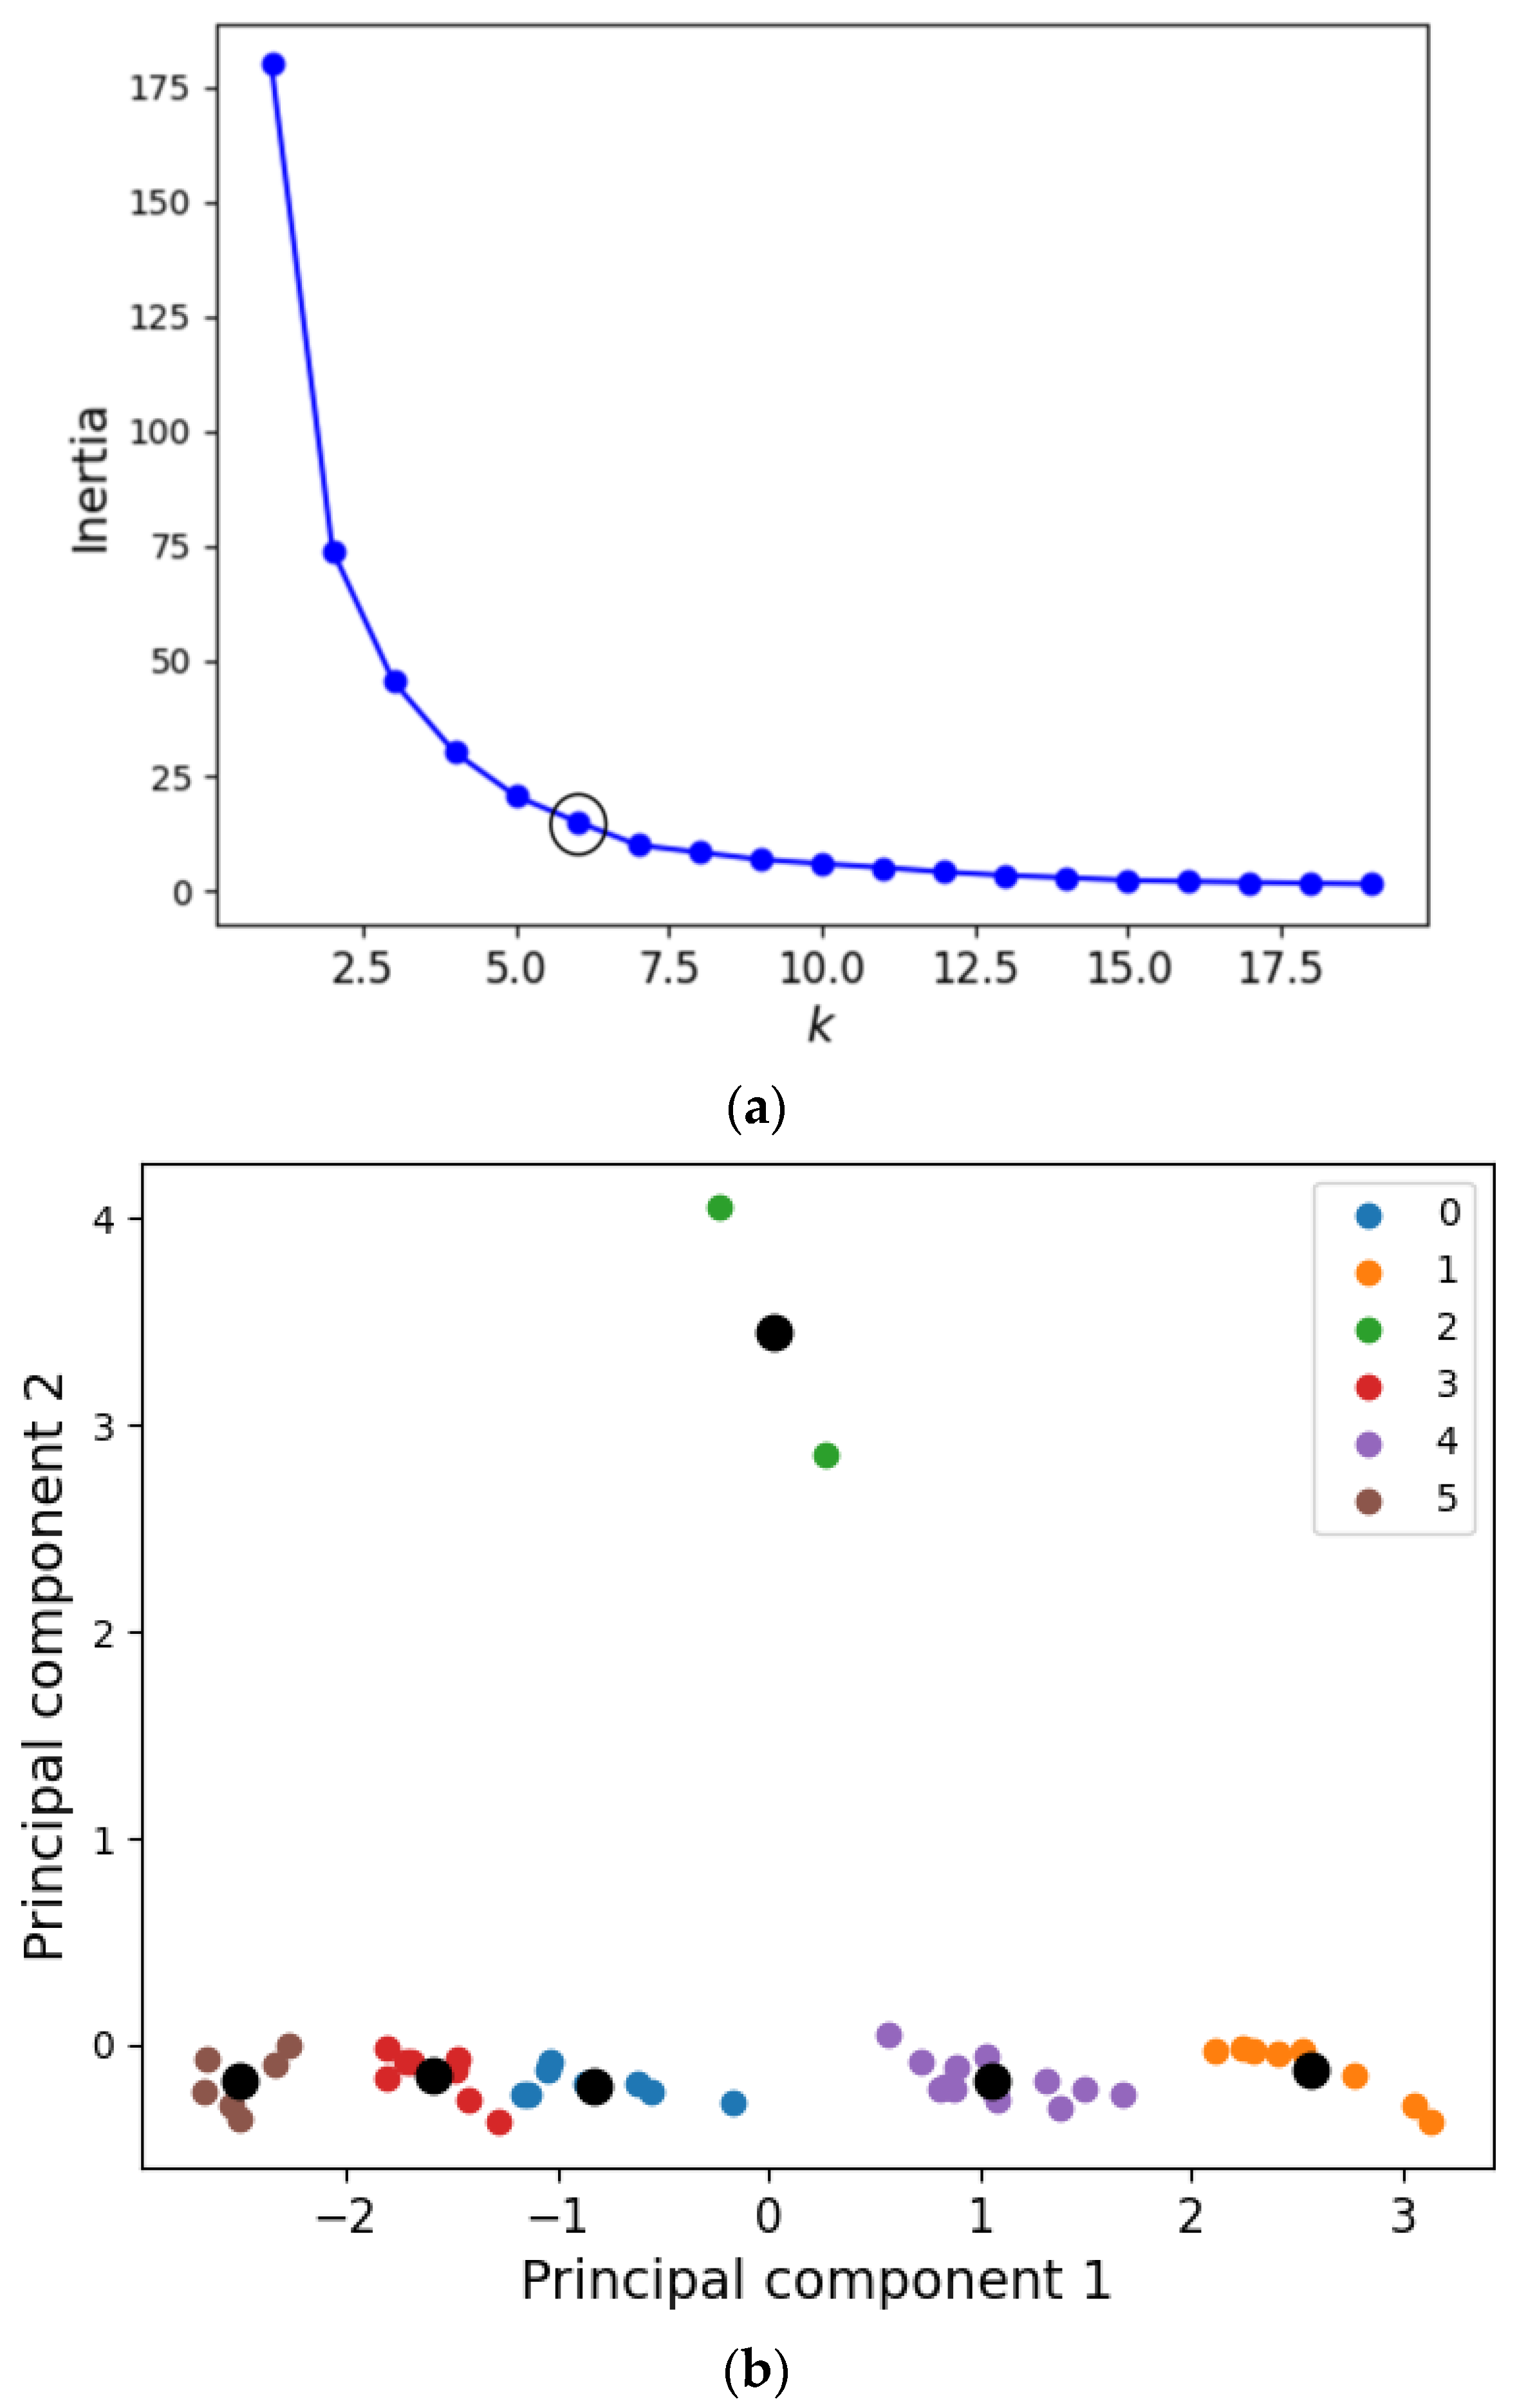
Figure 6 presents the data clustering using the k-means approach. In order to evaluate the number of features for the analysis, we investigated the inertia of the clustering with the variation in the number of clusters between 1 and 20, as shown in
Figure 6a. The variation in the inertia as a function of the number of clusters indicates the optimal number of clusters, which is obtained when the inertia reduction is small, i.e., in the “elbow” region of the curve, as indicated in
Figure 6a. Following the PCA for the dimensionality reduction, two principal components, as a linear combination of all features, were used, as shown in
Figure 6b.
The definition of the number of clusters indicates the clustering options that can be used in the regression of the refractive index estimation. The results in
Figure 6a indicate that the optimal number of clusters was 6, which is related to the number of refractive indices tested.
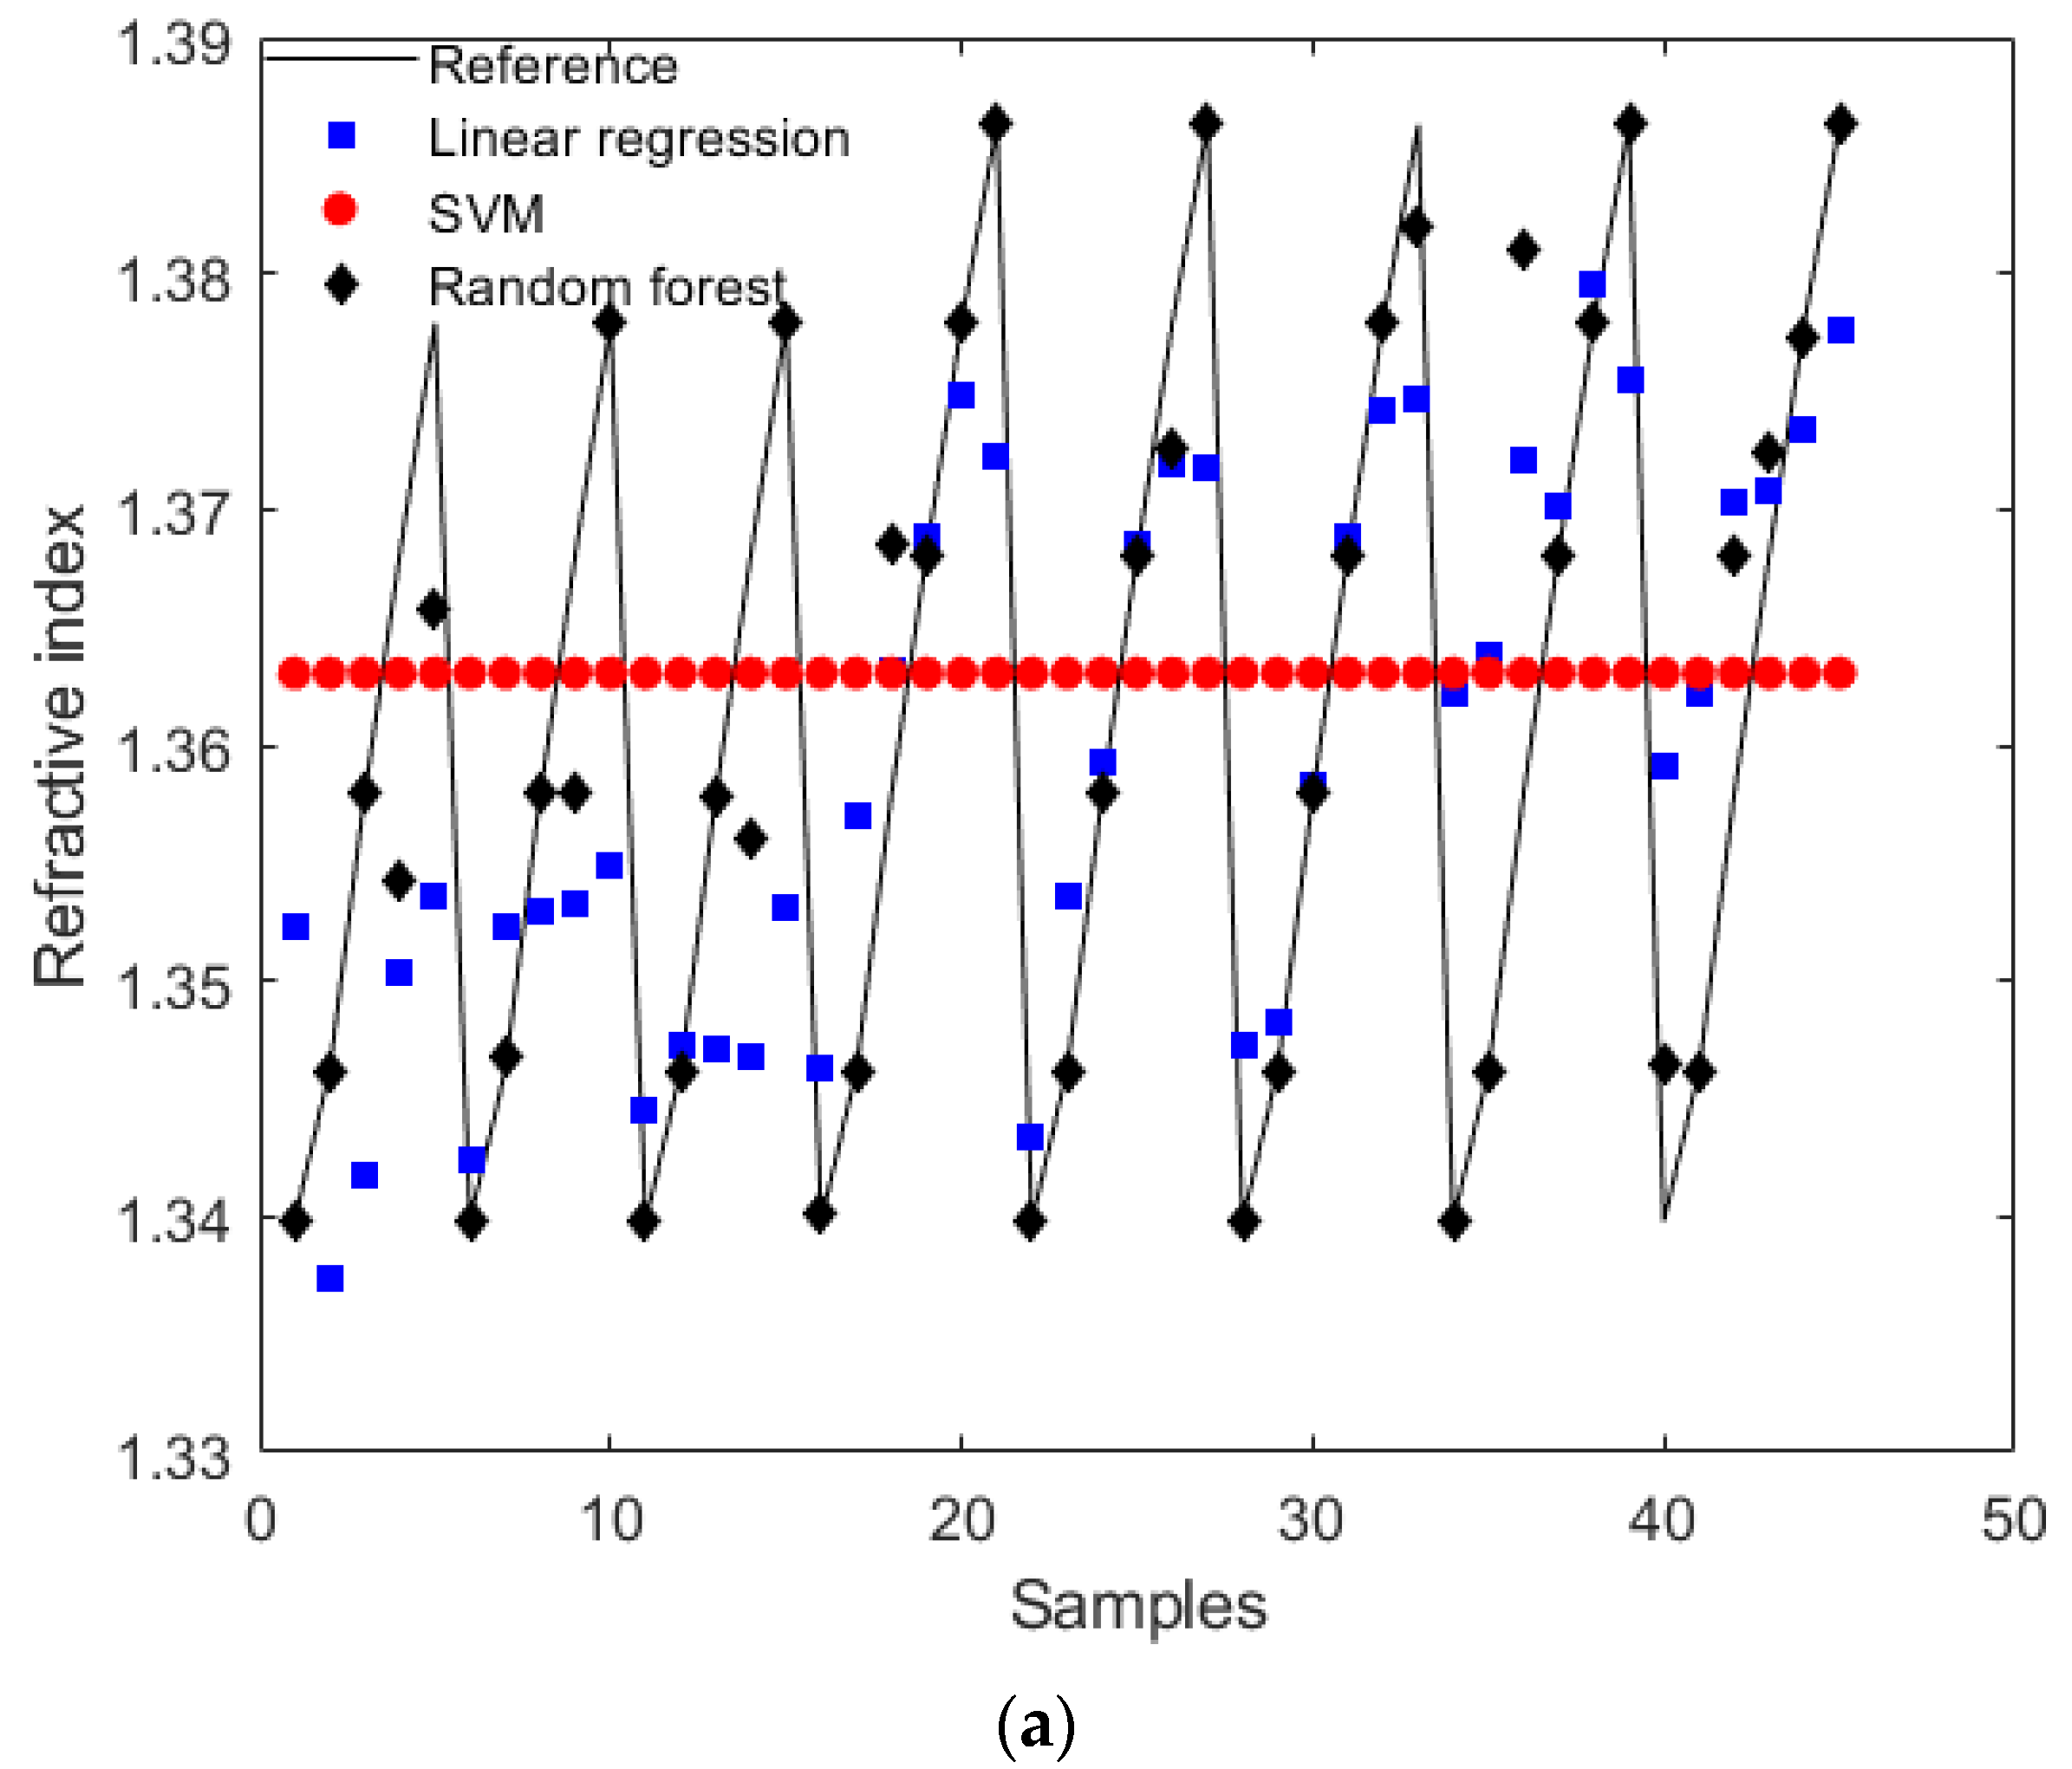
Figure 6b presents the clustering of the data, where the black dots indicate the centroid of each defined cluster. In this scenario, all four features were used in the regression of the sensor responses. For this reason, the supervised approaches for the evaluation of the refractive index as a function of the spectral feature variations in the SPR sensors included all four features. The supervised approaches included linear regression, support vector machine (SVM) and random forest, which were compared in terms of accuracy considering a dataset with the responses of all the sensors for each refractive index condition.
Figure 7a presents a comparison between the refractive index estimations considering all analyzed approaches, where the results were applied to a new dataset, but with Sensors 1, 2 and 3, i.e., the same sensors used in the characterization and signal variation analysis. The parameters of each algorithm were obtained using an iterative approach in which optimization was achieved through a recursive method with a randomized analysis of different combinations of parameters to guarantee an optimized algorithm for all analyzed samples. The objective of the optimization was to minimize the root mean squared error (RMSE), where a k-fold cross-validation was applied in all approaches. In this cross-validation approach, the dataset was subdivided into
k sets of samples, in which each set of samples was used to train and validate the other as a function of the RMSE, where the number of sets of samples (i.e., value of
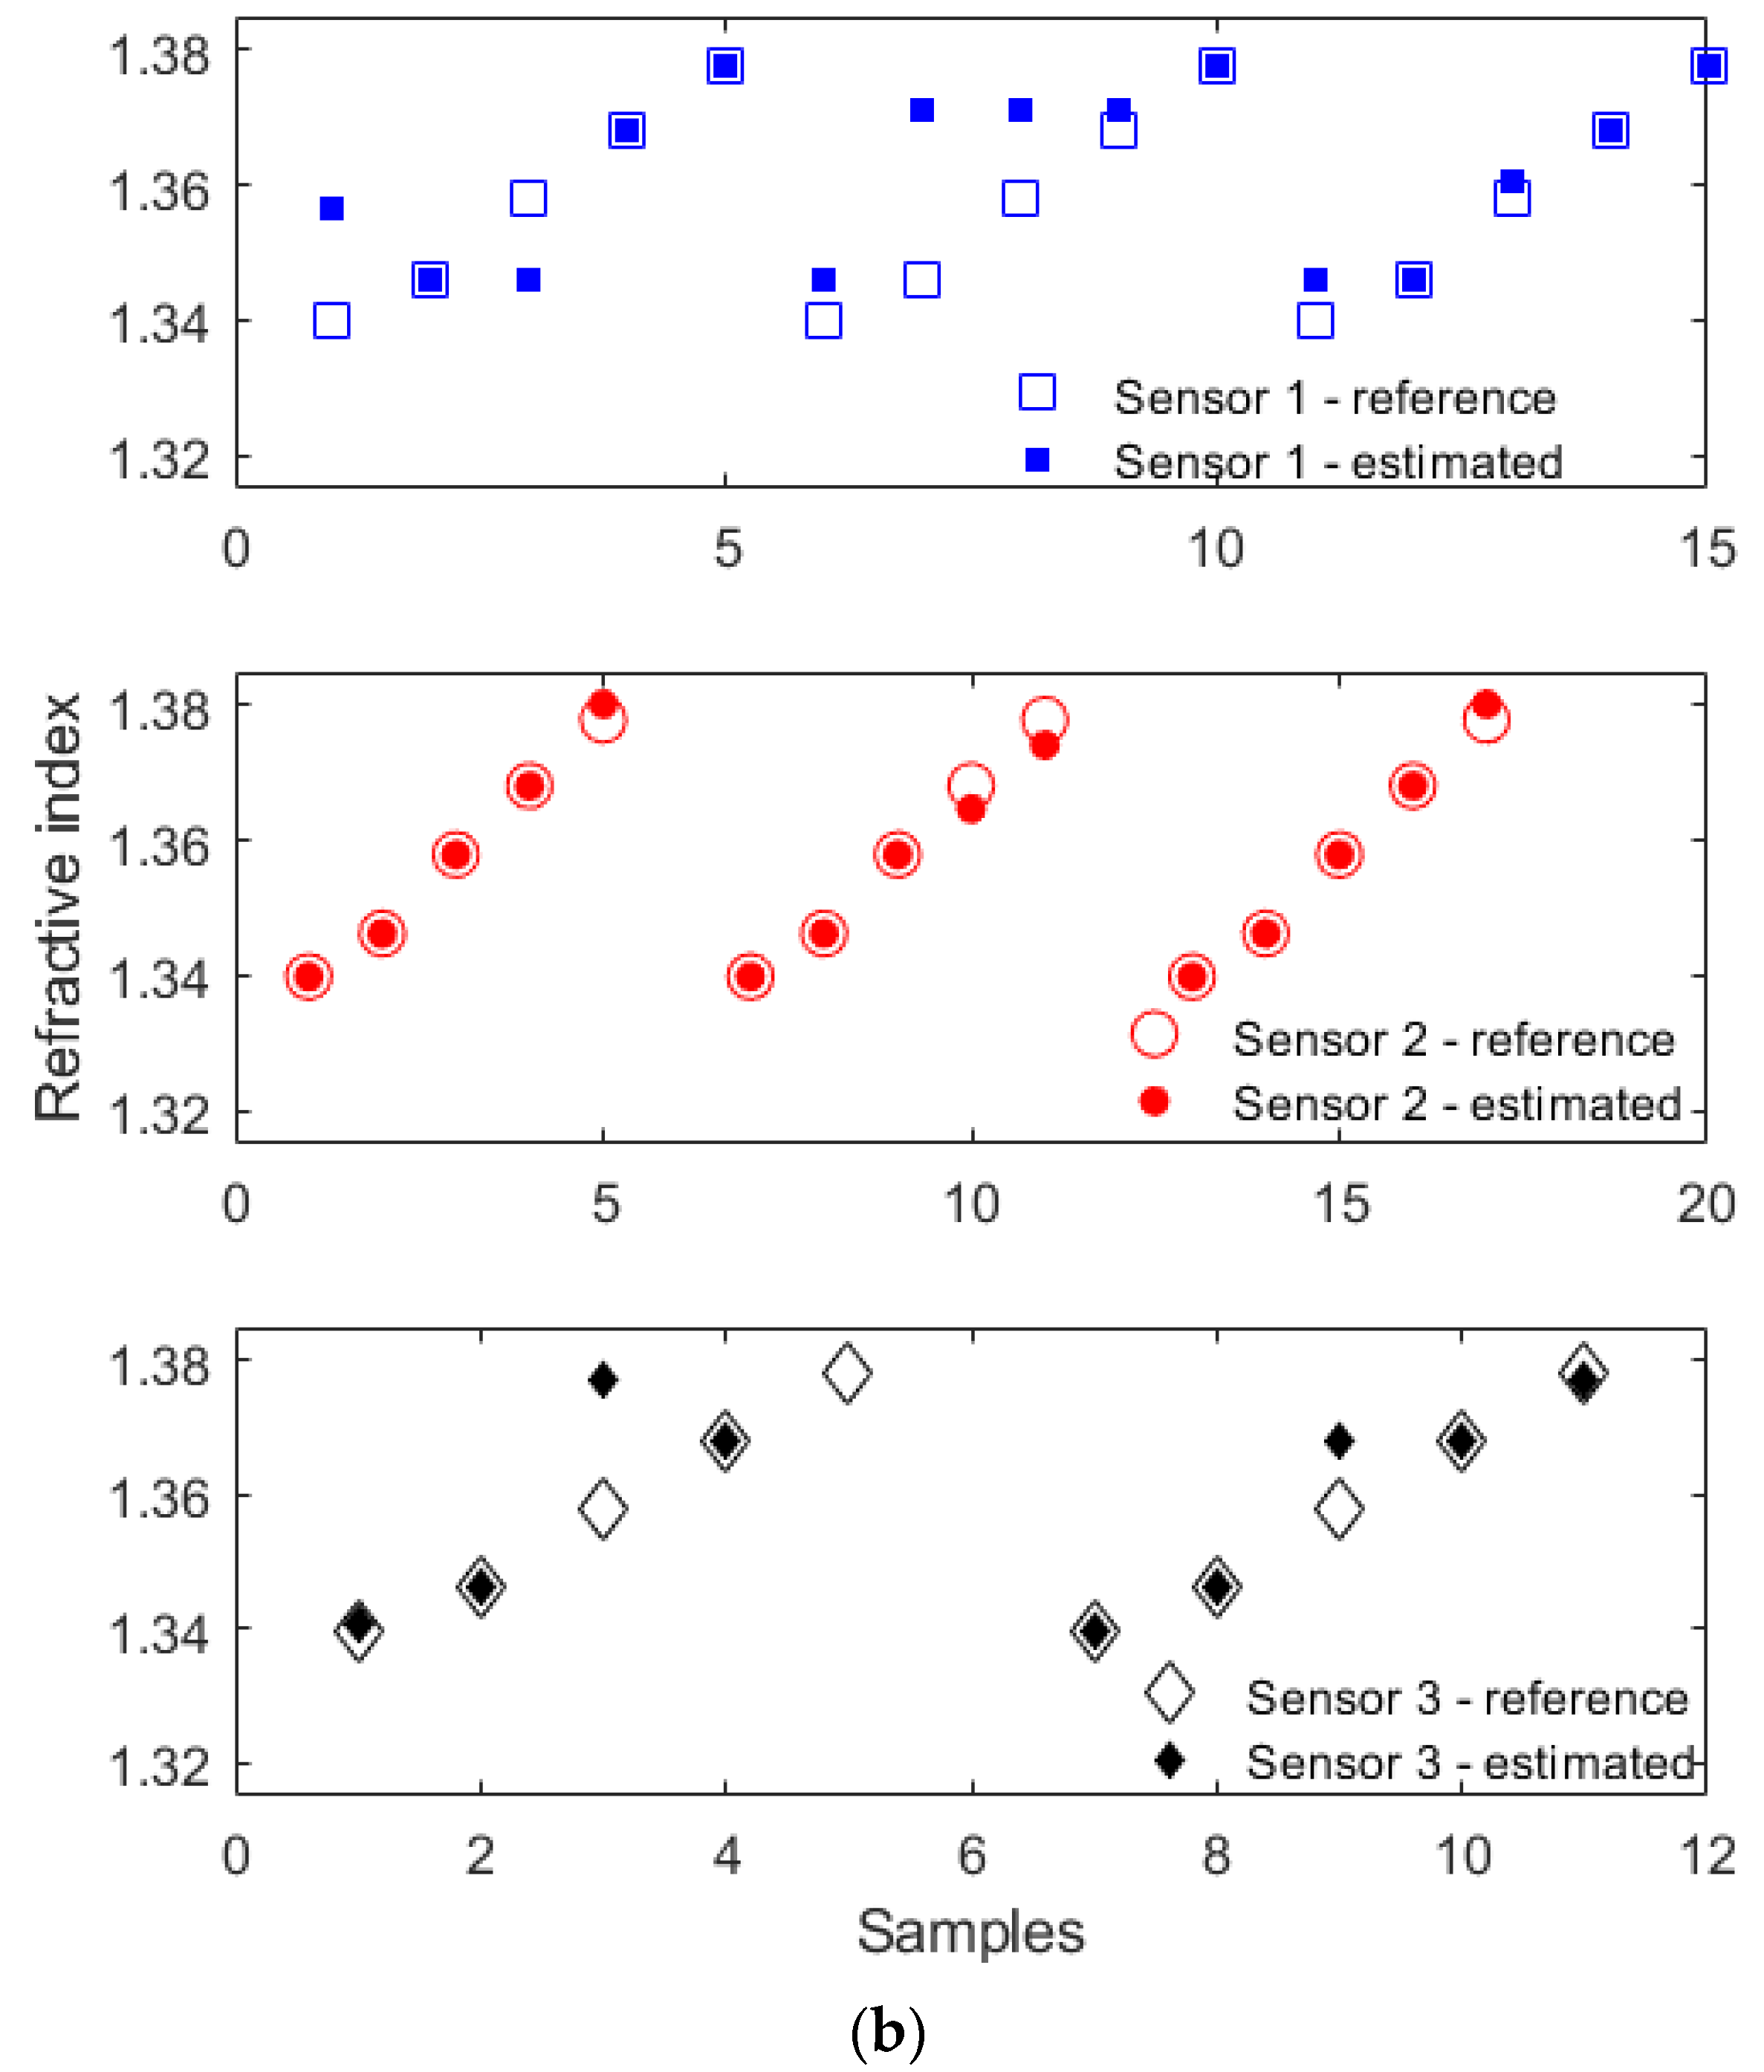
k) was 8. The comparison of the RMSE for each algorithm indicated that random forest presented the smallest RMSE (around 0.0057), whereas the linear regression approach presented the highest RMSE, which was around 0.0160. Furthermore, a comparison between the different sets of sensors is presented in
Figure 7b, where the random forest algorithm was used for all sensors, since it provided the smallest RMSE among the algorithms tested. It is also important to mention that, in the results presented in
Figure 7b, the dataset was separated as a function of each sensor. Thus, there were three datasets, one for each sensor, which were individually trained and tested considering the optimization carried out to obtain the smallest RMSE. The results indicated that all samples presented small relative errors, with RMSEs of 0.0094, 0.0014 and 0.0067 for Sensors 1, 2 and 3, respectively. Although the smallest RMSE was obtained by Sensor 2, all sets of sensors presented relative errors below 3.0%, considering the entire test range. Therefore, it is possible to infer that all the sensors showed feasibility and suitable performance in the assessment of the refractive index under different conditions, even when there was a weak SPR signature, as shown for Sensor 1 in
Figure 4a. Such results indicate the possibility of obtaining an accurate sensor system for large-scale production, even when there is no optimal metallic coating deposition.
4. Conclusions
This paper presented the development, analysis, comparison and machine learning application of SPR sensors based on D-shaped POFs with Au-PD coatings. The sensors were used in the assessment of different refractive indices, where it was possible to observe large differences in their transmitted spectra, even when similar approaches and parameters were applied, due to inherent (minor) variations that can lead to significant variations in the spectra. The refractive index characterization of all three sets of sensors indicated variations in the wavelength shift and intensity of the SPR signature as a function of the refractive index, where it was possible to observe that Sensor 2 presented the highest sensitivity as a function of the wavelength shift and intensity variation (around 736.05 nm/RIU and 1240.10 a.u./RIU, respectively). However, the inter- and intrasample variability, characterized by a relatively high standard deviation (around 10% considering the entire range of variation), indicated the necessity of using additional features to increase the sensor accuracy. In this context, the AUC and FFT amplitude were used in conjunction with wavelength shift and intensity variation to obtain a higher correlation as a function of the refractive index. To verify this assumption, an unsupervised approach based on the k-means algorithm was used to obtain clusters in the dataset with different refractive indices. Such an analysis indicated the number of clusters corresponding to the different refractive indices tested. Thus, among the supervised approaches, namely the linear regression, SVM and random forest algorithms, all three sets of sensors indicated a smaller RMSE for the random forest algorithm, which was used in the refractive index assessment using each sensor, individually. The results showed an RMSE of 0.0094, 0.0014 and 0.0067 for Sensors 1, 2 and 3, respectively. Moreover, the results presented a relative error of 10.0% and 3.0% for Sensors 1 and 2, which were the highest and lowest results (among the tested sensors), respectively. Therefore, the proposed approach represents a significant step towards practical, large-scale applications of SPR sensors in POFs, where minor imperfections in the sensor design and metallic coating deposition can be corrected using machine learning algorithms to obtain reliable sensors in almost all fabrication conditions. Future work includes the development of online calibration approaches for SPR sensors during their long-term applications, as well as the evaluation of such an approach in the infrared wavelength region by changing the parameters in the metallic layer deposition of the optical fiber.


