1. Introduction
The high-precision measurement of transverse displacement and tilt of an optical beam has applications in several areas, such as the laser interferometer gravitational-wave observatory (LIGO) detector [
1], biological measurements [
2,
3], satellite positioning [
4,
5], and atomic force microscopy [
6]. Different from the longitudinal optical phase measurement, this generally involves the transverse complex amplitude distribution of a laser beam, spatial detection methods, such as quadrant detectors, or spatial mode-based homodyne detection using high-order modes. Mode matching is crucial in such ultrasensitive spatial detections. Therefore, the optimal detection scheme with ideal mode matching is required to reach the ultimate measurable quantum limit.
Several methods are proposed to enhance the spatial measurements [
7,
8]. One involves using non-classical light, such as spatial squeezing, to decrease the quantum noise below the shot noise limit [
9,
10]. For example, by coupling a squeezed high-order mode squeezing into a fundamental mode laser beam, a spatially squeezed beam can be used as the probe to perform a transverse displacement beyond the standard quantum limit [
11,
12,
13]. This quantum technique was also demonstrated in the biological measurement beyond the quantum limit [
3] and in the spatial entanglement characterization [
14]. Recently, there have been experimental demonstrations of higher-order spatially squeezed beams, showing that a higher-order spatially squeezed beam is an effective probe beam used to boost the precision of spatial tilt and displacement measurements [
15].
Another method involves increasing the spatial detection efficiency. A split detection scheme with a quadrant photodetector is often used in transverse displacement detection. However, split detection is proved to be only 64% efficient compared to the newly proposed scheme of the so-called
homodyne detection, where a
mode local oscillator interferes with the fundamental mode probe to obtain the displacement information [
16,
17]. Recently, parallel research on weak value-based measurements also improved the signal-to-noise ratio (SNR) of optical tilt measurements with a
homodyne detection [
18].
One more method involves using the high-order mode as the probe beam. The higher-order mode contains more Fisher information for a spatial measurement [
19,
20] and, thus, has an improved spatial sensitivity compared with a lower-order one. This scheme was proposed and experimentally demonstrated using the
mode as the probe and
mode as the local oscillator. Although an improvement factor of 1.41 was demonstrated, the
mode is actually not the optimal local mode used to obtain the transverse information of the
mode [
21]. The quantum spatial scheme was also demonstrated with high-order modes, while the optimal local modes were not used [
18]. The optimal local modes with high-order modes can increase the spatial detection efficiency, similar to the role that the
homodyne detection plays instead of the split detection. The sensitivity of the high-order mode-based scheme is ultimately determined by the quantum Cramer–Rao bound (QCRB), which is closely related to the local mode selection of homodyne detection.
In this paper, we experimentally demonstrated the tilt measurement with a higher-order mode as the probe beam. Using the balanced homodyne detection with an optimal local mode, which is the superposition of the high-order and modes, we demonstrated the precision of the tilt measurement approaching the QCRB. With m = 4, the SNR of the tilt measurement is enhanced by 9.2 dB compared to the traditional method using as the probe beam.
2. Theoretical Model
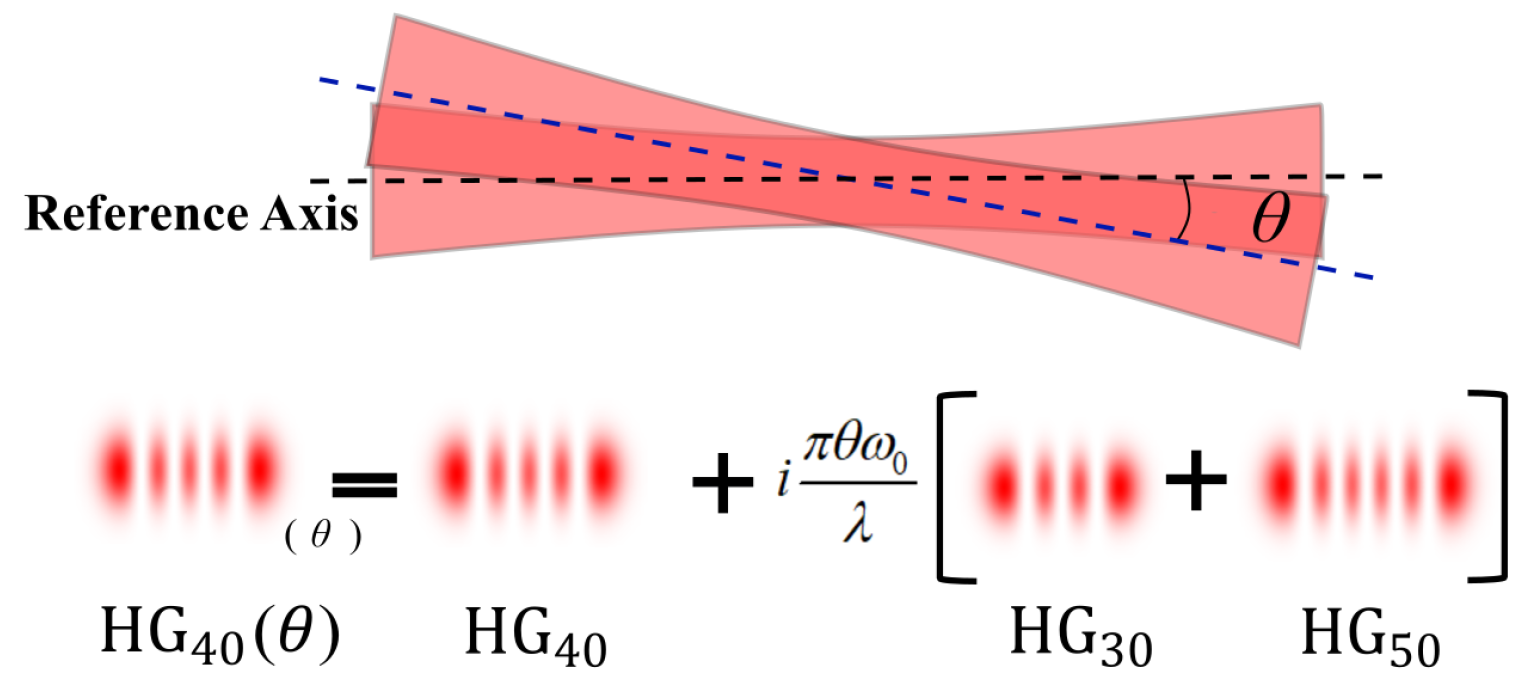
The tilt of a high-order Hermite–Gauss (HG) mode is shown in
Figure 1. Here, the tilt is defined with respect to a pivot point centered on the beam waist. The transverse complex amplitude distribution of a tilted beam with an arbitrary mode order can be regarded as adding an extra propagating phase, and is given by
where
is the transverse complex amplitude distribution of the original HG mode,
is the optical wavelength, and p is the transverse momentum of the beam. In the case of the small tilt angle, we have
.
Then Equation (
1) becomes
The transverse complex amplitude distribution of an
nth-order HG beam can be written as
where
is the beam waist related to the corresponding fundamental mode, and
is the Hermitian polynomial, where n represents the mode order.
Substituting Equation (
3) into Equation (
2), we have
where
with
. We can see that the tilt information
is carried by the
and
modes, which are called the detection modes in some literature [
22].
In the quantum regime, the positive frequency part of an electric field operator of the probe beam can be written as [
17]
where
ℏ is the reduced Planck constant,
is the frequency of the light field,
is the vacuum permittivity,
c is the speed of light, and
T is the detection time.
is the annihilation operator corresponding to the
order mode,
could be written as a linearized form of
, where
is the classical amplitude and
is the quantum noise operator.
When the probe beam is a bright
mode,
,
N is the photon number of the
mode. All of the other modes are in the vacuum state. Equation (
5) can be rewritten as
The probe beam undergoes a small tilt angle, say
, we have
It is proved that a balanced homodyne detection (BHD) with the “detection mode” as the local oscillator can reach the QCRB of a spatial measurement [
22]. The normalized mode of the local oscillator is the superposition of the high-order
and
modes, written as
The local oscillator field is then written as
where
is the mean photon number of the local oscillator.
According to the beam splitter model, the light field operators on the two detectors of BHD can be written as
The output photon number of the BHD system is given by
Substituting Equations (7) and (9) into Equation (
12), we have
where
is the quantum noise of the signal beam and is related to the “detection mode”. In Equation (
13), the first term represents the signal, and the second term represents noise. For coherent light (
), the signal-to-noise ratio (SNR) is defined as
When we choose an intermediate mode
as the local oscillator, i.e.,
, the corresponding BHD output and SNR are, respectively, given by
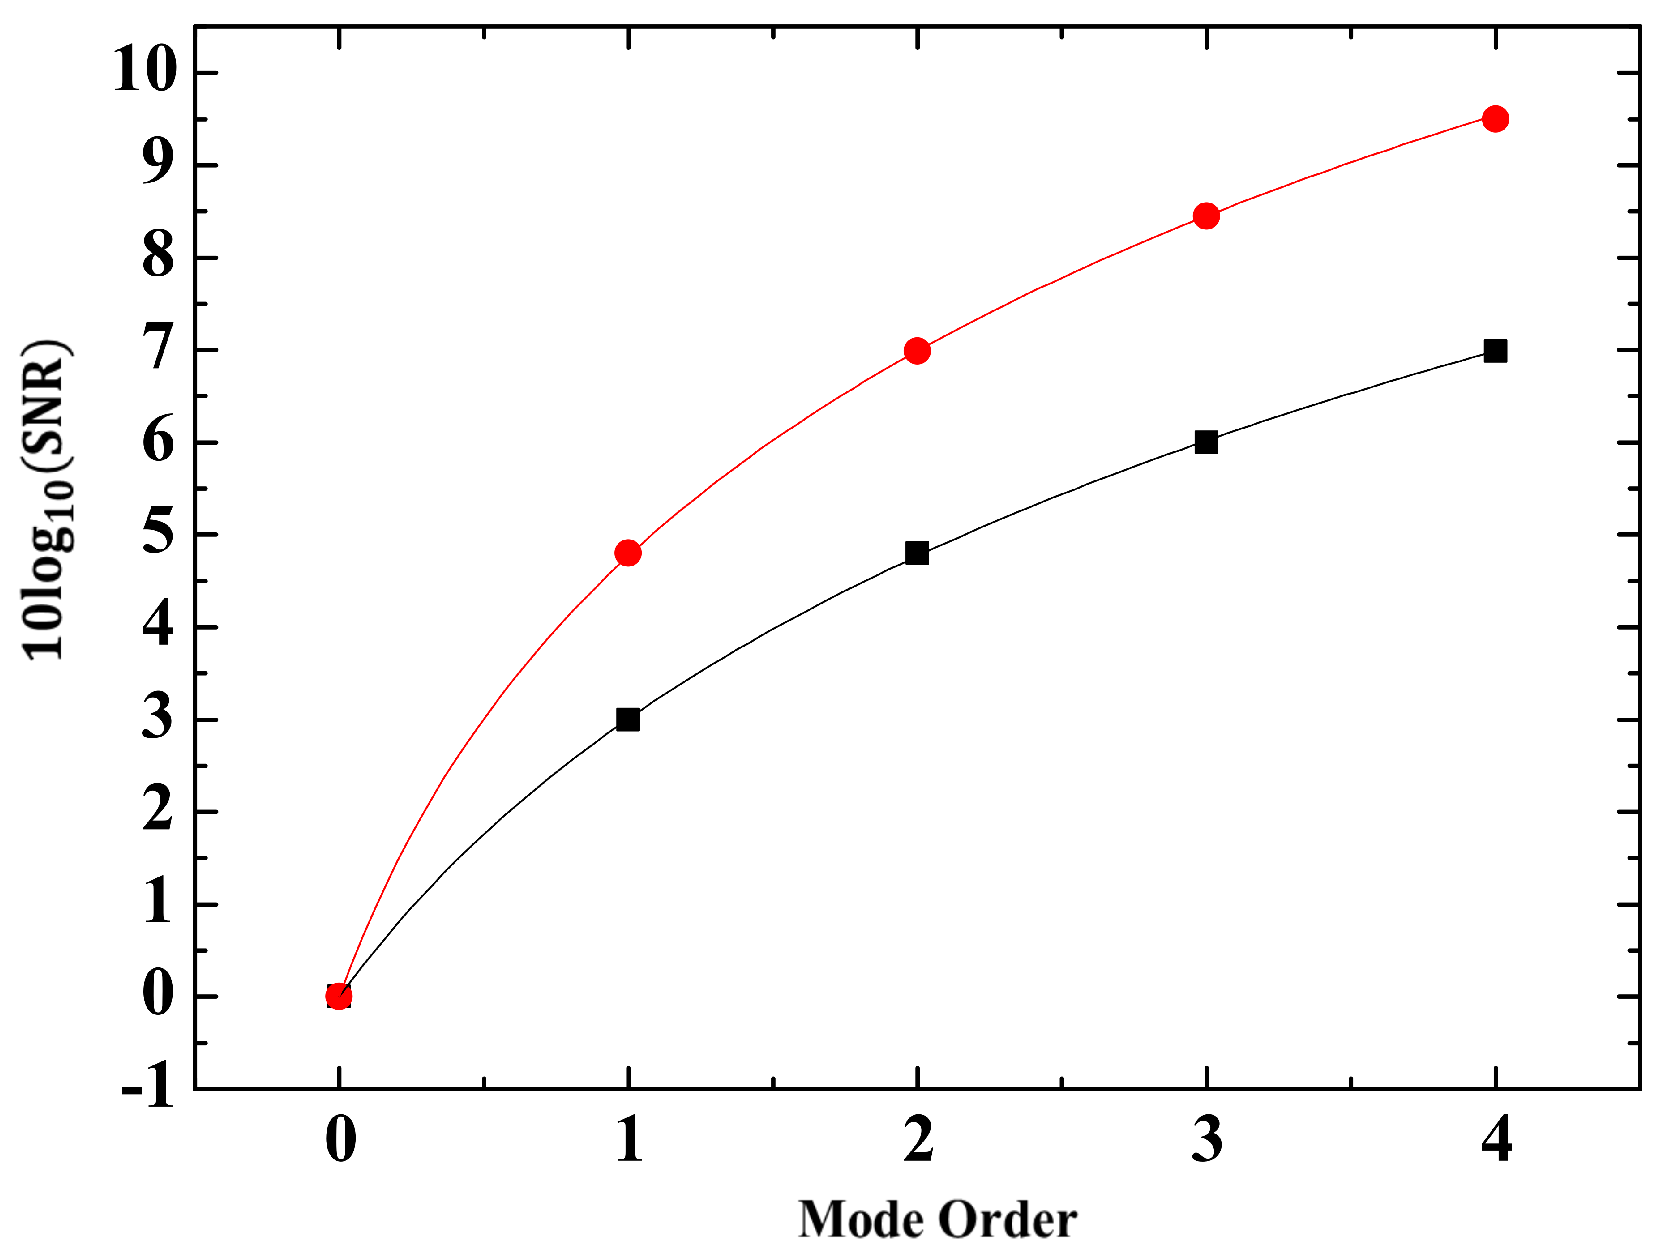
We plot the SNRs varying with the mode order using the logarithmic scale in
Figure 2, with circle dots and square dots, respectively, corresponding to Equations (14) and (16). Both are normalized to
, which represents the SNR with the coherent
signal mode. Both SNRs increase with the mode order increasing. The SNR of the optimal scheme indicates an improvement of (2
n + 1) for the nth-order mode compared to the fundamental mode. Furthermore, the SNR of the optimal scheme is higher than that of the intermediate one for any high-order mode. For example, with the first-order mode probe, the SNR of optimal BHD is 1.5 times that of the SNR of the intermediate BHD.
We derive the QCRB of the tilt measurement by using a similar method to Reference [
22]. We use the minimum measurable tilt to characterize the measurement precision. For the optimal BHD measurement discussed above, the minimum measurable tilt is defined as the tilt with
. According to Equation (
14), the minimum measurable tilt is given by
The precision of the estimation of any physical parameter
is limited by the Cramer–Rao bound and only depends on properties of the probe beam, such as the intensity, beam profile, and the quantum fluctuations. Furthermore, the variance of any unbiased estimator of
is necessarily greater than
, where
is the Fisher information [
23]. The minimum measurable information of any parameter
is bounded by the quantum Cramer–Rao bound [
22]
where
is the best achievable sensitivity for measuring a small variation of
,
is the quantum noise,
is the mean photon number,
is its derivative with respect to
,
Q is the number of measurement repetitions, and
is the derivative of the normalized transverse field distribution
with respect to
at
.
For tilt measurements with the high-order
probe beam,
is replaced by the tilt
,
,
,
as the coherent light is used. We then obtain the QCRB for the tilt measurement of
By comparing Equations (17) and (19), we can see that the optimal BHD scheme reaches the QCRB.
In fact, for the probe beam of the fundamental mode, the
mode itself is the optimal local oscillator, as there is no lower mode than zero. That is why, in References [
16,
17], the sensitivity of displacement and tilt measurements at the Cramer–Rao Bound can be achieved for
probe beams using only
mode homodyne detection. However, for higher-order modes other than the fundamental mode, only the superposition mode (formed by the combination of two modes as the local oscillator) can reach the QCRB. We experimentally verify this theory by utilizing a probe beam that consists of modes up to the fourth order in the following.
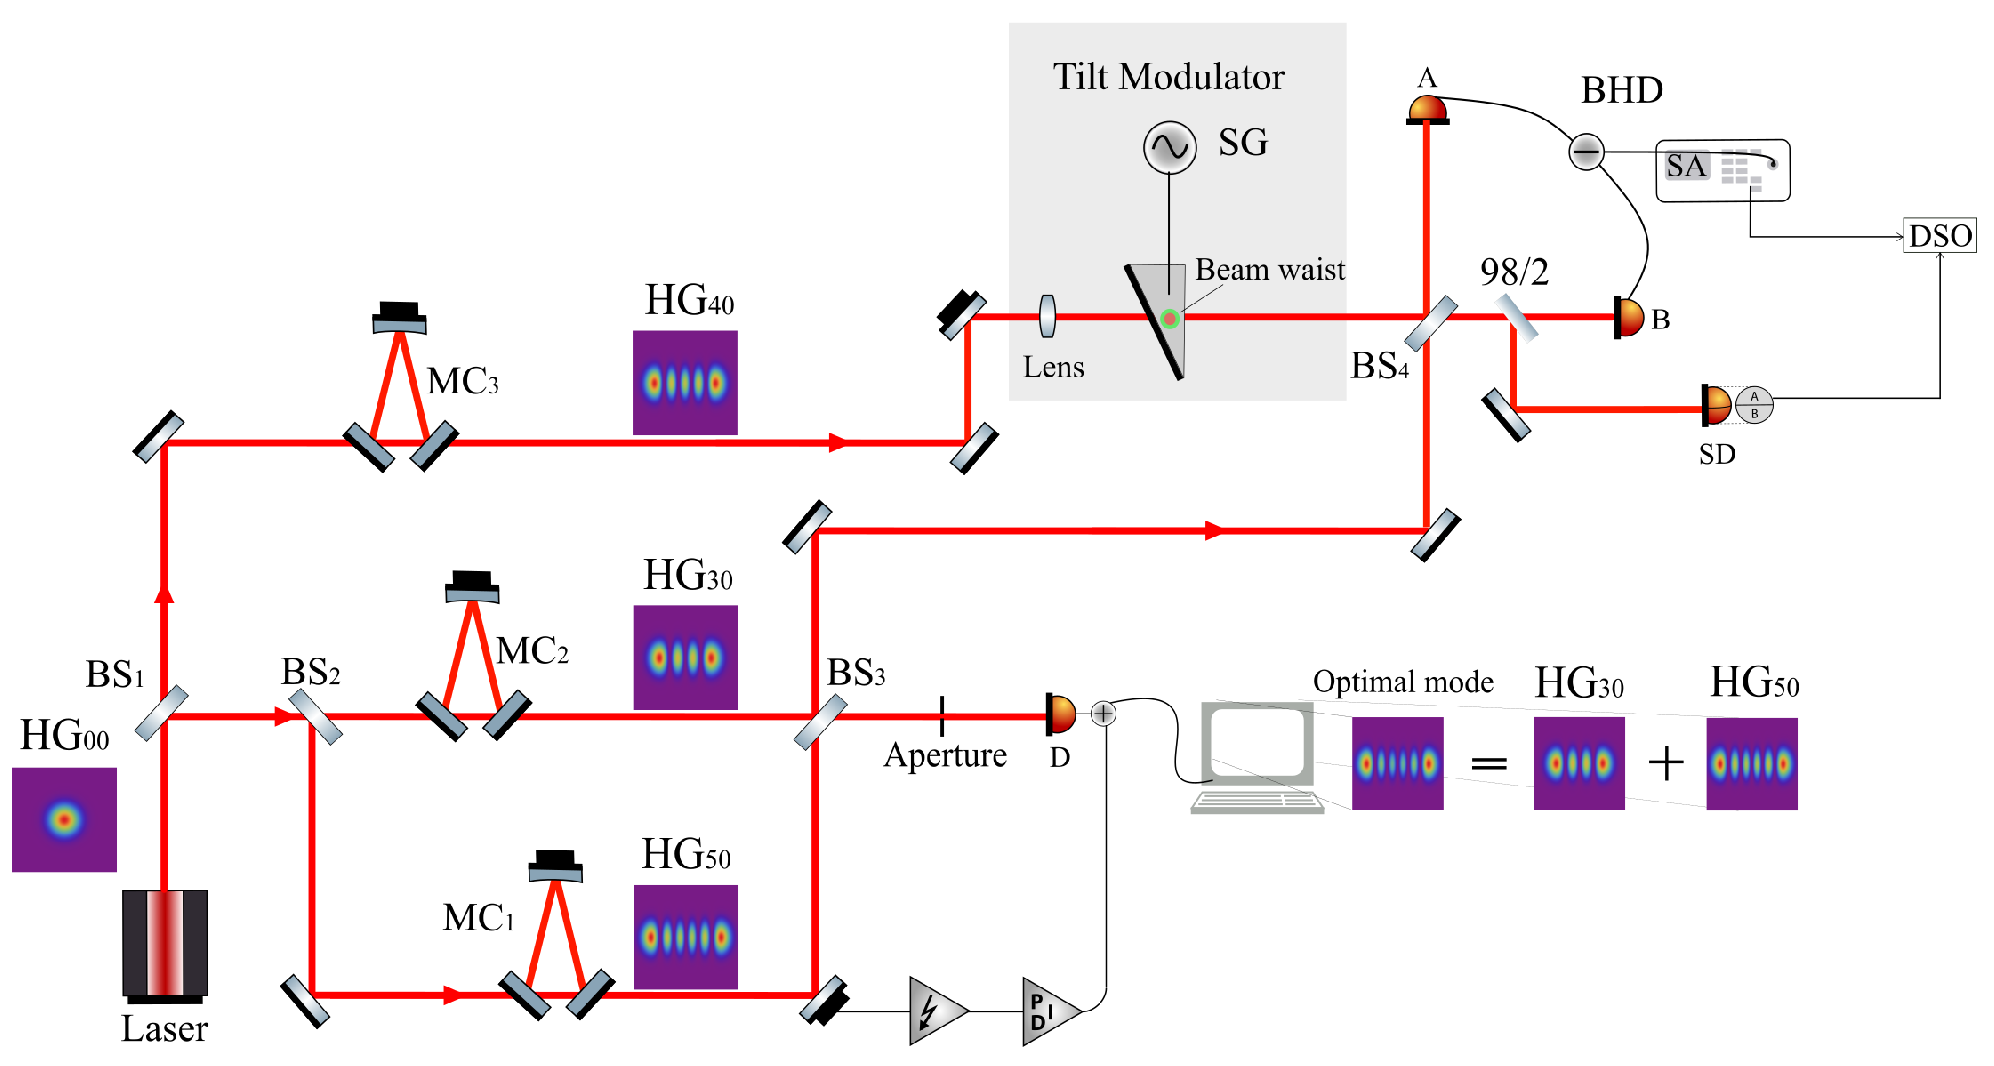
3. Experimental Setup and Results
We use different high-order HG modes as probe beams for tilt measurements, and apply spatially balanced homodyne detection (BHD) with intermediate and optimal local modes, respectively. The experimental setup is illustrated in
Figure 3. A laser beam from an 1080 nm optical fiber laser is split into three beams, one is mode-converted into the
mode as the probe by a mode converter (
). The other two beams are, respectively, mode-converted into the
mode and
mode by two mode converters (
). Then the two modes of
and
are coupled on a
to produce the optimal local oscillator.
The probe beam passes through a tilt modulator, which is made of a wedged electro-optic crystal to perform a pure tilt modulation [
24]. The tilted
mode and optimal local beam are coupled on a 50/50 beam splitter (
) for optimal BHD to demodulate the tilt signals. In the intermediate BHD, the
mode is blocked; only the
mode is left to be the local oscillator to demodulate the tilt signals.
The wedged crystal is driven by a sine wave signal to simulate a slight tilt signal at 3 MHz. The experimental parameters are as follows: the signal beam power,
= 30
W; the modulation peak-to-peak voltage is 3 V; the beam waist of
,
= 220
m; the resolution bandwidth of the spectrum analyzer, RBW = 30 kHz; the video bandwidth, VBW = 300 Hz; and the analyzing frequency,
f = 3 MHz. In
Figure 3, we select the probe beam with a mode order of
n = 4.
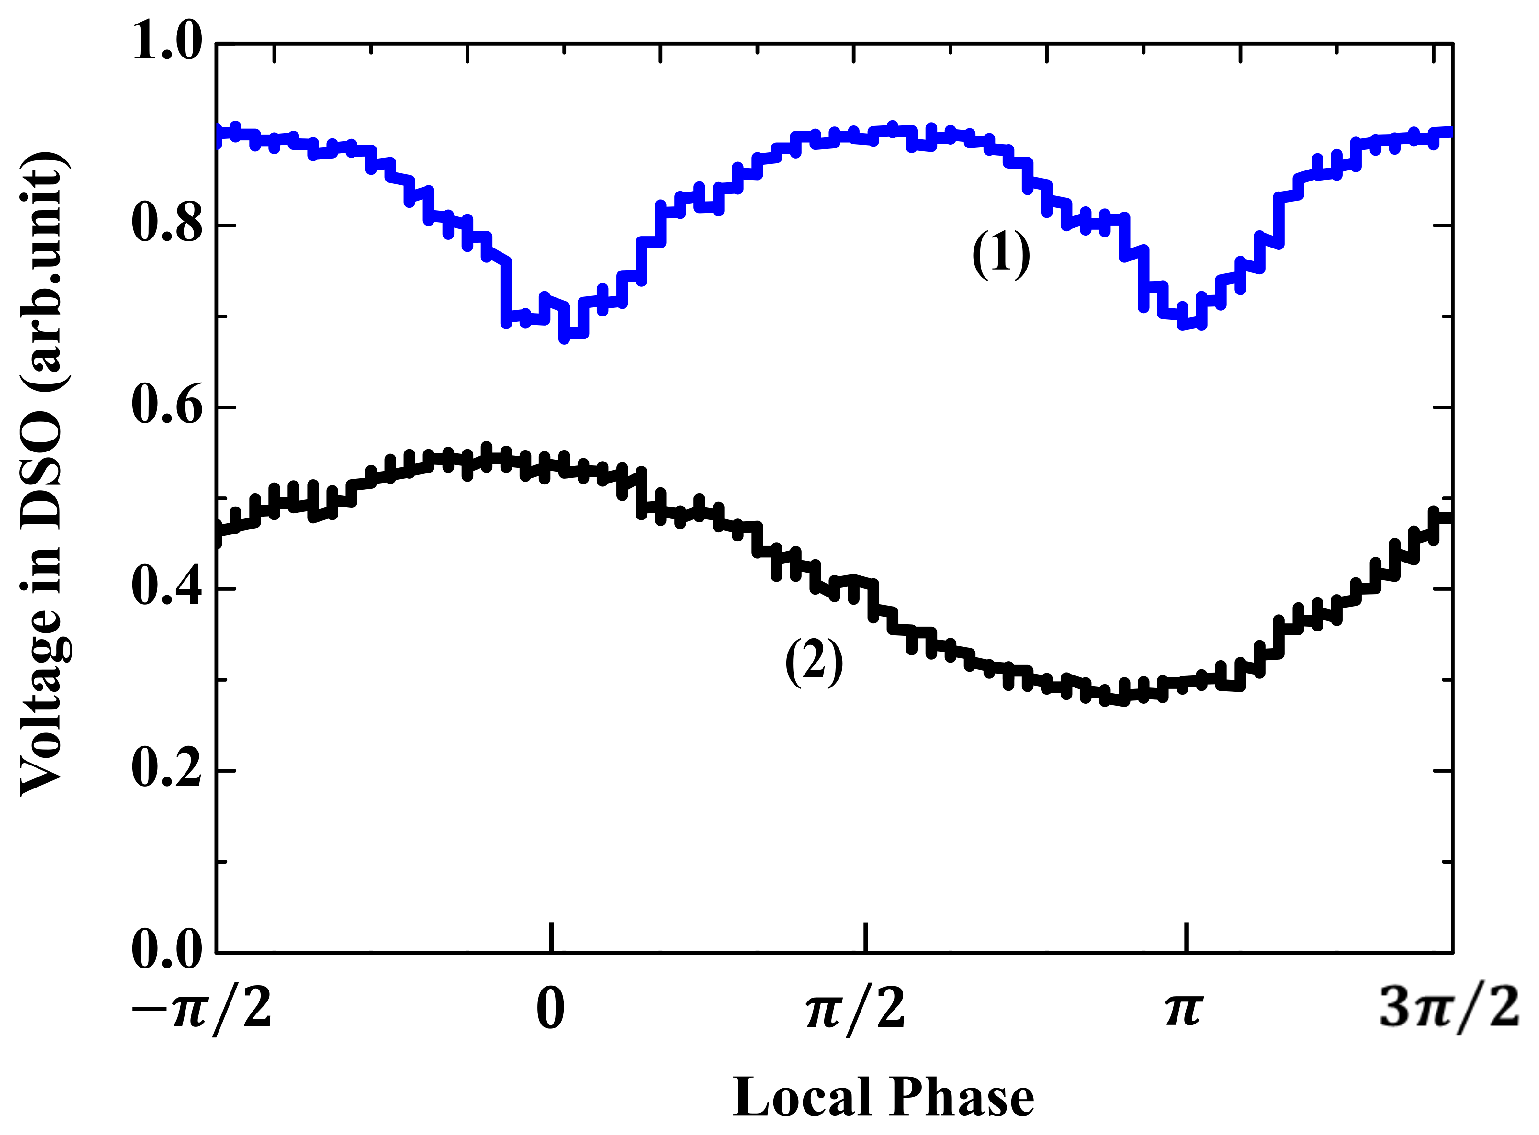
As shown in
Figure 3, the small fraction of the optimal local beam passed through an aperture to extract the interference signal, which is used for the feedback control of the relative phase between the
and
modes. The relative phase between the
and
modes was locked to
and the power ratio of
and
modes is
. A small part (
) separated from one beam of BHD is used to construct the 4F phase monitoring system to check the tilt signal of a laser probe beam [
24]. The demodulated tilt signal from the spectrum analyzer (trace1) and the interference signal (trace2) from the 4F monitoring system are shown in
Figure 4, with the scanning local phase. The tilt signal appears, approximately, at the interfering phase of
, which is consistent with the theory.
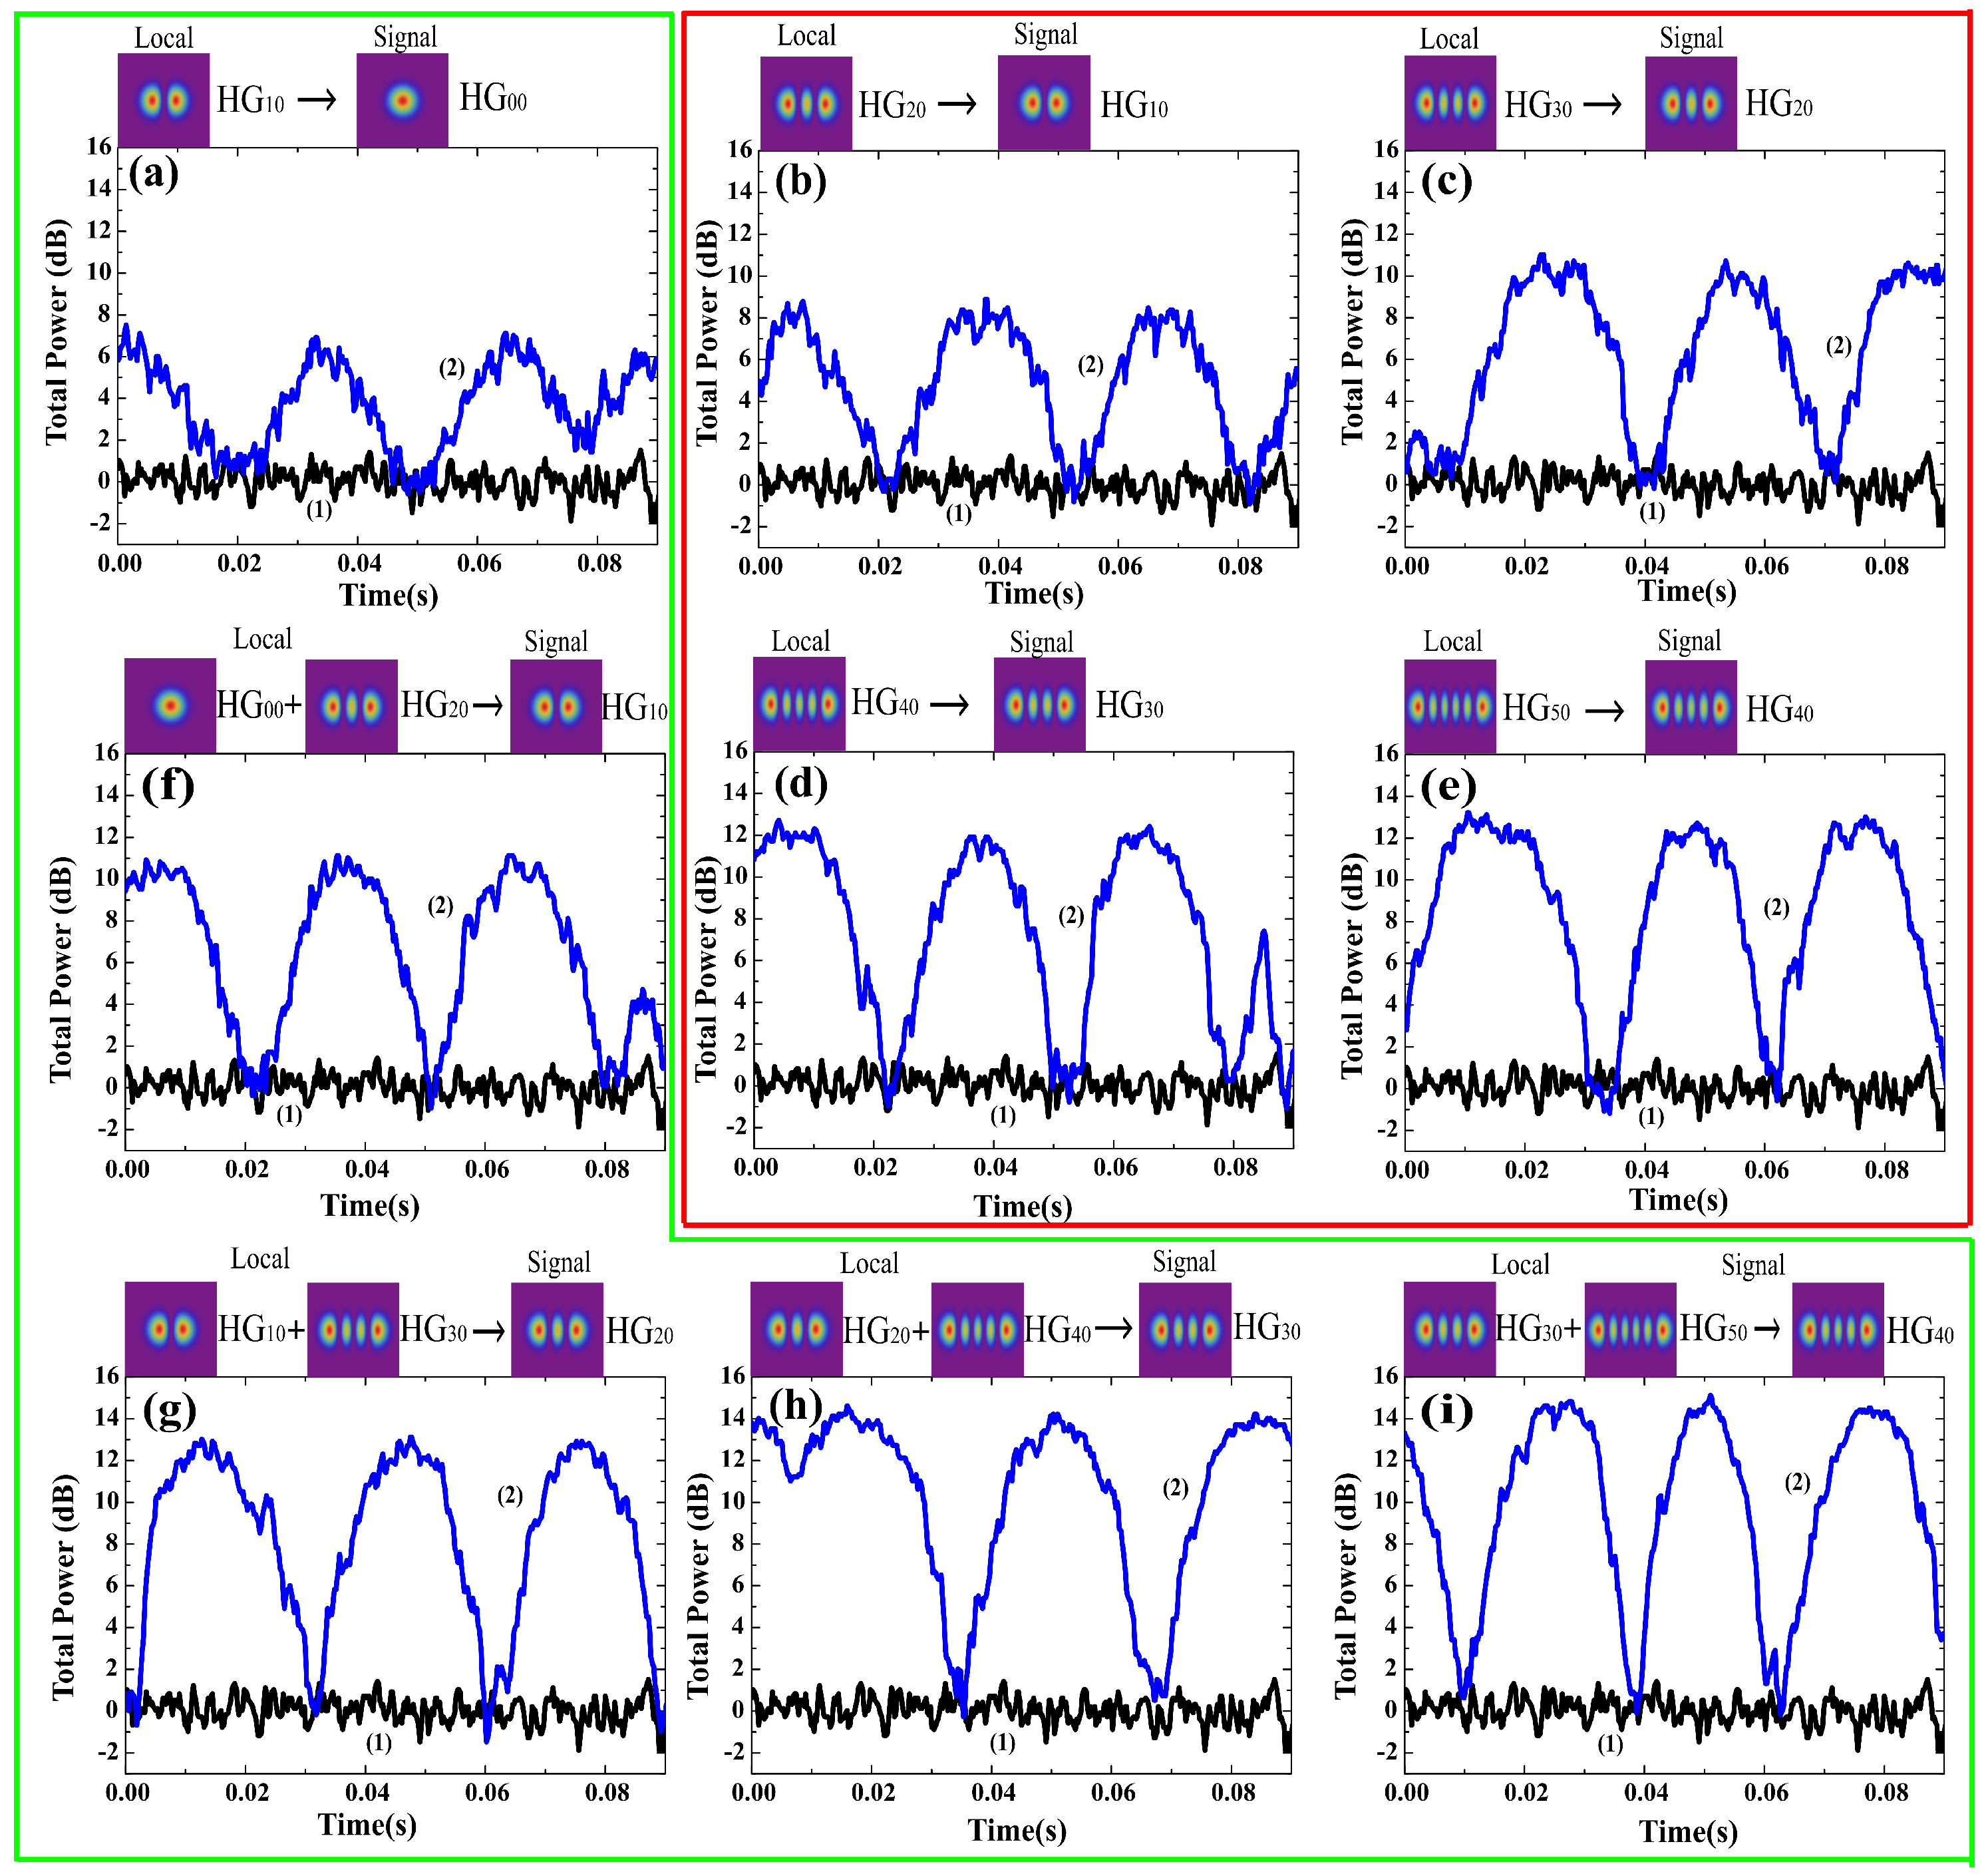
The experimental results of the demodulated tilt signal from the spectrum analyzer are shown in
Figure 5. With probe beams of the same optical power but different modes, the shot noise limits (SNLs) are the same, shown by trace1in any single measurement, and obtained by switching off the tilt modulation. Trace2 corresponds to the tilt signals with the scanning phase of the local beam. The tilt modulation depths are the same for all of the measurements. With the traditional scheme with the
mode as the probe and the
mode as the local oscillator, the total power of the tilt signal of 6.6 dB above the SNL is shown in
Figure 5a. The results for the
,
,
, and
modes as the probes, with an intermediate high-order mode as the local oscillator, are shown in
Figure 5b–e. The total powers of the tilt signal are, respectively, 8.9 dB, 10.5 dB, 11.8 dB, and 12.6 dB above the SNL. The results of the
to
modes as the probes, and the superpositions of high-order modes as local oscillators, are shown in
Figure 5f–i. The total powers of the tilt signal are, respectively, 10.6 dB, 12.7 dB, 14.1 dB, and 14.8 dB above the SNL. The results of the intermediate and optimal BHD are, respectively, shown in the red and green boxes.
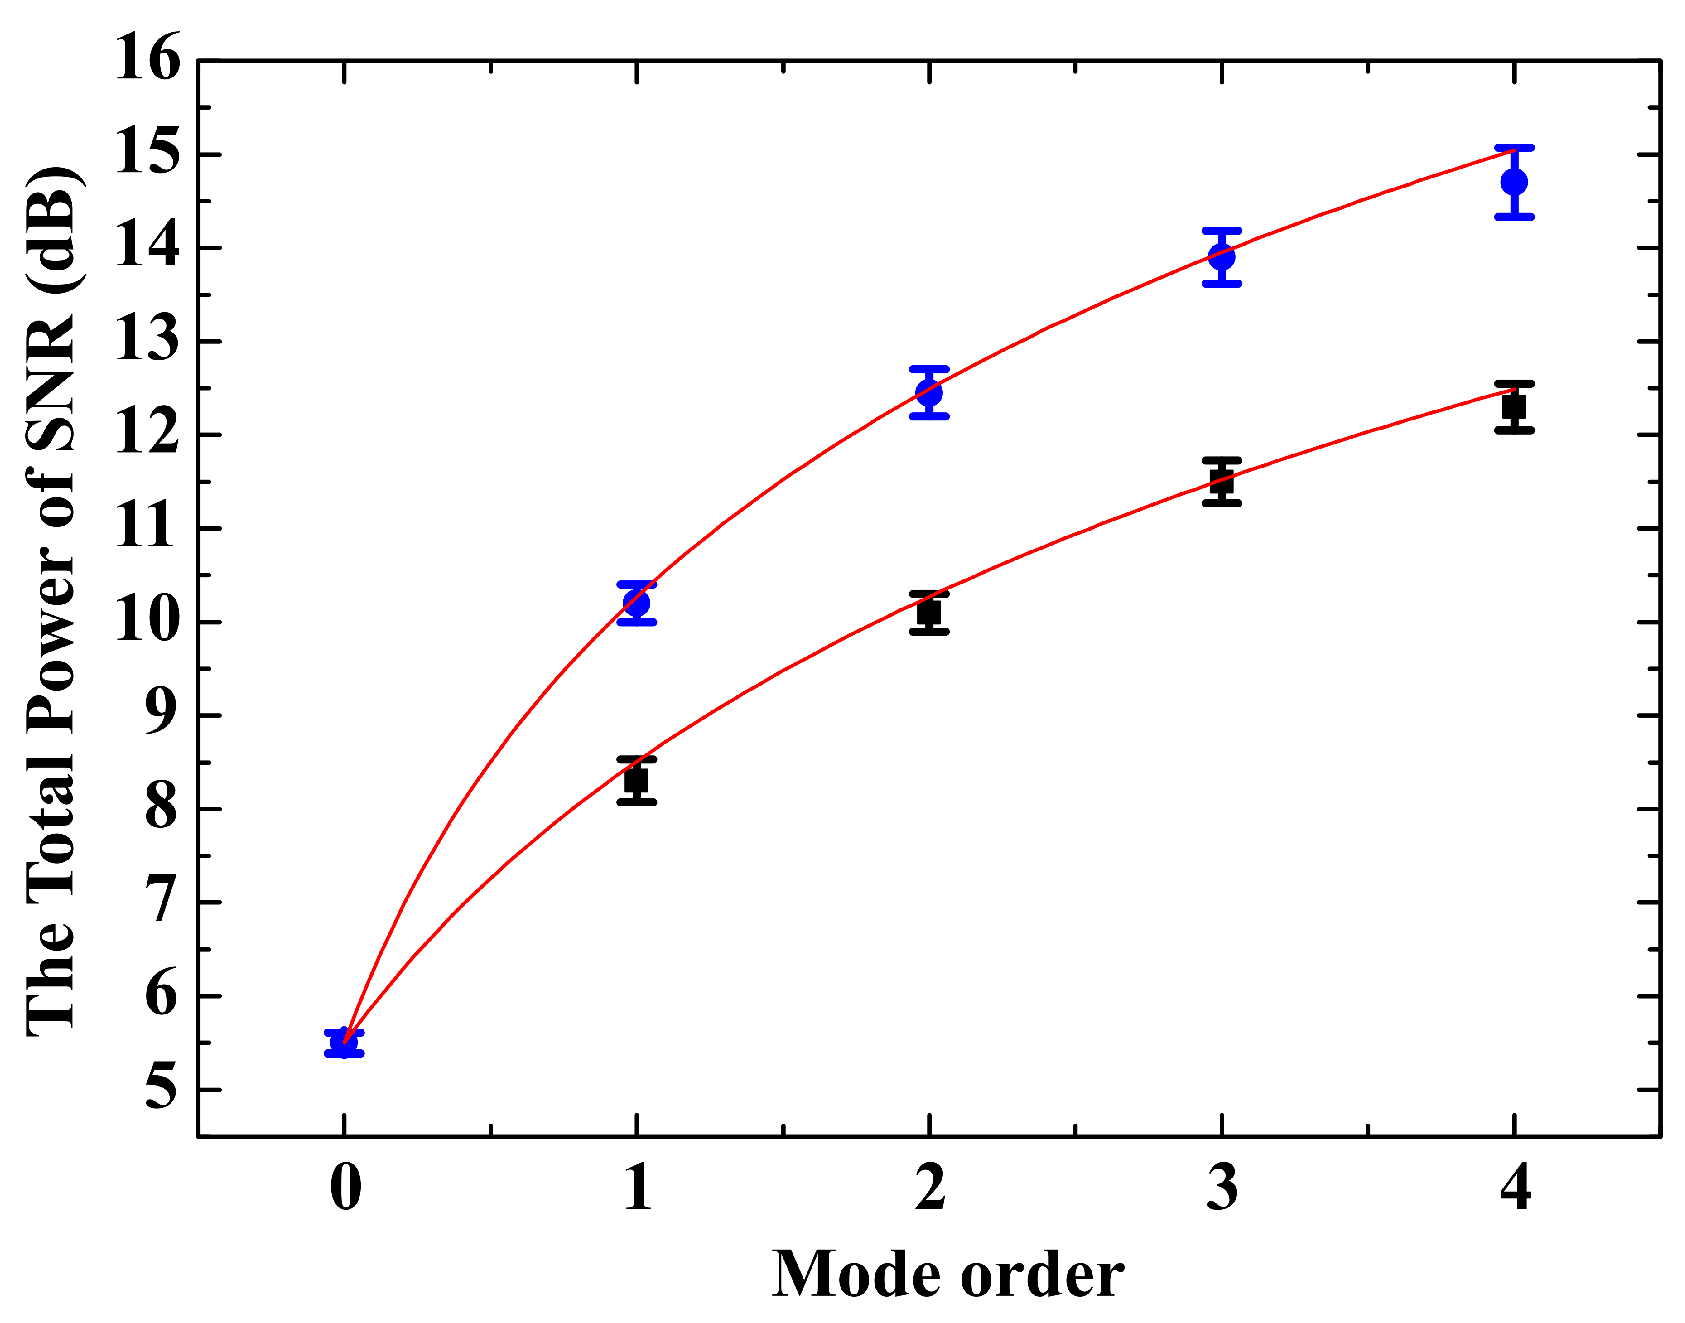
The SNRs derived from the total powers, which vary with the mode orders of the probes, are shown in
Figure 6, along with the optimal BHD (blue circle dots) and intermediate BHD (black square dots), respectively. The corresponding fitting results are shown in red lines. With the increasing mode order of the probe and with the optimal BHD, the SNRs become higher, showing a good agreement with the theoretical prediction. Furthermore, the results of the optimal BHD reach the quantum Cramer–Rao bound. For example, with the
mode as the probe beam, the SNR of the optimal BHD is 9.2 dB above the shot noise limit (SNL), which approaches the ultimate value of 9.5 dB. The results show an improvement of 2.3 dB compared to the intermediate BHD scheme, indicating great potential for future applications.


