Communication

Self-Mixing Interferometry Cooperating with Frequency Division Multiplexing for Multiple-Dimensional Displacement Measurement

1
School of Computer and Electronic Information, Nanjing Normal University, Nanjing 210023, China
2
School of Electrical, Computer and Telecommunications Engineering, University of Wollongong, Wollongong, NSW 2522, Australia
*
Author to whom correspondence should be addressed.
Photonics 2023, 10(7), 839; https://doi.org/10.3390/photonics10070839
Submission received: 30 June 2023 / Revised: 17 July 2023 / Accepted: 18 July 2023 / Published: 20 July 2023
(This article belongs to the Special Issue Optical Measurement Systems)

Abstract

:
In this study, a multiple-dimensional displacement measurement technology is demonstrated by using self-mixing interferometry (SMI) cooperating with a frequency division multiplexing (FDM) technique. The proposed SMI configuration with a single laser generates three modulated light beams with different carrier frequencies. Each beam is incident on a planar grating with its own auto-collimation diffraction angle. The diffracted beams return to the laser cavity and then self-mixing interference occurs. An algorithm based on FDM is developed for multiple-dimensional displacement reconstruction from a single SMI signal. Experiments are conducted to verify the proposed approach. This paper shows an attractive sensing system for multiple-dimensional displacement featuring compact configuration, high resolution and better immunity to environmental disturbances.

1. Introduction

Precision displacement measurement plays an important role in a variety of industries, such as probe-based microscopy precision manufacturing, photolithography, and so on. Various techniques to achieve precise measurement have been proposed and developed, such as the linear encoder, capacitance sensor, strain gauge and interferometer [1,2,3,4]. With the rapid development of modern industry, there is an increased demand for displacement sensing with not only high resolution but also multiple-dimensional measurement.
Traditional laser interferometry has been widely used for precision displacement sensing due to the advantages of noncontact, high resolution and wide measurement range. In order to perform simultaneous measurement of three-dimensional displacement, three interferometers are mounted perpendicular to each other, and each interferometer is sensitive to one-dimensional displacement. Measurement error induced by orthogonal misalignment of the three interferometers is unavoidable. Grating interferometry (GI) is another valuable tool for displacement measurement [5,6]. To achieve three-dimensional displacement sensing, the GI is typically composed of a reference XY grating, a scale XY grating, many polarizers, beam splitters, mirrors and several photodetectors. It can exhibit good performance, but at the expense of a very complicated optical configuration [7].
Self-mixing interferometry (SMI) is simpler than traditional interferometry because many optical elements, such as the beam splitter, reference mirror and external photodetector, are not required. Based on SMI, many smart and simple sensing systems have been developed [8,9,10,11,12,13,14,15]. Similar to traditional dual-beam interferometry, most SMI can only measure one-dimensional displacement, and the measurement accuracy strongly depends on the wavelength stability. However, the wavelength is easily influenced by the optical feedback, air humidity and air refractive index over the optical path. This is a serious problem for high-precision measurement. By introducing a one-dimensional diffraction grating in SMI, we previously proposed a novel SMI which transfers the measuring scale from the laser wavelength to the grating pitch [16,17]. Owing to the low thermal expansion coefficient of the grating substrate, the displacement sensor has good stability and small zero drift. However, multiple identical lasers and detectors are needed in the optical system to measure multiple-dimensional displacement. The difference in the wavelength of lasers will lead to measurement errors.
In this paper, both a two-dimensional crossed grating and a frequency division multiplexing (FDM) technique are introduced into the SMI system. To the best of our knowledge, it is the first time FDM has been combined with SMI for simultaneous sensing of multiple-dimensional displacement. As the system only needs a single laser, the overall system is more compact and easier to operate compared to other multiple-dimensional displacement measurement systems. The principle of measurement and the signal processing method are presented. Several displacement measurements are performed to demonstrate the performance of the proposed method. Furthermore, the associated measurement errors caused by different yaw angles are discussed.

2. Theory

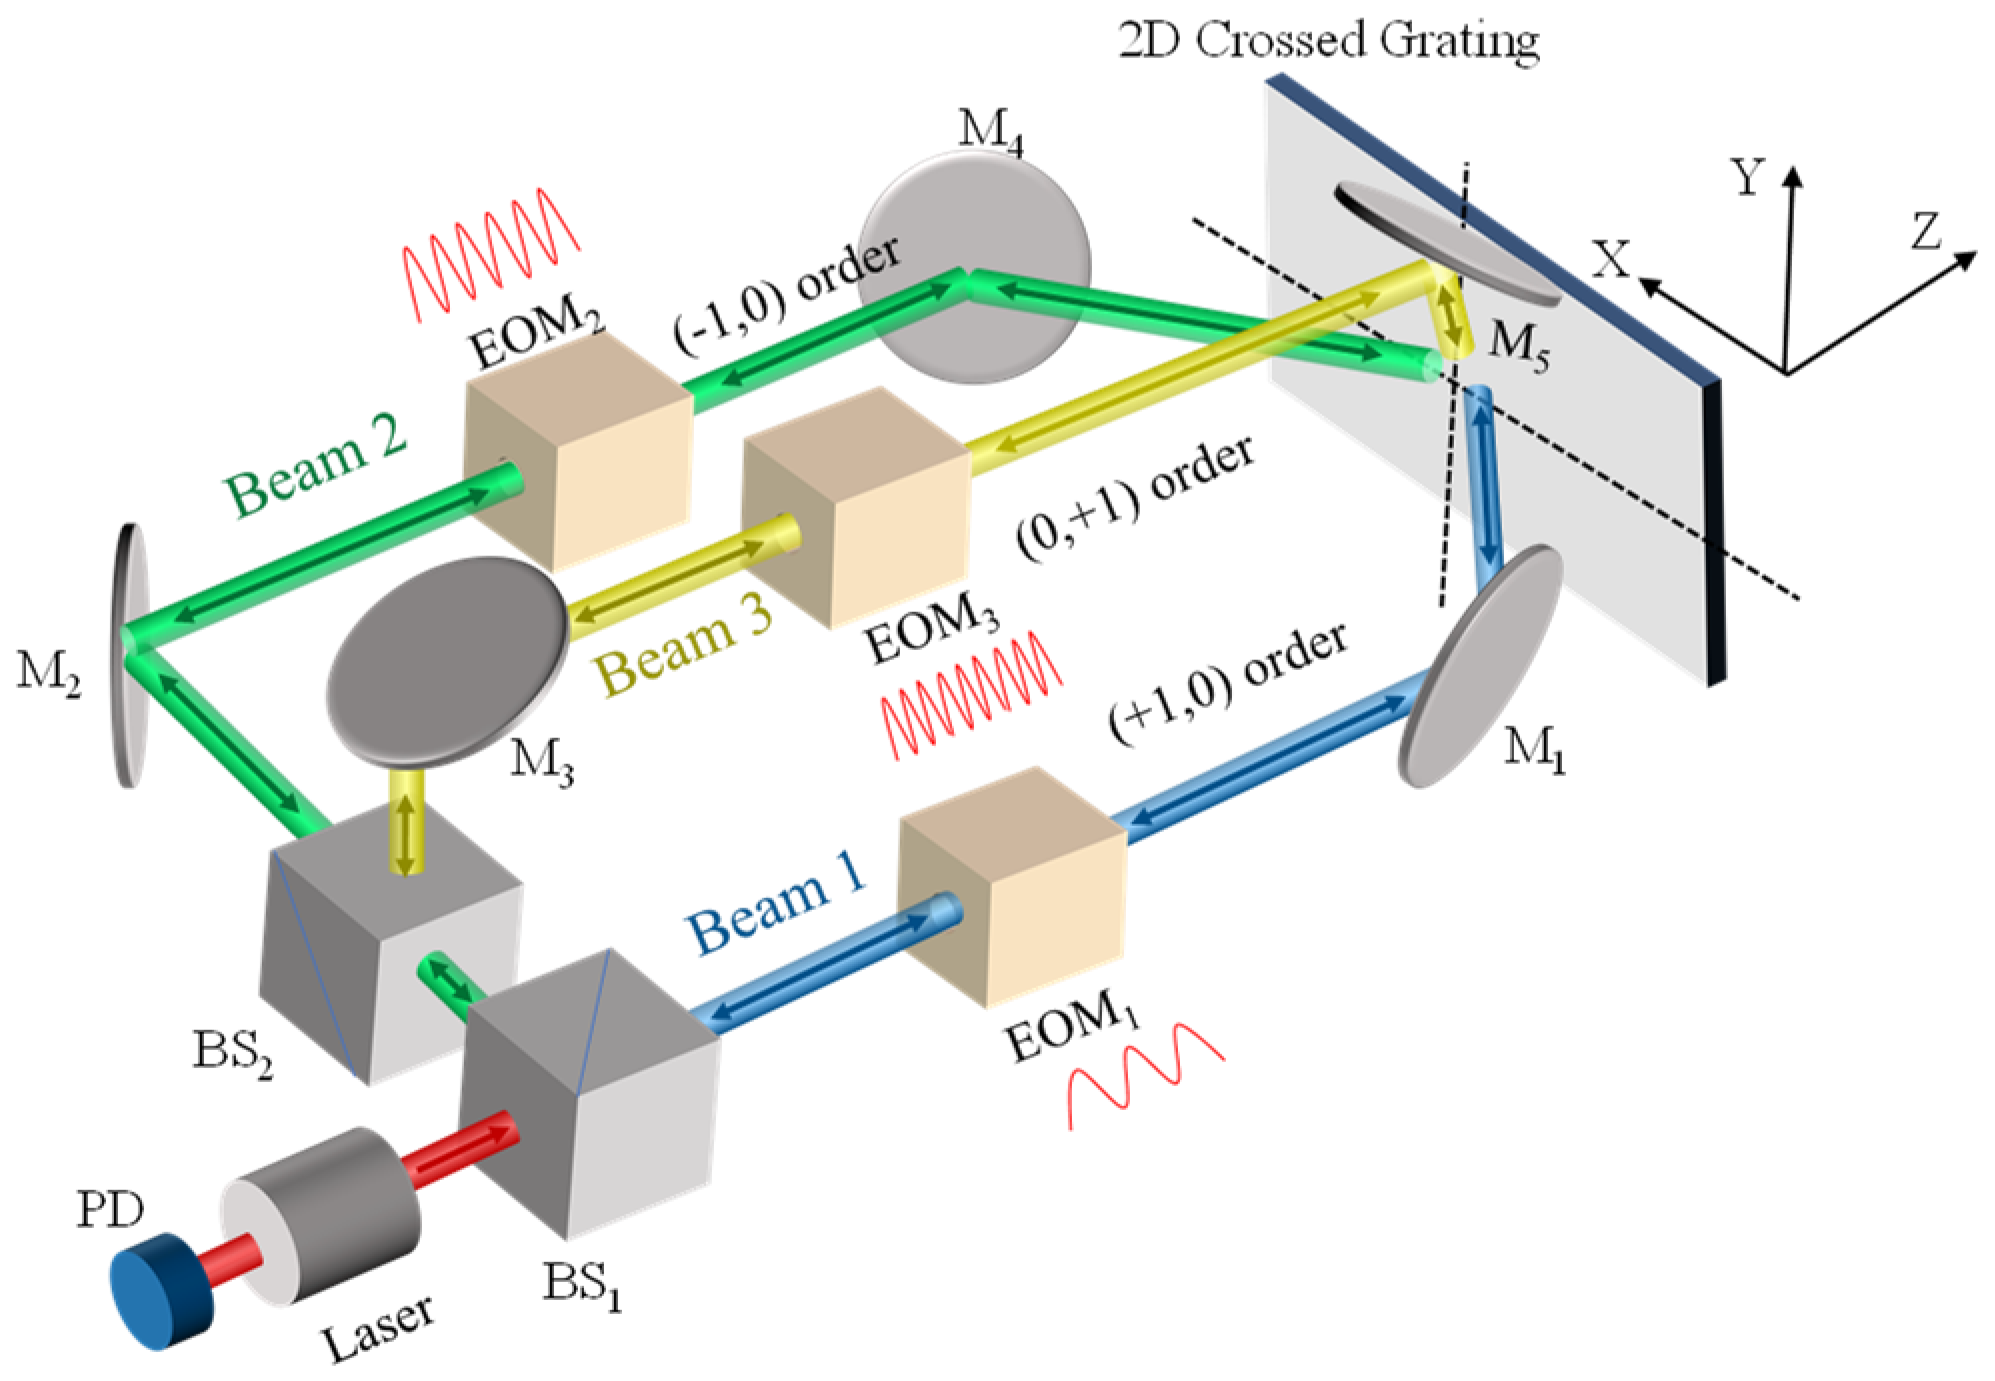
2.1. Theory of Three-Dimensional Displacement Measurement by Grating-Based SMI

The schematic diagram of a grating-based SMI is shown in Figure 1. In a special case called the Littrow configuration, the beam emitted from a laser diode is incident onto a reflection grating and the 1st-order beam diffracts back into the laser cavity; thus, self-mixing interference occurs. The interference signal is monitored by the built-in photodetector of the laser diode. In this case, the grating equation can be simplified to [18]:
2 d sin θ = λ ,
where θ denotes the incident and diffractive angles, d is the grating pitch and λ is the laser wavelength. According to the grating Doppler Effect, the frequency change of the first-order diffracted beam with respect to the in-plane motion of the grating is given by
Δ f = v d ,
where v denotes the in-plane moving velocity along the direction of grating vector. Thus, the optical phase variation resulting from the in-plane displacement x as in Figure 1 is φg = 2πx/d.
Figure 2 shows the schematic diagram of a grating-based SMI for multiple-dimensional displacement sensing. The measurement system is based on the first-order Littrow configuration. The target is a 2D crossed grating with the same grating pitch along the two orthogonal directions (dx = dy = d). The light beam emitted from the laser is split into three beams by BS1, BS2, M2 and M3. Each beam is incident on the planar grating with the first-order Littrow angle. The (±1, 0)-order beams refer to the ±1st-order diffraction beams corresponding to the grating vector in the X direction, while the (0, +1)-order beam refers to the +1st-order diffraction beam with respect to the grating vector in the Y direction [19]. Mirrors (M1, M4 and M5) are used to adjust the direction of the incident light. In order to obtain the maximum measurable range in the X, Y and Z directions, the three beams are preferably incident at the same point of the grating. Electro-optic modulators (EOM1, EOM2 and EOM3) are used to introduce phase modulation of each beam. If the angle between the polarization direction of the laser beam and the electro-optically active axis of the EOMs is 00, the EOMs can provide pure phase modulation with extremely low amplitude modulation. Owing to the Littrow configuration, the three diffracted beams can return to the laser cavity and mix with the internal light, and thus a self-mixing effect occurs. The SMI signal is detected by a photodetector (PD) suited behind the laser.
The optical path is illustrated as follows:
Beam1: laser → BS1 (transmission) → EOM1 → M1 → grating → M1 → EOM1 → BS1 (transmission) → laser.
Beam2: laser → BS1 (reflection) → BS2 (transmission) → M2 → EOM2 → M4 → grating → M4 → EOM2 → M2 → BS2 (transmission) → BS1 (reflection) → laser.
Beam3: laser → BS1 (reflection) → BS2 (reflection) → M3 → EOM3 → M5 → grating → M5 → EOM3 → M3 → BS2 (reflection) → BS1 (reflection) → laser.
According to the grating Doppler shift described in Equation (2), when the grating moves along the X direction with displacement x, the phase changes of beam 1, beam 2 and beam 3 in Figure 2 can be expressed as
Δ φ 1 , x = 2 π x d Δ φ 2 , x = 2 π x d Δ φ 3 , x = 0 ,
Similarly, when the grating moves along the Y direction with displacement y, the phase changes of beam 1, beam 2 and beam 3 are represented by
Δ φ 1 , y = 0 Δ φ 2 , y = 0 Δ φ 3 , y = 2 π y d ,
When the grating moves along the Z direction, the phase shift of each diffracted beam is a combination of a phase change induced by the grating Doppler shift and a phase change resulting from the variation of optical path length, which can be given by
Δ φ 1 , z = Δ φ 2 , z = Δ φ 3 , z = 2 π z d tan θ + 2 z λ cos θ ,
where θ denotes the incident and diffractive angle, which is the same for three beams.
Due to the limitation of diffraction efficiency, the proposed grating-based SMI operates in a weak feedback regime. Fluctuations in the laser wavelength caused by optical feedback can be neglected [20]. According to the multi-external-cavity SMI model, the SMI signal P detected by PD can be described as [21]
P = P 0 1 + i = 1 3 k i cos Δ φ i ,
where P0 denotes the laser output power without feedback, ki (i = 1, 2, 3) denotes the modulation factors and Δφi (i = 1, 2, 3) represents the phase variations of beams 1−3 induced by the grating displacement.
According to Equations (3)–(5), when the grating moves along X direction, Y direction and Z direction simultaneously, beam 1, beam 2 and beam 3 will obtain a phase shift, respectively, which can be expressed by
Δ φ 1 = Δ φ 1 , x + Δ φ 1 , y + Δ φ 1 , z = 2 π x d + 2 π z d tan θ + 2 z λ cos θ ,
Δ φ 2 = Δ φ 2 , x + Δ φ 2 , y + Δ φ 2 , z = 2 π x d + 2 π z d tan θ + 2 z λ cos θ ,
Δ φ 3 = Δ φ 3 , x + Δ φ 3 , y + Δ φ 3 , z = 2 π y d + 2 π z d tan θ + 2 z λ cos θ ,
As a result, if the phases Δφ1, Δφ2, Δφ3 can be extracted simultaneously from the single SMI signal, the 3D displacement of the grating can be obtained by
x = ( Δ φ 1 Δ φ 2 ) 4 π d z = λ cos θ ( Δ φ 1 + Δ φ 2 ) 4 π ( 2 d λ sin θ ) d y = Δ φ 3 2 π d + z tan θ 2 z λ cos θ d ,

2.2. Phase Extraction Based on FDM

In order to extract the phases Δφ1, Δφ2, Δφ3 from the SMI signal simultaneously, three electro-optic modulators (EOM1, EOM2 and EOM3) are introduced in the measurement system to apply sinusoidal phase modulation, as shown in Figure 2. The phase modulation function of each beam is represented by aisin(2πfit) (i = 1, 2, 3), where ai denotes the phase modulation index and fi is the modulation frequency. Here, fi values are not only different but cannot be multiples of each other so that it is possible to extract the phases Δφ1, Δφ2 and Δφ3 using the FDM method. Considering that each beam passes through the EOM twice in a round trip, the AC component of the modulated SMI signal is given by [21]
P ( t ) = P 0 i = 1 3 k i cos Δ φ i + 2 a i sin ( 2 π f i t ) ,
Expanding Equation (11) in a Fourier series, we can obtain
P ( t ) = P 0 i = 1 3 k i J 0 2 a i cos Δ φ i + 2 P 0 i = 1 3 k i cos Δ φ i n = 1 J 2 n 2 a i cos 2 π 2 n f i t , 2 P 0 i = 1 3 k i sin Δ φ i n = 0 J 2 n + 1 2 a i sin 2 π 2 n + 1 f i t
where Jn(2ai) are the Bessel functions of the first kind. It can be seen that the AC component of the SMI signal has a response at the fundamental frequency fi as well as harmonics. The first harmonic and the second harmonic have the following expressions:
P ( f i , t ) = 2 k i P 0 sin Δ φ i J 1 2 a i sin 2 π f i t = A i sin 2 π f i t i = 1 , 2 , 3 ,
P 2 f i , t = 2 k i P 0 cos Δ φ i J 2 2 a i cos 4 π f i t = B i cos 4 π f i t i = 1 , 2 , 3 ,
where Ai and Bi are the amplitudes of the first harmonic and second harmonic components. The phase variations Δφ1, Δφ2 and Δφ3 caused by the grating displacement can be calculated as follows:
Δ φ i = arctan J 2 ( 2 a i ) A i J 1 ( 2 a i ) B i i = 1 , 2 , 3 ,
After the phase variations Δφ1, Δφ2 and Δφ3 are extracted, the grating displacements x, y and z can be reconstructed from the relationship shown in Equation (10).

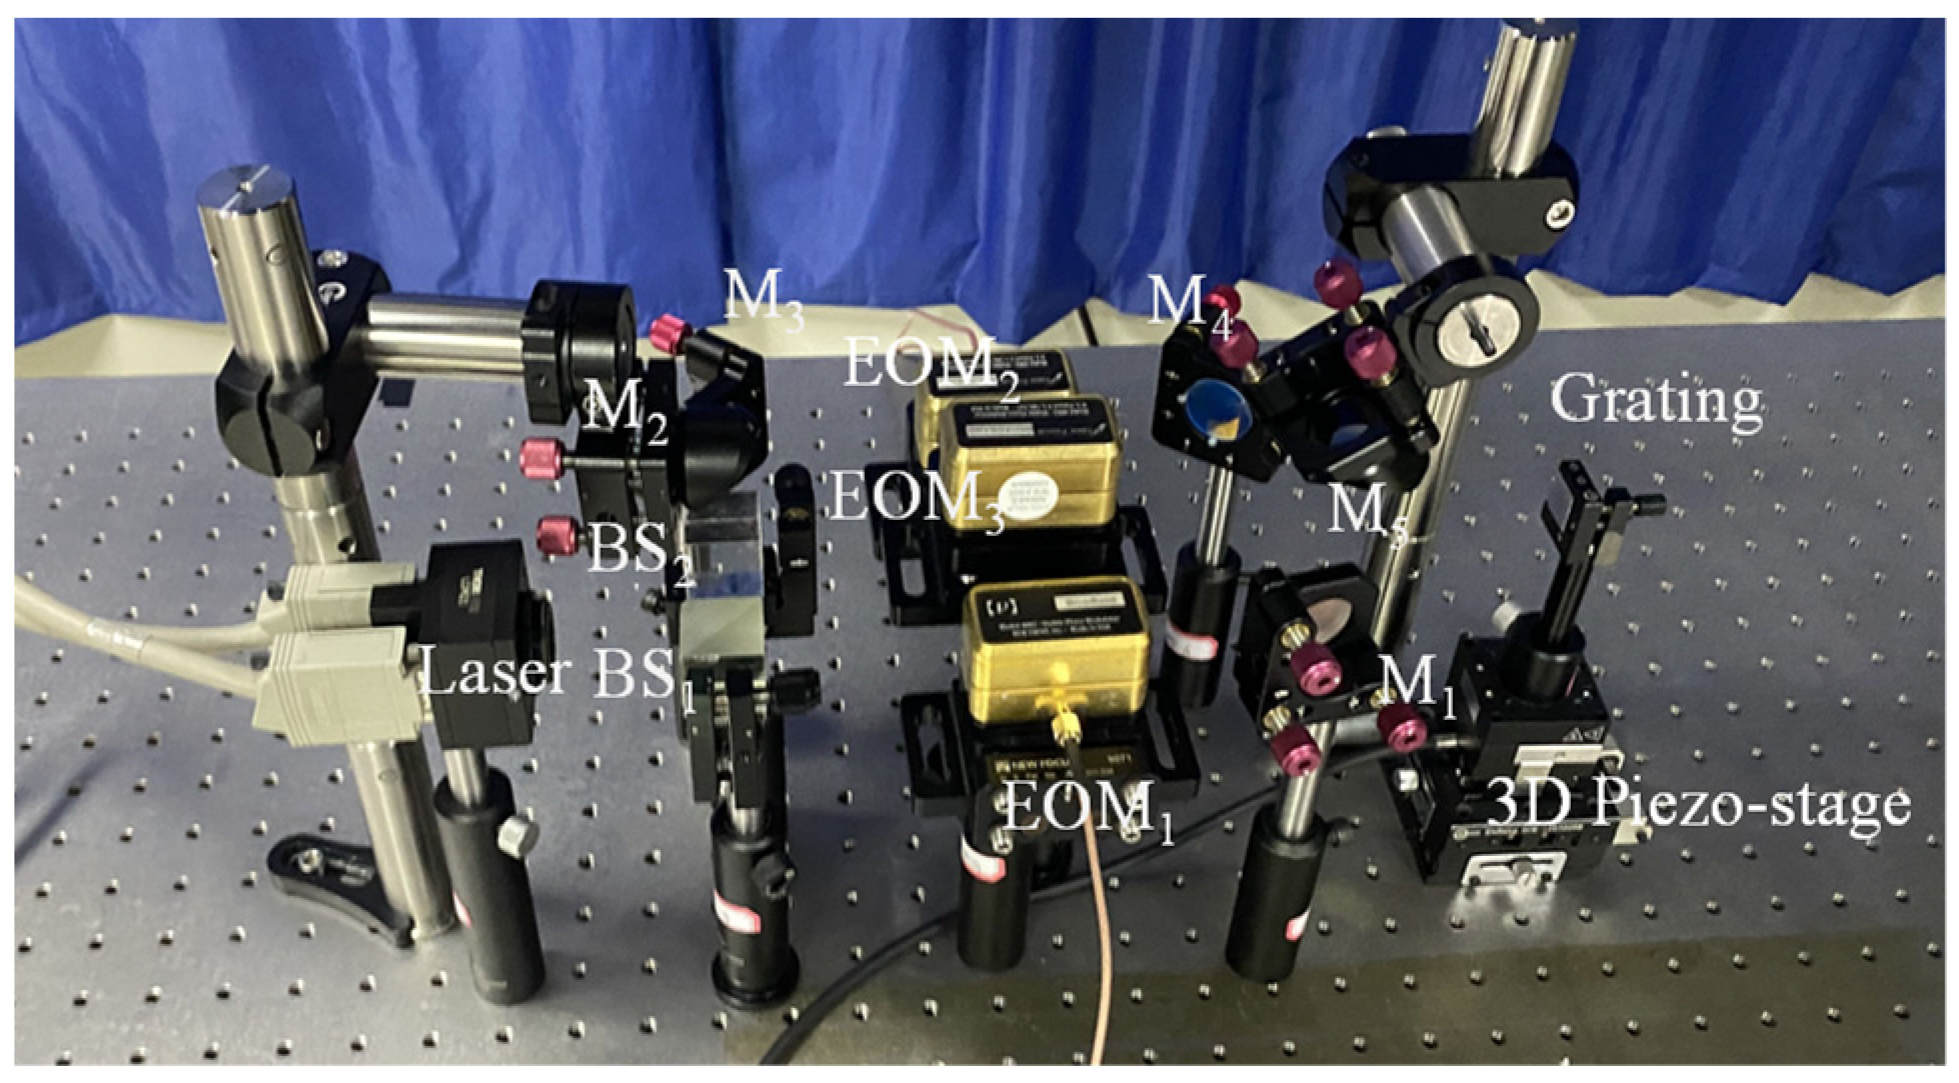
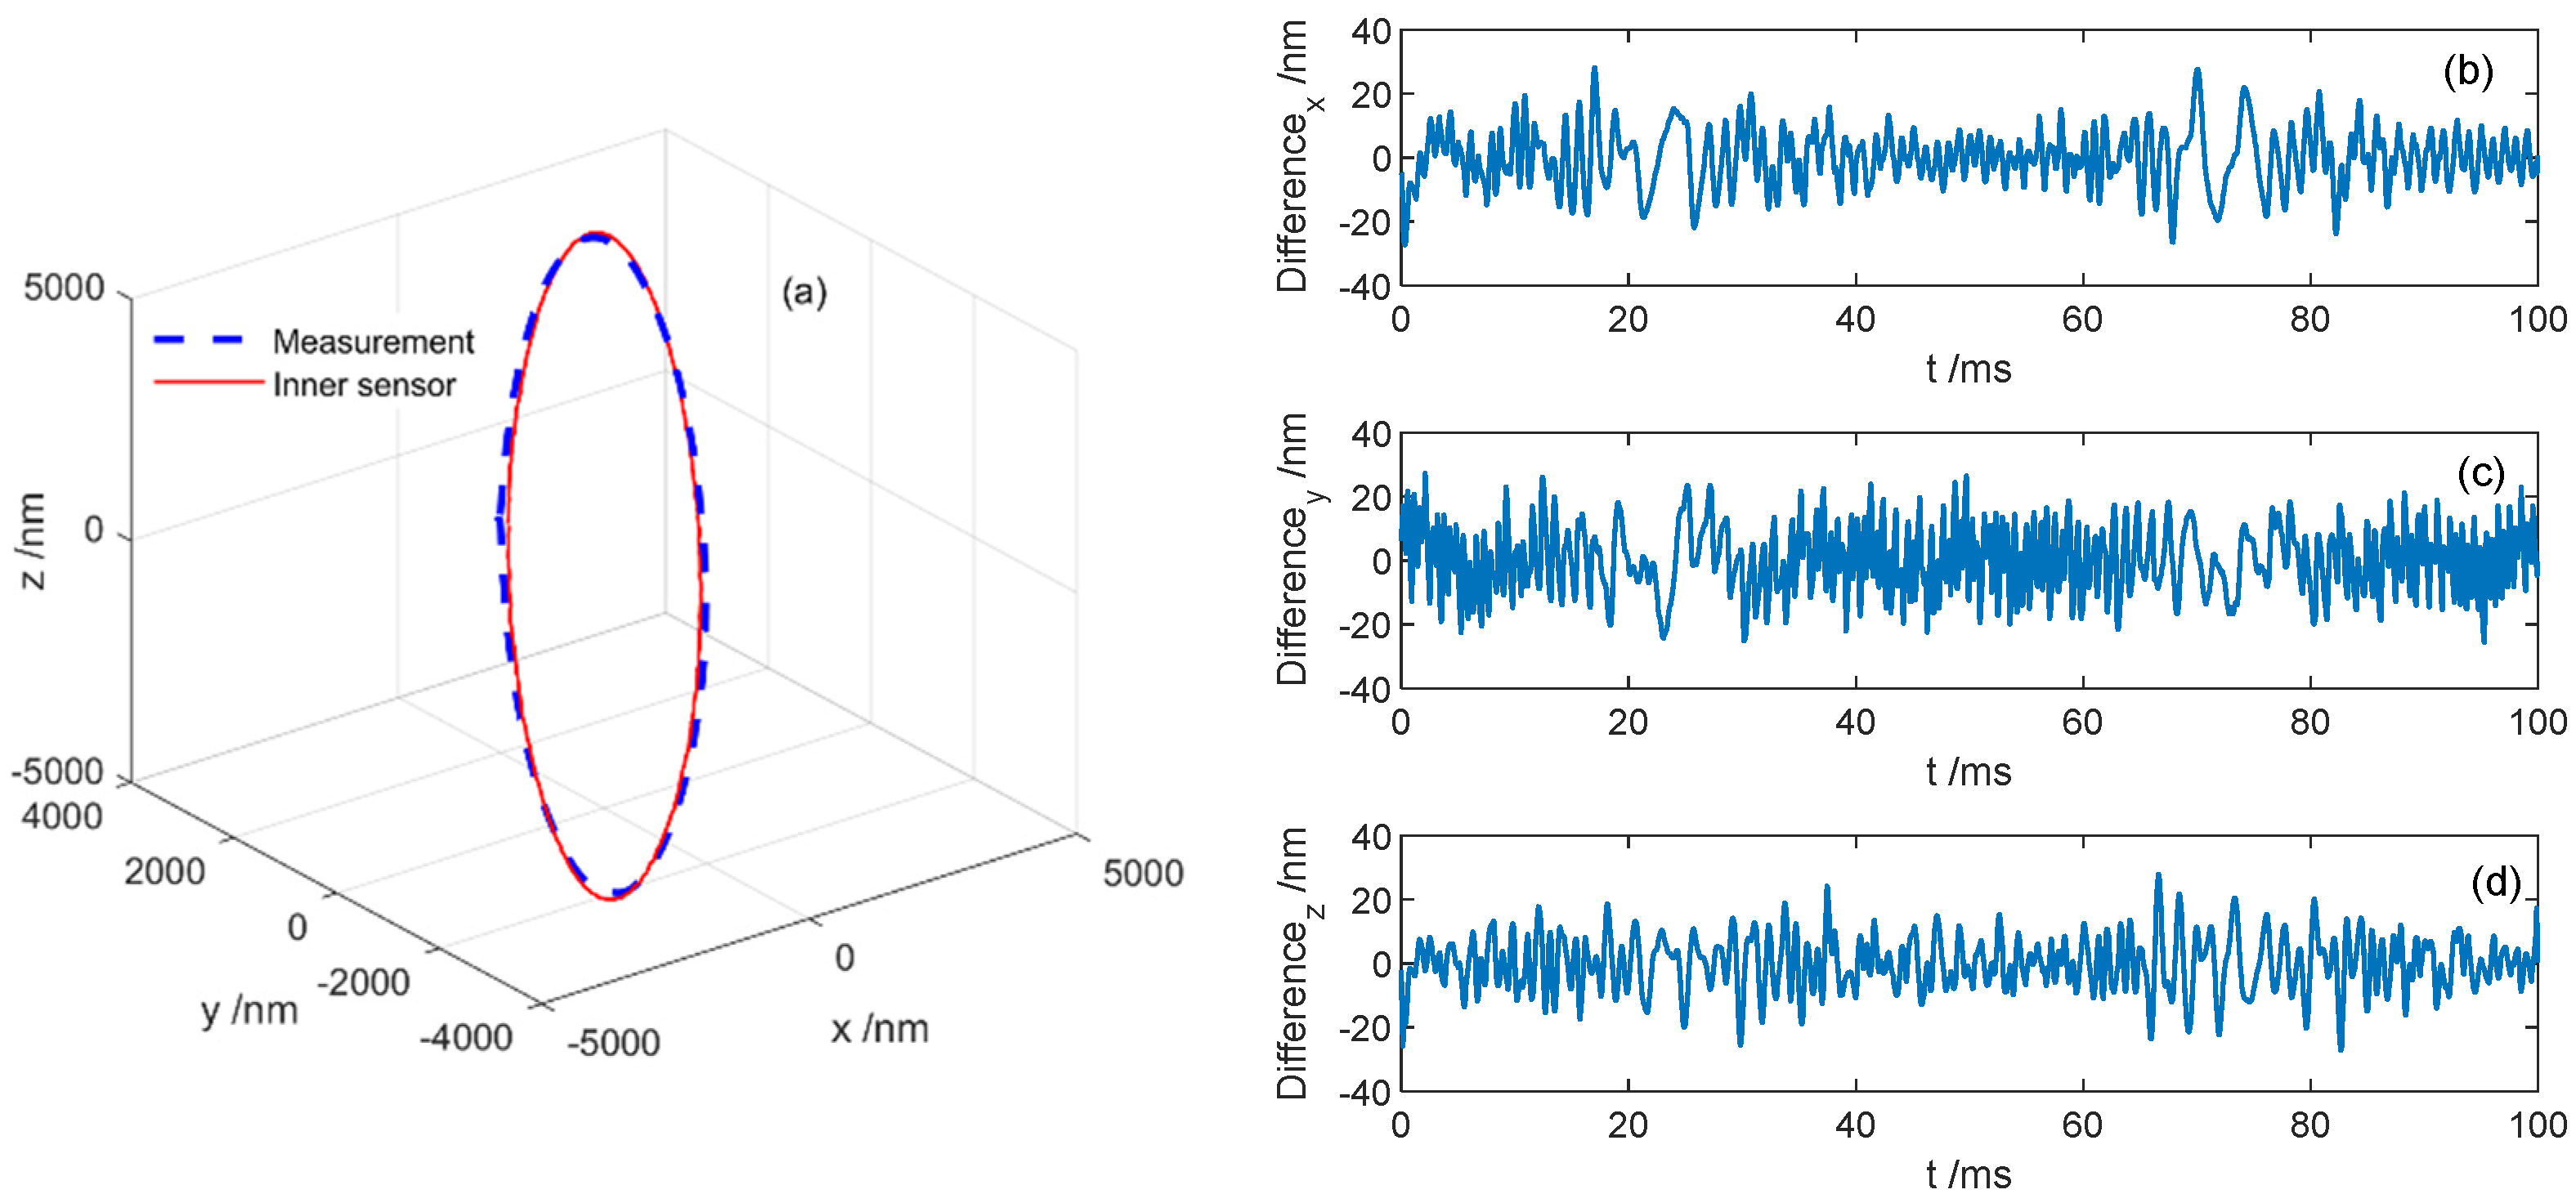
3. Experimental Results

To verify the feasibility of the proposed measurement method based on the FDM technique, several experiments were performed. Figure 3 shows the experimental setup. During the measurements, the two-dimensional crossed grating (dx = dy = 1 μm) was fixed on a three-dimensional piezo stage (PI, P-611.3S) which can reach a closed-loop resolution of 1 nm. High-resolution, fast-responding strain gauge sensors (SGS) were applied to appropriate locations on the drive train to provide a high-bandwidth, nanometer-precision position feedback signal to the controller of the stage. The laser (Hitachi, HL6320G, Tokyo, Japan) operated with a single longitudinal at 635 nm with 70 mA of injection current. A temperature controller was used to maintain its temperature at 15 °C. In our system, the size of the laser beam impinged on the grating was much larger than the grating pitch. It had little influence on the measurement results due to the averaging effect. Three electro-optic modulators (New Focus, 4002) were introduced to modulate the phases of measurement beams.
Figure 4 shows the measurement result when the two-dimensional grating was driven to produce a sinusoidal displacement with a frequency of 10 Hz and an amplitude of 4 μm (peak to peak) in three directions. The phase differences of motions in three directions are φxφz = 45°, φzφy = 45°. In order to introduce different carry frequencies, the modulation frequencies of EOM1, EOM2 and EOM3 were set to f1 = 7 kHz, f2 = 16.5 kHz and f3 = 23 kHz, respectively, and the modulation indexes were all set to 1.23 rad.
Figure 5, Figure 6 and Figure 7 provide other three-dimensional displacement measurement results with various amplitude and phase differences in three directions. To evaluate the reliability of the proposed method, the difference between the measured results and the output from the inner sensor of the stage are also plotted in the figures. In Figure 5, the standard deviations between the measured displacement and from the inner sensor of the stage are 7 nm in the X direction, 6 nm in the Y direction and 8 nm in the Z direction, respectively. In Figure 6, the standard deviations in the X, Y and Z directions are 8 nm, 6 nm and 6 nm, and in Figure 7, the standard deviations in the X, Y and Z directions are 11 nm, 13 nm and 6 nm.

4. Discussion

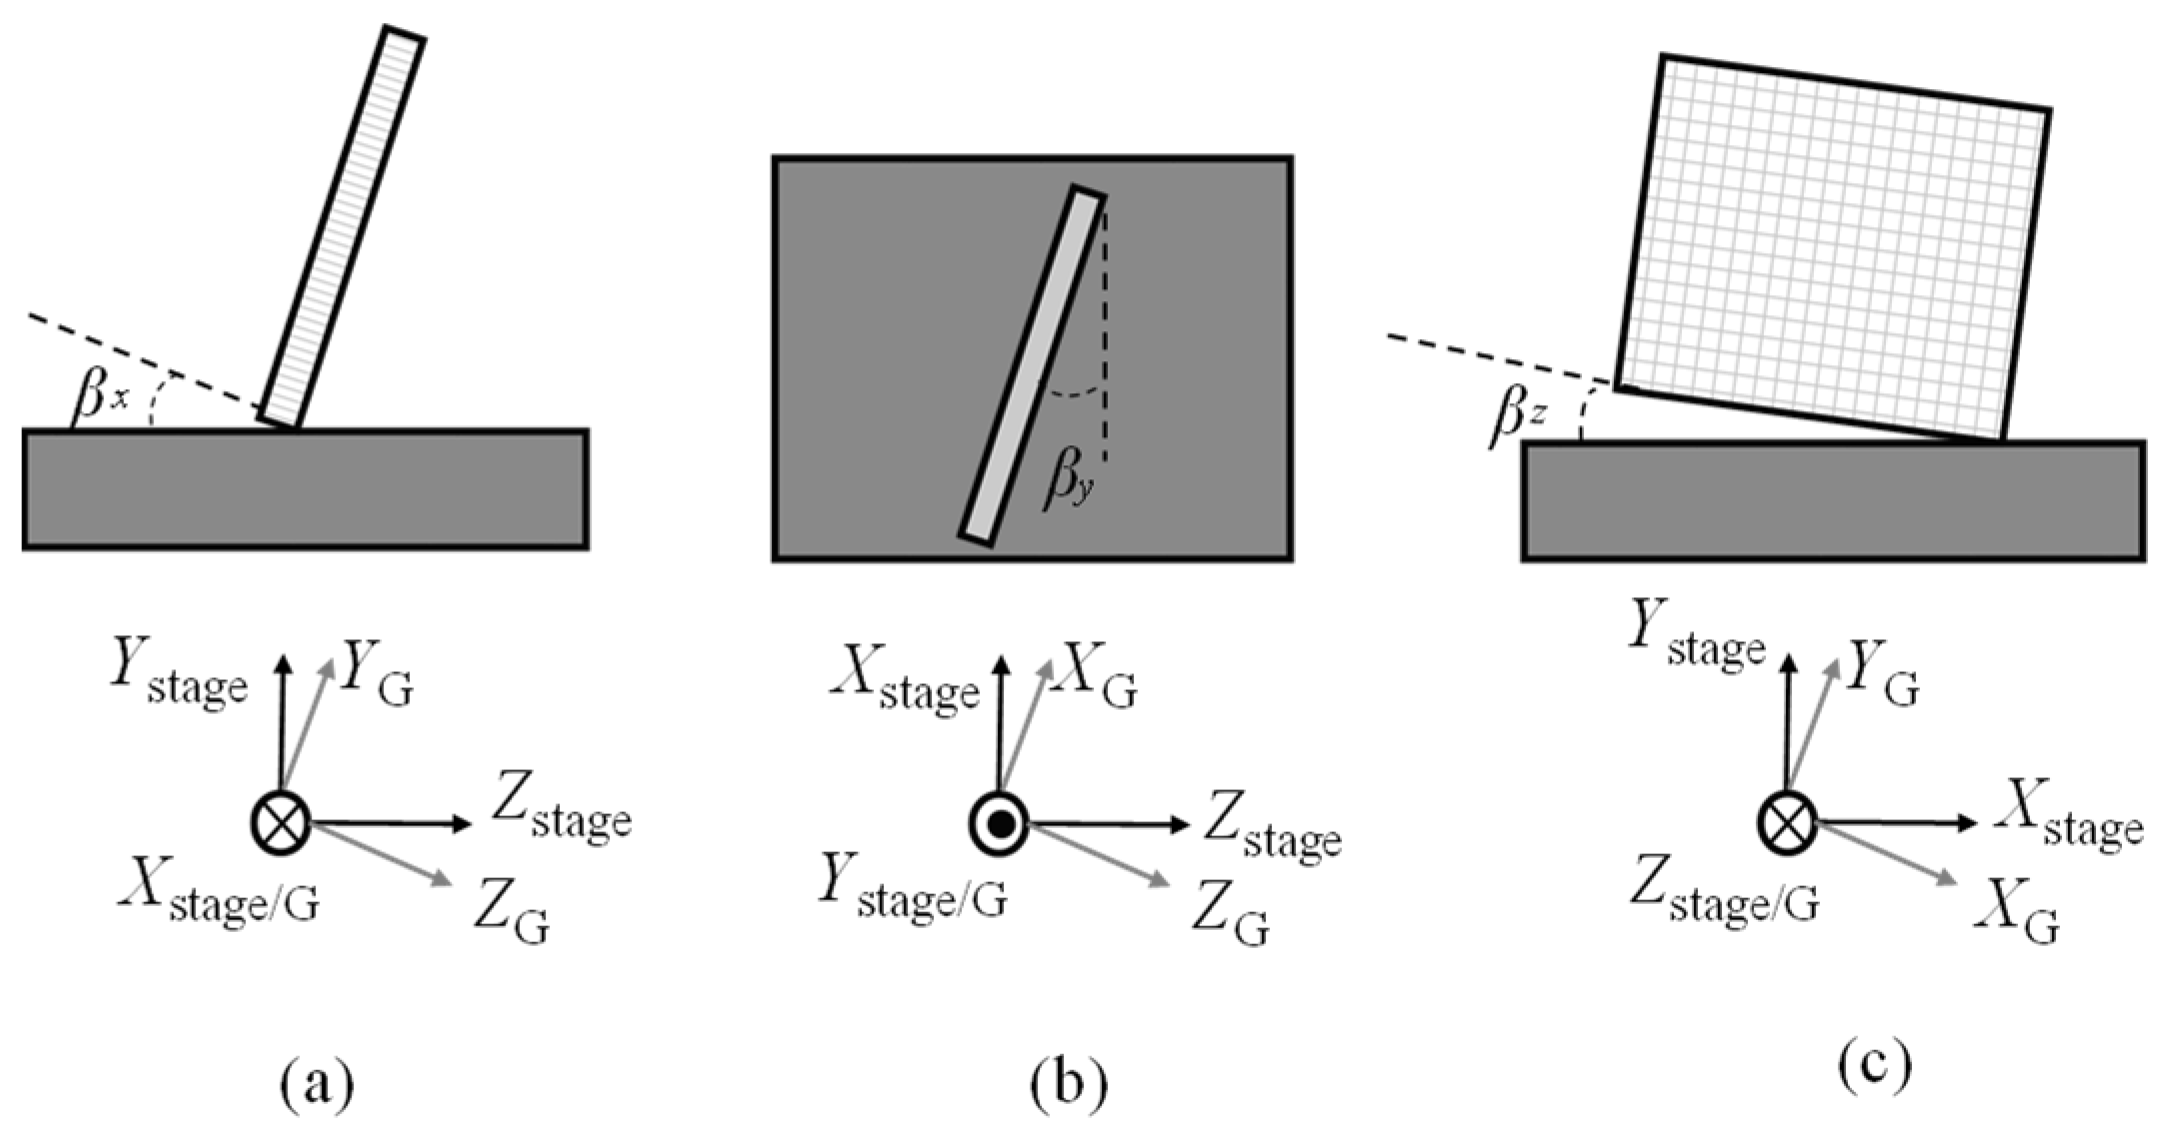
4.1. Misalignment Factors

The measurement results indicate that the proposed SMI system based on the FDM technique can effectively reconstruct three-dimensional displacement. However, misalignment of the assembly between the grating and the nano-positioning stage is unavoidable. In general, there exist three situations related to the yaw angles βx, βy and βz, as shown in Figure 8. An analysis of the influence of these yaw angles will assist in improving the measurement accuracy. As shown in Figure 8, Xstage, Ystage and Zstage represent the directions of the three moving axes of the stage. XG, YG and ZG represent the directions parallel and perpendicular to the grating plane. The different situations caused by these factors are discussed.
  • Case 1: yaw angle βx
When misalignment of the yaw angle (βx) occurs as shown in Figure 8a, it will influence the measurement results both in the Y direction and Z direction. The relationship between the grating displacement (xg, yg, zg) and the stage displacement (Xstage, Ystage, Zstage) can be obtained by
x g = x s t a g e y g = z s t a g e sin β x + y s t a g e cos β x z g = z s t a g e cos β x y s t a g e sin β x ,
  • Case 2: yaw angle βy
As shown in Figure 8b, when misalignment of the yaw angle βy occurs, there is no change in the Y axis displacement detection. However, the displacement on the X axis and Z axis may be influenced.
x g = x s t a g e cos β y + z s t a g e sin β y y g = y s t a g e z g = z s t a g e cos β y x s t a g e sin β y ,
  • Case 3: yaw angle βz
As shown in Figure 8c, when yaw angle βz occurs, the measurement results for the in-plane displacement on both the X and Y axes will be influenced, except for the out-of-plane displacement on the Z axis.
x g = x s t a g e cos β x y s t a g e sin β x y g = x s t a g e sin β x + y s t a g e cos β x z g = z s t a g e ,
From Equations (16)–(18), it can be seen that each misalignment factor between the grating and the positioning stage introduce similar linear error components in the measurement results. The overall measurement errors in three directions, which are generated by the accumulation of errors caused by each misalignment factor, can be evaluated as follows:
x g y g z g = A J U B K V C L W x s t a g e y s t a g e z s t a g e = F x s t a g e y s t a g e z s t a g e ,
To obtain the linear coefficients F in Equation (19), calibrations were conducted before the measurements. First, the positioning stage was controlled to move only in the X direction from −8 μm to 8 μm with a step of 1 μm. Due to the misalignment between the grating and the positioning stage, the three-dimensional displacement of the grating was extracted from the SMI signal, as shown in Figure 9. From the experimental results of Figure 9, the first column of matrix F can be obtained. In the same way, the second and the third columns of matrix F can be calculated from Figure 10 and Figure 11. Then, we can obtain the calibration coefficient F as
F = 0.9782 0.0140 0.0138 0.0149 0.9805 0.0145 0.0147 0.0143 0.9828 ,
After the measurements, misalignment error can be compensated by using the relationship shown in Equation (20).

4.2. Resolution Testing

The error of the grating pitch, the uncertainty of the extracted phase and the wavelength fluctuation may introduce measurement error and thus limit the measurement resolution of the system. In general, the grating pitch error is mainly caused by the non-uniformity of the grating and the extracted phase error is probably induced by the electrical noise, environment vibration and air turbulence. The resolution of the proposed multiple-dimensional displacement measurement setup can be obtained by checking the amount of standard deviation of the system noise [21]. To study the system noise, the nano-positioning stage was kept stationary when the measurement setup was applied to monitor the displacement of the grating. The sampling frequency was set to 200 kHz during the measurement. In Figure 12, the standard deviations of the system noise in three directions are about 6.4 nm, 6 nm and 5.9 nm, respectively.

4.3. Displacement and Velocity Measurement Range

The in-plane displacement measurement range of the system is primarily limited by the size of two-dimensional grating, while the out-of-plane displacement measurement range mainly depends on the size of the grating and the first-order Littrow angle. In addition, the maximum velocity of the grating movement that can be measured is primarily restricted by the modulation frequency of the EOMs and the sampling frequency. Considering that the EOMs we used can operate at a frequency up to 100 MHz, the maximum measurable velocity mainly depends on the signal processing unit. We believe that a high-speed digital signal processor can greatly improve the measurable velocity.

5. Conclusions

In this paper, we proposed a novel multi-dimensional displacement measurement technique based on SMI. By introducing a two-dimensional crossed grating into SMI, displacement measurement results are traceable to the grating pitch rather than the laser wavelength, which makes the system more immune to environmental disturbances. By in-cooperation with the FDM technique, multiple displacement can be simultaneously extracted from a single SMI signal. The proposed grating-based SMI is more compact and easier to operate compared to other multiple-displacement sensing systems based on traditional laser interferometry or grating interferometry. A series of experiments were performed to verify the performance of the proposed system. Moreover, measurement errors caused by misalignment were discussed and analyzed. The experimental results show that the proposed multi-dimensional displacement sensing system can reach a measurement resolution at the nanometer level. This will be further improved by carefully refining the system’s electronics and mechanics. It is further advantageous to use a structured film as a diffractive element. This film or foil can be attached to the movable member, a displacement-related parameter of which is to be determined. The application fields mainly focus on mechanical metrology for the calibration of tool machines to correct wear-out errors, and extensions were introduced to measure derived quantities such as planarity, angles and squareness. It is a promising measuring tool for use in a micro-CMMs (coordinate measurement machines) and two-dimensional platforms because of its high accuracy and long measurement range.

Author Contributions

Conceptualization, D.G., W.X. and M.W.; methodology, Z.X. and Q.Y.; software, Z.X. and Q.Y.; validation, D.G. and W.X.; writing—original draft preparation, Q.Y., D.G. and Z.X.; writing—review and editing, D.G., Z.X., W.X. and Y.Y.; visualization, D.G.; supervision, D.G., M.W. and W.X.; project administration, D.G. and W.X.; funding acquisition, D.G. All authors have read and agreed to the published version of the manuscript.

Funding

This work was sponsored by NSFC program no. 51875292.

Institutional Review Board Statement

Not applicable.

Informed Consent Statement

Not applicable.

Data Availability Statement

Not applicable.

Conflicts of Interest

The authors declare no conflict of interest.

References

  1. Restagno, F.; Crassous, J.; Charlaix, E.; Monchanin, M. A new capacitive sensor for displacement measurement in a surface-force apparatus. Meas. Sci. Technol. 2001, 12, 16–22. [Google Scholar] [CrossRef]
  2. Ramana, Y.V.; Sarma, L.P. Simple and sensitive strain gauge displacement transducer. Rev. Sci. Instrum. 1981, 52, 1417–1419. [Google Scholar] [CrossRef]
  3. Merino, S.; Retolaza, A.; Lizuain, I. Linear optical encoders manufactured by imprint lithography. Microelectron. Eng. 2006, 83, 897–901. [Google Scholar] [CrossRef]
  4. Ramaiah, J.; Gannavarpu, R. Dynamic displacement measurement in digital holographic interferometry using eigenspace analysis. Appl. Opt. 2021, 60, 10468–10476. [Google Scholar] [CrossRef] [PubMed]
  5. Kao, C.F.; Lu, S.-H.; Shen, H.-M.; Fan, K.-C. Diffractive Laser Encoder with a Grating in Littrow Configuration. Jpn. J. Appl. Phys. 2008, 47, 1833–1837. [Google Scholar] [CrossRef] [Green Version]
  6. Teimel, A. Technology and applications of grating interferometers in high-precision measurement. Precis. Eng. 1992, 14, 147–154. [Google Scholar] [CrossRef]
  7. Kimura, A.; Gao, W.; Kim, W.; Hosono, K.; Shimizu, Y.; Shi, L.; Zeng, L. A sub-nanometric three-axis surface encoder with short-period planar gratings for stage motion measurement. Precis. Eng. 2012, 36, 576–585. [Google Scholar] [CrossRef]
  8. Khan, J.I.; Zabit, U. On Two Fourier Transform-Based Methods for Estimation of Displacement and Parameters of Self-Mixing Interferometry Over Major Optical Feedback Regimes. IEEE Sens. J. 2021, 21, 10610–10617. [Google Scholar] [CrossRef]
  9. Naveed, M.; Zabit, U. Real-Time Adaptive Spectral Filter Based Parasitic Vibration Cancellation in Self-Mixing Laser Sensor Signals. IEEE Sens. J. 2021, 21, 24371–24378. [Google Scholar] [CrossRef]
  10. Fathi, M.T.; Donati, S. Thickness measurement of transparent plates by a self-mixing interferometer. Opt. Lett. 2010, 35, 1844–1846. [Google Scholar] [CrossRef] [PubMed] [Green Version]
  11. Contreras, V.; Toivonen, J.; Martinez, H. Enhanced self-mixing interferometry based on volume Bragg gratings and laser diodes emitting at 405-nm wavelengths. Opt. Lett. 2017, 42, 2221–2223. [Google Scholar] [CrossRef] [PubMed]
  12. Taimre, T.; Nikolić, M.; Bertling, K.; Lim, Y.L.; Bosch, T.; Rakić, A.D. Laser feedback interferometry: A tutorial on the self-mixing effect for coherent sensing. Adv. Opt. Photonics 2015, 7, 570–631. [Google Scholar] [CrossRef]
  13. Giuliani, G.; Norgia, M.; Donati, S.; Bosch, T. Laser diode self-mixing technique for sensing applications. J. Opt. A Pure Appl. Opt. 2002, 4, S283–S294. [Google Scholar] [CrossRef] [Green Version]
  14. Kliese, R.; Rakic, A.D. Spectral broadening caused by dynamic speckle in self-mixing velocimetry sensors. Opt. Express 2012, 20, 18757–18771. [Google Scholar] [CrossRef] [PubMed] [Green Version]
  15. Randone, E.M.; Donati, S. Self-mixing interferometer: Analysis of the output signals. Opt. Express 2006, 14, 9188–9196. [Google Scholar] [CrossRef] [PubMed]
  16. Guo, D.; Shi, L.; Yu, Y.; Xia, W.; Wang, M. Micro-displacement reconstruction using a laser self-mixing grating interferometer with multiple-diffraction. Opt. Express 2017, 25, 31394–31406. [Google Scholar] [CrossRef] [PubMed]
  17. Guo, D.; Yu, Y.; Kong, L.; Xia, W.; Wang, M. Self-Mixing Grating Interferometer with Dual Laser Diodes for Sensing of 2-D Dynamic Displacement. IEEE J. Quantum Electron. 2018, 54, 1–6. [Google Scholar] [CrossRef]
  18. Jiang, C.; Geng, Y.; Liu, Y.; Liu, Y.; Chen, P.; Yin, S. Rotation velocity measurement based on self-mixing interference with a dual-external-cavity single-laser diode. Appl. Opt. 2019, 58, 604–608. [Google Scholar] [CrossRef] [PubMed]
  19. Loewen, G. Diffraction Grating Handbook, 7th ed.; Newport Corporation: New York, NY, USA, 2014. [Google Scholar]
  20. Minoni, U.; Sardini, E.; Gelmini, E.; Docchio, F.; Marioli, D. A high-frequency sinusoidal phase-modulation interferometer using an electro-optic modulator: Development and evaluation. Rev. Sci. Instrum. 1991, 62, 2579–2583. [Google Scholar] [CrossRef]
  21. Lee, J.Y.; Hsieh, H.L.; Lerondel, G.; Deturche, R.; Lu, M.P.; Chen, J.C. Heterodyne grating interferometer based on a quasi-common-optical-path configuration for a two-degrees-of-freedom straightness measurement. Appl. Opt. 2011, 50, 1272–1279. [Google Scholar] [CrossRef] [PubMed]
Figure 1. Schematic diagram of a grating-based SMI with Littrow configuration.
Photonics 10 00839 g001
Figure 2. Schematic diagram of a grating−based SMI for multiple-dimensional displacement sensing. EOM1−EOM3, electro−optic modulators; BS1−BS2, beam splitters; M1−M5, mirrors; PD, photodetector.
Photonics 10 00839 g002
Figure 3. Experimental setup.
Photonics 10 00839 g003
Figure 4. Experimental result of 3D displacement reconstruction: (a) the modulated SMI signal; (b) frequency spectrum of the modulated SMI signal; (c) 3D displacement reconstruction result.
Photonics 10 00839 g004
Figure 5. (a) The reconstructed 3D displacement of xp-p = zp-p = 8 μm, yp-p = 7 μm; φx = φz = φy, fx = fy = fz = 10 Hz. (b) Difference between the measured displacement and the output of inner sensor in X direction. (c) Difference between the measured displacement and the output of inner sensor in Y direction. (d) Difference between the measured displacement and the output of inner sensor in Z direction.
Photonics 10 00839 g005
Figure 6. (a) The reconstructed 3D displacement of xp-p = yp-p = zp-p = 6 μm; φx = φz, φxφy = 45°, fx = fy = fz = 10 Hz. (b) Difference between the measured displacement and the output of inner sensor in X direction. (c) Difference between the measured displacement and the output of inner sensor in Y direction. (d) Difference between the measured displacement and the output of inner sensor in Z direction.
Photonics 10 00839 g006
Figure 7. (a) The reconstructed 3D displacement of xp-p = zp-p = 8 μm, yp-p = 7 μm; φyφz = 300, φxφy = 300, fx = fy = fz = 10 Hz. (b) Difference between the measured displacement and the output of inner sensor in X direction. (c) Difference between the measured displacement and the output of inner sensor in Y direction. (d) Difference between the measured displacement and the output of inner sensor in Z direction.
Photonics 10 00839 g007
Figure 8. Misalignment caused by the yaw angles: (a) βx; (b) βy; (c) βz.
Photonics 10 00839 g008
Figure 9. (a) Measured xg when the stage moves only in X direction; (b) measured yg when the stage moves only in X direction; (c) measured zg when the stage moves only in X direction.
Photonics 10 00839 g009
Figure 10. (a) Measured xg when the stage moves only in Y direction; (b) measured yg when the stage moves only in Y direction; (c) measured zg when the stage moves only in Y direction.
Photonics 10 00839 g010
Figure 11. (a) Measured xg when the stage moves only in Z direction; (b) measured yg when the stage moves only in Z direction; (c) measured zg when the stage moves only in Z direction.
Photonics 10 00839 g011
Figure 12. Experimental results of resolution testing.
Photonics 10 00839 g012
Disclaimer/Publisher’s Note: The statements, opinions and data contained in all publications are solely those of the individual author(s) and contributor(s) and not of MDPI and/or the editor(s). MDPI and/or the editor(s) disclaim responsibility for any injury to people or property resulting from any ideas, methods, instructions or products referred to in the content.

