Article

Effect of Laser Cleaning Parameters on Surface Filth Removal of Porcelain Insulator

School of Electrical Engineering and New Energy, China Three Gorges University, Yichang 443002, China
*
Author to whom correspondence should be addressed.
Photonics 2023, 10(3), 269; https://doi.org/10.3390/photonics10030269
Submission received: 27 January 2023 / Revised: 28 February 2023 / Accepted: 28 February 2023 / Published: 3 March 2023
(This article belongs to the Special Issue Ultrafast Laser Irradiation in Surface Engineering and Tribology)

Abstract

:
To study the influence of the laser power, scanning speed, and cleaning water content on the laser cleaning effect and obtain the best cleaning parameters, this paper conducted a simulation analysis of the laser cleaning process and carried out a pulse laser cleaning of porcelain insulators experiment to verify. The results show that the cleaning rate gradually increases as the laser power increases from 20 W to 25 W. As the scanning speed increases from 1000 mm/s to 2500 mm/s, the laser overlapping rate gradually decreases, and the cleaning takes the lead in increasing and then decreasing. The appropriate cleaning water content is conducive to laser cleaning; when the water content is 0.115 g, the cleaning efficiency reaches the highest value of 98.20%. When the laser power is 25 W, and the scanning speed is 2000 mm/s, the cleaning efficiency can reach the highest value of 96.87%. This paper shows that the reasonable choice of cleaning parameters can effectively clean the insulator surface filth and obtain a better surface morphology.

1. Introduction

Outdoor insulators are exposed to the natural environment for a long time, and particles in the air are deposited on the insulator surface, forming a fouling layer. Insulators with a significant degree of dirt accumulation may experience fouling flashover when they encounter wet weather, such as fog and rain, where the insulation performance decreases [1,2]. Therefore, the regular cleaning of insulators is of great importance for the safe operation of power systems.
The existing insulator cleaning methods for transmission lines include manual cleaning, electrically charged water cleaning [3,4,5], dry ice cleaning [6,7,8], and chemical cleaning [9]. However, all of these methods have many shortcomings. Traditional manual cleaning is inefficient, imposes a heavy workload, and requires power outage operation. Electrically charged water cleaning involves the preparation of deionized water, and the rinsing process has a massive risk of adjacent flashover. Dry ice cleaning has a high cost of dry ice preparation, the equipment is large, and other problems in the substation promote various difficulties. Chemical cleaning using cleaning agents may corrode the equipment and pollute the environment. Therefore, the power system urgently needs a new insulator cleaning technology that is highly efficient, safe, reliable, economical, and environmentally friendly.
Laser cleaning technology is a new technology that has developed rapidly in recent years. Compared with traditional cleaning methods, laser cleaning has the advantages of being noncontact, safe, efficient, and environmentally friendly. The established literature [10] has introduced the typical applications and cleaning process parameters of pulsed laser technology used in heritage protection, industrial metal surface treatment, and the semiconductor industry, and pointed out the future development trend of laser cleaning. Previous studies have also described the effects of average power, scanning speed, and pulse frequency on the surface morphology and microstructure of cleaned specimens [11,12]. Some studies [13,14] have used a laser to paint the outer layer of aircraft to investigate laser cleaning, optimize the cleaning parameters, and help further develop the law of laser cleaning. Li et al. [15] determined that ideal process parameters are more helpful for laser cleaning and material surface protection by studying the relationship between the paint removal mechanism and incident laser energy density. Other studies [16,17,18] have effectively verified the safety and efficiency of laser cleaning by evaluating material surface quality, corrosion resistance, and conducting comprehensive mechanical properties tests. In the transmission line cleaning insulator application, Ma et al. [19] established a finite element simulation model of laser cleaning insulator fouling and analyzed the temperature field distribution characteristics of laser cleaning. Tian et al. [20] discussed the factors affecting the effectiveness of laser cleaning of insulator fouling and analyzed the effect of the power density of the pulsed laser, the radius of the laser spot, and the scanning speed of the laser on the surface temperature.
In summary, the laser cleaning parameters have an important impact on the cleaning effect and surface quality. Although many scholars have conducted a lot of research on the theory and simulation of laser cleaning insulator surface fouling, little research has been reported on the optimization of the cleaning parameters and the surface quality of the cleaned material for the cleaning of porcelain insulator surface fouling by pulsed fiber laser. This paper adopts a porcelain insulator as the test object and conducts laser cleaning simulation and test to study the effect of laser power, scanning speed, and cleaning water content on the cleaning effect and the surface quality after laser cleaning. Finally, the cleaning rate is analyzed by dichotomous images to determine the optimal laser cleaning parameters.

2. Simulation Analysis

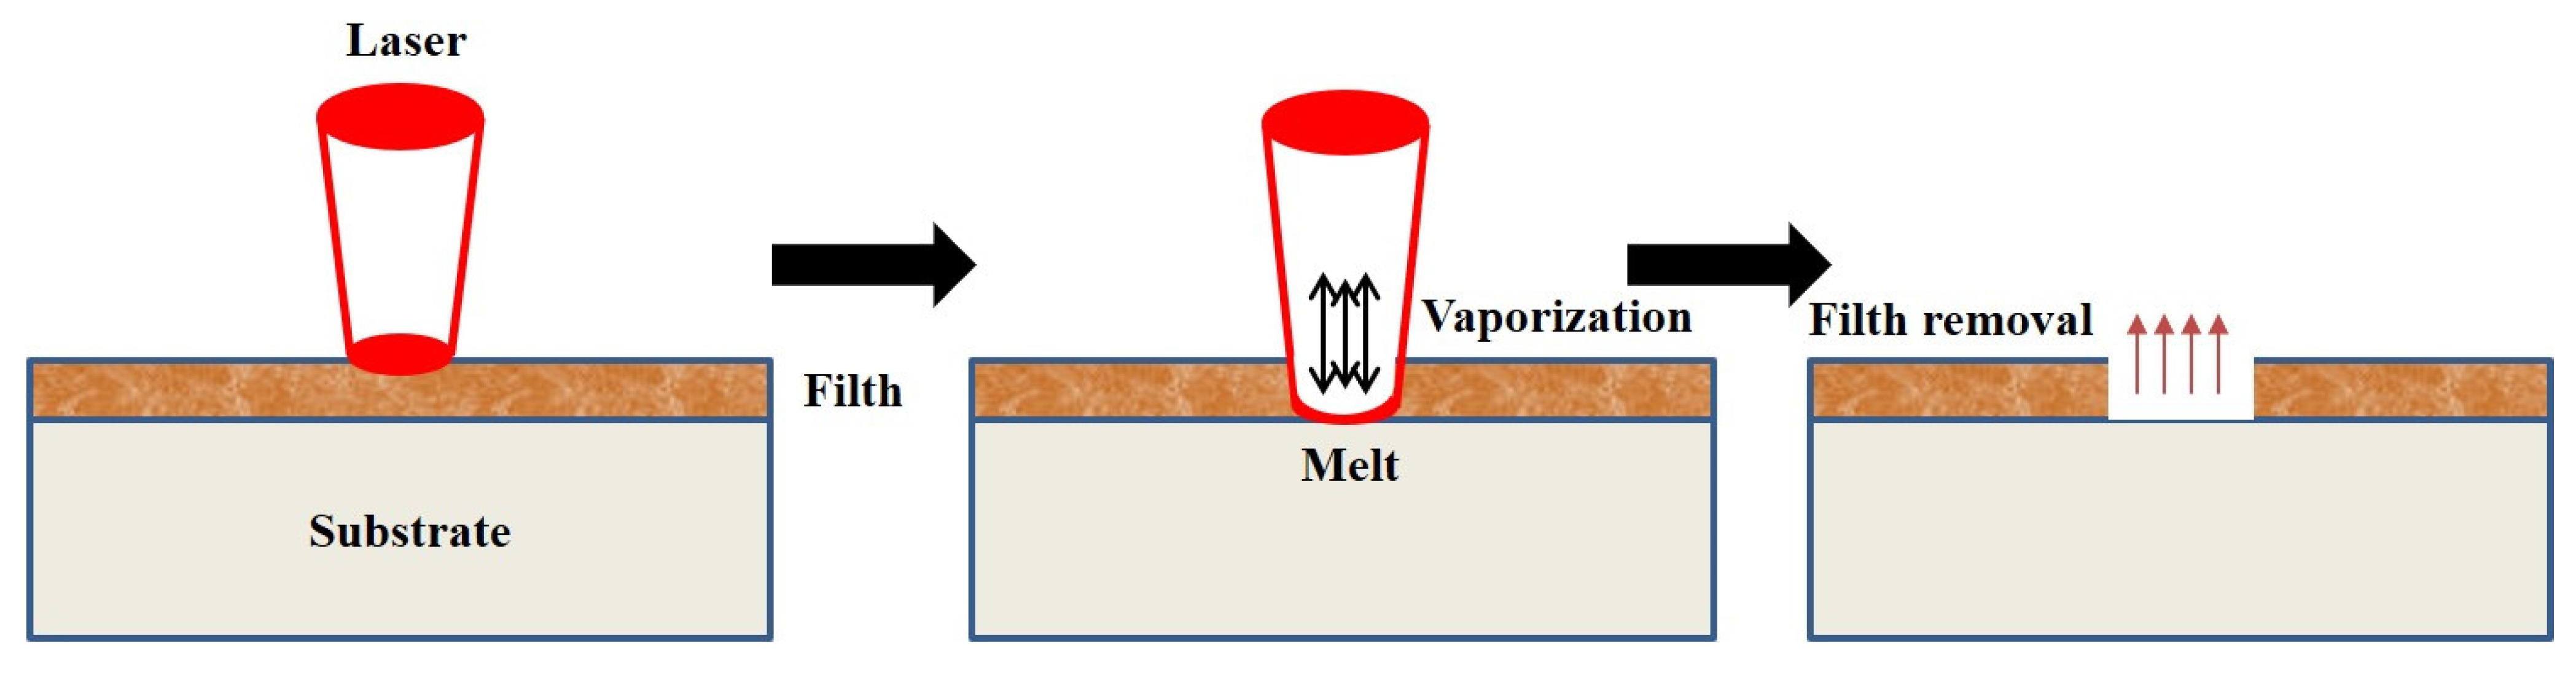
2.1. Theoretical Study
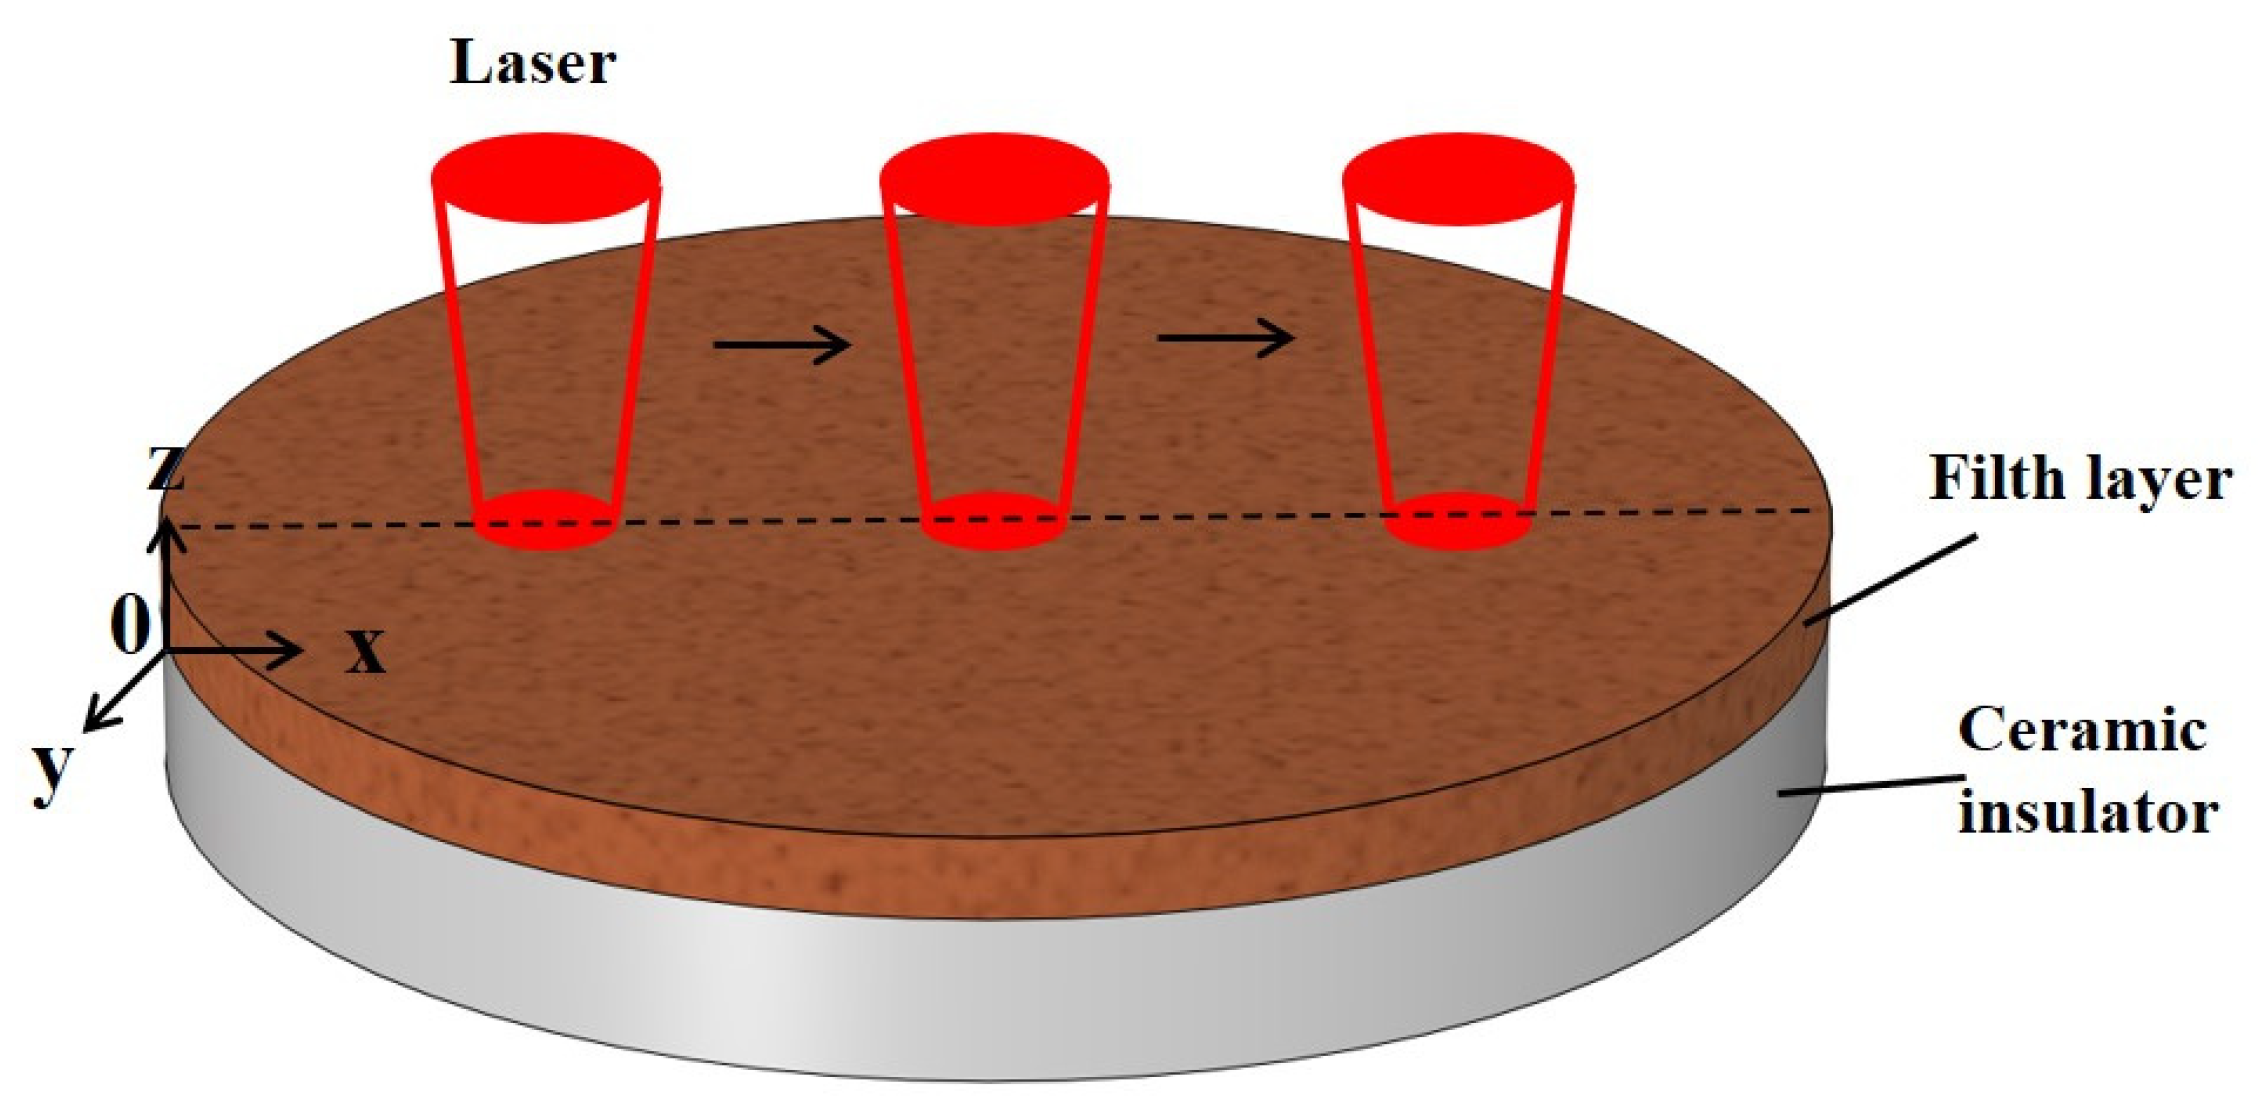
When fouling absorbs enough laser energy, the resulting temperature rise will cause it to melt and vaporize. Usually, choosing the appropriate laser energy density and irradiation time can effectively remove insulator surface fouling, as shown in Figure 1.
The heat conduction equation can describe the temperature field distribution under laser irradiation. In the Cartesian coordinate system, the heat conduction equation is shown in the following [21]:
{ ρ c T t = k ( 2 T x 2 + 2 T y 2 + 2 T z 2 ) k T t = ε I ( z = 0 )
where ρ, c, and k are the material’s density, specific heat, and thermal conductivity, respectively. T is a function of the heat source within the material, and ε is the laser absorption rate.
Since the surface of the fouling layer absorbs most of the laser energy during laser irradiation and transfers the power to the insulator base by heat conduction, the laser heat source can be treated as a surface heat source, as shown by the following equation:
Q ( x , y , t ) = ε P π R 2 e [ ( x v t ) 2 + y 2 ] R 2
where Q is the laser power density, t is the laser action time, P is the laser output power, R is the spot radius and v is the laser scanning speed.
When the laser acts on the material, the rapid temperature rise of the material surface creates thermal stress. When the thermal stress exceeds the dirt adhesion force, it will cause the dirt material to peel off the insulator surface. The porcelain insulator is heated to cause an uneven temperature field, thus generating stress and material deformation [22]. The physical stress field distribution is given by:
{ σ x = E 1 μ ( ξ x + μ ξ y ) E α Δ t 1 μ σ y = E 1 μ ( ξ y + μ ξ x ) E α Δ t 1 μ τ x y = E 2 ( 1 + μ ) γ x y
where ξx and ξy are the positive strains in their respective directions, α is the linear expansion coefficient, γxy is the shear strain, μ is Poisson’s ratio, and E is Young’s modulus.

2.2. Model Building

According to international standards, the insulator can withstand the maximum local temperature range of 150–250 °C. This study takes the fouled porcelain insulator piece as the research object [23]. As shown in Figure 2, a porcelain insulator model is established with a radius of 0.5 mm and a thickness of 0.1 mm, and the fouled layer on the model surface is 0.05 mm thick at the bottom. The pulsed laser parameters are as follows. The maximum laser power is 100 W, the wavelength is 1064 nm, the spot radius is 0.1 mm, the laser repetition frequency is 25,000 Hz, the pulse duration is 200 ns, and the laser works along the insulator sheet x-axis direction scanning back and forth.
To determine the thermal characteristics of the laser cleaning action, this study mainly uses COMSOL 5.6 software for three-dimensional model multiphysics field coupling simulation and analysis. The laser simulation employs a Gaussian surface heat source, and the initial temperature is set as 20 °C. The required material physical values are shown in Table 1 [19].

3. Factors Influencing Laser Cleaning
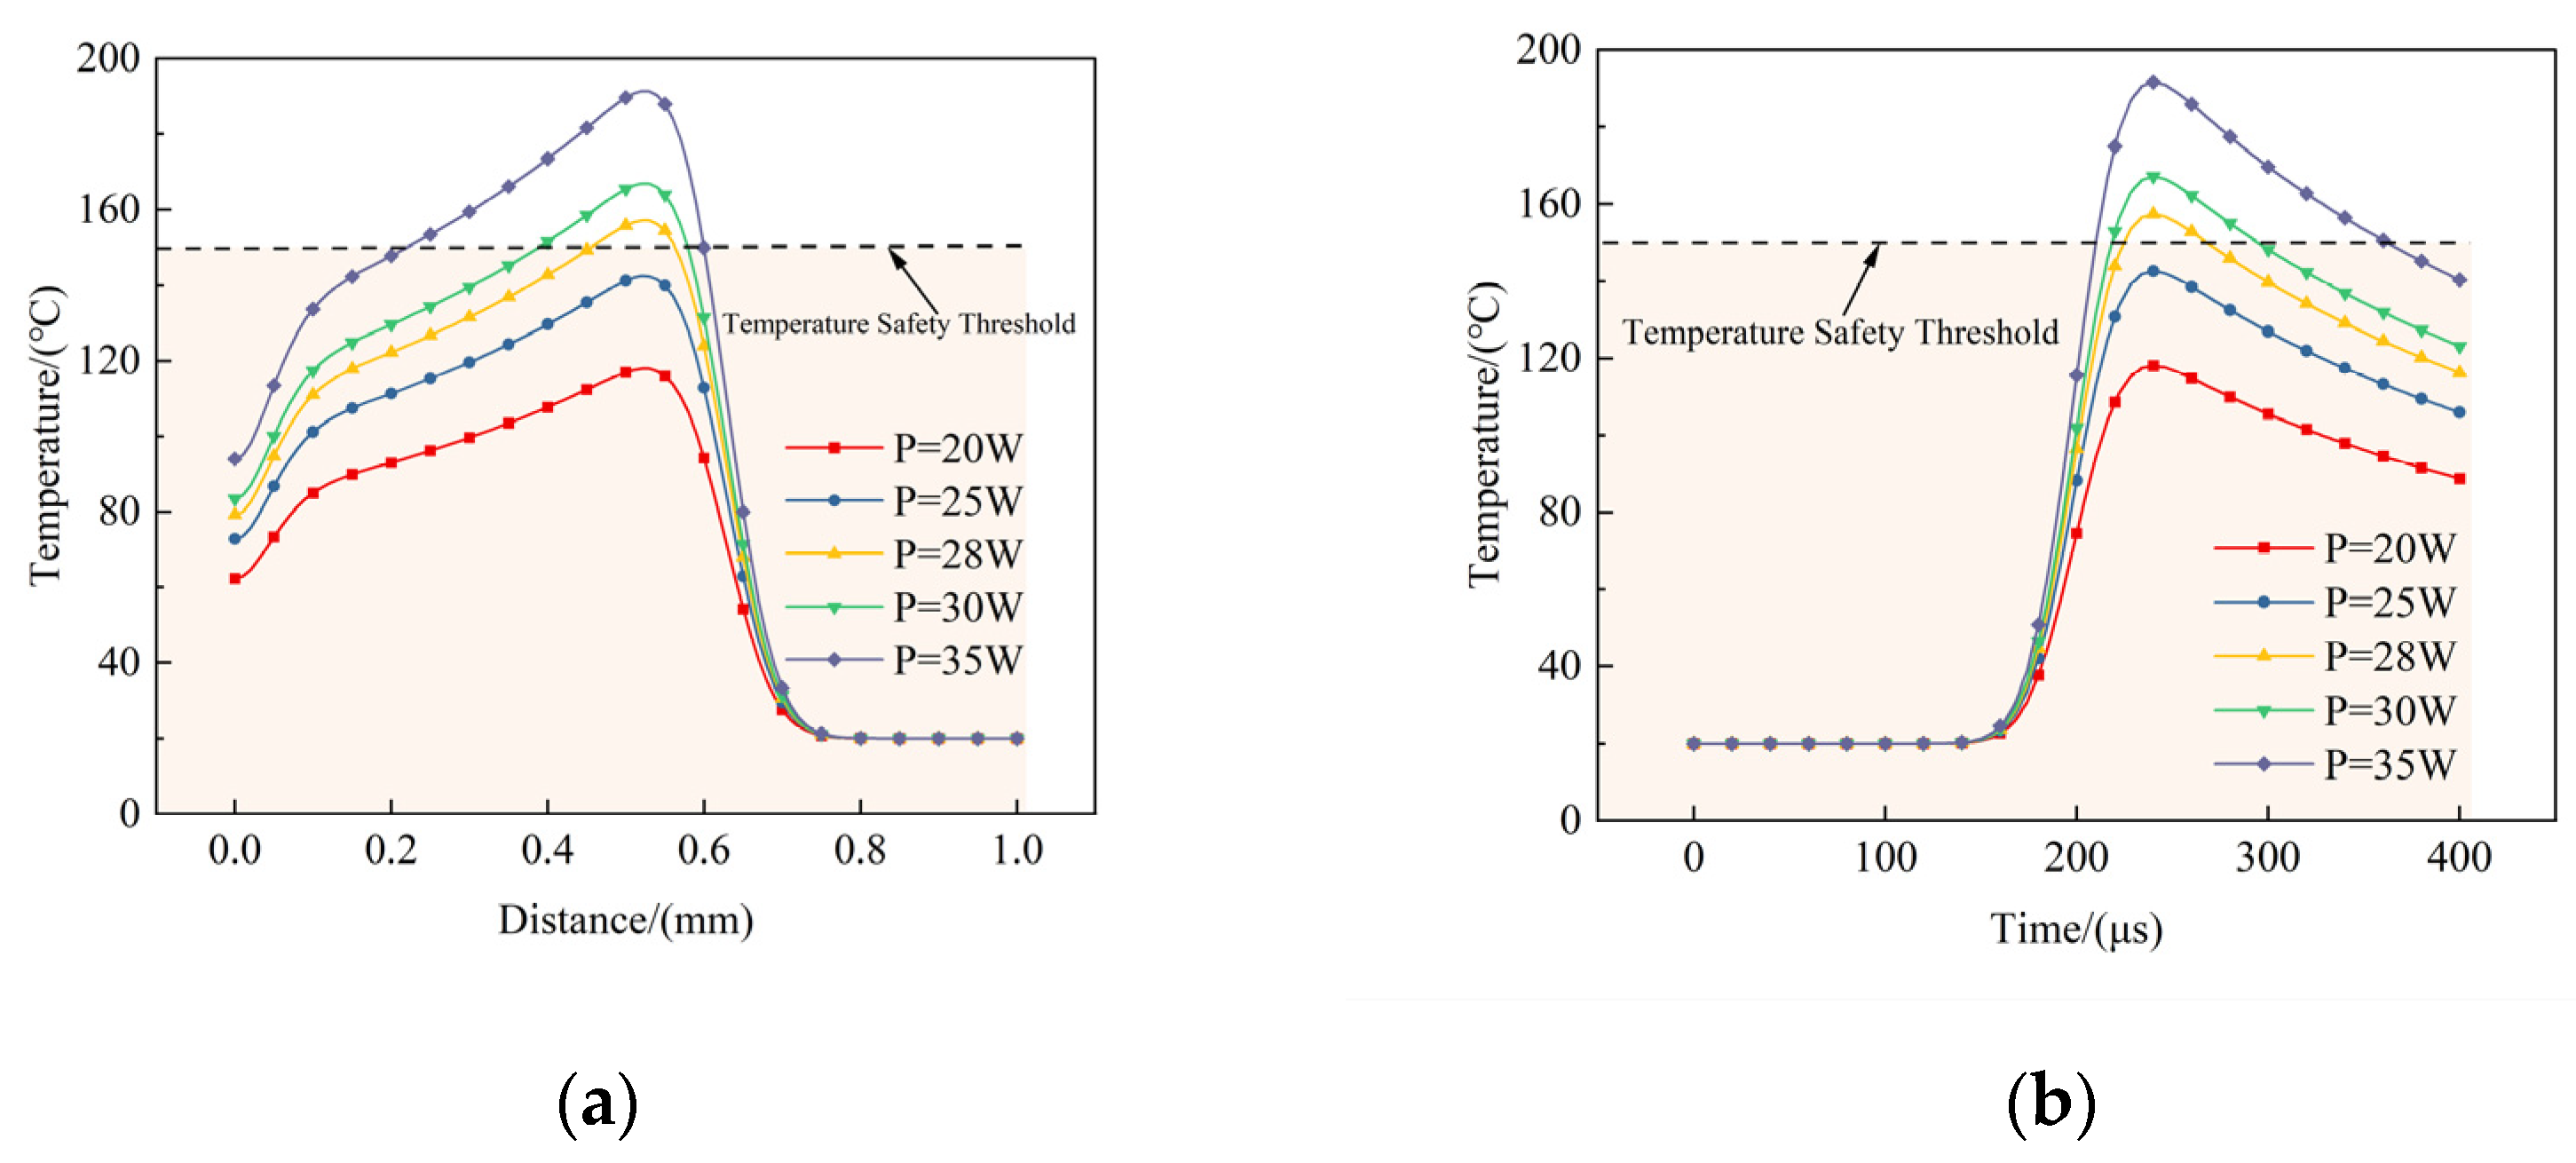
3.1. Laser Power

The laser scanning speed is 2500 mm/s, and the laser power is 20 W, 25 W, 28 W, 30 W, and 35 W. Figure 3a shows the distribution of the radial X-axis temperature variation on the surface of the porcelain insulator with different laser powers at t = 250 μs. The maximum insulator surface temperatures were 117.98 °C, 142.47 °C, 157.17 °C, 166.97 °C, and 191.46 °C for the five different power cases. As the porcelain insulator dissipates heat, the temperature of the scanned area will gradually drop after reaching the peak. At this time, the temperature of the x = 0 position and the center point temperature have a significant temperature difference. At the same time, when the laser power is 20 W and 25 W, the maximum temperature does not exceed the safety range of the porcelain insulator temperature. In contrast, when the laser power reaches 35 W, the maximum temperature exceeds the safety range and will cause damage to the porcelain insulator. To ensure the safe operation of laser cleaning, the power is set at approximately 25 W.
The temperature variation at the insulator surface center point x = 0.5 mm for different powers is shown in Figure 3b. When the scanning time is 100–200 μs, the laser spot gradually approaches the center point position, the insulator surface absorbs energy, and the temperature gradually increases. As the distance decreases, the temperature at the center point rises faster until the center of the laser spot is at x = 0.5 mm, where the rising rate reaches its maximum. The temperature peaks at t = 240 μs, after which the temperature slowly decreases.

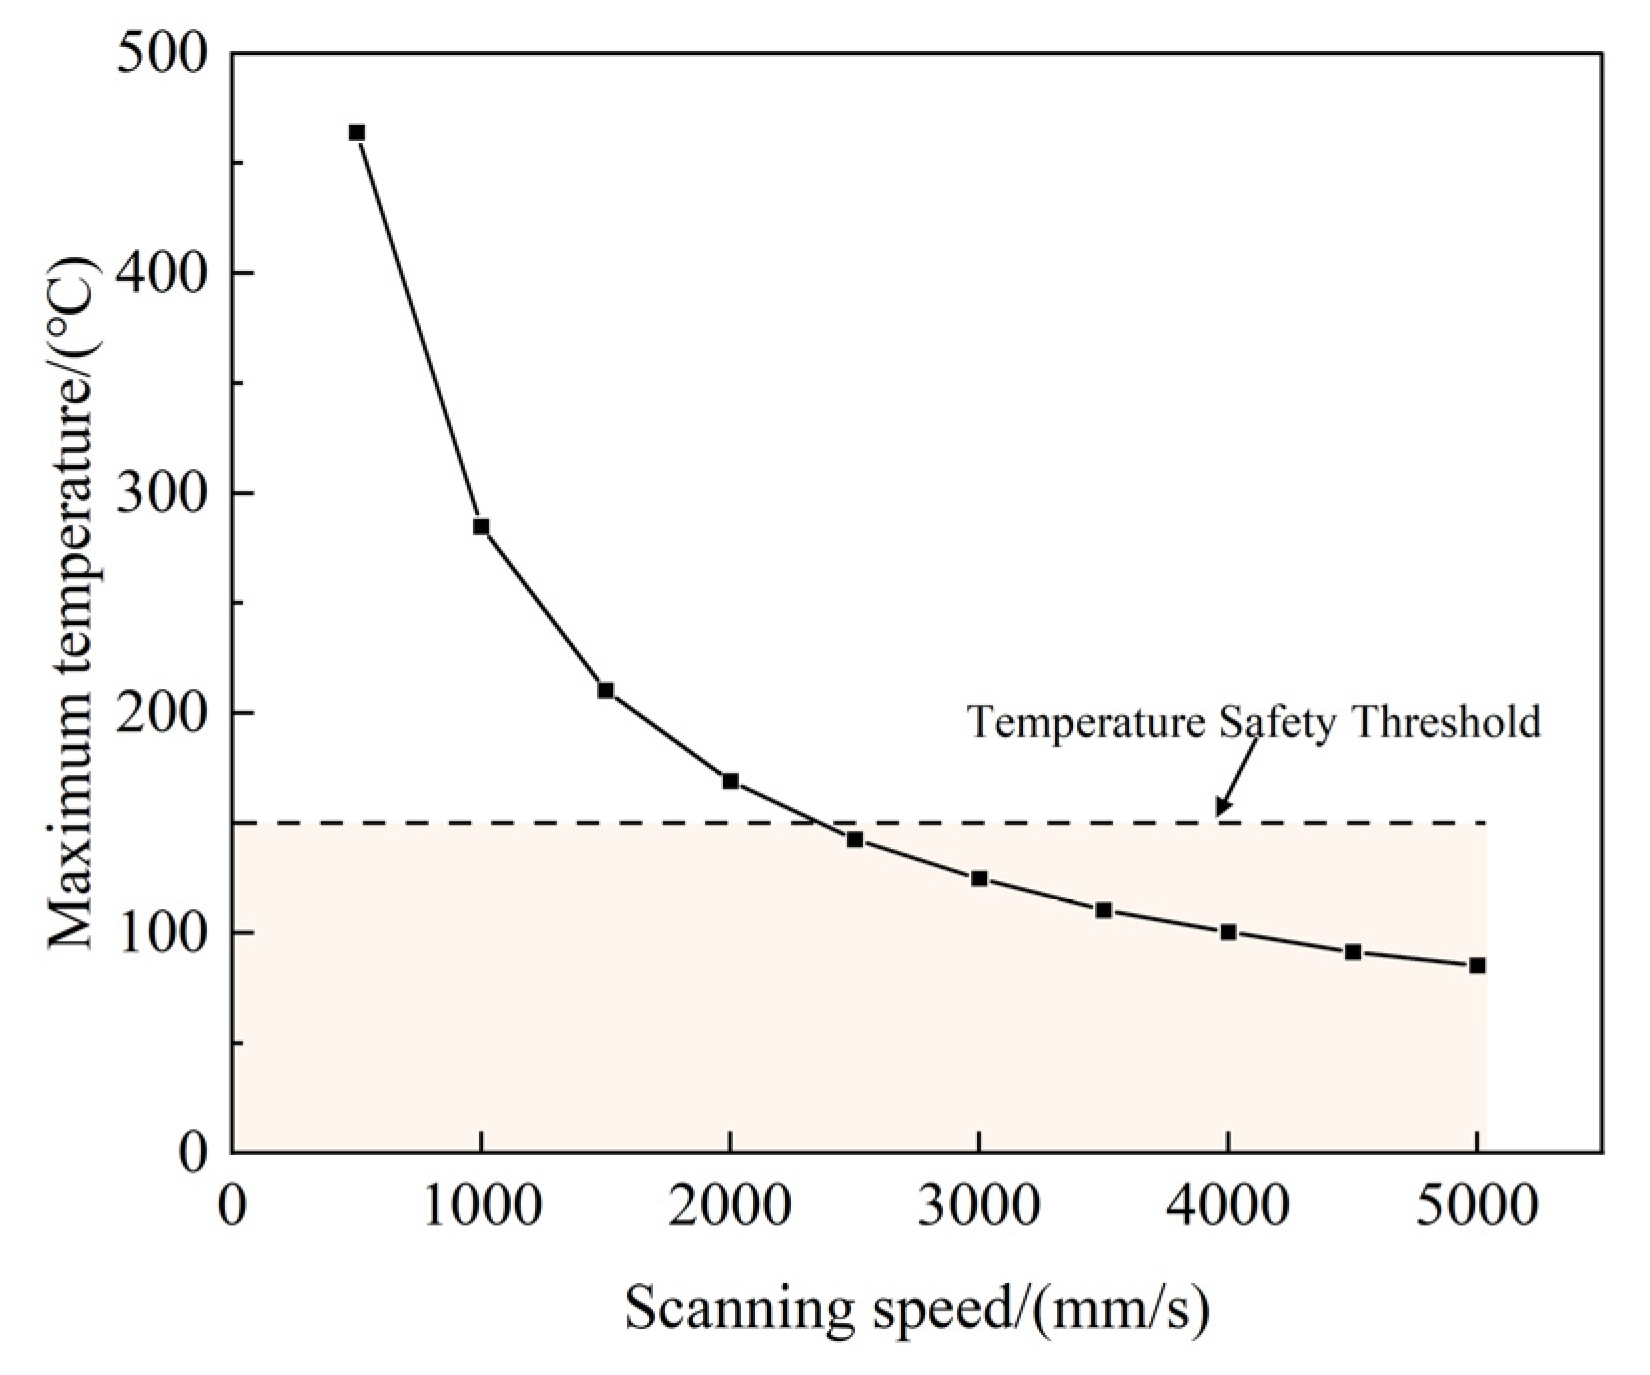
3.2. Laser Scanning Speed

As the laser energy limits the laser scanning process cleaning efficiency, one must choose the appropriate lap rate of cleaning parameters to ensure the proper energy density.
ζ = 1 - v 2 R f × 100 %
where ζ is the lapping rate, v is the laser scanning speed, R is the spot radius, and f is the pulsed laser frequency.
Figure 4 shows the relationship between different laser scanning speeds and the maximum temperature of the porcelain insulator surface when the laser power is 25 W and the pulsed laser frequency is 25,000 Hz. Figure 4 shows that the slower the scanning speed is, the faster the insulator surface temperature rises. When the scanning speed was 500 mm/s and ζ was 90%, the maximum temperature of the insulator surface reached 463.92 °C, which caused severe damage to the insulator. When the scanning speed is 5000 mm/s and ζ is 0, the highest insulator temperature is 85.34 °C, which is not much different from the initial ambient temperature, and it can be concluded that the lapping rate is minimal and the laser thermal action is less effective. Meanwhile, the laser scanning speed is above 2500 mm/s, which can prevent insulators from being damaged by the laser.

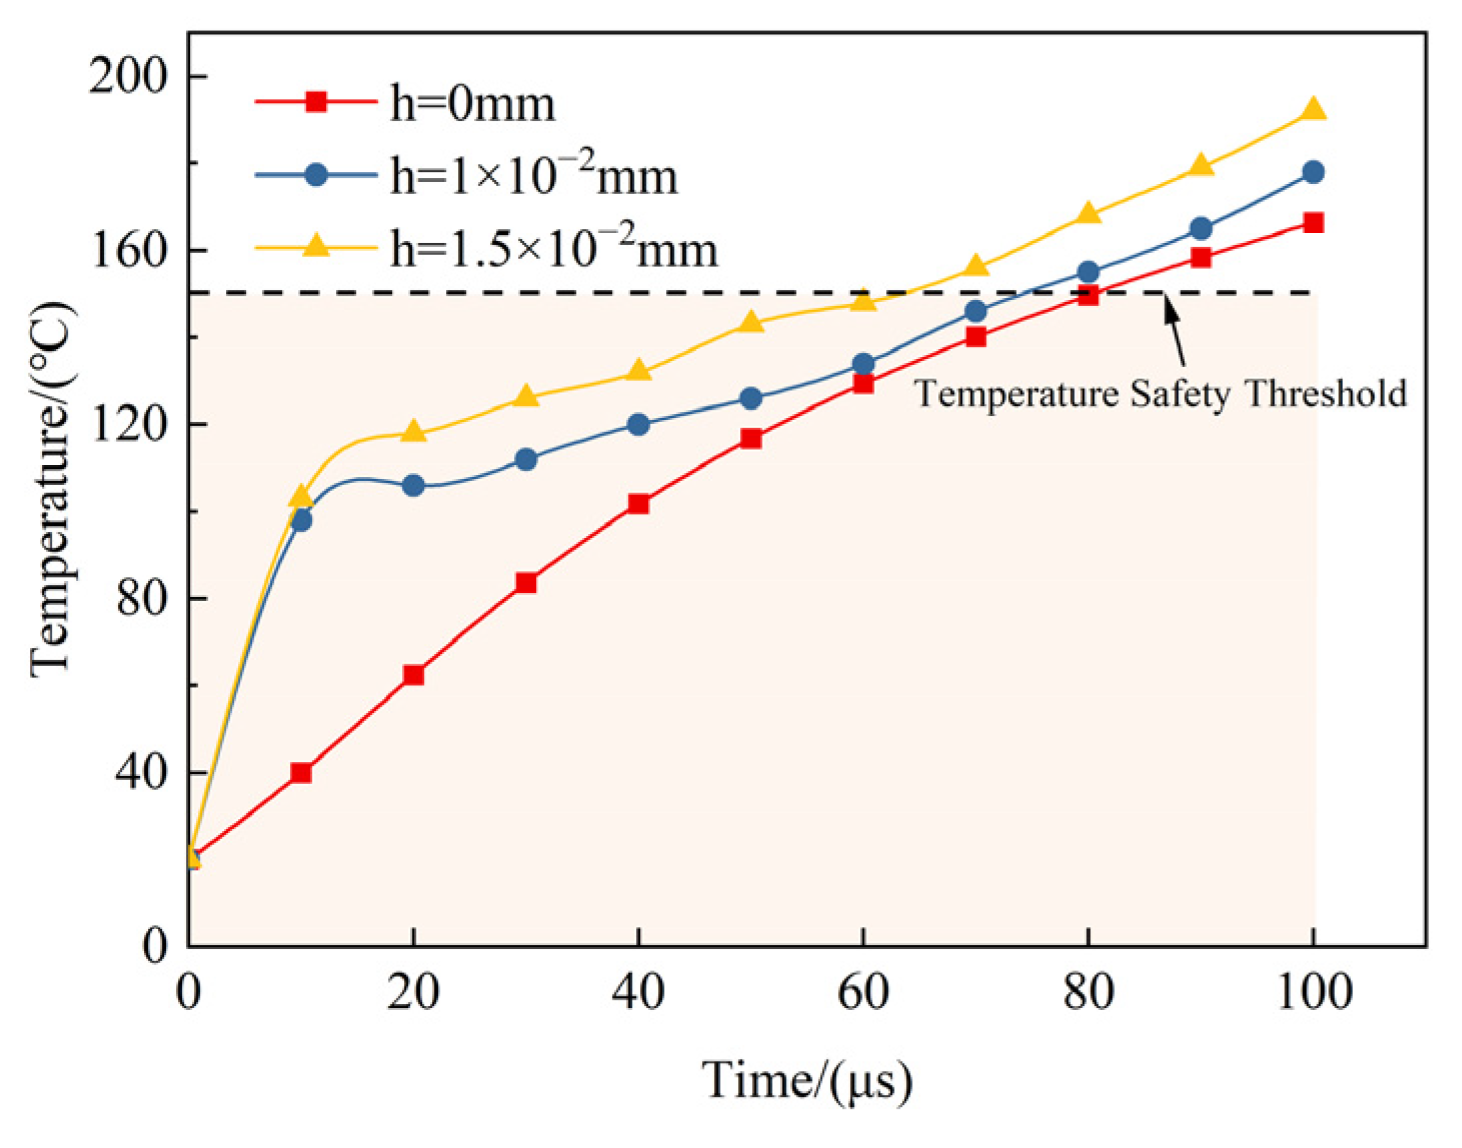
3.3. Cleaning Water Content

Moisture has good thermal conductivity, water film and dirt absorb a lot of energy in a short period, rapid temperature rise, and follow Fourier’s law through the water film dirt conduction to the surface of the insulator. In the simulation model, the fouling water content is simplified as a layer of water film column on the fouling surface. When the laser power is 25 W, the scanning speed is 2000 mm/s, the water film column height is 0 mm, 1 × 10⁻² mm, and 1.5 × 10⁻² mm, the laser wet cleaning temperature field is simulated and the effect of water content on the temperature field characteristics is analyzed.
Figure 5 shows the temperature distribution of the water film working condition at different heights. When the water content is within a certain range, the temperature increases with the increase in water content during the cleaning process. In the initial stage of cleaning, there is a substantial increase in temperature because the thermal conductivity of the material containing moisture will be greater than that of the dry material, and the higher the moisture content, the greater the thermal conductivity. After 10 μs, the temperature and time are linear and on the rise, and after 100 μs, scanning is completed; the highest temperature reaches 166.34 °C, 178 °C, and 192 °C, respectively, in the three working conditions. In the laser cleaning process, laser wet cleaning can quickly enhance the cleaning temperature, and in a certain range of water content, the more water content, the more obvious the temperature rise. As can be seen from Figure 5, laser wet cleaning produces a higher temperature rise and more efficient cleaning than dry cleaning (h = 0 mm). The right amount of moisture can promote laser wet cleaning, but too much may lead to too fast a temperature rise and damage to the insulator surface; the degree of dryness and wetness of the dirt in the laser cleaning process should not be neglected.

4. Laser Cleaning Experiment

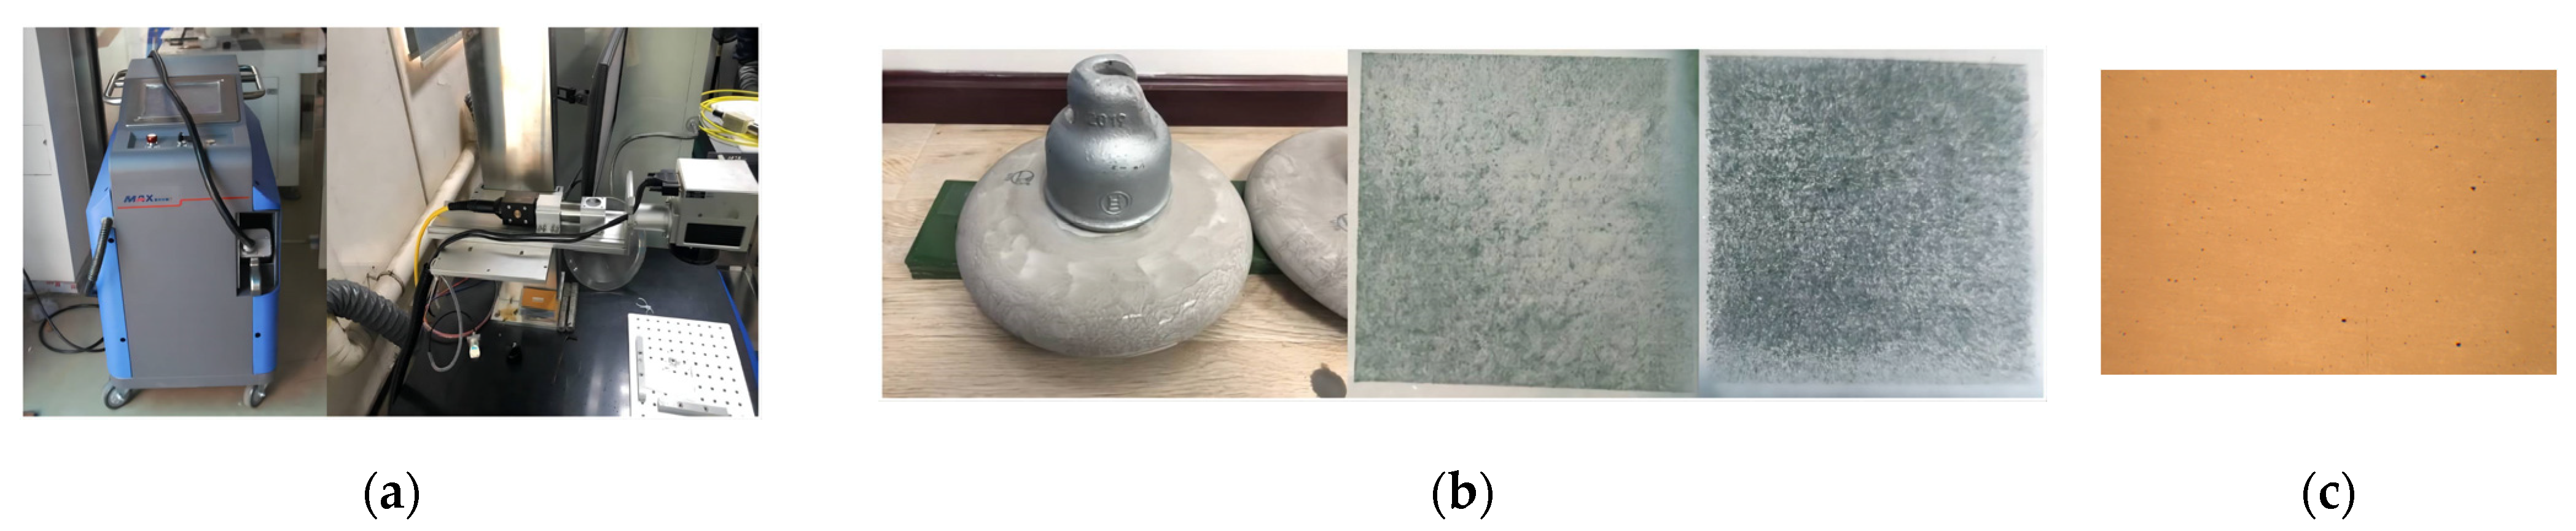
4.1. Experimental Equipment

The experimental equipment included a pulsed fiber laser with a wavelength of 1064 nm, a pulse width of 200 ns, and a repetition frequency of 25,000 Hz; computer control system; collimated beam expander; scanning oscillator; and vent. The structure of the laser cleaning device is shown in Figure 6a. The experimental material is porcelain insulator alumina ceramic tile (100 mm × 100 mm × 5 mm). The fouling layer is coated with 1 mg/cm2 of gray density. The experimental samples are shown in Figure 6b. The sample laser before irradiation under the microscope is shown in the Figure 6c. During the experiment, a Ti480Pro infrared camera was used to measure the temperature change process on the surface of the porcelain tiles and the metallographic microscope was used to observe the microscopic surface soiling of the porcelain tiles.

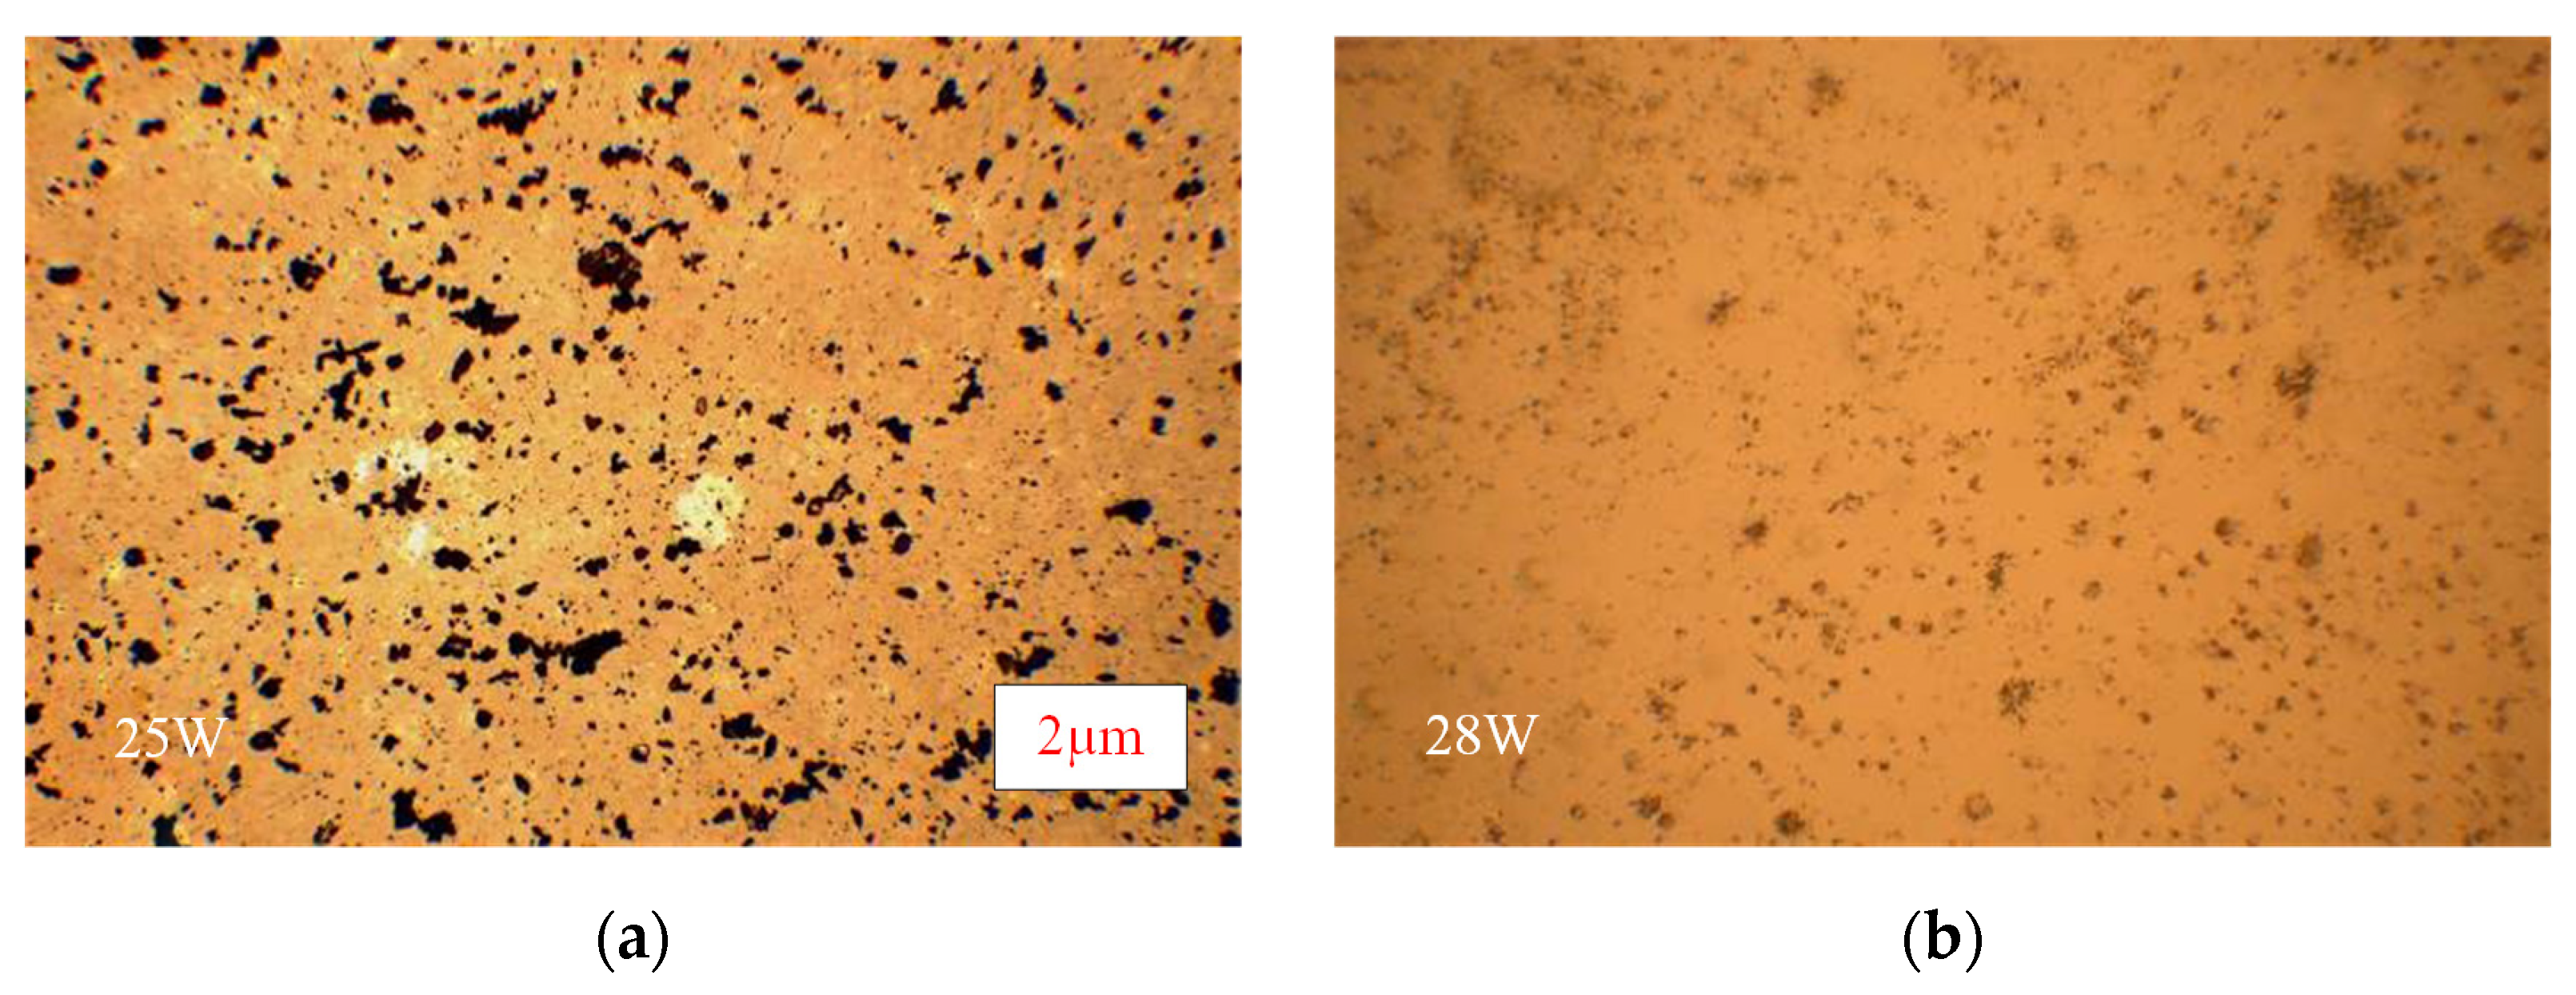
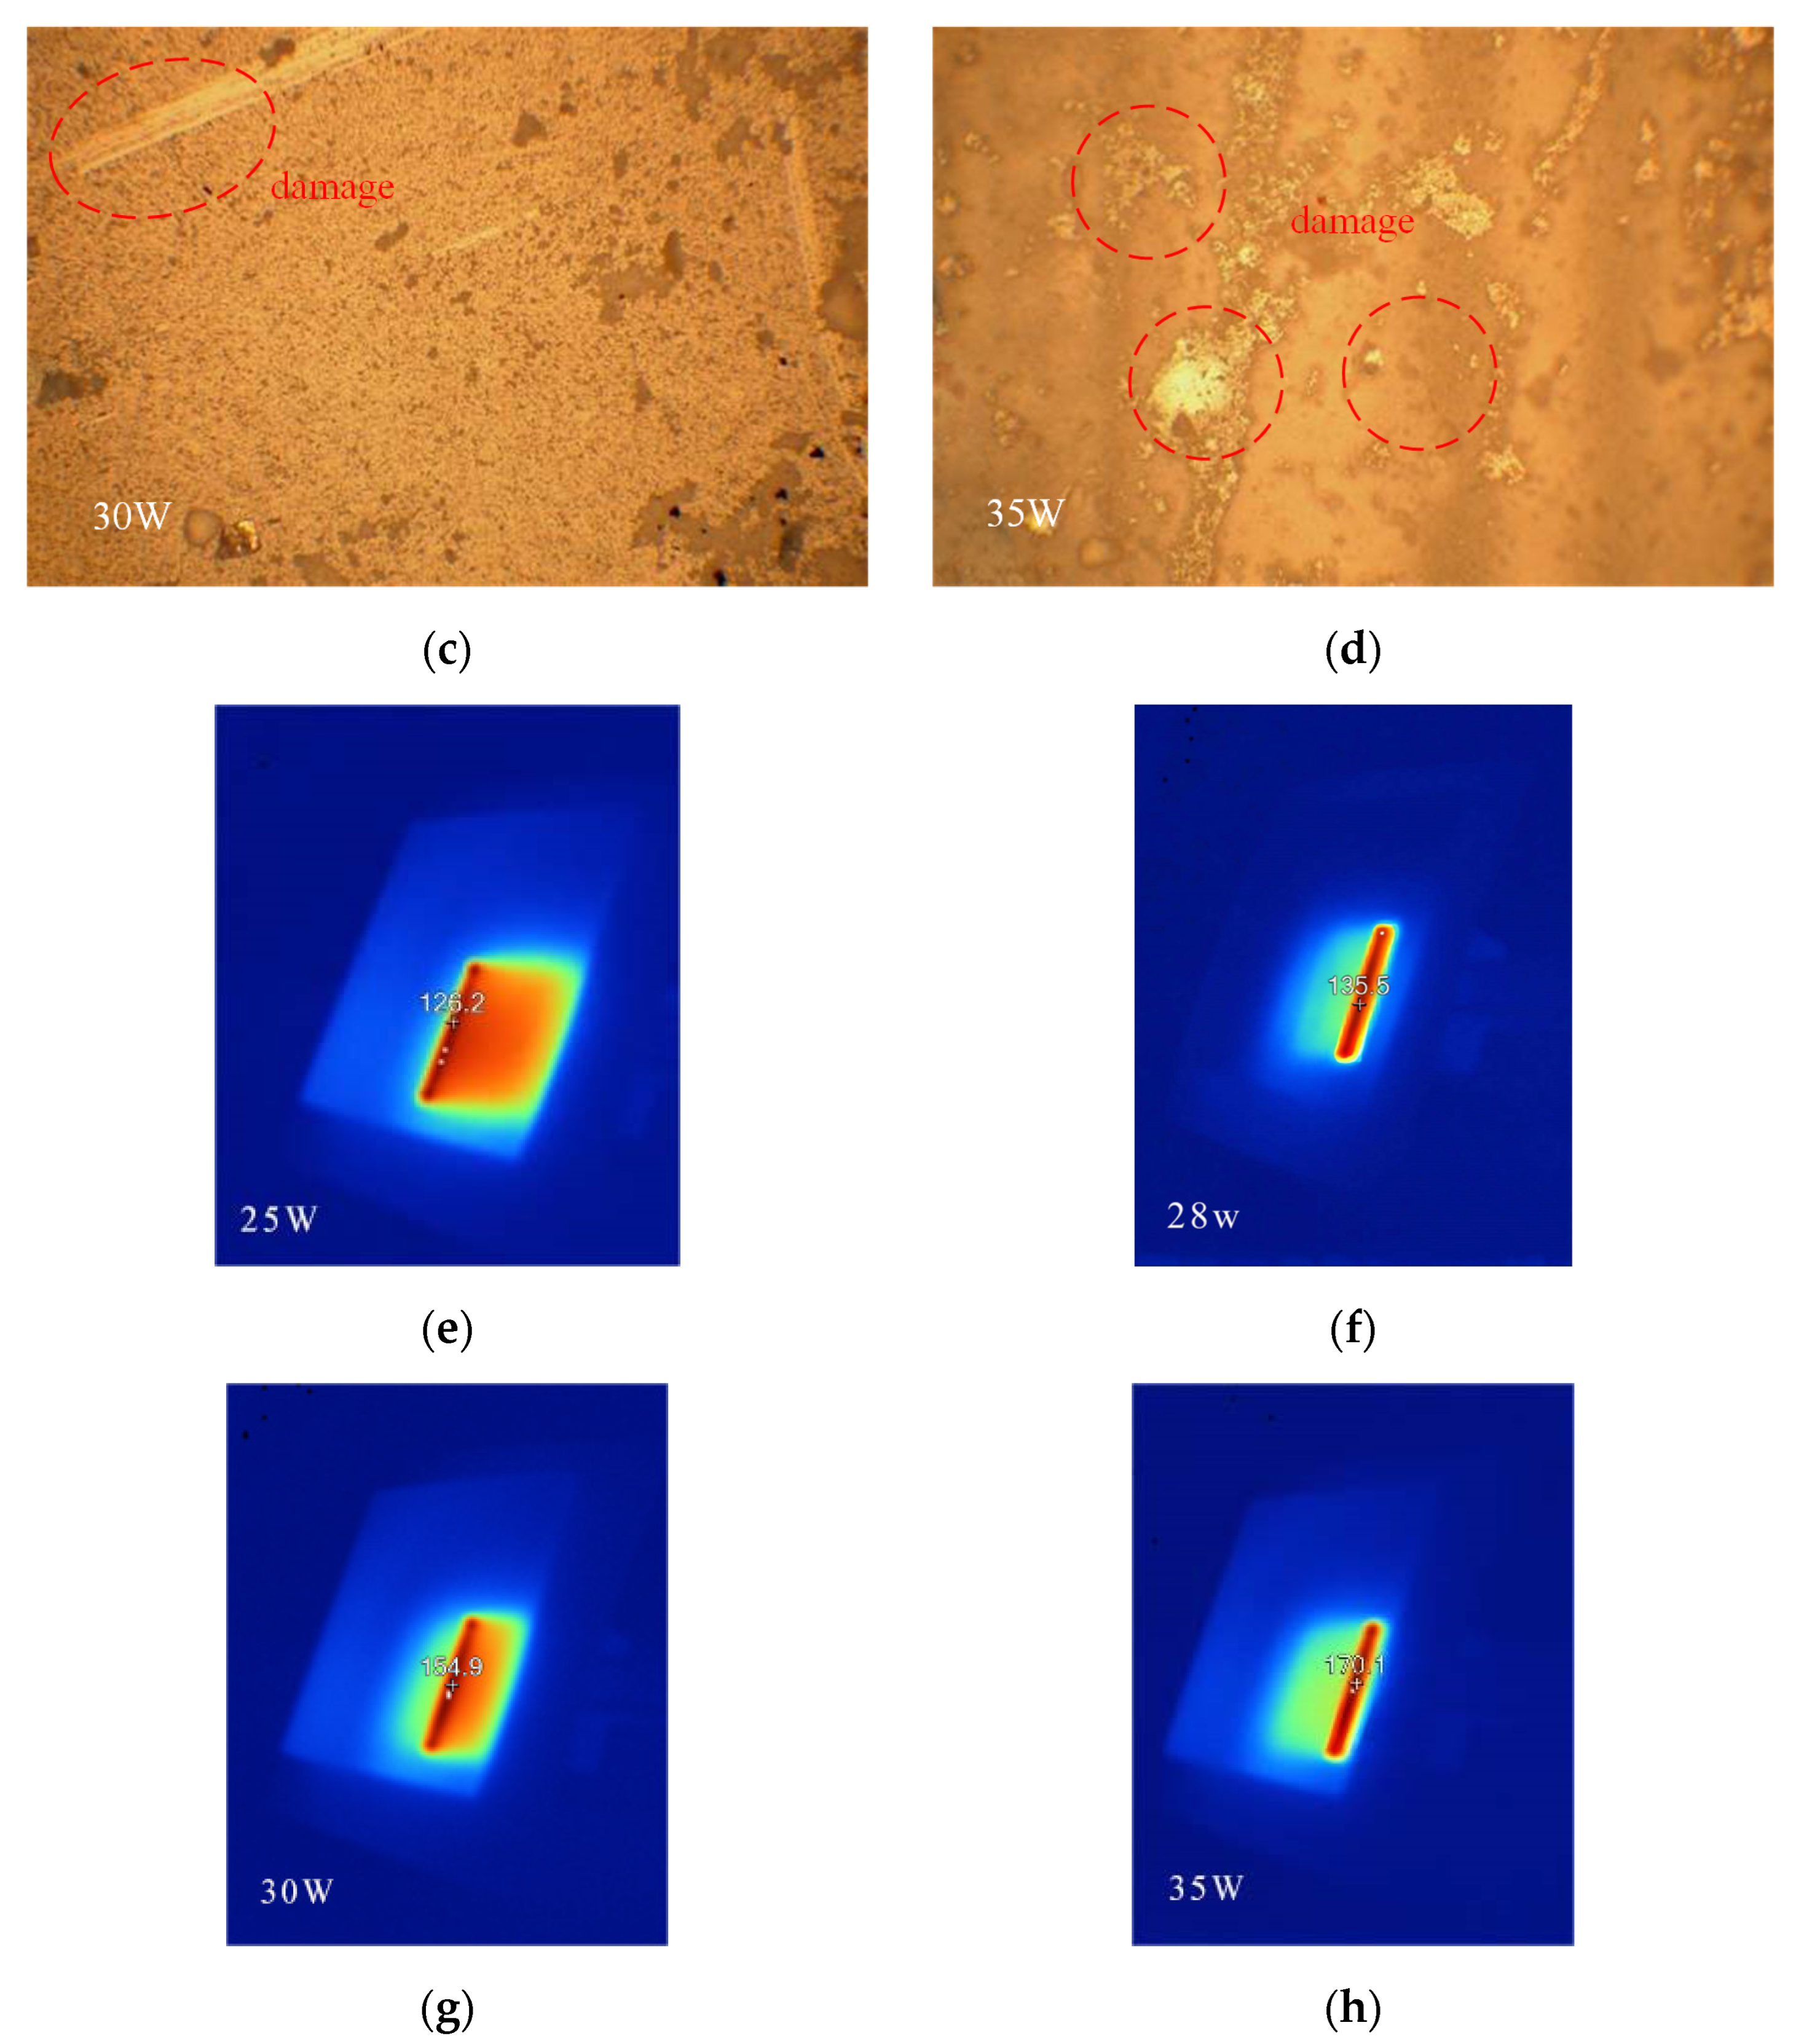
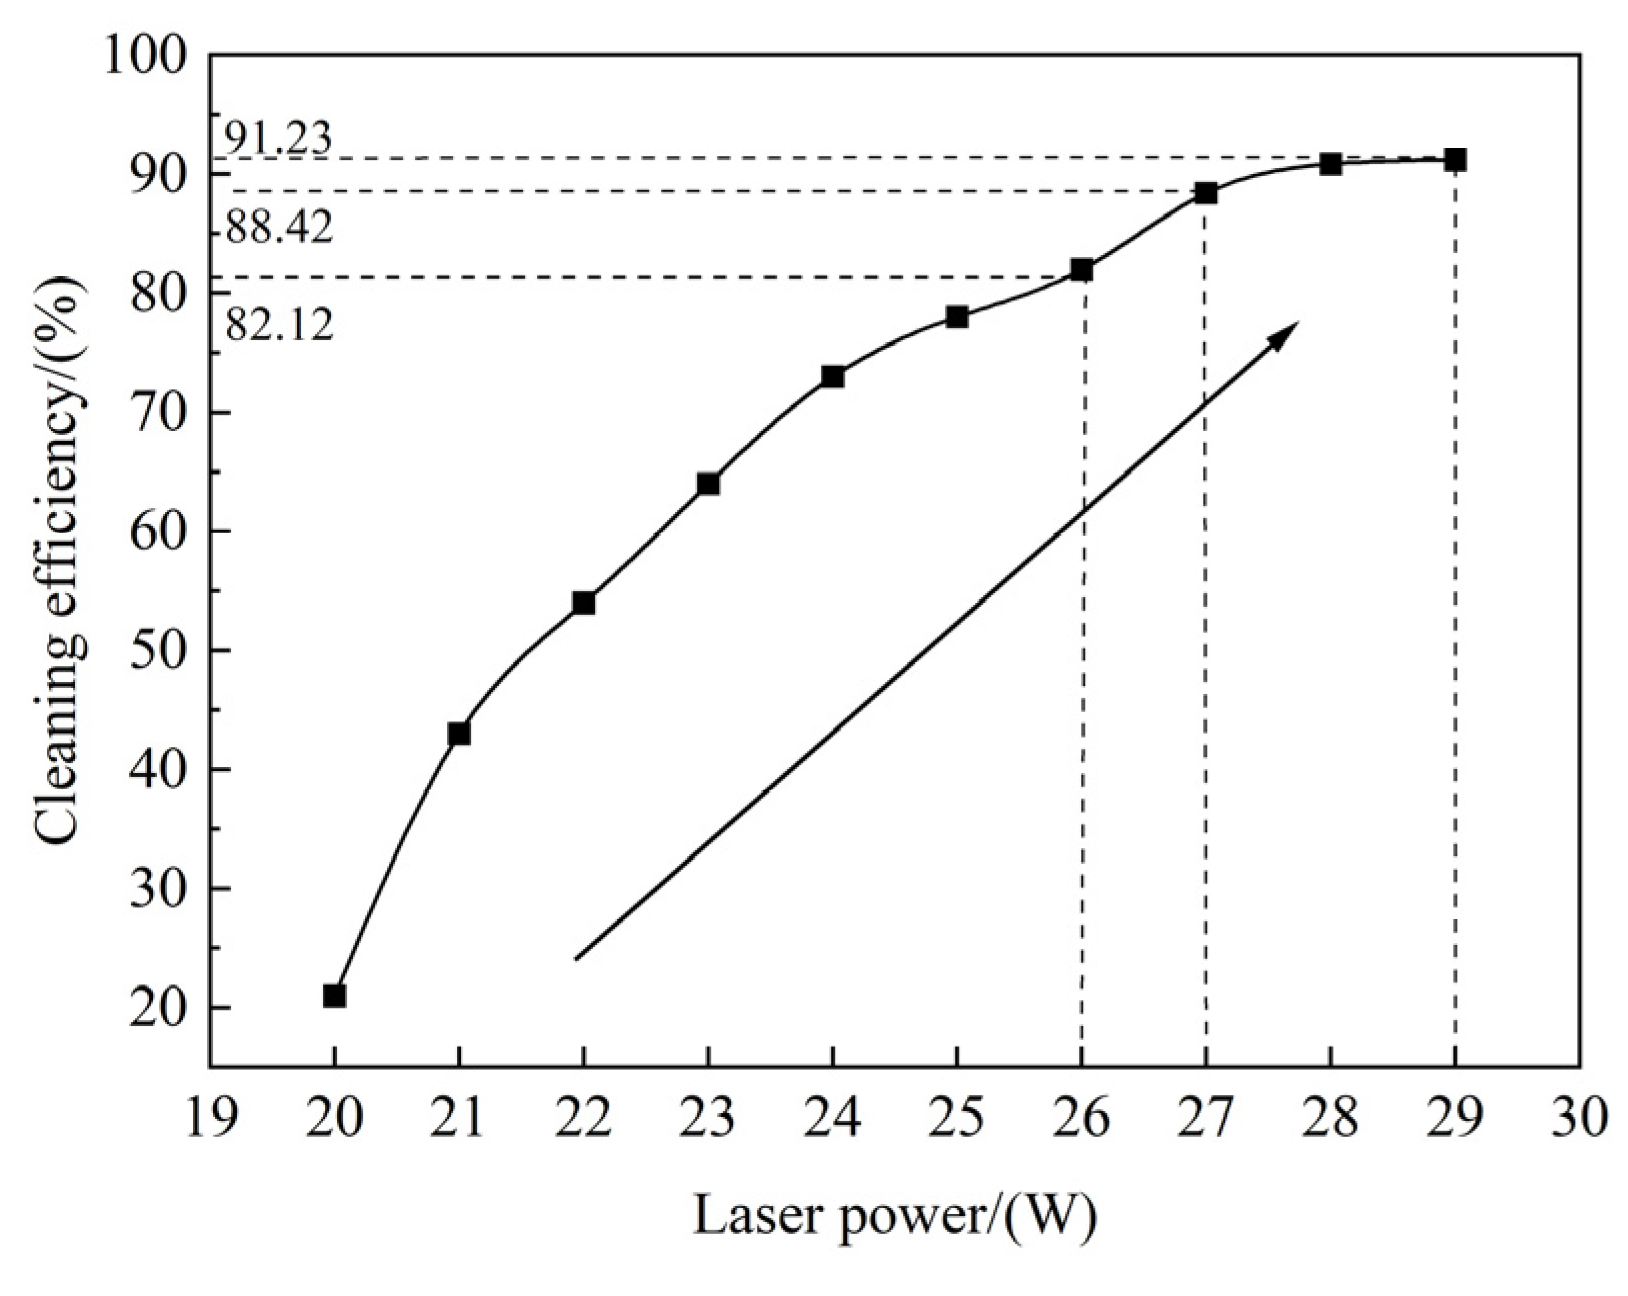
4.2. The Effect of Laser Power on Cleaning Efficiency

The laser scanning speed was 2500 mm/s, and the test samples were cleaned with 25 W, 28 W, 30 W, and 35 W power.
Figure 7a–d shows the distribution of porcelain tile soiling imaged by the metallographic microscope. The metallographic microscope image in Figure 7 indicates that with a laser power of 25 W, the surface had obvious residual dirt. When using a laser power of 28 W, most of the sample tile’s surface was cleaned, and only with observation by a metallographic microscope observation could a minimal amount of dirt particles and residue be found. When the power was 35 W, the surface of the porcelain tile exhibited damage. Therefore, the optimal laser power was 28 W, resulting in no damage and the highest laser cleaning efficiency. Figure 7e–h shows the infrared temperature distribution at different power levels measured by the infrared thermometer. The maximum temperature is 126.2 °C, 135.5 °C, 154.9 °C, and 170.1 °C. The temperature change trend is the same when compared with the simulation data. When the power is 25 W~28 W, it can ensure safe and efficient laser cleaning. Figure 8 shows that the fouling part accounts for 9.14%, and the cleaning efficiency is 90.86% when the laser power is 28 W.
The cleaning efficiency varies with power, as shown in Figure 9. Figure 9 shows that with increasing laser power, the cleaning efficiency gradually increased. When P = 26 W, cleaning efficiency η = 82.12%. When P = 27 W, η = 88.42%. When the laser power was greater than 27 W, cleaning efficiency growth slowed, and no significant change was observed when P = 29 W and η = 91.23%. Power up to 30 W caused damage to the surface of the porcelain tile. When the laser power was greater than 26 W, the surface exhibited no obvious dirt. When P = 27 W~28 W, ideal cleaning was achieved. However, when the laser power continued to increase, the probability of damaging the insulator also increased.

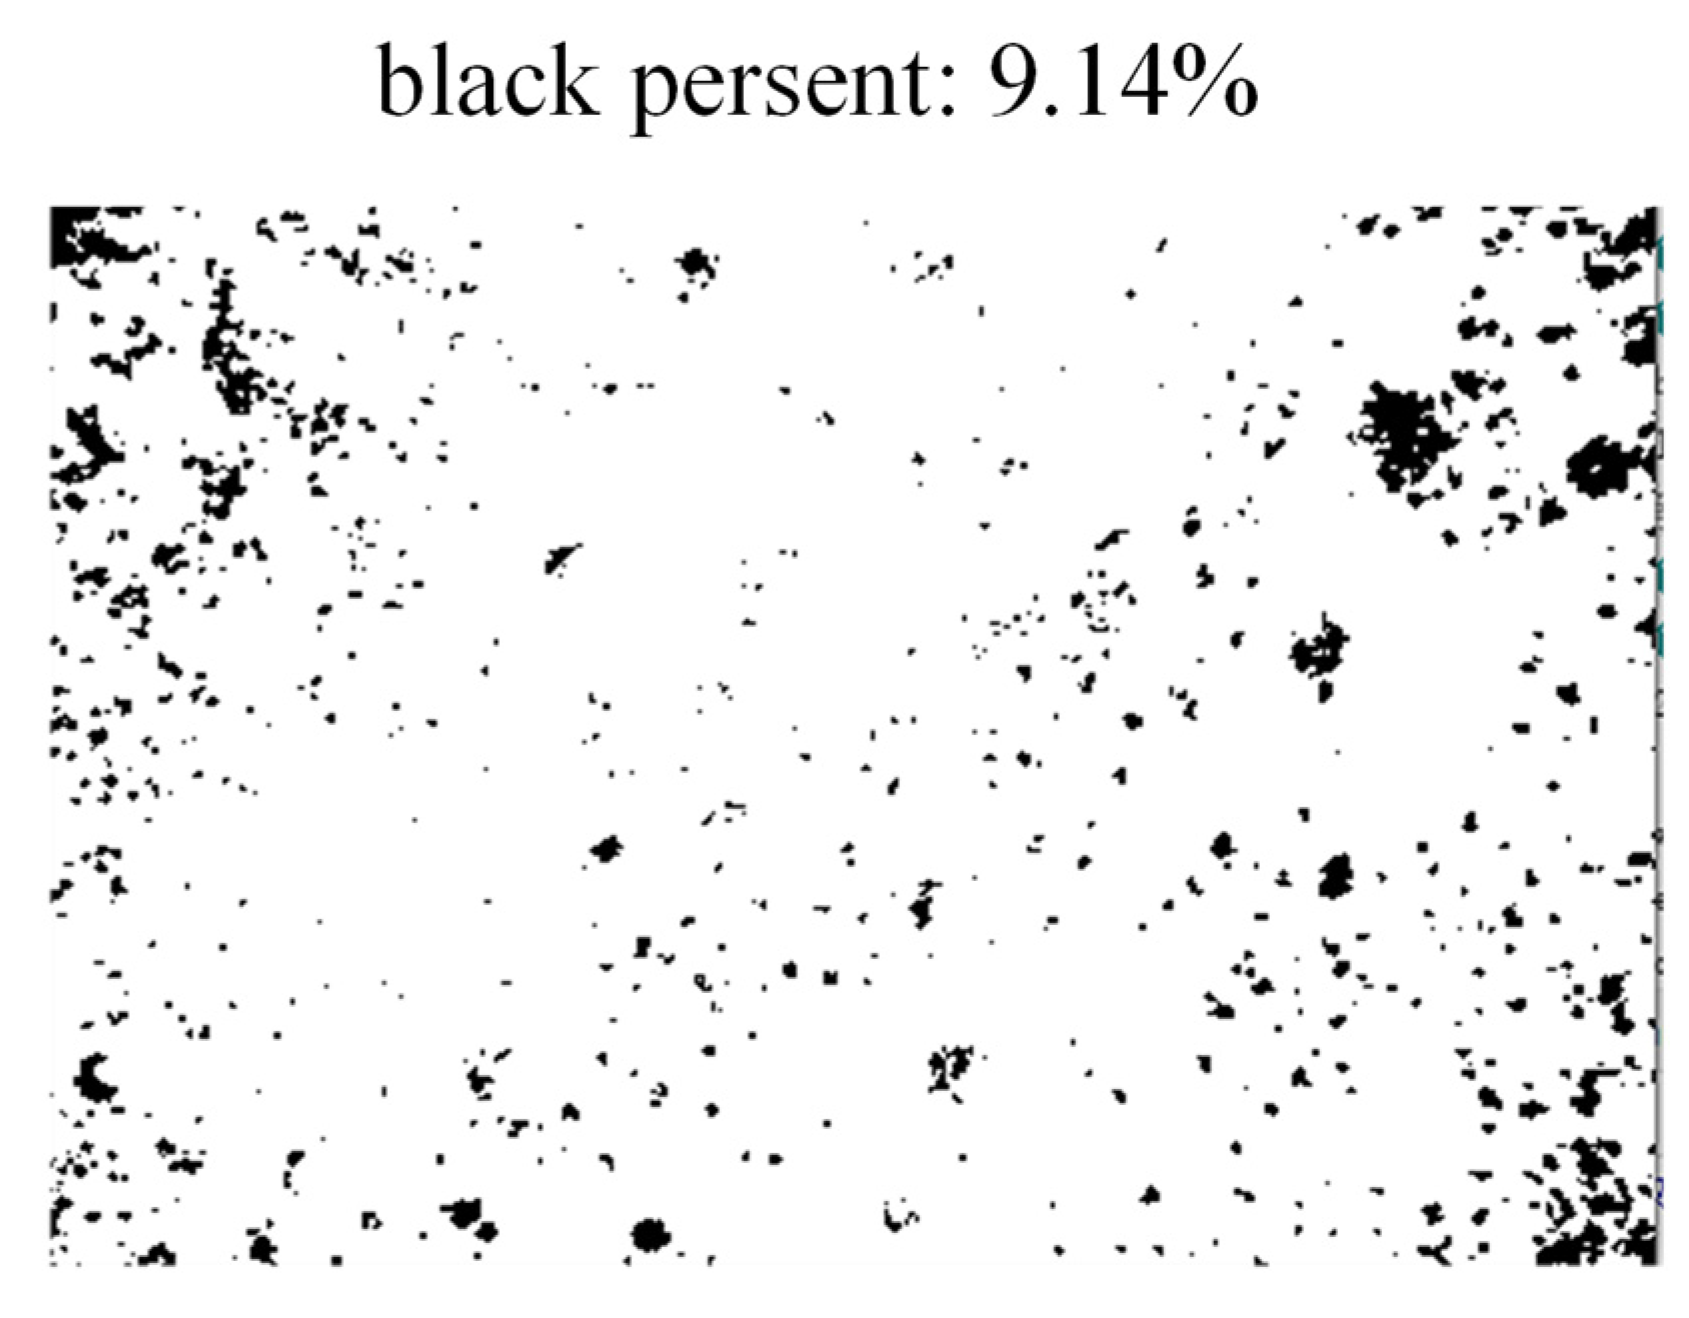
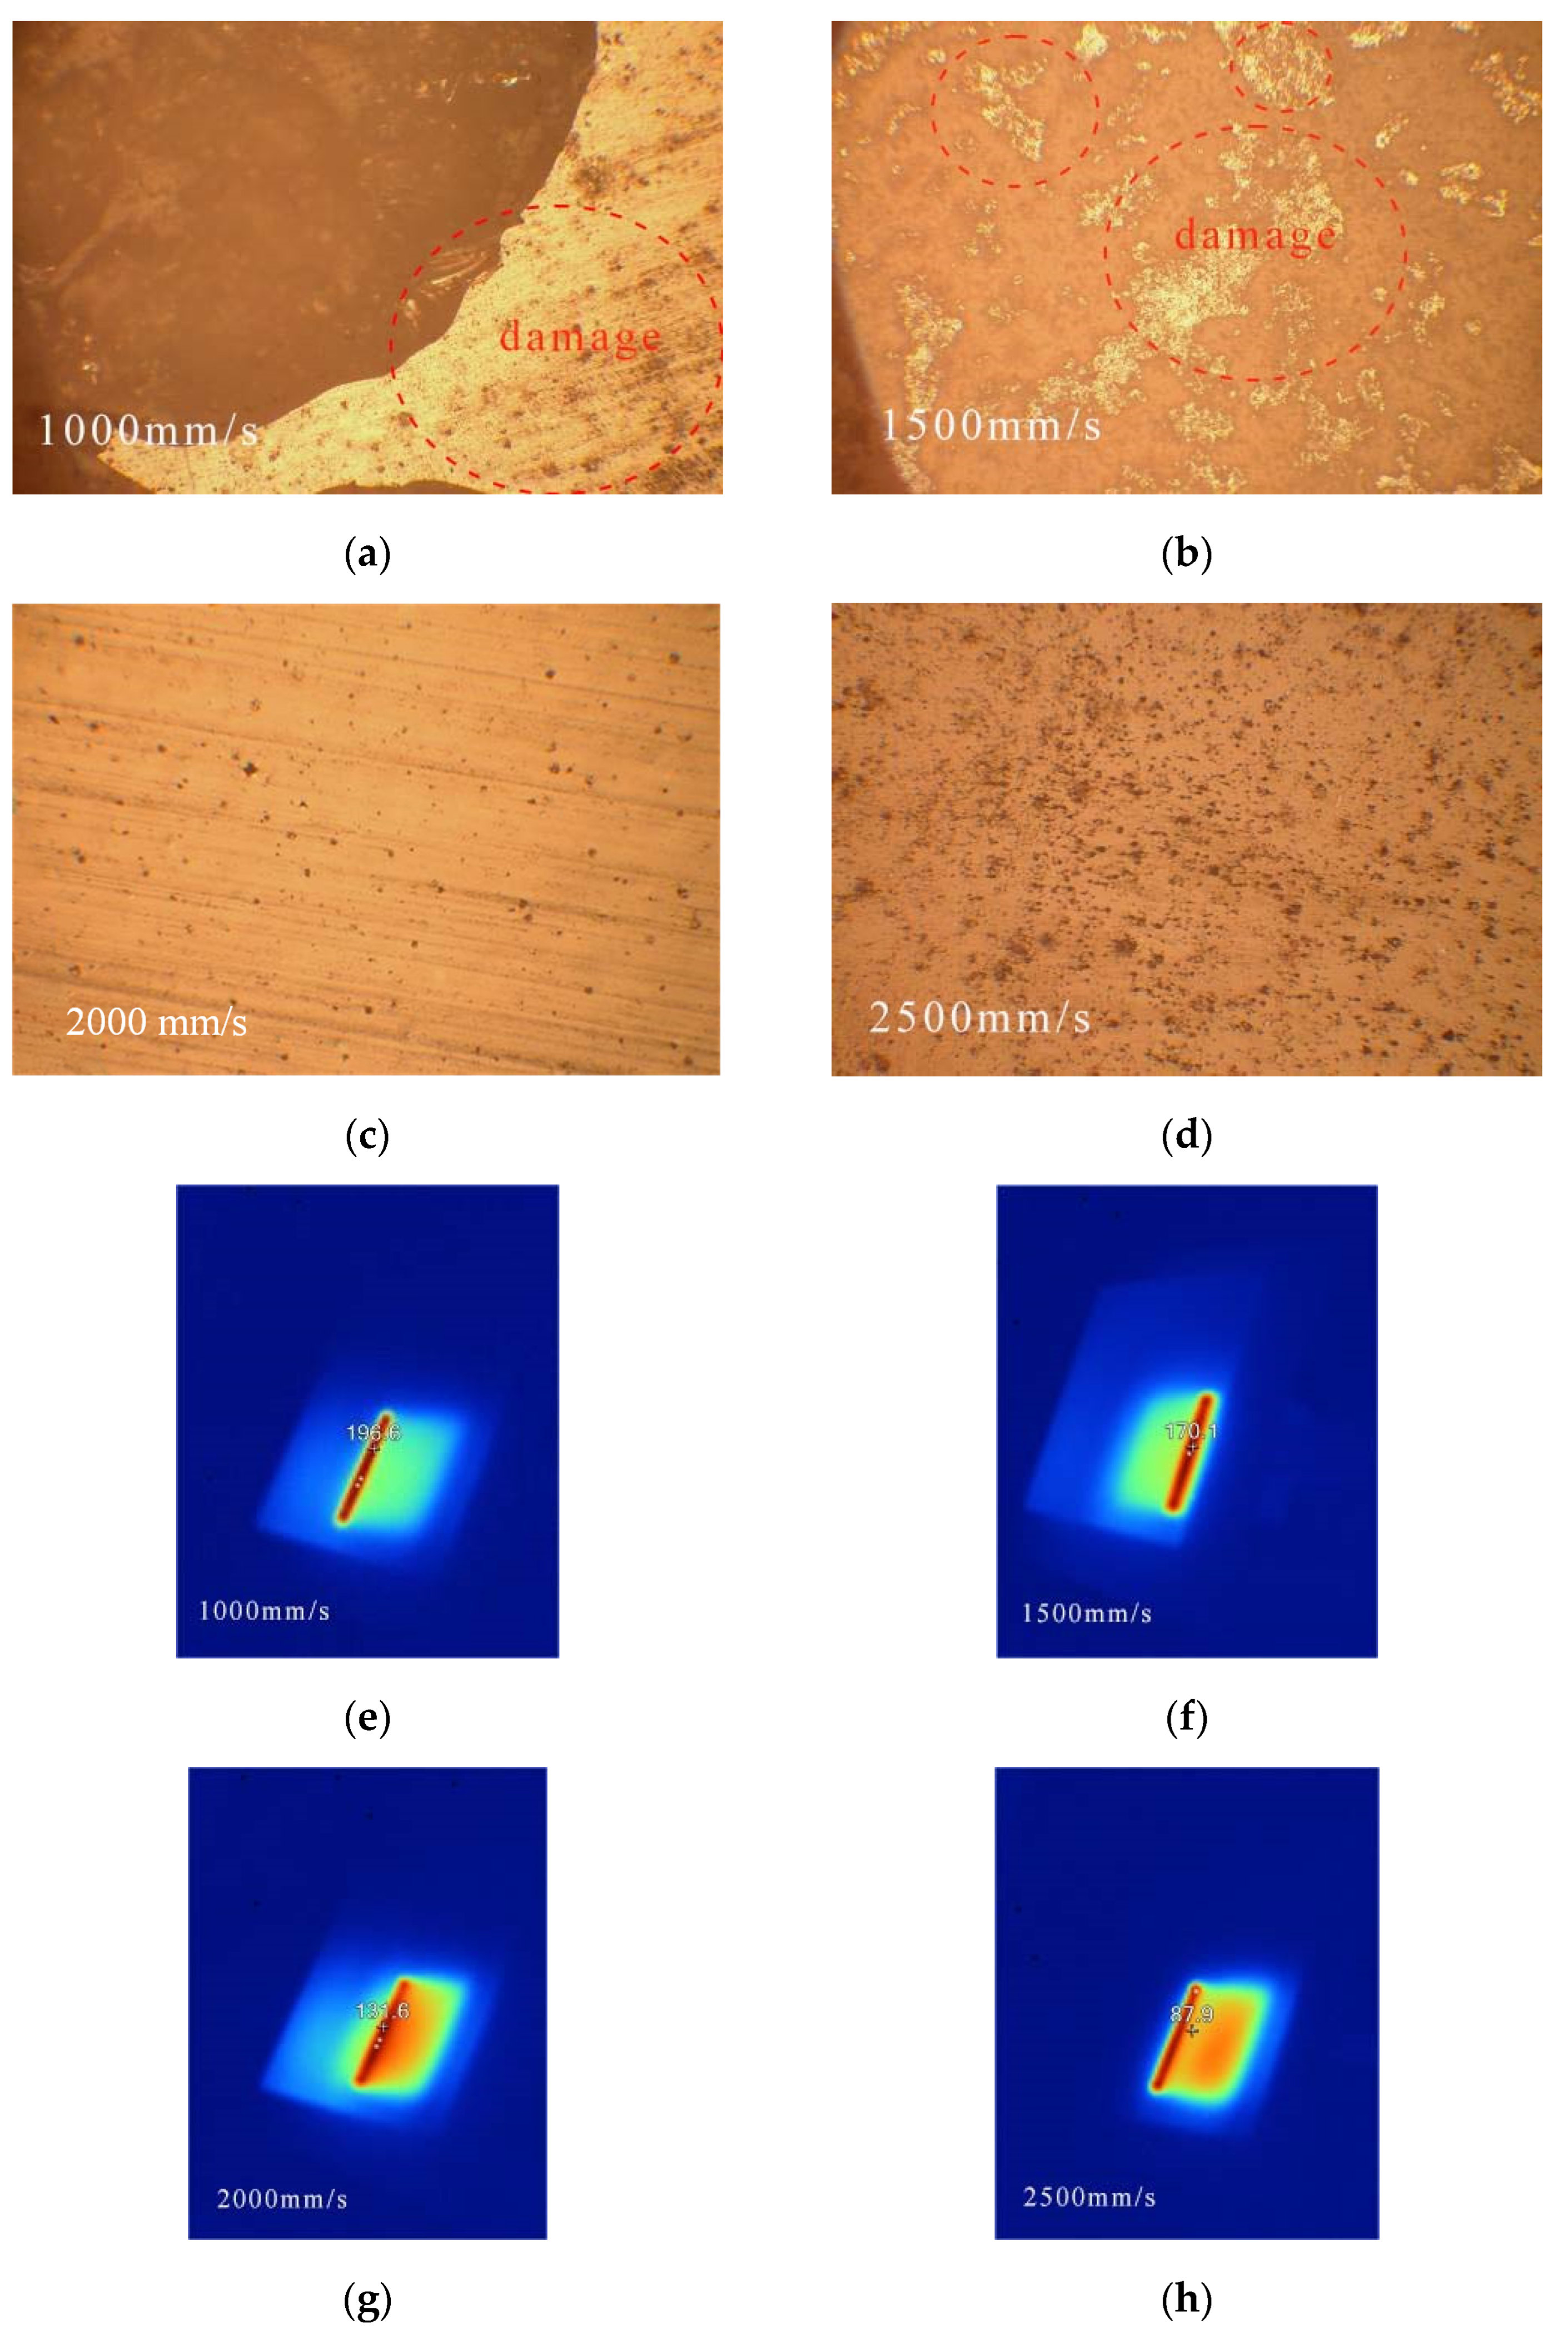
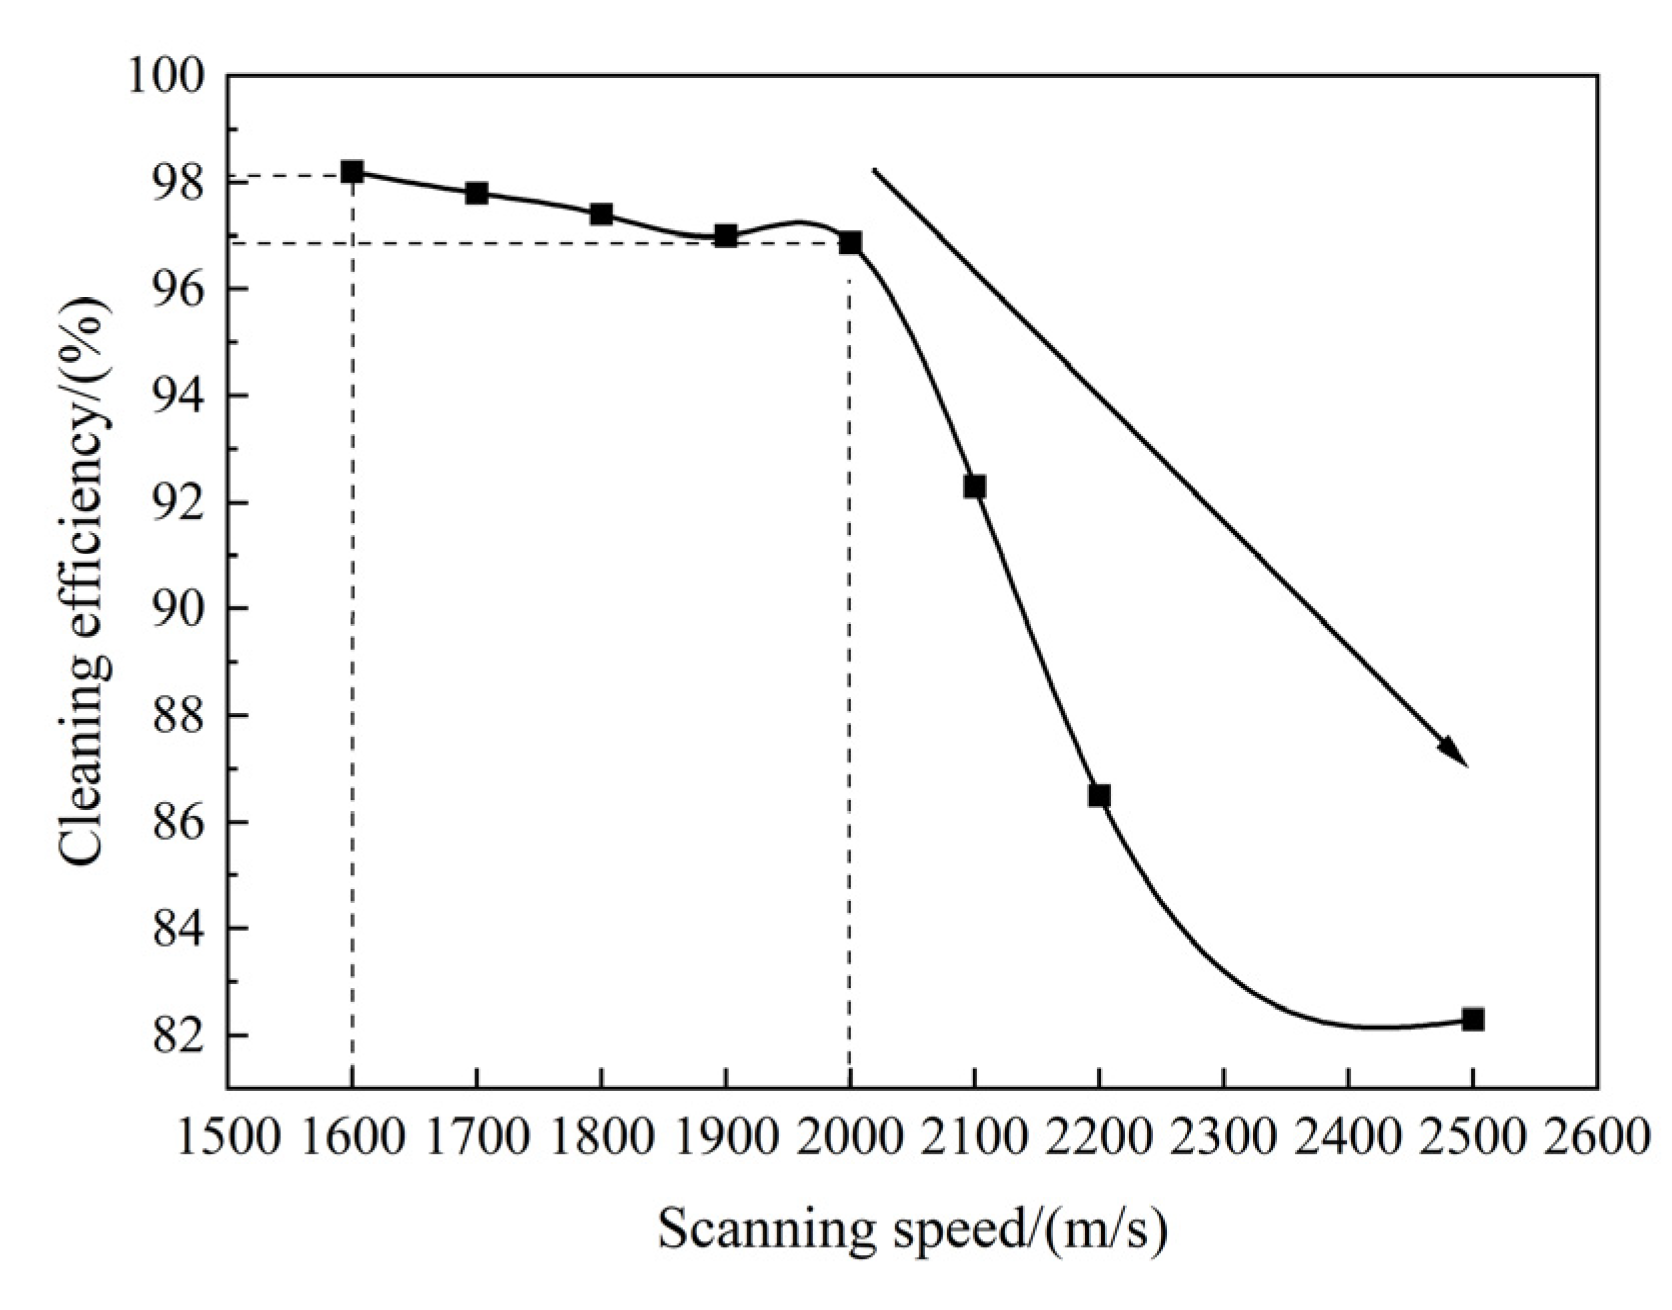
4.3. The Effect of Scanning Speed on Cleaning Efficiency

To investigate the laser cleaning efficiency under different scanning speeds, this test uses 25 W laser power and scanning speeds of 1000 mm/s, 1500 mm/s, 2000 mm/s, and 2500 mm/s. The surface soiling and temperature changes are obtained using a metallographic microscope and infrared thermometer.
Figure 10a–d displays a metallographic microscope image showing the cleaning effect of different scanning speeds. Figure 10e–h shows the infrared temperature distribution at different scanning speeds. From Figure 10a,e, it can be seen that when the scanning speed is 1000 mm/s, the maximum temperature of the porcelain tile reaches 196.6 °C and is significantly damaged by the laser. From Figure 10c,g, it can be seen that when the scanning speed is 2000 mm/s, the surface is the cleanest, the highest temperature is within the safe range, and the cleaning efficiency is the highest. Compared with the simulation results, the actual experimental environmental conditions are not as ideal as the simulation conditions. Nevertheless, the difference in temperature values is minimal and consistent with the simulation results. The binarized images at different scanning speeds are shown in Figure 11. Figure 11a shows that when the scanning speed is 2500 mm/s, the black rate of dirt is 17.66%, which indicates the cleaning efficiency is 82.34%. Figure 11b shows that when the scanning speed is 2000 mm/s, the black rate of dirt is 3.13%, which indicates the cleaning efficiency is 96.87%.
The cleaning efficiency at different scanning speeds is shown in Figure 12. As the scanning speed increases, the laser lap rate gradually decreases. When the scanning speed is lower than 1500 mm/s, it will cause surface damage. When the scanning speed is 2200 mm/s, the cleaning efficiency declines seriously to η = 86.5%. Therefore, when the scanning speed is 2000 mm/s, damage to the porcelain insulator is prevented and efficient cleaning is ensured.

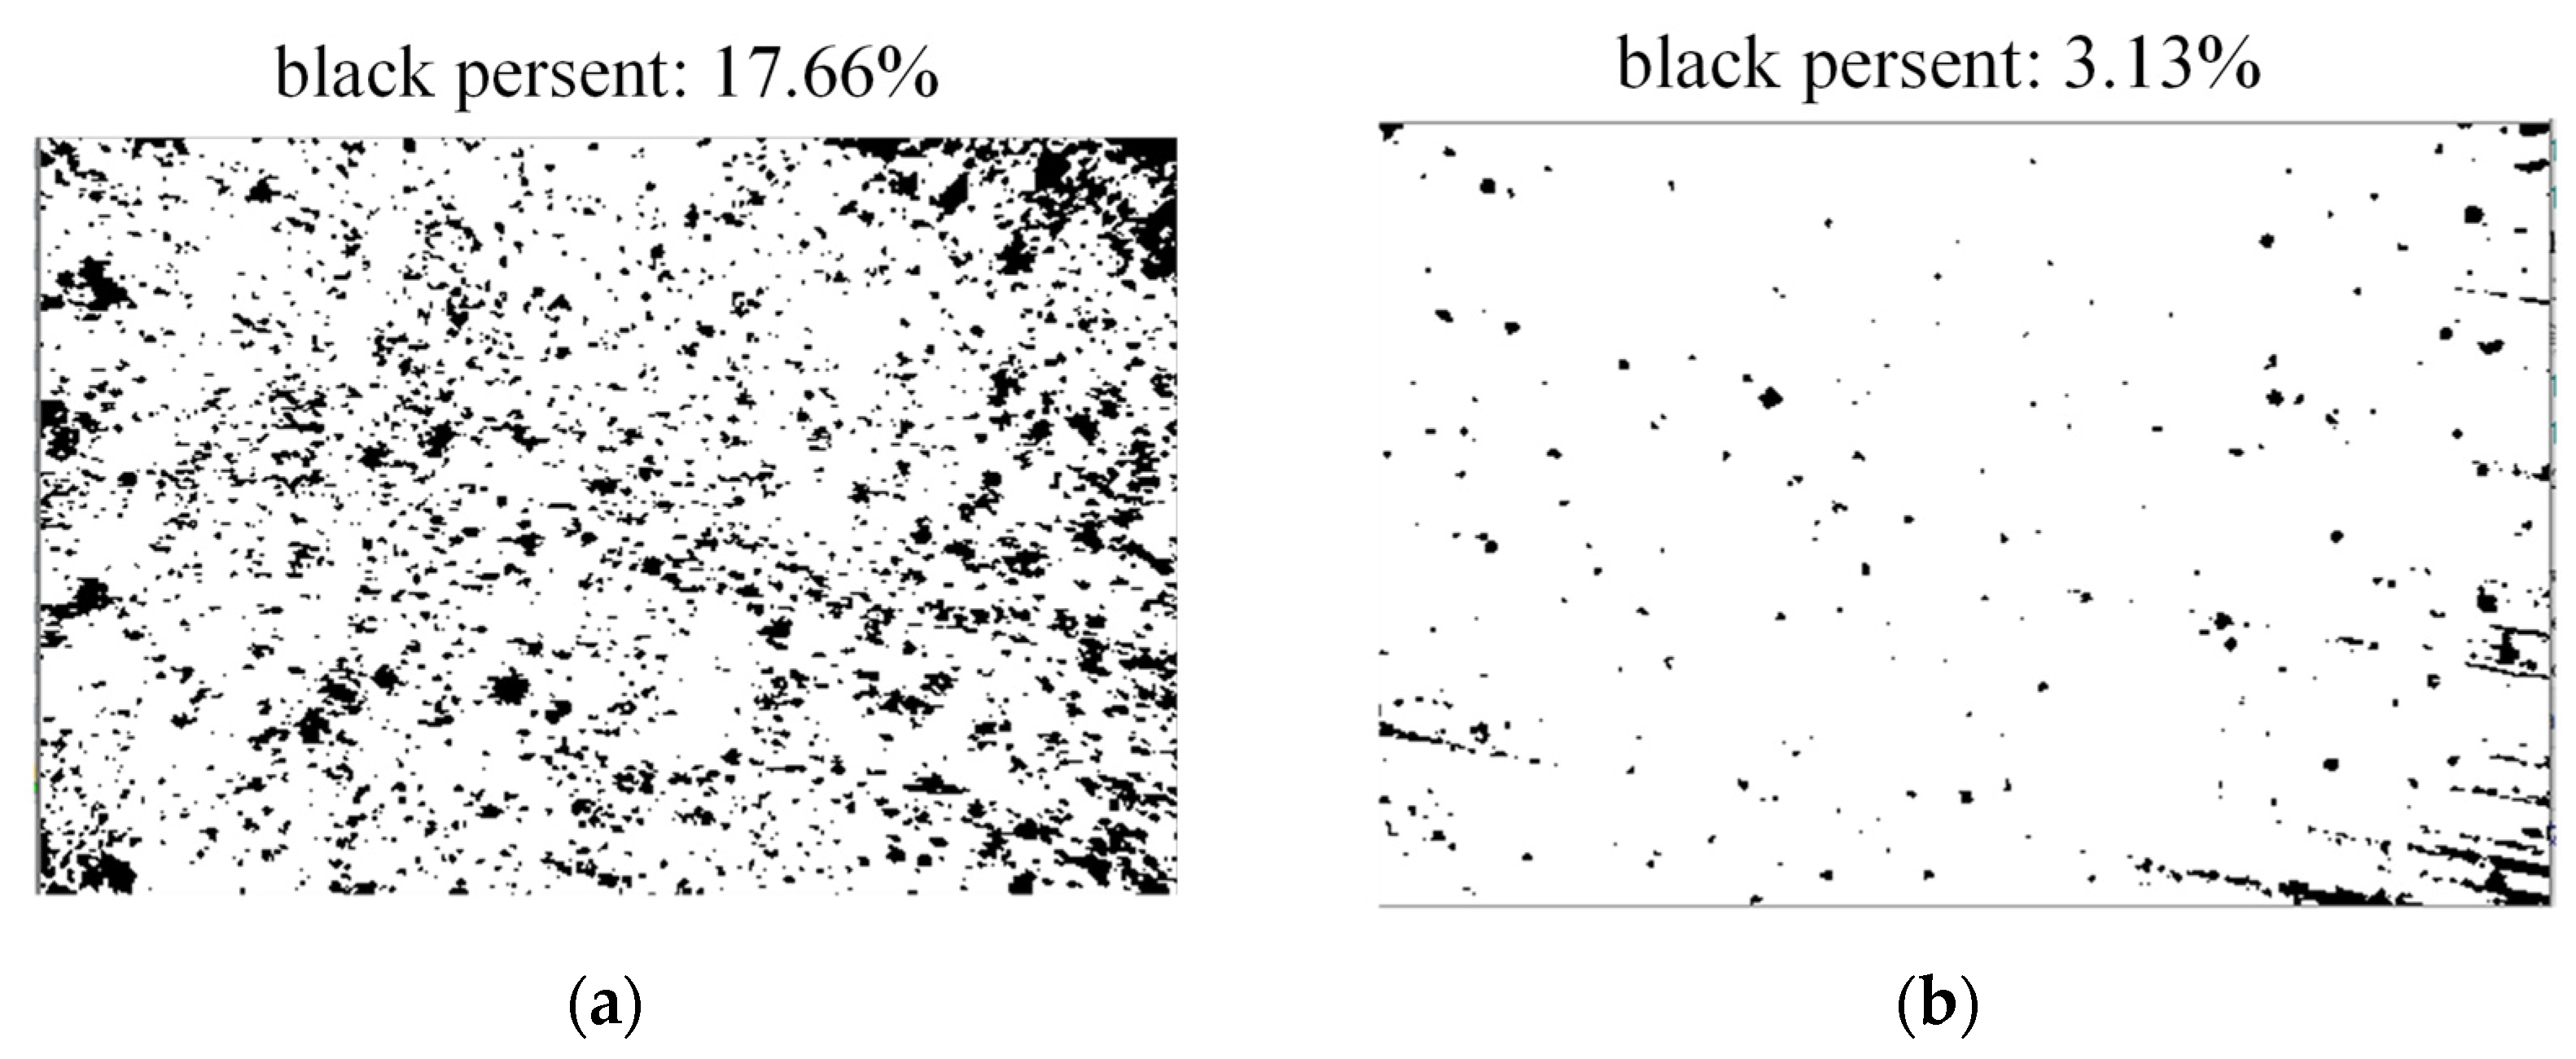
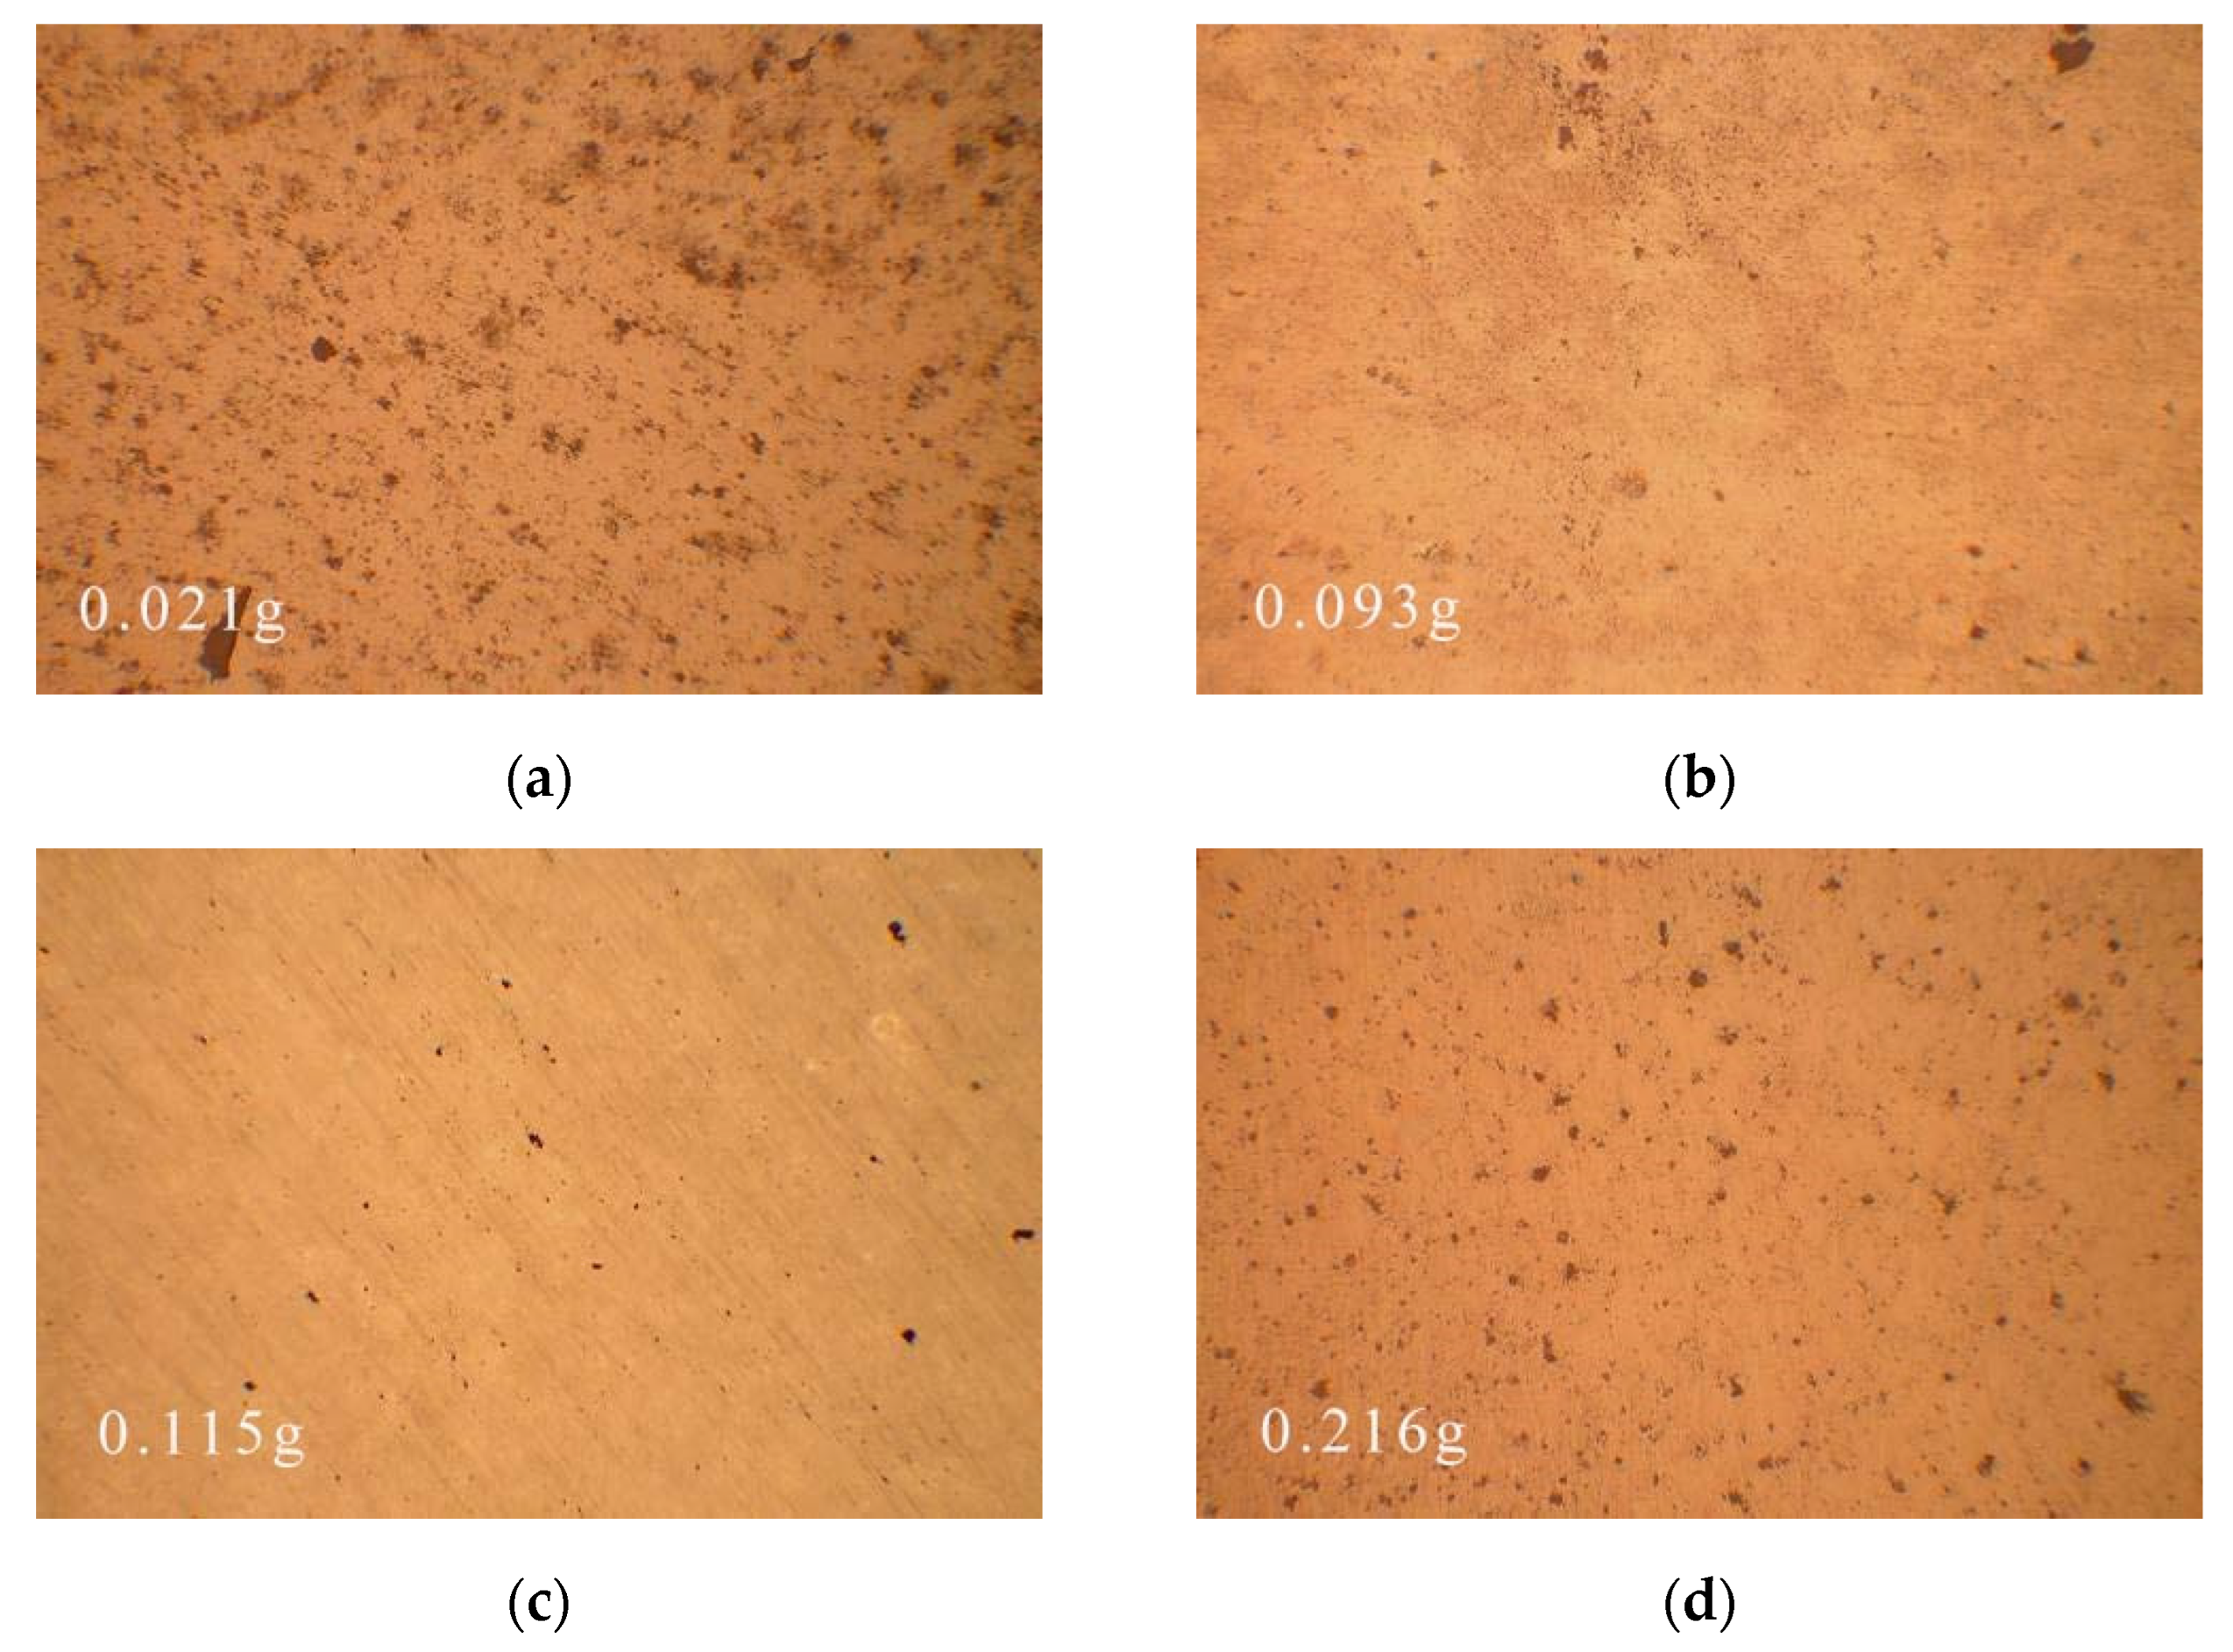
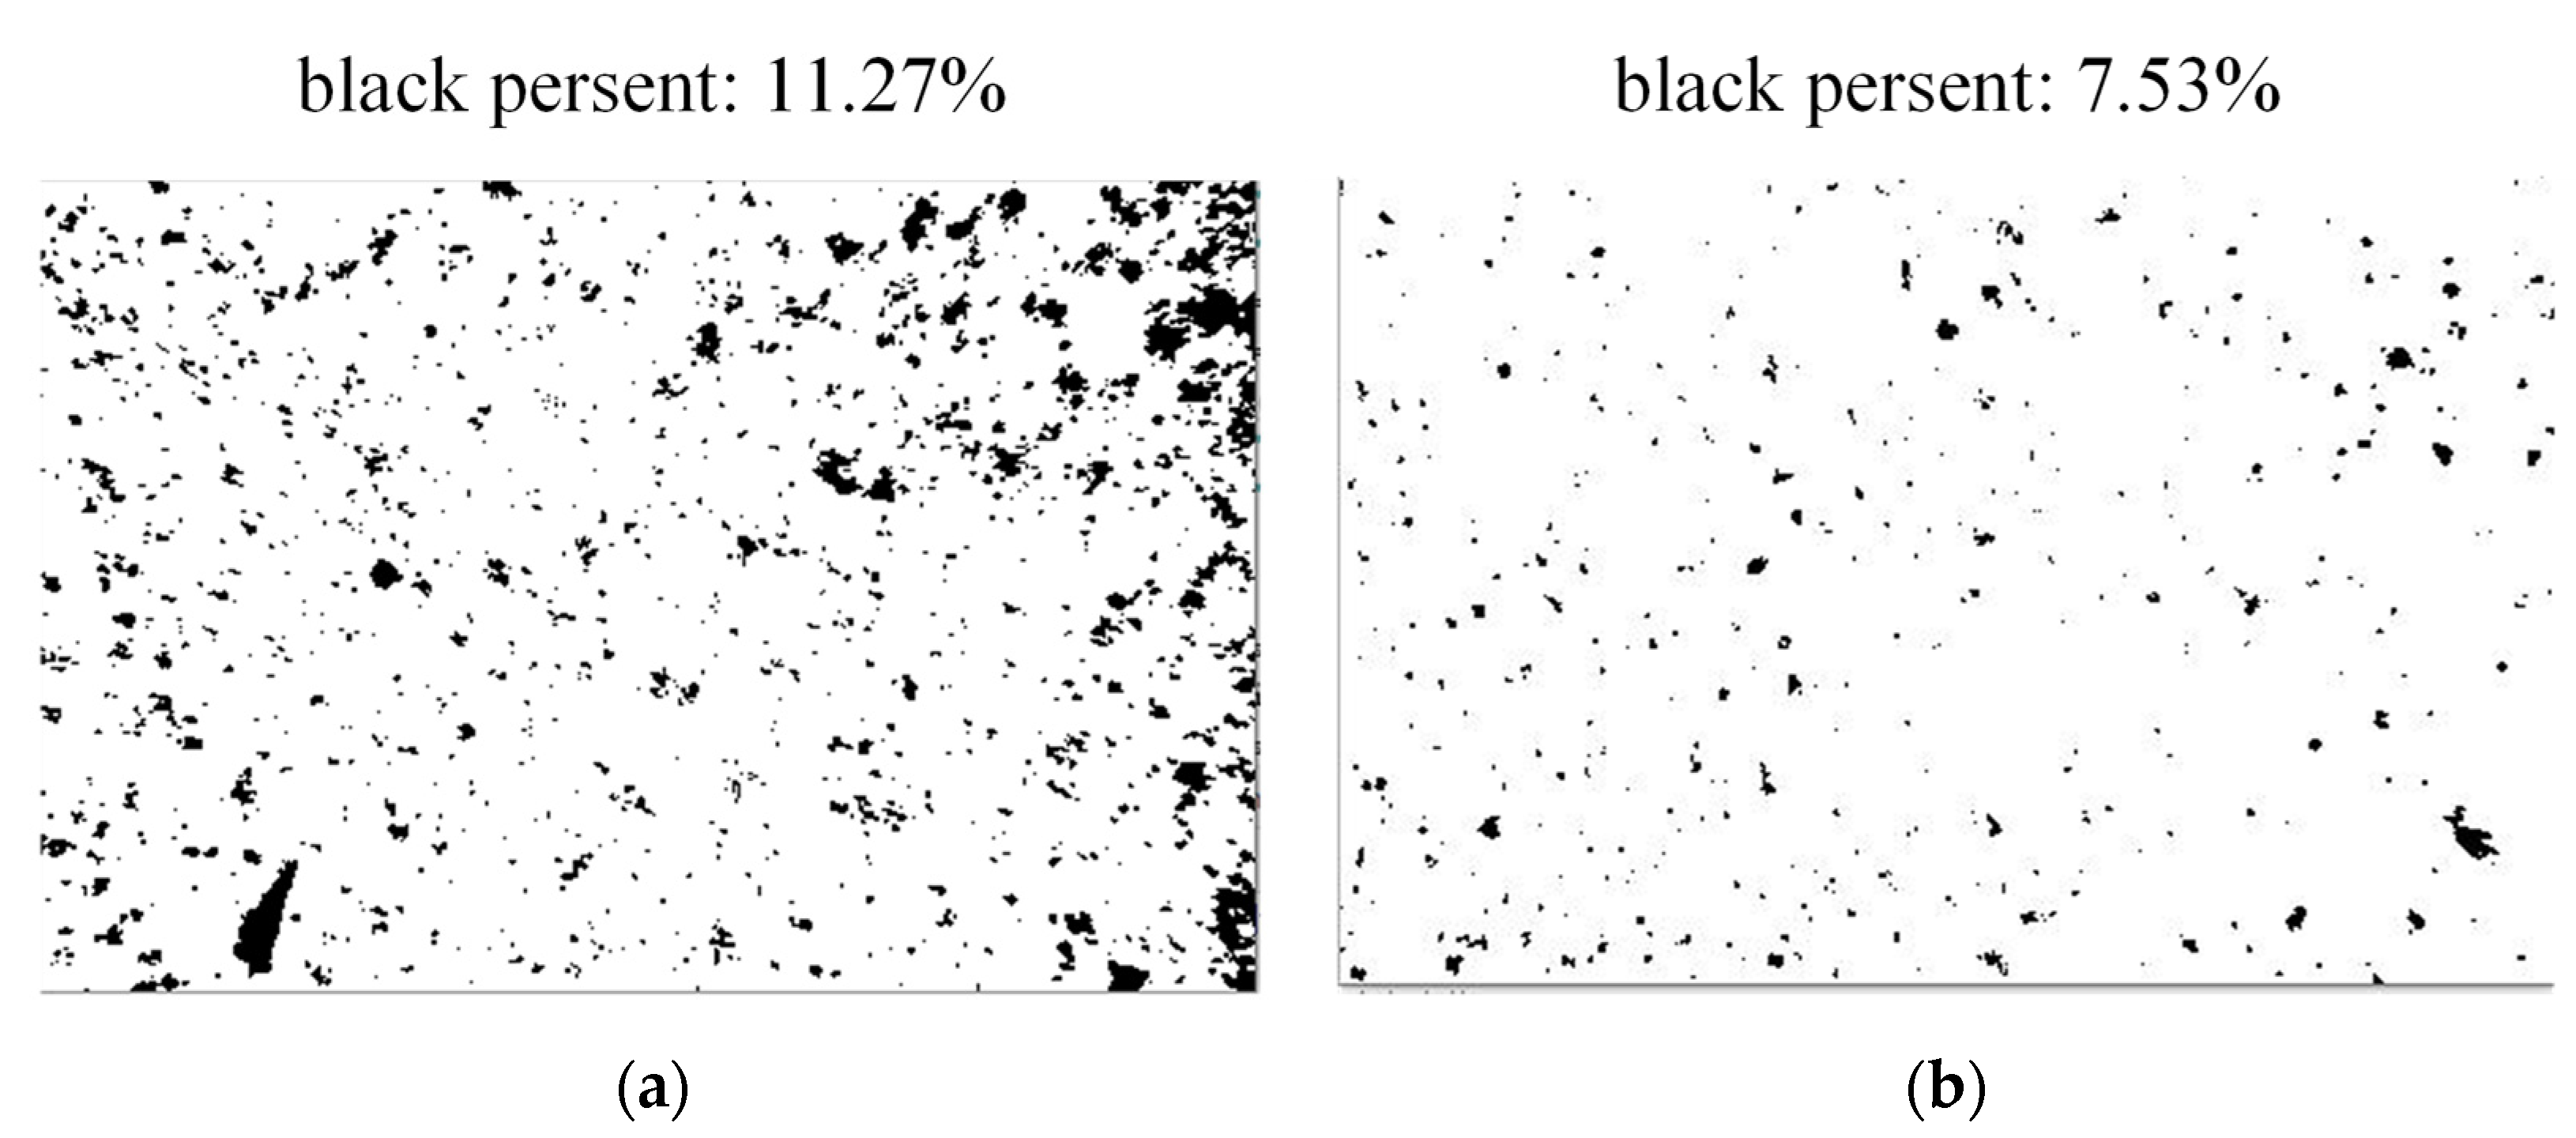
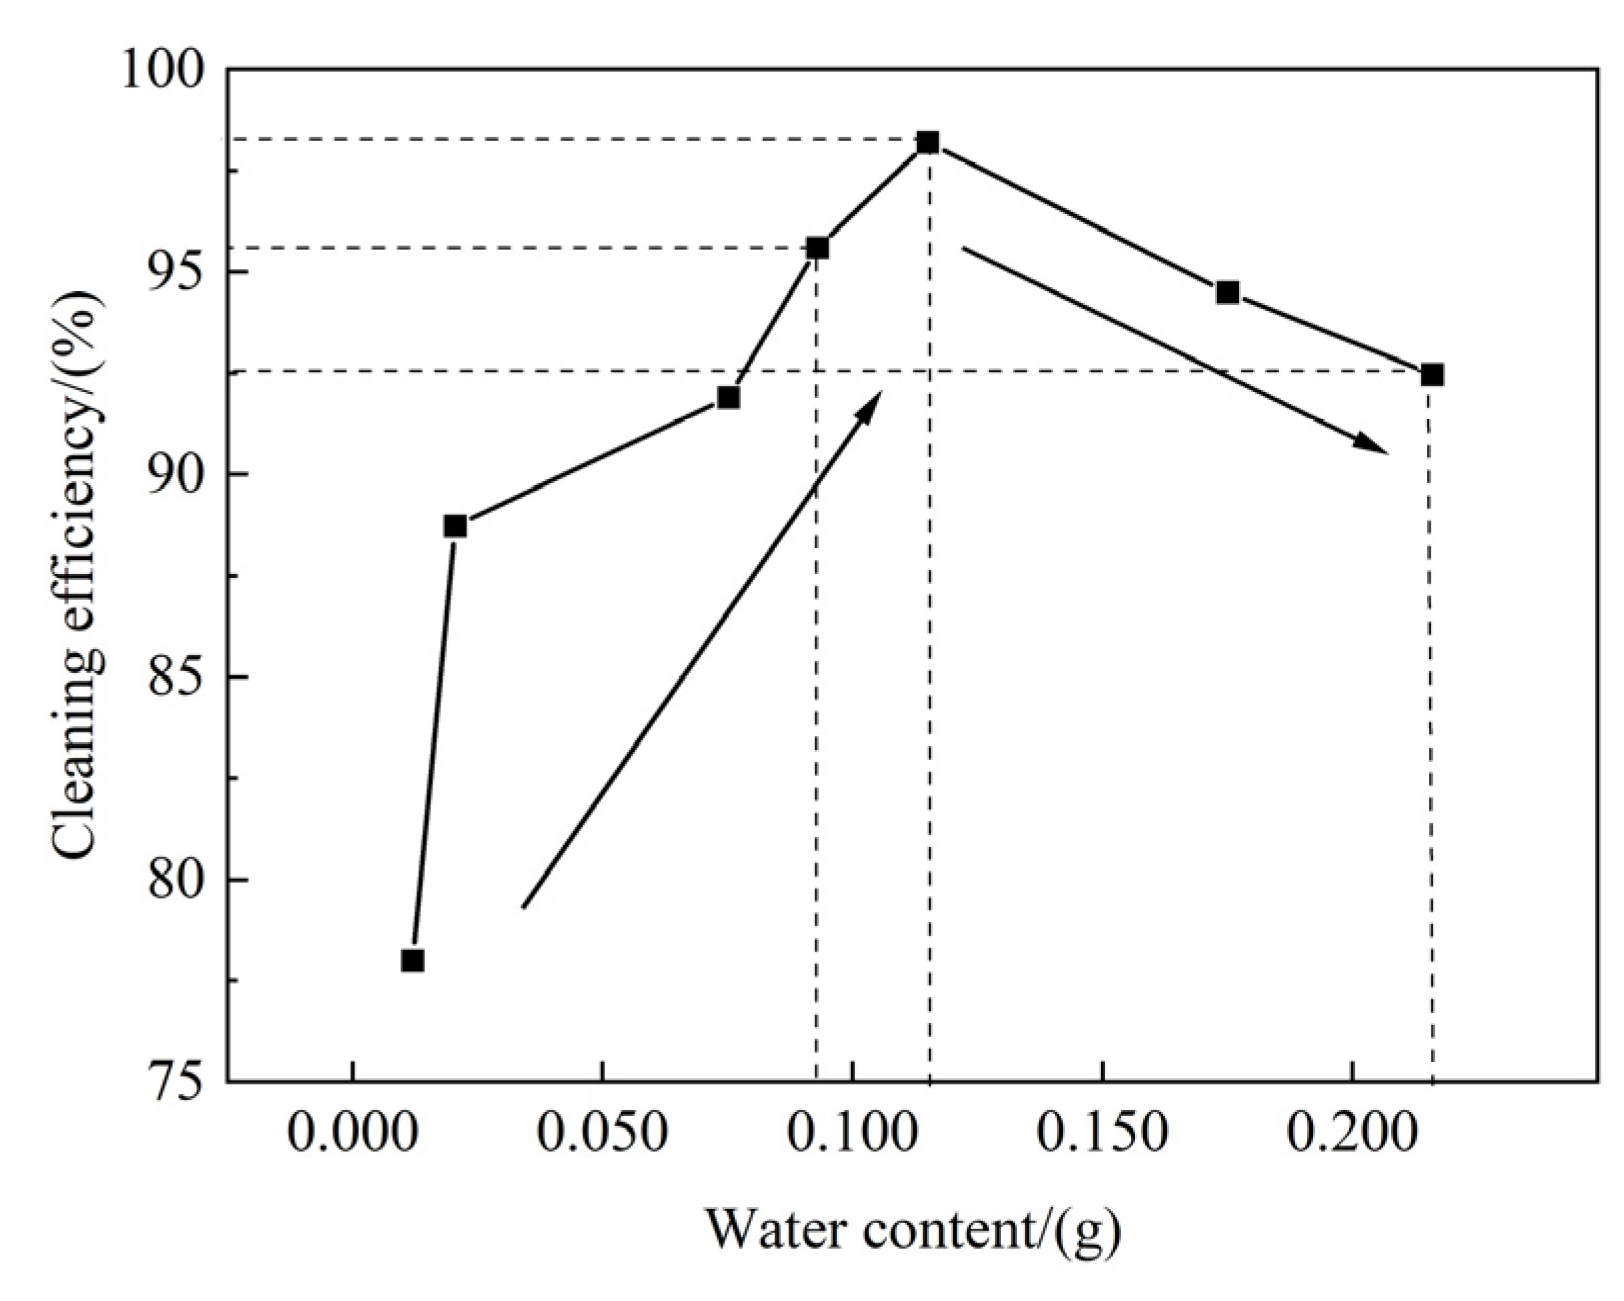
4.4. The Effect of Water Content on Cleaning Efficiency

To study the impact of water content on cleaning efficiency, this test set the laser power to 25 W and scanning speed to 2500 mm/s. The water content of the four groups of samples was calculated to be 0.021 g, 0.093 g, 0.115 g, and 0.216 g by spraying water for different periods of time on the test samples.
After laser cleaning, the surface of the porcelain tile was observed by electron microscopy, and Figure 13 shows the cleaning effect on samples with different water contents. Figure 13a,b shows that when the water content is 0.021 g, a large amount of dirt remains on the surface of the porcelain tile. As shown in Figure 13c,d, when the water content is 0.115 g, the surface of the porcelain tile is cleaned. As the water content reaches 0.216 g, the surface soiling of the porcelain tile increases. From Figure 14a,b, it can be calculated that when the water content is 0.021 g, the black rate is 11.27%, that is, the cleaning efficiency is 88.73%, and when the water content is 0.216 g, the black rate is 7.53%, that is, the cleaning efficiency is 92.47%. Different water content and their corresponding cleaning efficiencies are shown in Figure 15. When the dirt water content is less than 0.075 g, cleaning efficiency is affected by the water content. When the water content is increased to approximately 0.115 g, the maximum cleaning efficiency increases to 98.2%. When the dirt water content is greater than 0.115 g, the cleaning efficiency decreases with the increase of water content. Therefore, the water content can enhance the laser cleaning efficiency, but when the water content reaches a certain level, the cleaning efficiency is instead reduced. When the water content reaches a certain level, the dirt is more viscous, and the adhesion with the glaze surface is greater; therefore, the growth of thermal stress is not enough to exceed the adhesion force, resulting in dirt residue. Therefore, when the water content is too great, removing the dirt from the porcelain surface is more difficult. When the water content was approximately 0.115 g, the cleaning efficiency reached the highest value.

5. Conclusions

In this work, laser equipment was used to directly remove the fouling from the surface of porcelain insulators. The present work investigated the cleaning effect at different laser power, scanning speed and water content to determine the optimal cleaning parameters. For the first time, the experiments proposed an accurate cleaning efficiency detection method based on microscopic observation and image binarization processing. We analyzed the surface morphology and cleaning efficiency of the samples after cleaning. By comparing the experimental results, the safe range of laser parameters is discussed for applying laser in cleaning insulator fouling. The main results are as follows.
(1)
Simulations and studies on different experimental parameters have been carried out, which are essential for determining the laser cleaning parameters. By simulating the influence of laser power, scanning speed, and cleaning water content on the laser cleaning temperature field, the optimal parameters of laser cleaning can be determined. A laser power of 25 W–28 W can initially ensure that the porcelain insulator is not damaged; the scanning speed affects the degree of laser thermal action, and the laser lap rate is not within the appropriate range, leading to laser cleaning not meeting the requirements. A reasonable lap rate should be selected at approximately 50%. Laser wet cleaning can quickly increase the cleaning temperature compared to dry cleaning;
(2)
Laser cleaning effects are observed from the macroscopic scale to the microscopic scale through multiple experimental laser studies. The test results combined with simulation can be obtained and indicate that a specific range of water content can improve the laser cleaning efficiency. Maximum cleaning efficiency is achieved when the water content is 0.115 g. When the laser power was 25 W, and the scanning speed was 2000 mm/s, most of the dirt was cleaned and the cleaning efficiency reached 96.87%.

Author Contributions

C.F., Z.P., T.H. and T.W. conceived the idea and designed the experiments. C.F., T.H. and P.L. led the experiments. J.J., A.S. and Y.Z. contributed to data analysis. C.F. and T.H. wrote the paper. All authors have read and agreed to the published version of the manuscript.

Funding

This research was funded by the Youth Science Foundation project under Grant No. 51807110, and the National Natural Science Foundation of China under Grant No. 51807110.

Institutional Review Board Statement

Not applicable.

Informed Consent Statement

Not applicable.

Data Availability Statement

Not applicable.

Conflicts of Interest

The authors declare no conflict of interest.

References

  1. Dong, B.; Zhang, Z.; Xiang, N.; Gao, C.; Song, J.; Gu, Y. Studying AC Flashover Performance of Suspension Insulators Under Natural Cold Fog and Wet Deposition Conditions. IEEE Access 2020, 8, 224588–224595. [Google Scholar] [CrossRef]
  2. Maraaba, L.; Al-Soufi, K.; Ssennoga, T.; Memon, A.M.; Worku, M.Y.; Alhems, L.M. Contamination Level Monitoring Techniques for High-Voltage Insulators: A Review. Energies 2022, 15, 7656. [Google Scholar] [CrossRef]
  3. Yaqoob, D.M.; de Rooij, M.B.; Schipper, D.J. On the transition from bulk to ordered form of water: A theoretical model to calculate adhesion force due to capillary and van der Waals interaction. Tribol. Lett. 2013, 49, 491–499. [Google Scholar] [CrossRef] [Green Version]
  4. Zarate, N.V.; Harrison, A.J.; Litster, J.D.; Beaudoin, S.P. Effect of relative humidity on onset of capillary forces for rough surfaces. J. Colloid Interface Sci. 2013, 411, 265–272. [Google Scholar] [CrossRef]
  5. Luo, X.; Li, Q.; Zhang, Z.; Zhang, J. Research on the underwater noise radiation of high pressure water jet propulsion. Ocean. Eng. 2021, 219, 108438. [Google Scholar] [CrossRef]
  6. Tang, S.; Zhou, P.; Wang, X.; Yu, Y.; Li, H. Design and experiment of dry-ice cleaning mechanical arm for insulators in substation. Appl. Sci. 2020, 10, 2461. [Google Scholar] [CrossRef] [Green Version]
  7. Zhou, W.; Liu, M.; Liu, S.; Peng, M.; Yu, J.; Zhou, C. On the mechanism of insulator cleaning using dry ice. IEEE Trans. Dielectr. Electr. Insul. 2012, 19, 1715–1722. [Google Scholar] [CrossRef]
  8. Liu, Y.-H.; Maruyama, H.; Matsusaka, S. Effect of particle impact on surface cleaning using dry ice jet. Aerosol Sci. Technol. 2011, 45, 1519–1527. [Google Scholar] [CrossRef] [Green Version]
  9. Shin, B.; Choi, D.; Harris, J.S.; McIntyre, P.C. Pre-atomic layer deposition surface cleaning and chemical passivation of (100) In 0.2 Ga 0.8 As and deposition of ultrathin Al2O3 gate insulators. Appl. Phys. Lett. 2008, 93, 052911. [Google Scholar] [CrossRef]
  10. Zhu, G.; Xu, Z.; Jin, Y.; Chen, X.; Yang, L.; Xu, J.; Shan, D.; Chen, Y.; Guo, B. Mechanism and application of laser cleaning: A review. Opt. Lasers Eng. 2022, 157, 107130. [Google Scholar] [CrossRef]
  11. Shi, T.; Wang, C.; Mi, G.; Yan, F. A study of microstructure and mechanical properties of aluminum alloy using laser cleaning. J. Manuf. Process. 2019, 42, 60–66. [Google Scholar] [CrossRef]
  12. Samodurova, M.; Shaburova, N.; Samoilova, O.; Radionova, L.; Zakirov, R.; Pashkeev, K.; Myasoedov, V.; Erdakov, I.; Trofimov, E. A study of characteristics of aluminum bronze coatings applied to steel using additive technologies. Materials 2020, 13, 461. [Google Scholar] [CrossRef] [Green Version]
  13. Zhu, G.; Wang, S.; Cheng, W.; Ren, Y.; Wen, D. Corrosion and wear performance of aircraft skin after laser cleaning. Opt. Laser Technol. 2020, 132, 106475. [Google Scholar] [CrossRef]
  14. Song, M.; Wu, L.; Liu, J.; Hu, Y. Effects of laser cladding on crack resistance improvement for aluminum alloy used in aircraft skin. Opt. Laser Technol. 2021, 133, 106531. [Google Scholar] [CrossRef]
  15. Li, X.; Zhang, Q.; Zhou, X.; Zhu, D.; Liu, Q. The influence of nanosecond laser pulse energy density for paint removal. Optik 2018, 156, 841–846. [Google Scholar] [CrossRef]
  16. Ning, C.; Zhang, G.; Yang, Y.; Zhang, W. Effect of laser shock peening on electrochemical corrosion resistance of IN718 superalloy. Appl. Opt. 2018, 57, 2467–2473. [Google Scholar] [CrossRef]
  17. Shamsujjoha, M.; Agnew, S.R.; Melia, M.A.; Brooks, J.R.; Tyler, T.J.; Fitz-Gerald, J.M. Effects of laser ablation coating removal (LACR) on a steel substrate: Part 1: Surface profile, microstructure, hardness, and adhesion. Surf. Coat. Technol. 2015, 281, 193–205. [Google Scholar] [CrossRef]
  18. Liu, B.; Mi, G.; Wang, C. Modification of TA15 alloy surface by high-pulse-frequency laser cleaning. J. Laser Appl. 2020, 32, 032019. [Google Scholar] [CrossRef]
  19. Ma, Z.; Li, X.; Tian, J.; Wei, C.; Zhou, W.; Wang, A. Temperature Field Distribution Characteristics of Ceramic Insulator during Laser Cleaning. In Proceedings of the 2021 3rd Asia Energy and Electrical Engineering Symposium (AEEES), Chengdu, China, 26–29 March 2021; pp. 179–183. [Google Scholar]
  20. Tian, J.; Li, X.; Tang, Z.; Wu, C.; Zhou, W.; Wang, A. Numerical Analysis on Surface Temperature of Polluted Porcelain Insulator by Laser Cleaning. In Proceedings of the 2020 5th Asia Conference on Power and Electrical Engineering (ACPEE), Chengdu, China, 4–7 June 2020; pp. 2154–2158. [Google Scholar]
  21. Ren, N.; Jiang, L.; Liu, D.; Lv, L.; Wang, Q. Comparison of the simulation and experimental of hole characteristics during nanosecond-pulsed laser drilling of thin titanium sheets. Int. J. Adv. Manuf. Technol. 2015, 76, 735–743. [Google Scholar] [CrossRef]
  22. Chen, G.; Liao, R. Study on dynamic characteristics of the temperature and stress field in induction and laser heating for the semi-infinite body. J. Therm. Stress. 2018, 41, 469–482. [Google Scholar] [CrossRef]
  23. Banik, A.; Mukherjee, A.; Dalai, S. Development of a pollution flashover model for 11 kV porcelain and silicon rubber insulator by using COMSOL multiphysics. Electr. Eng. 2018, 100, 533–541. [Google Scholar] [CrossRef]
Figure 1. Laser ablation mechanism.
Photonics 10 00269 g001
Figure 2. Laser scanning cleaning.
Photonics 10 00269 g002
Figure 3. (a) X-axis temperature distribution of the porcelain insulator surface under different powers; (b) Temperature variation of the insulator surface center point under different powers.
Photonics 10 00269 g003
Figure 4. Maximum temperature change in the insulator surface at different scanning speeds.
Photonics 10 00269 g004
Figure 5. Temperature distribution of water film working conditions at different heights.
Photonics 10 00269 g005
Figure 6. (a) Laser cleaning device; (b) Test samples; (c) Sample before laser irradiation.
Photonics 10 00269 g006
Figure 7. Cleaning effect and Infrared temperature distribution with different powers: (a) 25 W; (b) 28 W; (c) 30 W; (d) 35 W; (e) 25 W; (f) 28 W; (g) 30 W; (h) 35 W.
Photonics 10 00269 g007aPhotonics 10 00269 g007b
Figure 8. Binarized images with 28 W.
Photonics 10 00269 g008
Figure 9. Relationship between cleaning efficiency and laser power.
Photonics 10 00269 g009
Figure 10. Cleaning effect and Infrared temperature distribution with different scanning speeds: (a) 1000 mm/s; (b) 1500 mm/s; (c) 2000 mm/s; (d) 2500 mm/s; (e) 1000 mm/s; (f) 1500 mm/s; (g) 2000 mm/s; (h) 2500 mm/s.
Photonics 10 00269 g010
Figure 11. Binarized images with different scanning speeds: (a) 2500 mm/s; (b) 2000 mm/s.
Photonics 10 00269 g011
Figure 12. Relationship between the cleaning efficiency and scanning speed.
Photonics 10 00269 g012
Figure 13. Cleaning effect of samples with different water contents observed by a metallographic microscope: (a) 0.021 g; (b) 0.093 g; (c) 0.115 g; (d) 0.216 g.
Photonics 10 00269 g013
Figure 14. Binarized images with different water contents: (a) 0.021 g; (b) 0.216 g.
Photonics 10 00269 g014
Figure 15. Relationship between cleaning efficiency and water content.
Photonics 10 00269 g015
Table 1. Material parameters.
ParametersAlumina PorcelainContamination
Density (kg·m−3)35002490
Specific heat capacity (J·(kg·K)−1)942900
Thermal conductivity (W·(m·K)−1)15.413.34
Linear expansion coefficient (K−1)7.3 × 10−68.0 × 10−6
Poisson’s ratio0.200.20
Disclaimer/Publisher’s Note: The statements, opinions and data contained in all publications are solely those of the individual author(s) and contributor(s) and not of MDPI and/or the editor(s). MDPI and/or the editor(s) disclaim responsibility for any injury to people or property resulting from any ideas, methods, instructions or products referred to in the content.

