
Evolutionary Selection of a Set of Association Rules Considering Biological Constraints Describing the Prevalent Elements in Bacterial Vaginosis

 , ,
, ,  ,
,  and
and
Abstract
:1. Introduction
2. Materials and Methods
- Support: It is the number of times the element appears.
- Confidence: It is based on the support of frequent itemsets to generate significant rules according to the value of the confidence that one wants to look for.
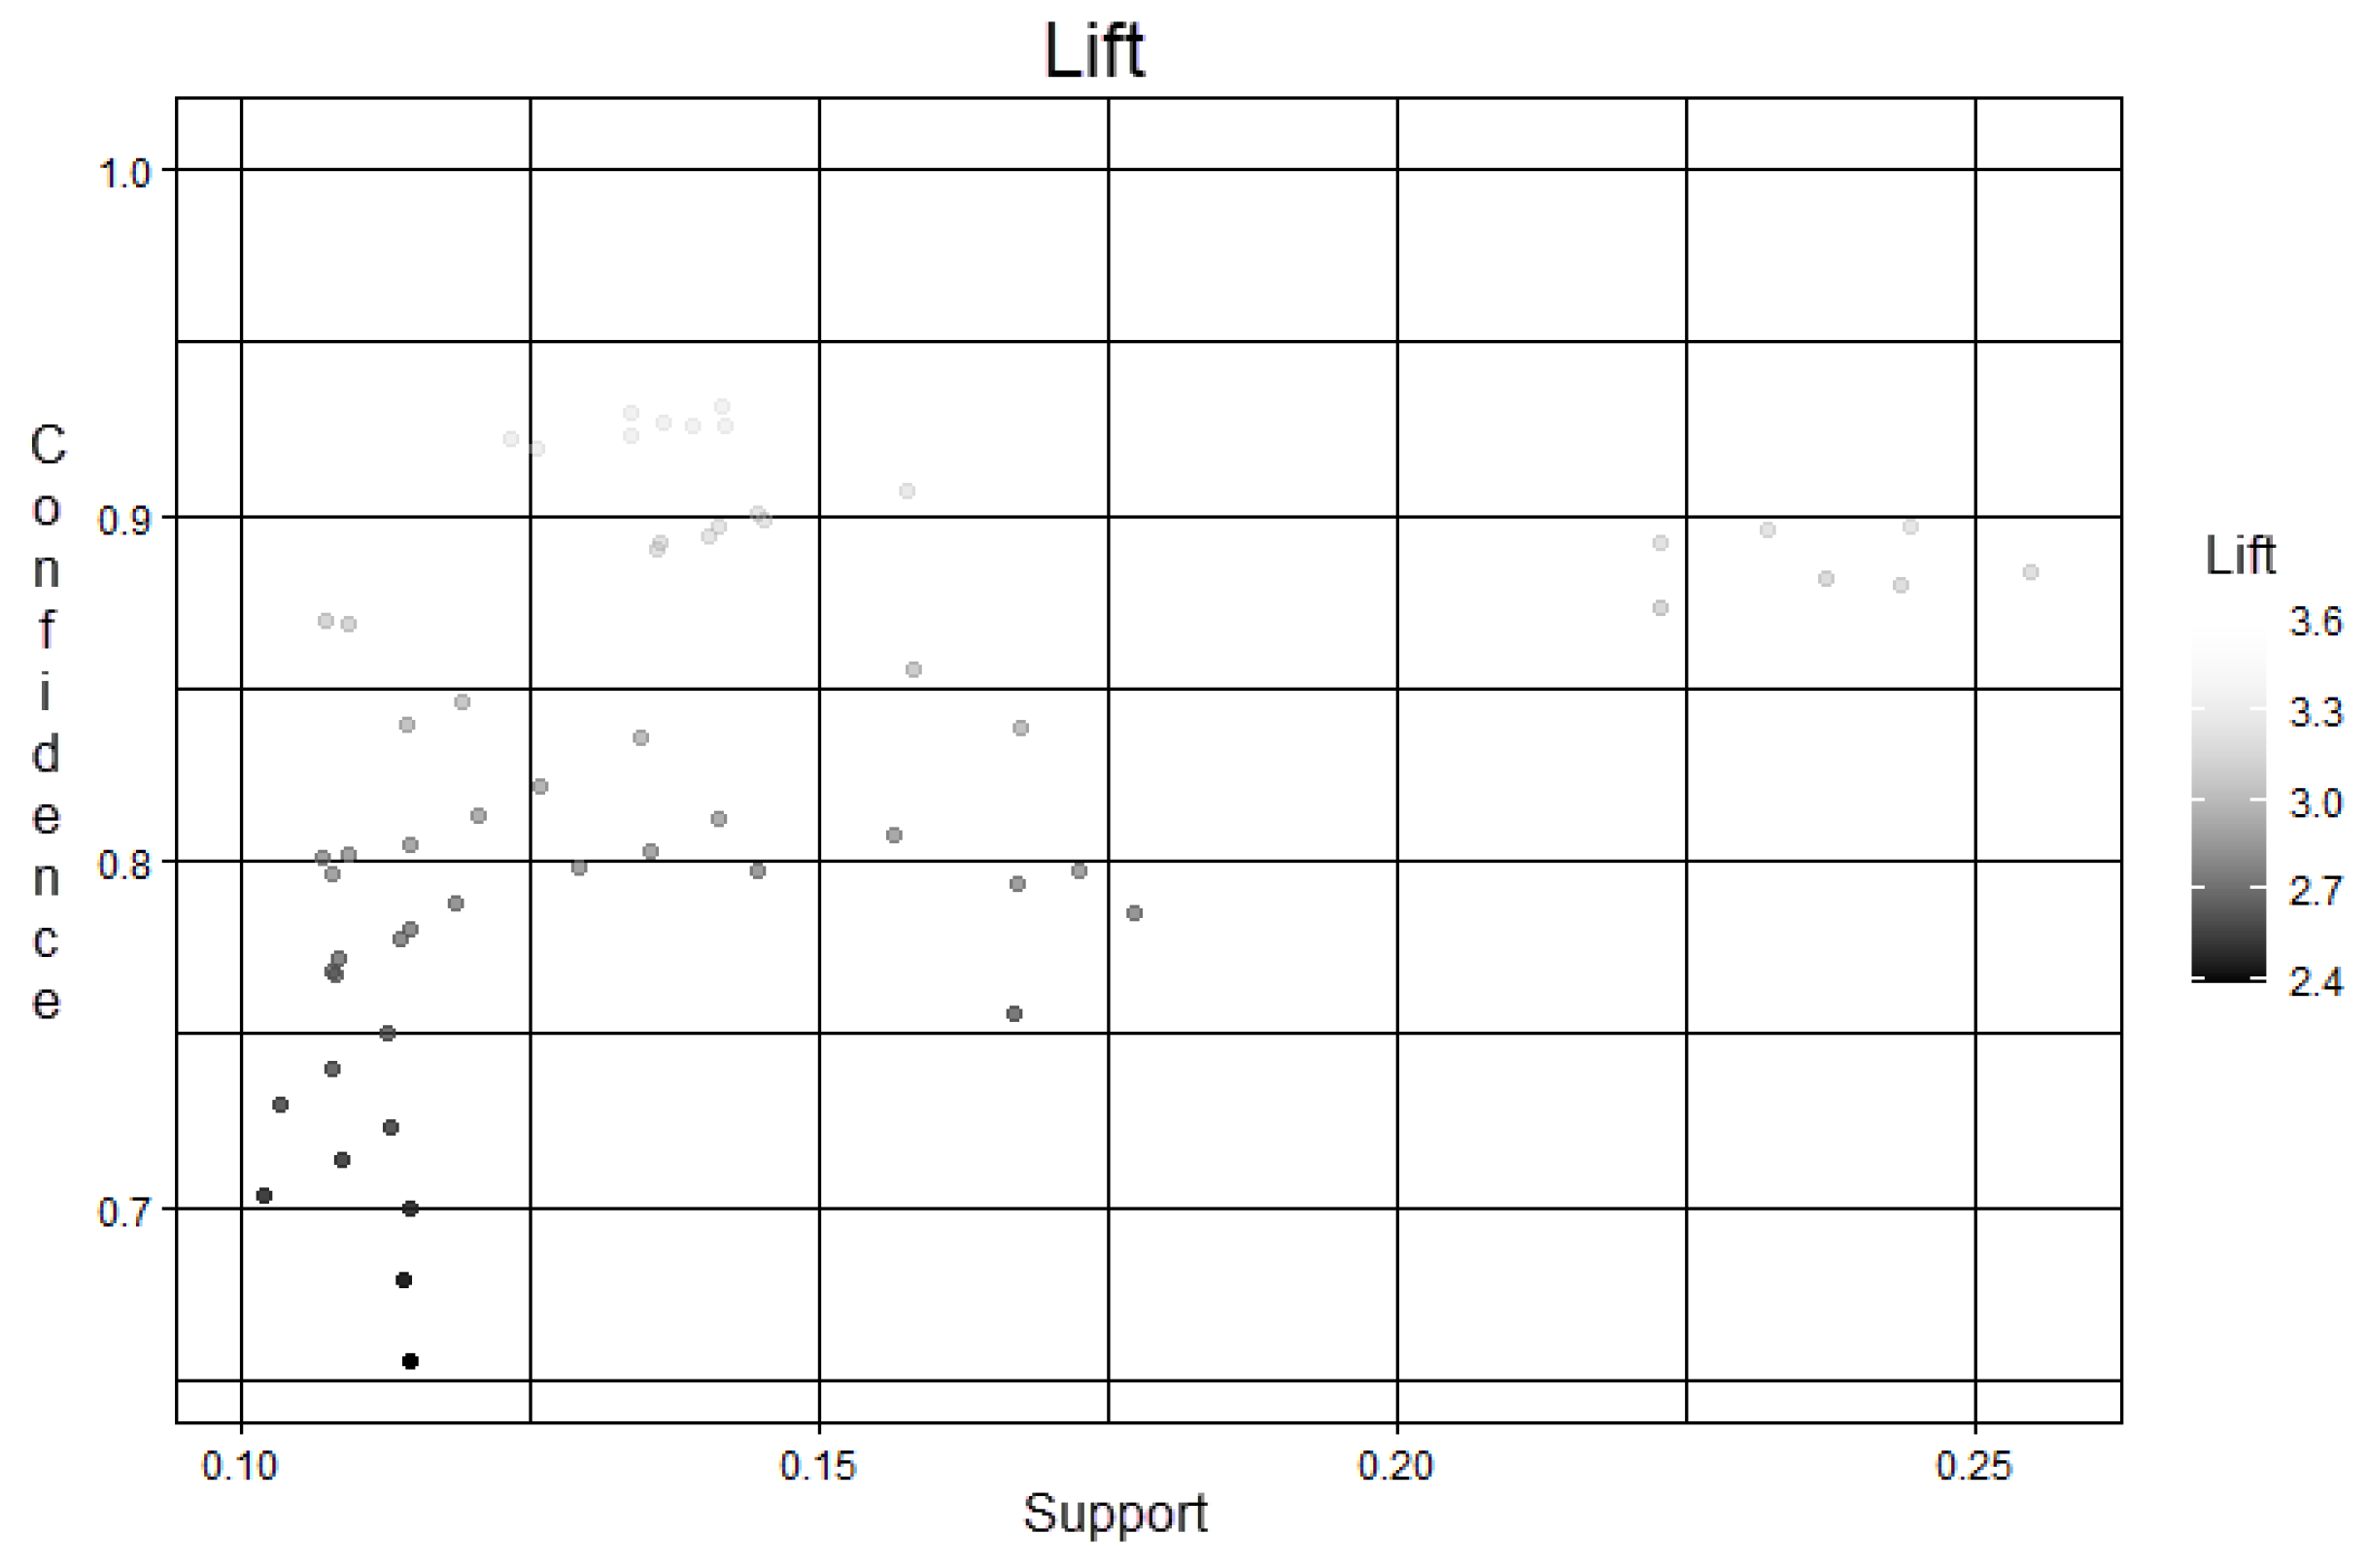
- Lift: Calculate the number of times the antecedent and consequent occur together.
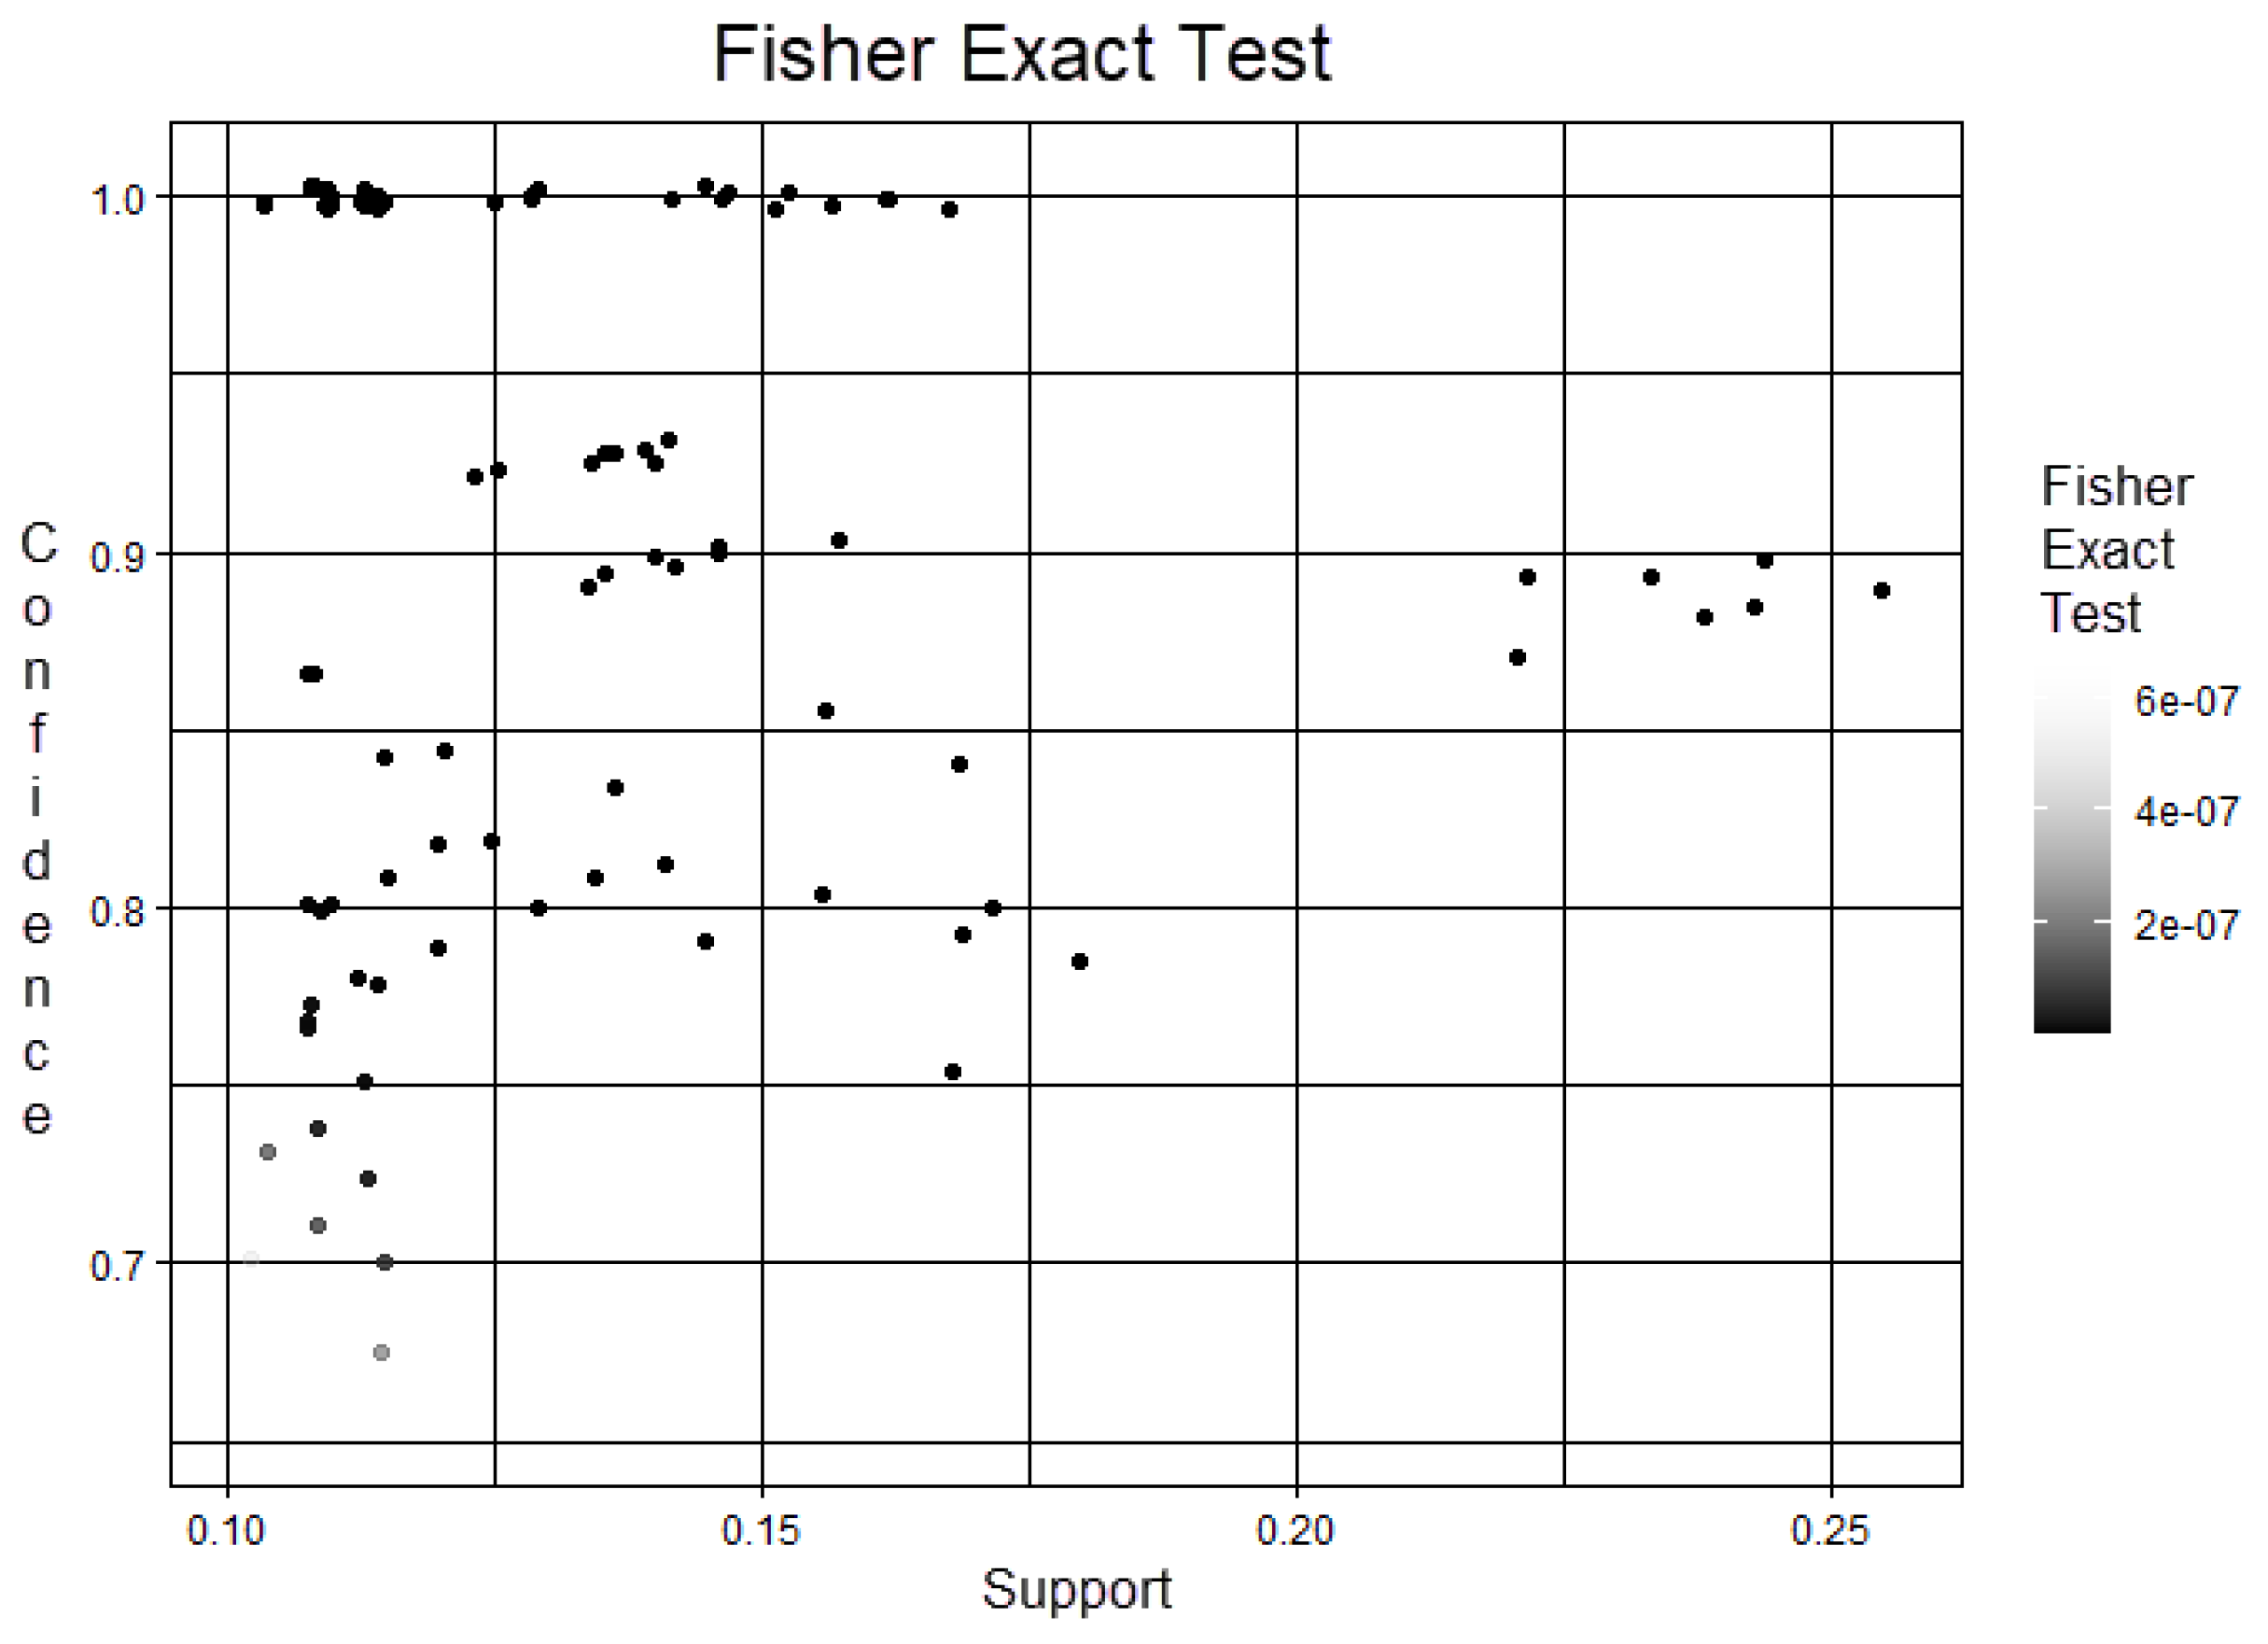
- Fisher Exact Test: Each rule represents a one-sided Fisher’s exact statistical test and the correction is used for multiple comparisons.
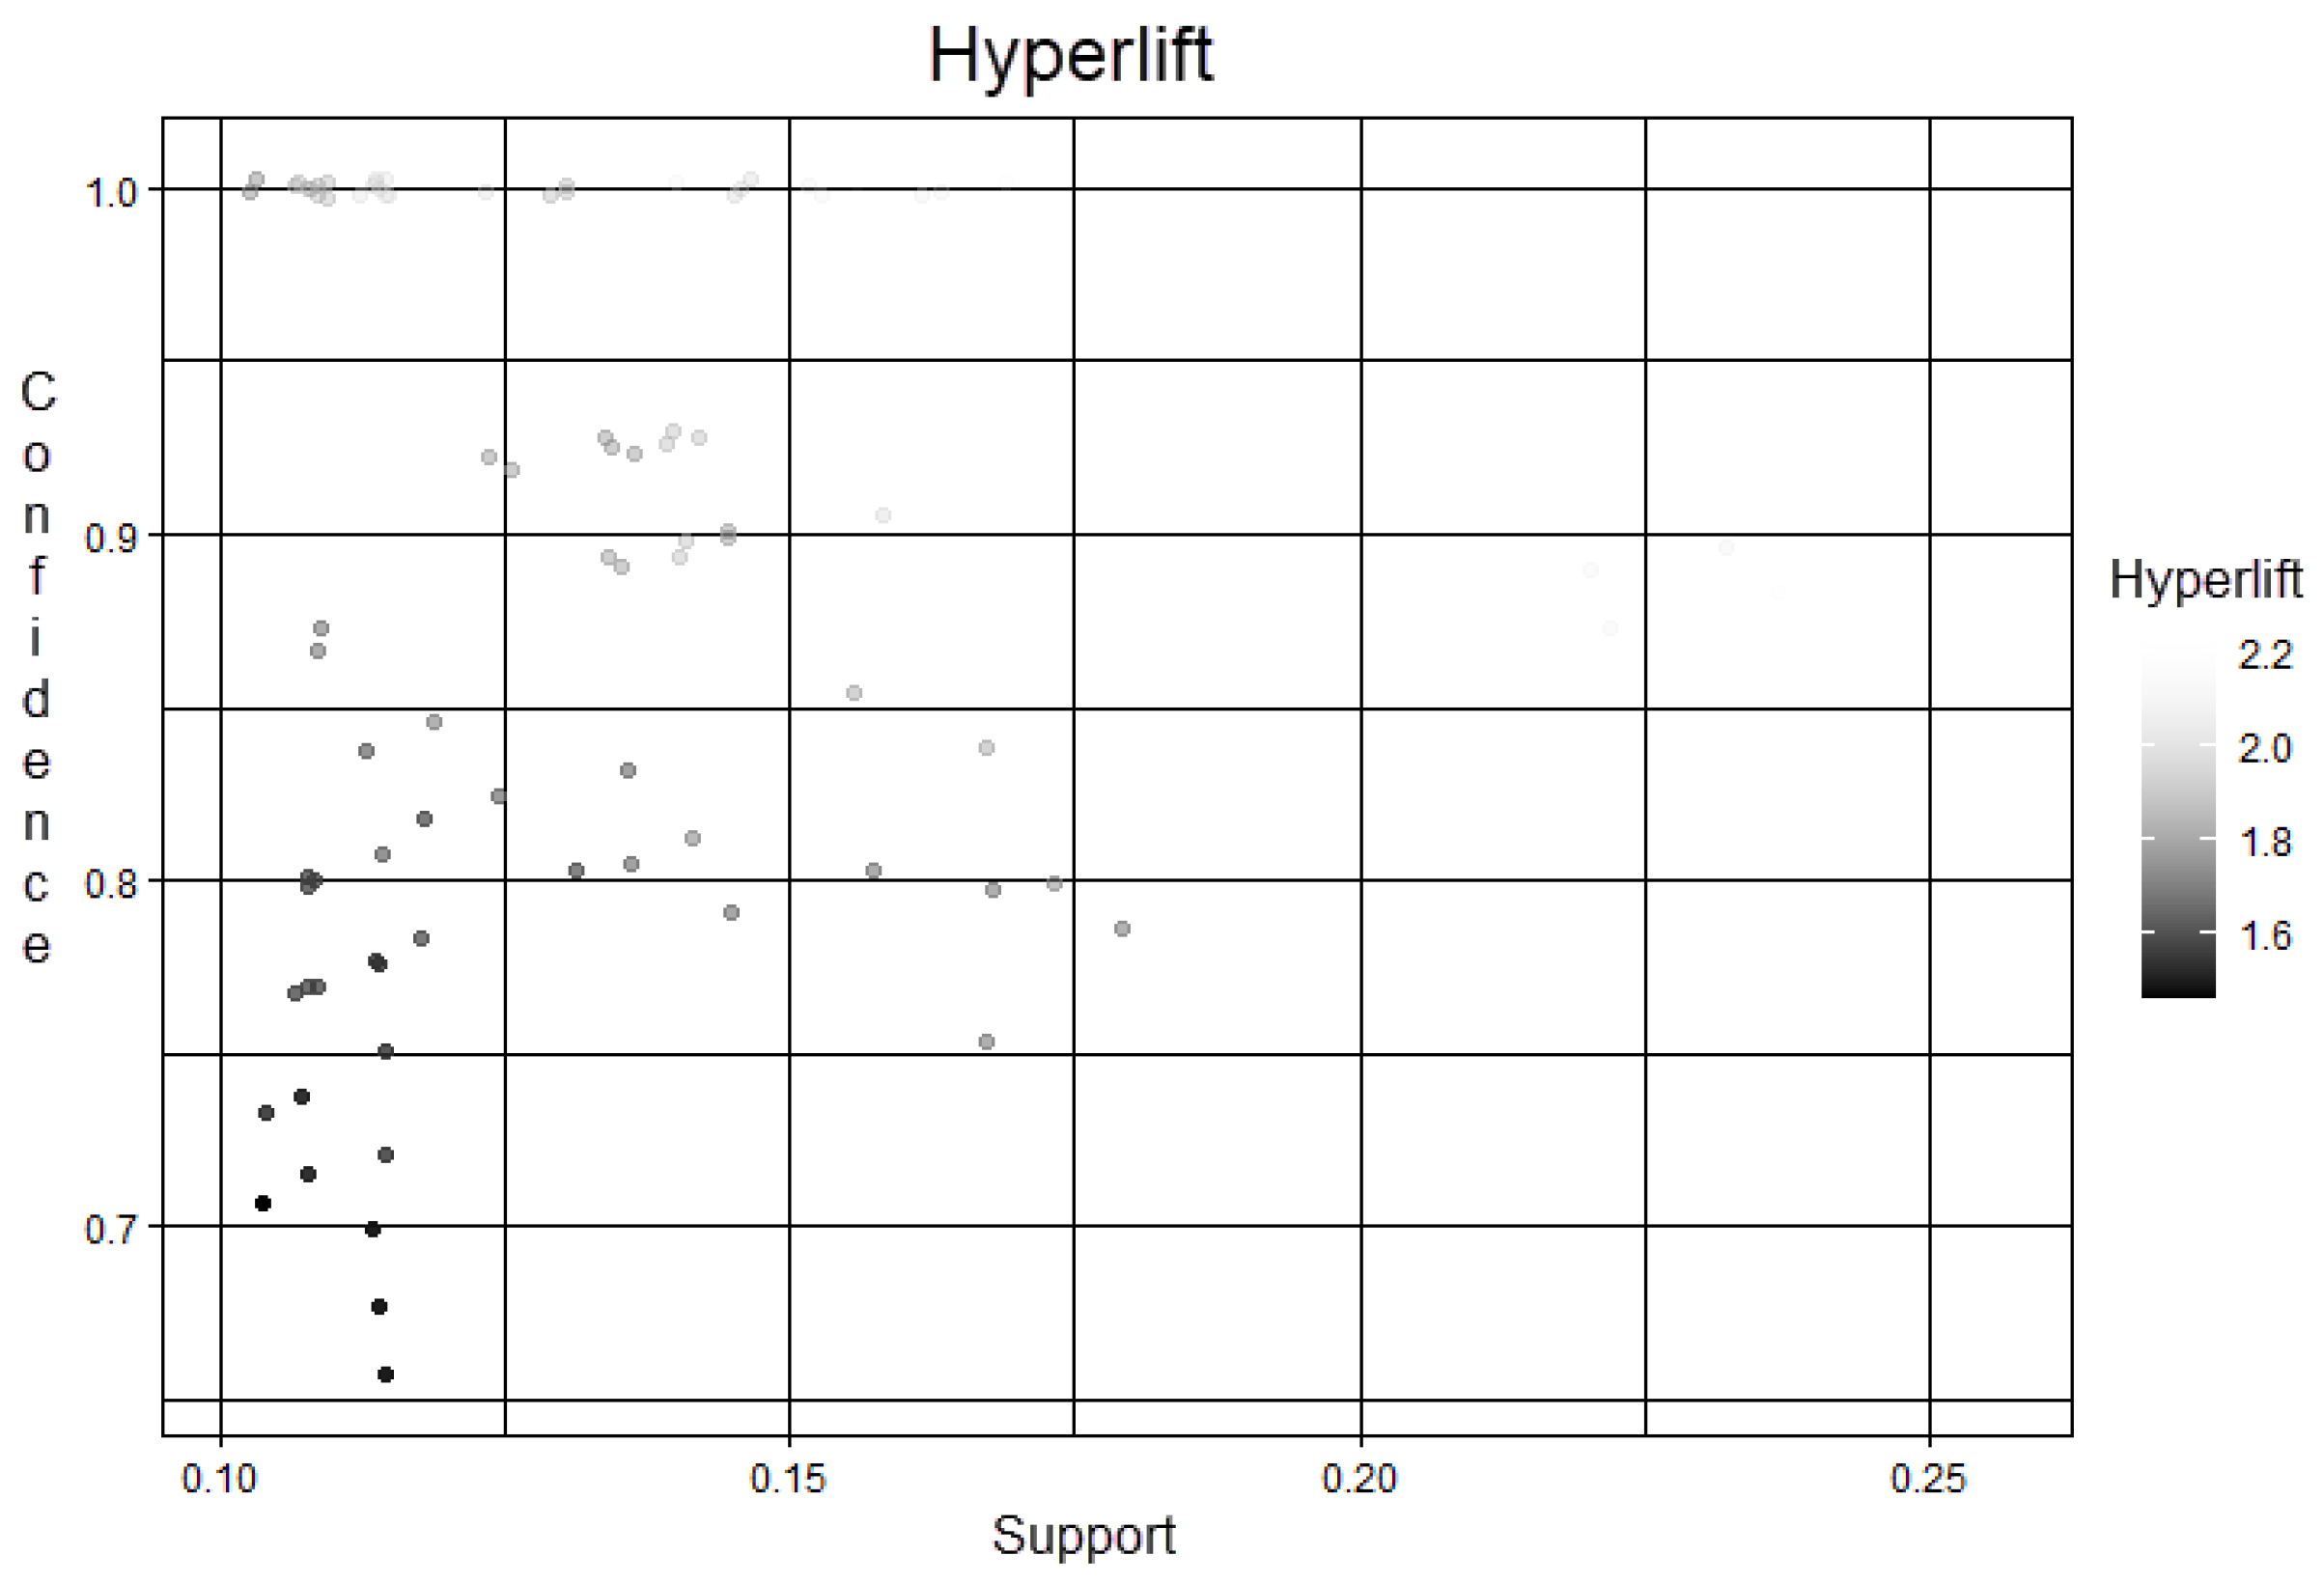
- Hyperlift: It is a more robust metric than the lift metric. It is used at low counts and its false positives are less frequent.
| Algorithm 1 Apriori pseudocode |
|
| Algorithm 2 DE/rand/1/bin pseudocode |
|
| Algorithm 3 DE/best/1/bin pseudocode |
|
3. Results
3.1. Experimental Study
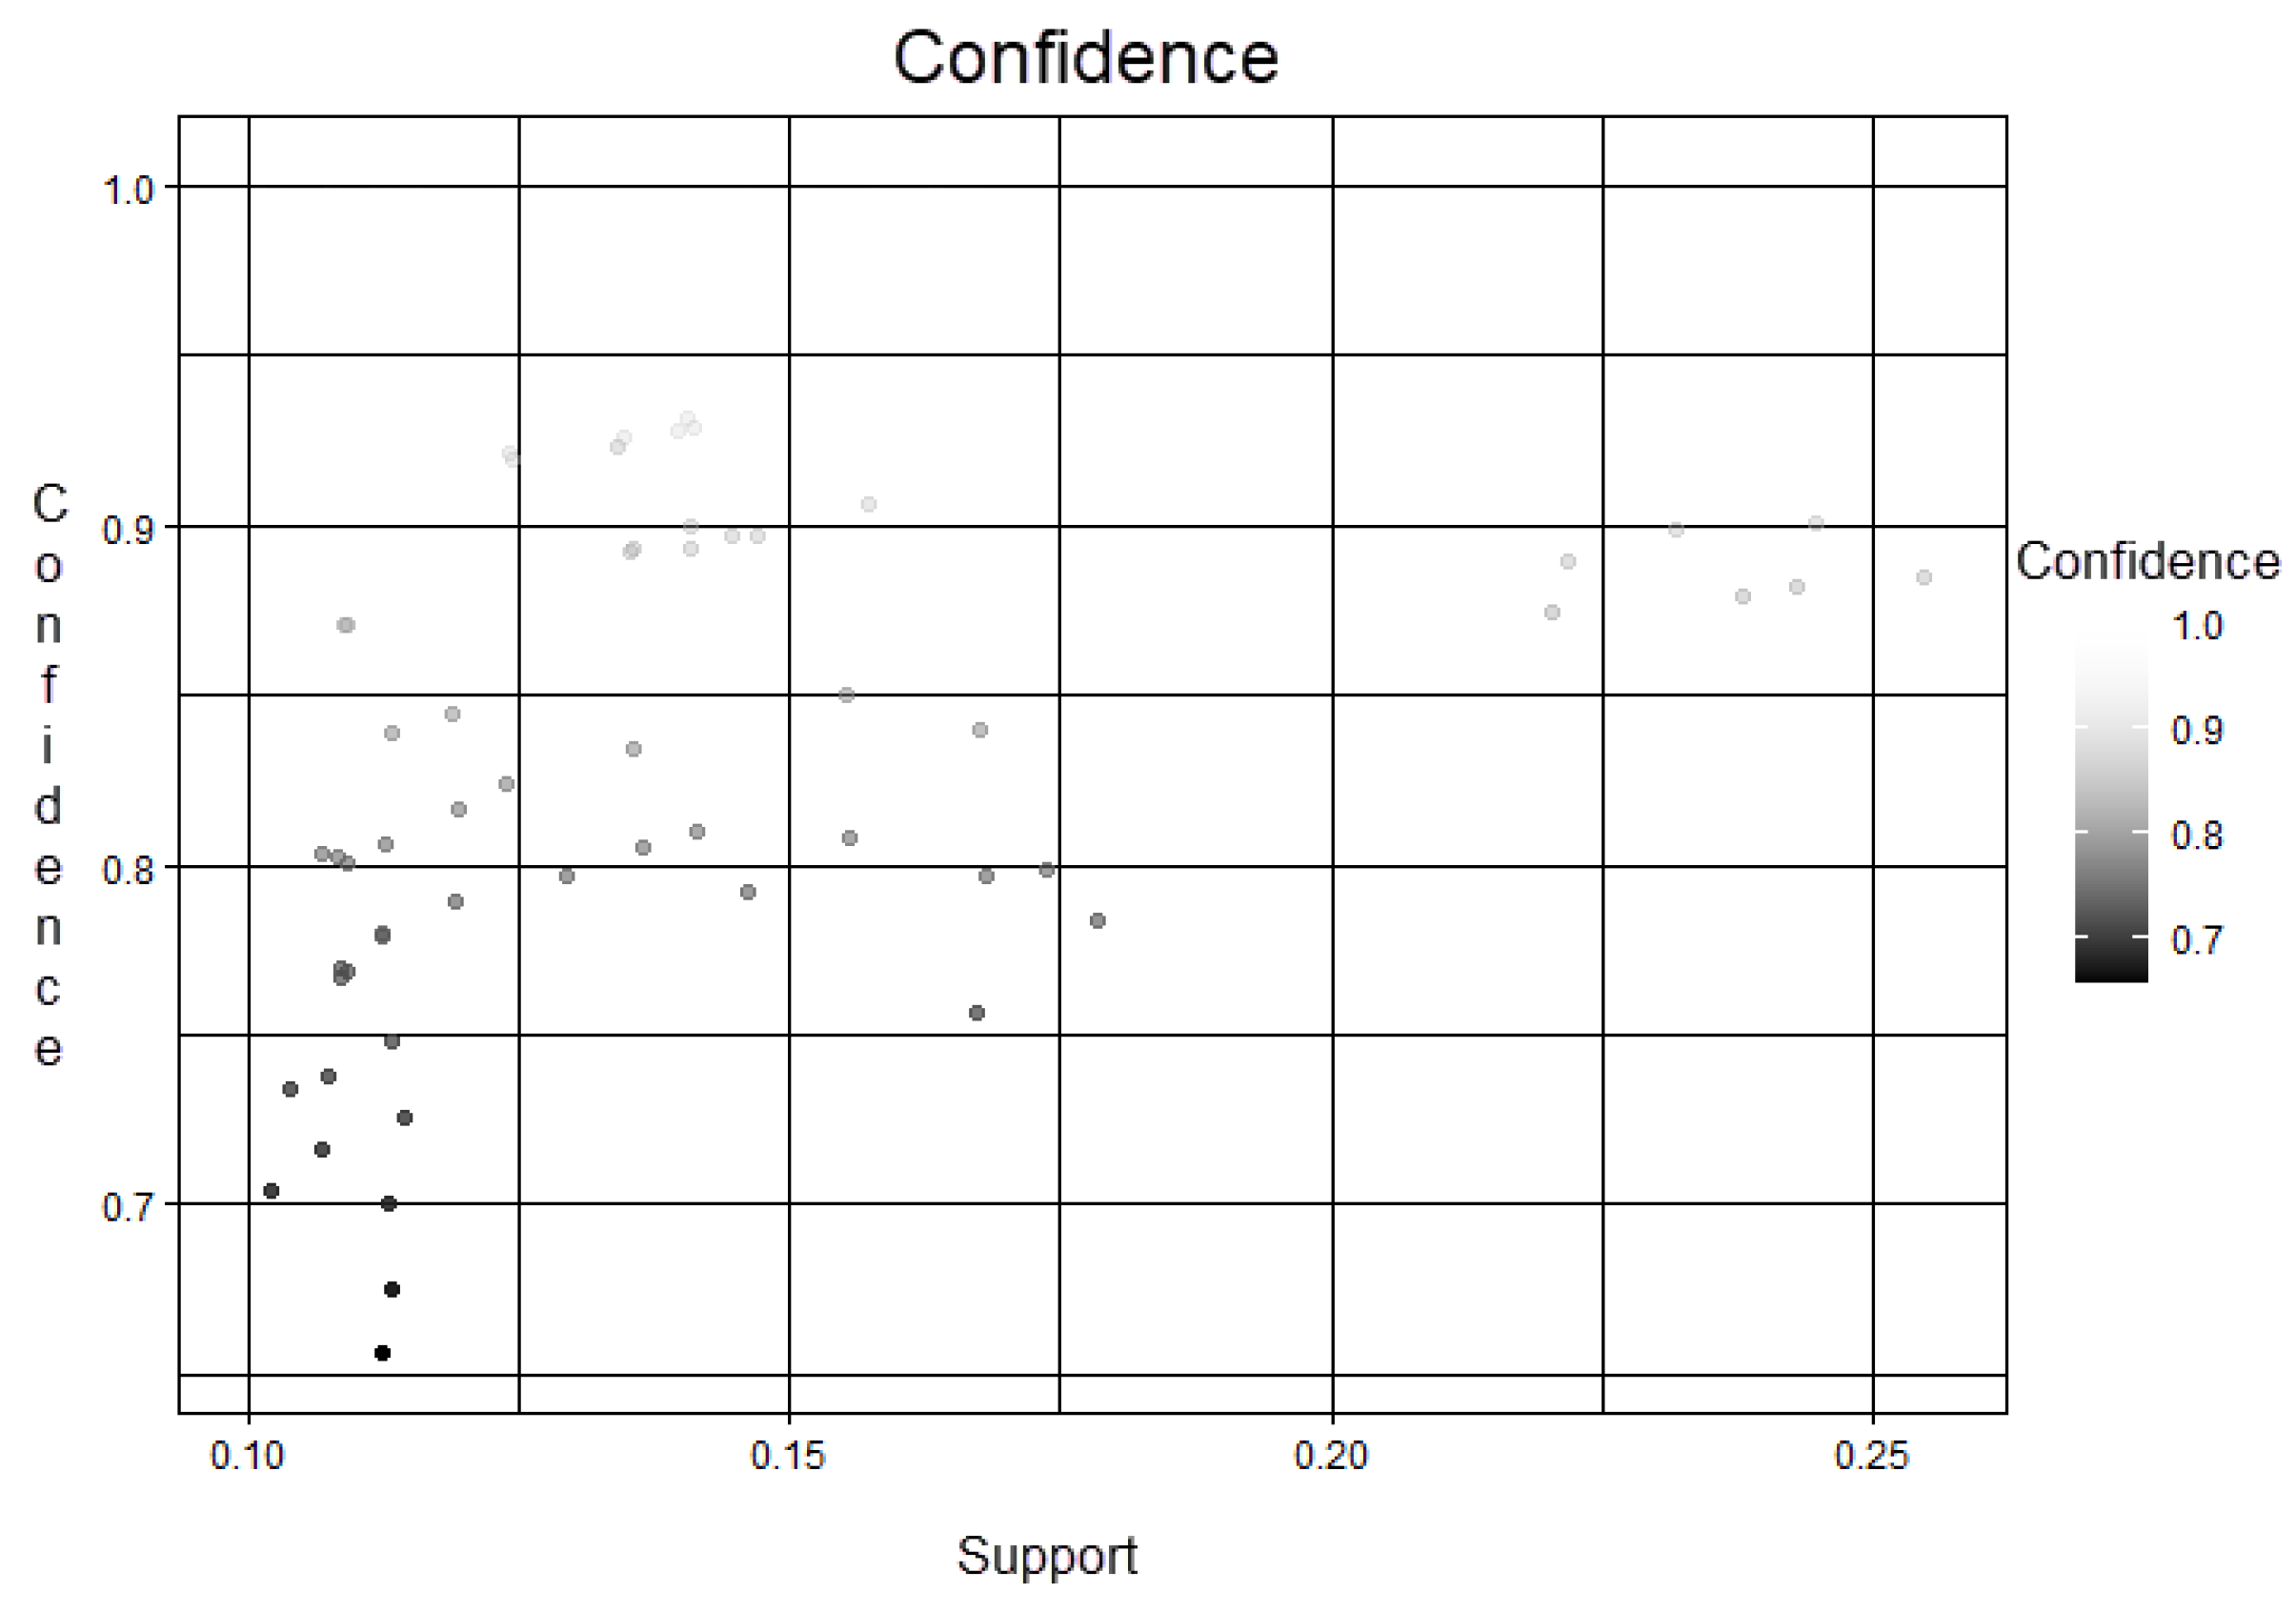
3.2. Analysis of Evaluation Metrics
3.3. Implementation of the Differential Evolution (DE) Algorithm
- 1.
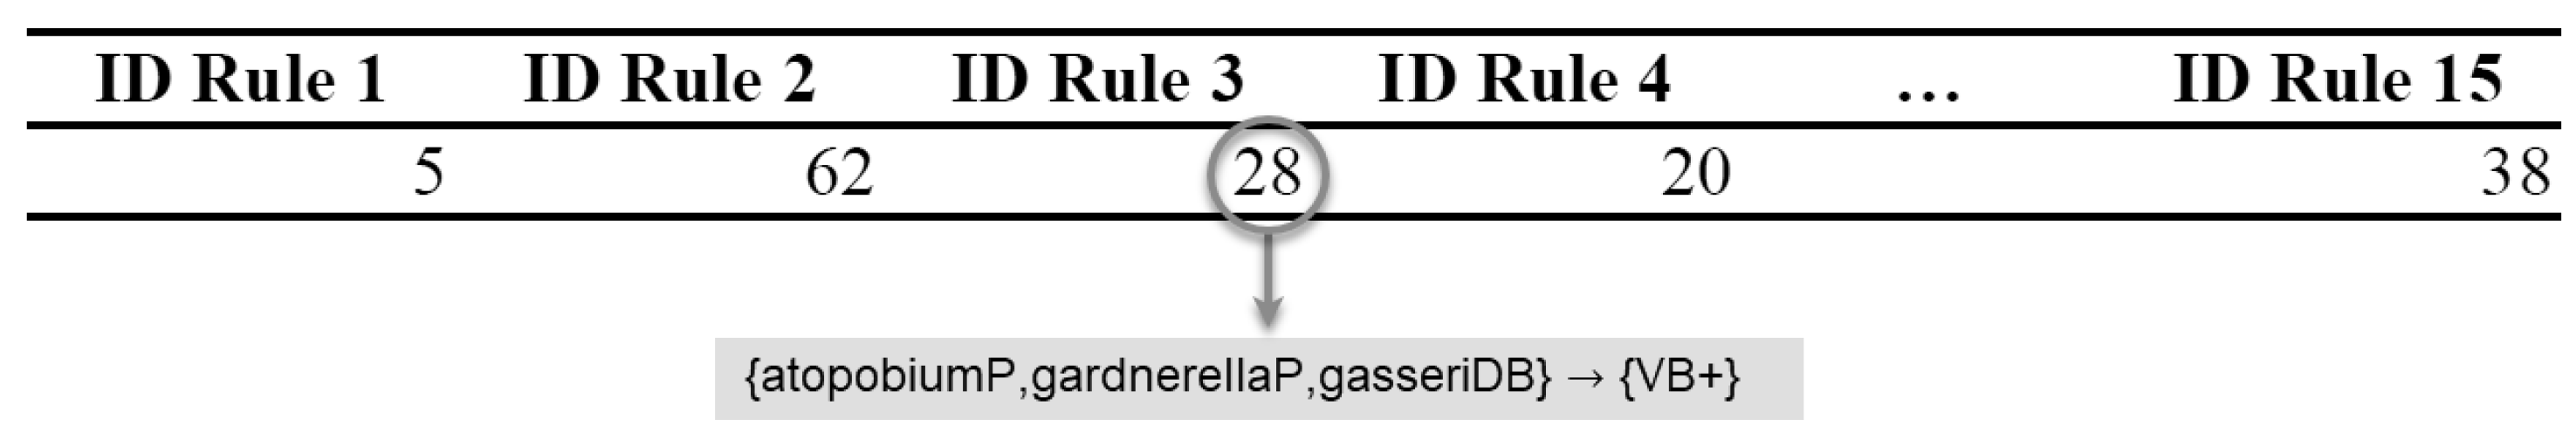
- Encoding scheme: An individual of the population is a subset of R association rules each identified with an ID number. Figure 1 shows an example of this codification from 1 at 15 rules by ID rule.In this work, the value of R is set to 1 to 15 since in [18] authors obtained five rules with a biological significance which were determined by a human expert, so the 15 tests ensure the algorithm will find this minimal set of rules.
- 2.
- Fitness function: Each j-th individual in the population is evaluated to define the fitness value. In this work, the fitness function is the sum of the S metrics of the association rules encoded on the individual as follows:where R is the number of association rules, S is the number of metrics involved to define the solution quality, and is the w-th metric computed for the u-th rule.Since metrics are parameters that allow us to know the quality of attributes quantitatively, support and confidence are normally used [23]. The metrics used in the objective function and described in Section 2 are support, confidence, and lift. In addition, the frequency of positive bacteria in the rules, and the occurrences of high values of lactobacillus iners are included to define the biological significance of the association rules [13] in this sense higher results from the addition of the metrics have a higher significance.
- 3.
- Variation operators: Differential mutation and crossover operators are defined to create feasible offspring.
- Mutation: Three randomly chosen individuals of the current population (, and ), are different from each other and also different from the target vector, these individuals are linearly combined to yield a mutated vector using a user-specified scale factor F to control the differential variation, as follows:
- Crossover: The mutated vector is recombined with the target vector to build the trial vector . For each , either or is selected based on a comparison between a uniformly distributed random number and the crossover rate . The recombination operator also uses a randomly chosen index to ensure that acquires at least one value from , as follows:
3.4. Algorithm Parameters
4. Discussion
5. Conclusions
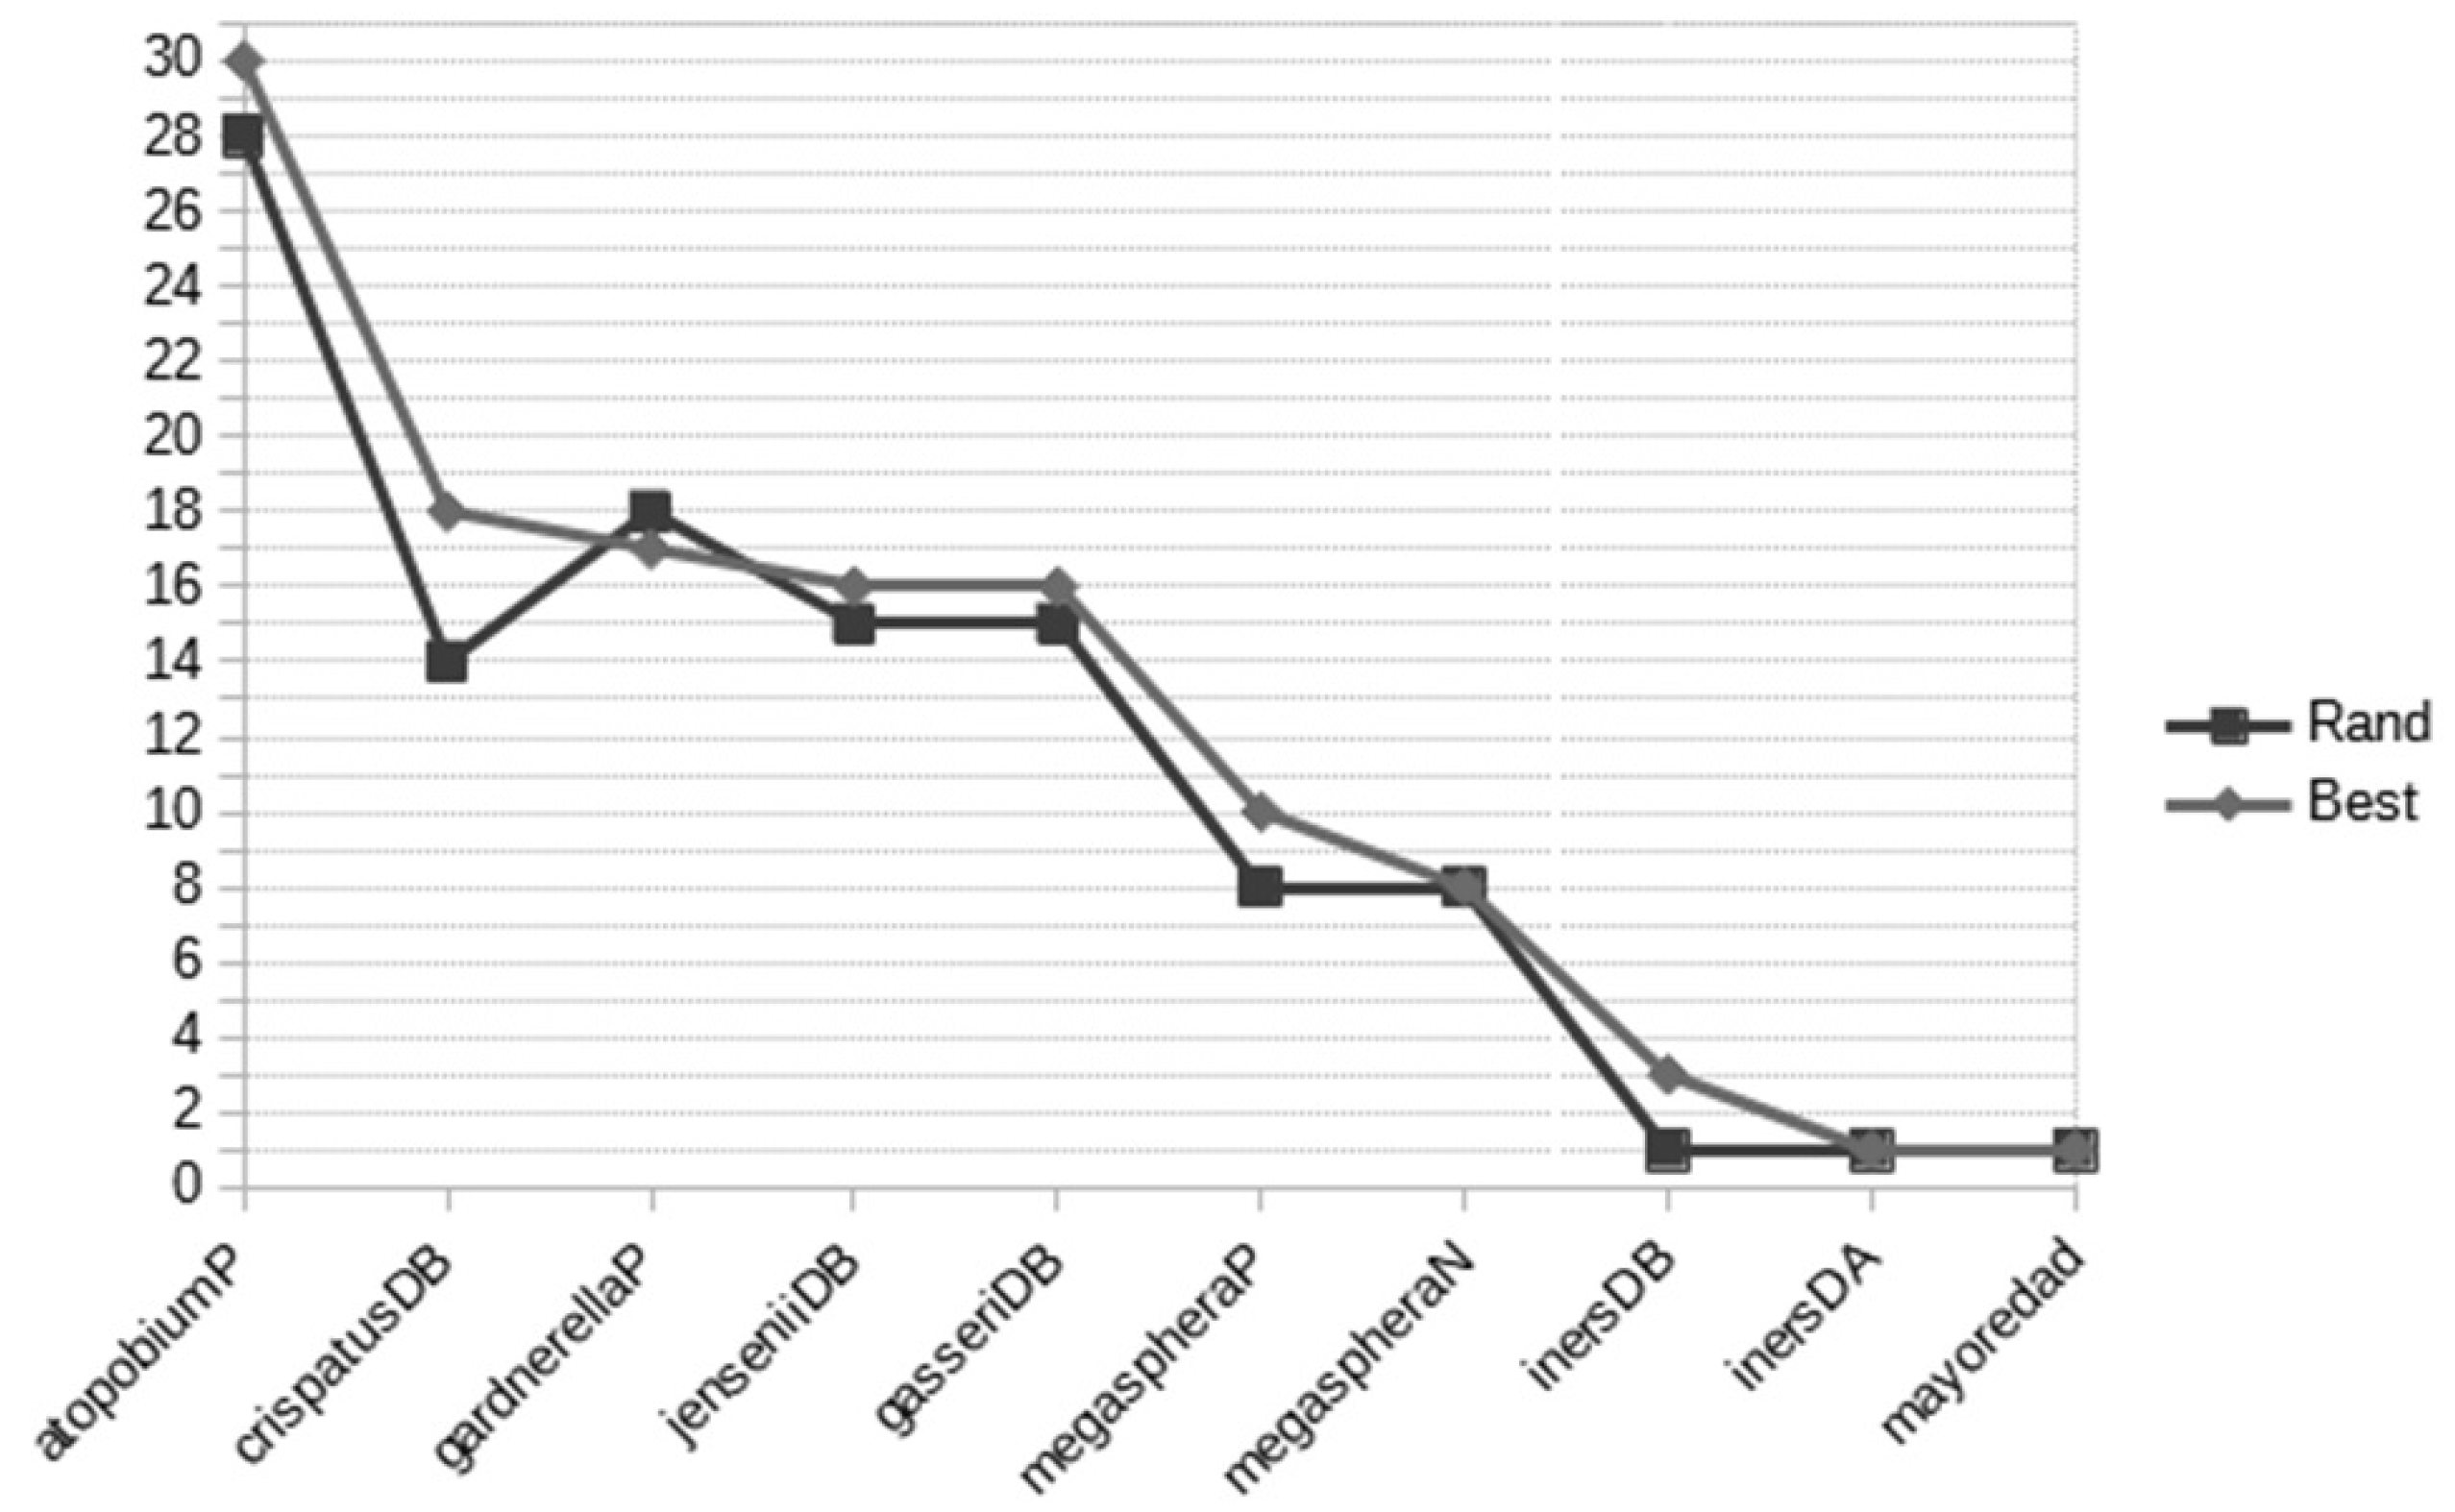
- {jenseniiDB,megasphaeraP} → {VB+}
- {gardnerellaP,gasseriDB} → {VB+}
- {atopobiumP,crispatusDB} → {VB+}
Author Contributions
Funding
Data Availability Statement
Acknowledgments
Conflicts of Interest
Abbreviations
| ARM | Association Rule Mining |
| DE | Differential Evolution |
| BV+ | Bacterial Vaginosis Positive |
References
- Noormohammadi, M.; Eslamian, G.; Kazemi, S.N.; Rashidkhani, B. Association between dietary patterns and bacterial vaginosis: A case–control study. Sci. Rep. 2022, 12, 12199. [Google Scholar] [CrossRef] [PubMed]
- Coudray, M.S.; Madhivanan, P. Bacterial vaginosis—A brief synopsis of the literature. Eur. J. Obstet. Gynecol. Reprod. Biol. 2020, 245, 143–148. [Google Scholar] [CrossRef] [PubMed]
- Onywera, H.; Anejo-Okopi, J.; Mwapagha, L.M.; Okendo, J.; Williamson, A.L. Predictive functional analysis reveals inferred features unique to cervicovaginal microbiota of African women with bacterial vaginosis and high-risk human papillomavirus infection. PLoS ONE 2021, 16, e0253218. [Google Scholar] [CrossRef] [PubMed]
- Xu, X.; Zhang, Y.; Yu, L.; Shi, X.; Min, M.; Xiong, L.; Pan, J.; Liu, P.; Wu, G.; Gao, G. A cross-sectional analysis about bacterial vaginosis, high-risk human papillomavirus infection, and cervical intraepithelial neoplasia in Chinese women. Sci. Rep. 2022, 12, 6609. [Google Scholar] [CrossRef] [PubMed]
- Abou Chacra, L.; Fenollar, F.; Diop, K. Bacterial vaginosis: What do we currently know? Front. Cell. Infect. Microbiol. 2022, 11, 1393. [Google Scholar] [CrossRef] [PubMed]
- Dhaenens, C.; Jourdan, L. Metaheuristics for data mining: Survey and opportunities for big data. Ann. Oper. Res. 2022, 314, 117–140. [Google Scholar] [CrossRef]
- Telikani, A.; Gandomi, A.H.; Shahbahrami, A. A survey of evolutionary computation for association rule mining. Inf. Sci. 2020, 524, 318–352. [Google Scholar] [CrossRef]
- Varol Altay, E.; Alatas, B. Performance analysis of multi-objective artificial intelligence optimization algorithms in numerical association rule mining. J. Ambient Intell. Humaniz. Comput. 2020, 11, 3449–3469. [Google Scholar] [CrossRef]
- Fister, I.; Iglesias, A.; Galvez, A.; Del Ser, J.; Osaba, E.; Fister, I. Differential evolution for association rule mining using categorical and numerical attributes. In Proceedings of the 19th International Conference on Intelligent Data Engineering and Automated Learning (IDEAL 2018), Madrid, Spain, 21–23 November 2018; Springer: Berlin/Heidelberg, Germany, 2018; pp. 79–88. [Google Scholar]
- Stupan, Ž.; Fister, I. NiaARM: A minimalistic framework for Numerical Association Rule Mining. J. Open Source Softw. 2022, 7, 4448. [Google Scholar] [CrossRef]
- Zhang, A.; Shi, W. Mining significant fuzzy association rules with differential evolution algorithm. Appl. Soft Comput. 2020, 97, 105518. [Google Scholar] [CrossRef]
- SuryaNarayana, G.; Kolli, K.; Ansari, M.D.; Gunjan, V.K. A traditional analysis for efficient data mining with integrated association mining into regression techniques. In Proceedings of the 3rd International Conference on Communications and Cyber Physical Engineering (ICCCE 2020); Springer: Berlin/Heidelberg, Germany, 2021; pp. 1393–1404. [Google Scholar]
- Sanchez-Garcia, E.K.; Contreras-Paredes, A.; Martinez-Abundis, E.; Garcia-Chan, D.; Lizano, M.; de la Cruz Hernandez, E. Molecular epidemiology of bacterial vaginosis and its association with genital micro-organisms in asymptomatic women. J. Med. Microbiol. 2019, 68, 1373–1382. [Google Scholar] [CrossRef] [PubMed]
- Lin, H.K.; Hsieh, C.H.; Wei, N.C.; Peng, Y.C. Association rules mining in R for product performance management in industry 4.0. Procedia CIRP 2019, 83, 699–704. [Google Scholar] [CrossRef]
- Agrawal, R.; Srikant, R. Fast algorithms for mining association rules. In Proceedings of the 20th International Conference on Very Large Data Bases (VLDB 1994), Santiago, Chile, 12–15 September 1994; Volume 1215, pp. 487–499. [Google Scholar]
- Shigetoh, H.; Nishi, Y.; Osumi, M.; Morioka, S. Combined abnormal muscle activity and pain-related factors affect disability in patients with chronic low back pain: An association rule analysis. PLoS ONE 2020, 15, e0244111. [Google Scholar] [CrossRef] [PubMed]
- Olow, A.K.; van’t Veer, L.; Wolf, D.M. Toward developing a metastatic breast cancer treatment strategy that incorporates history of response to previous treatments. BMC Cancer 2021, 21, 212. [Google Scholar] [CrossRef] [PubMed]
- de la Cruz Ruiz, F.; Canul-Reich, J. Reglas de asociación para el estudio de la vaginosis bacteriana. Komputer Sapiens 2022, II, 26–30. [Google Scholar]
- Hahsler, M. A Probabilistic Comparison of Commonly Used Interest Measures for Association Rules. Available online: https://mhahsler.github.io/arules/docs/measures (accessed on 15 March 2023).
- Aggarwal, C.C.; Bhuiyan, M.A.; Hasan, M.A. Frequent Pattern Mining Algorithms: A Survey; Springer: Berlin/Heidelberg, Germany, 2014. [Google Scholar]
- Storn, R.; Price, K. Differential Evolution—A Simple and Efficient Heuristic for Global Optimization over Continuous Spaces. J. Glob. Optim. 1997, 11, 341–359. [Google Scholar] [CrossRef]
- Mezura-Montes, E.; Miranda-Varela, M.E.; del Carmen Gómez-Ramón, R. Differential evolution in constrained numerical optimization: An empirical study. Inf. Sci. 2010, 180, 4223–4262. [Google Scholar] [CrossRef]
- Bramer, M. Principles of Data Mining; Springer: Berlin/Heidelberg, Germany, 2007; Volume 180, pp. 205–209. [Google Scholar]
- Price, K.; Storn, R.M.; Lampinen, J.A. Differential Evolution: A Practical Approach to Global Optimization; Springer: Berlin/Heidelberg, Germany, 2006. [Google Scholar] [CrossRef]
- Das, S.; Suganthan, P.N. Differential Evolution: A Survey of the State-of-the-Art. IEEE Trans. Evol. Comput. 2011, 15, 4–31. [Google Scholar] [CrossRef]
- Zariffard, M.R.; Saifuddin, M.; Sha, B.E.; Spear, G.T. Detection of bacterial vaginosis-related organisms by real-time PCR for Lactobacilli, Gardnerella vaginalis and Mycoplasma hominis. FEMS Immunol. Med. Microbiol. 2002, 34, 277–281. [Google Scholar] [CrossRef] [PubMed] [Green Version]


| Antecedent | Range | Classification | Type |
|---|---|---|---|
| Age | 1 | menoredad | Under 30 years old |
| 2 | mayoredad | Over 30 years old | |
| Cristpatus | 1 | crispatusDB | Low density |
| 2 | crispatusDA | High density | |
| Gasseri | 1 | gasseriDB | Low density |
| 2 | gasseriDA | High density | |
| Iners | 1 | inersDB | Low density |
| 2 | inersDA | High density | |
| Jensenii | 1 | jenseniDB | Low density |
| 2 | jenseniDA | High density | |
| Megasphaera | 1 | megasphaeraP | Positive |
| 2 | megasphaeraN | Negative | |
| Atopobium | 1 | atopobiumP | Positive |
| 2 | atopobiumN | Negative | |
| Gardnerella | 1 | gardnerellaP | Positive |
| 2 | gardnerellaN | Negative |
| Parameter | Value |
|---|---|
| F (Scale factor) | 0.7 |
| (Crossover rate) | 0.5 |
| (Population size) | 30 |
| MAXGEN (Number of generations) | 30 |
| li (lower limit) | 1 |
| ls (upper limit) | 91 |
| Test | Rand/1/Bin | Best/1/Bin | Test | Rand/1/Bin | Best/1/Bin |
|---|---|---|---|---|---|
| 1 | 95.5457 | 94.9080 | 16 | 93.2444 | 92.7573 |
| 2 | 93.4321 | 94.3232 | 17 | 93.1759 | 93.8795 |
| 3 | 95.0492 | 95.3183 | 18 | 92.96241 | 94.3069 |
| 4 | 92.6088 | 93.2915 | 19 | 93.1063 | 95.0708 |
| 5 | 93.1151 | 94.2030 | 20 | 94.2296 | 93.1564 |
| 6 | 93.0887 | 95.6184 | 21 | 95.2363 | 92.8379 |
| 7 | 92.8634 | 95.4351 | 22 | 93.4080 | 92.9451 |
| 8 | 94.0896 | 94.9295 | 23 | 96.0235 | 93.0003 |
| 9 | 95.2359 | 92.6744 | 24 | 94.0122 | 94.0149 |
| 10 | 92.5891 | 94.1667 | 25 | 92.6781 | 93.1910 |
| 11 | 94.4798 | 94.3319 | 26 | 94.1964 | 93.6972 |
| 12 | 93.7070 | 95.5788 | 27 | 92.9309 | 92.5566 |
| 13 | 94.7591 | 93.9418 | 28 | 94.1645 | 93.9121 |
| 14 | 96.4201 | 94.1041 | 29 | 94.5672 | 94.0574 |
| 15 | 93.7882 | 94.4250 | 30 | 94.4028 | 94.2564 |
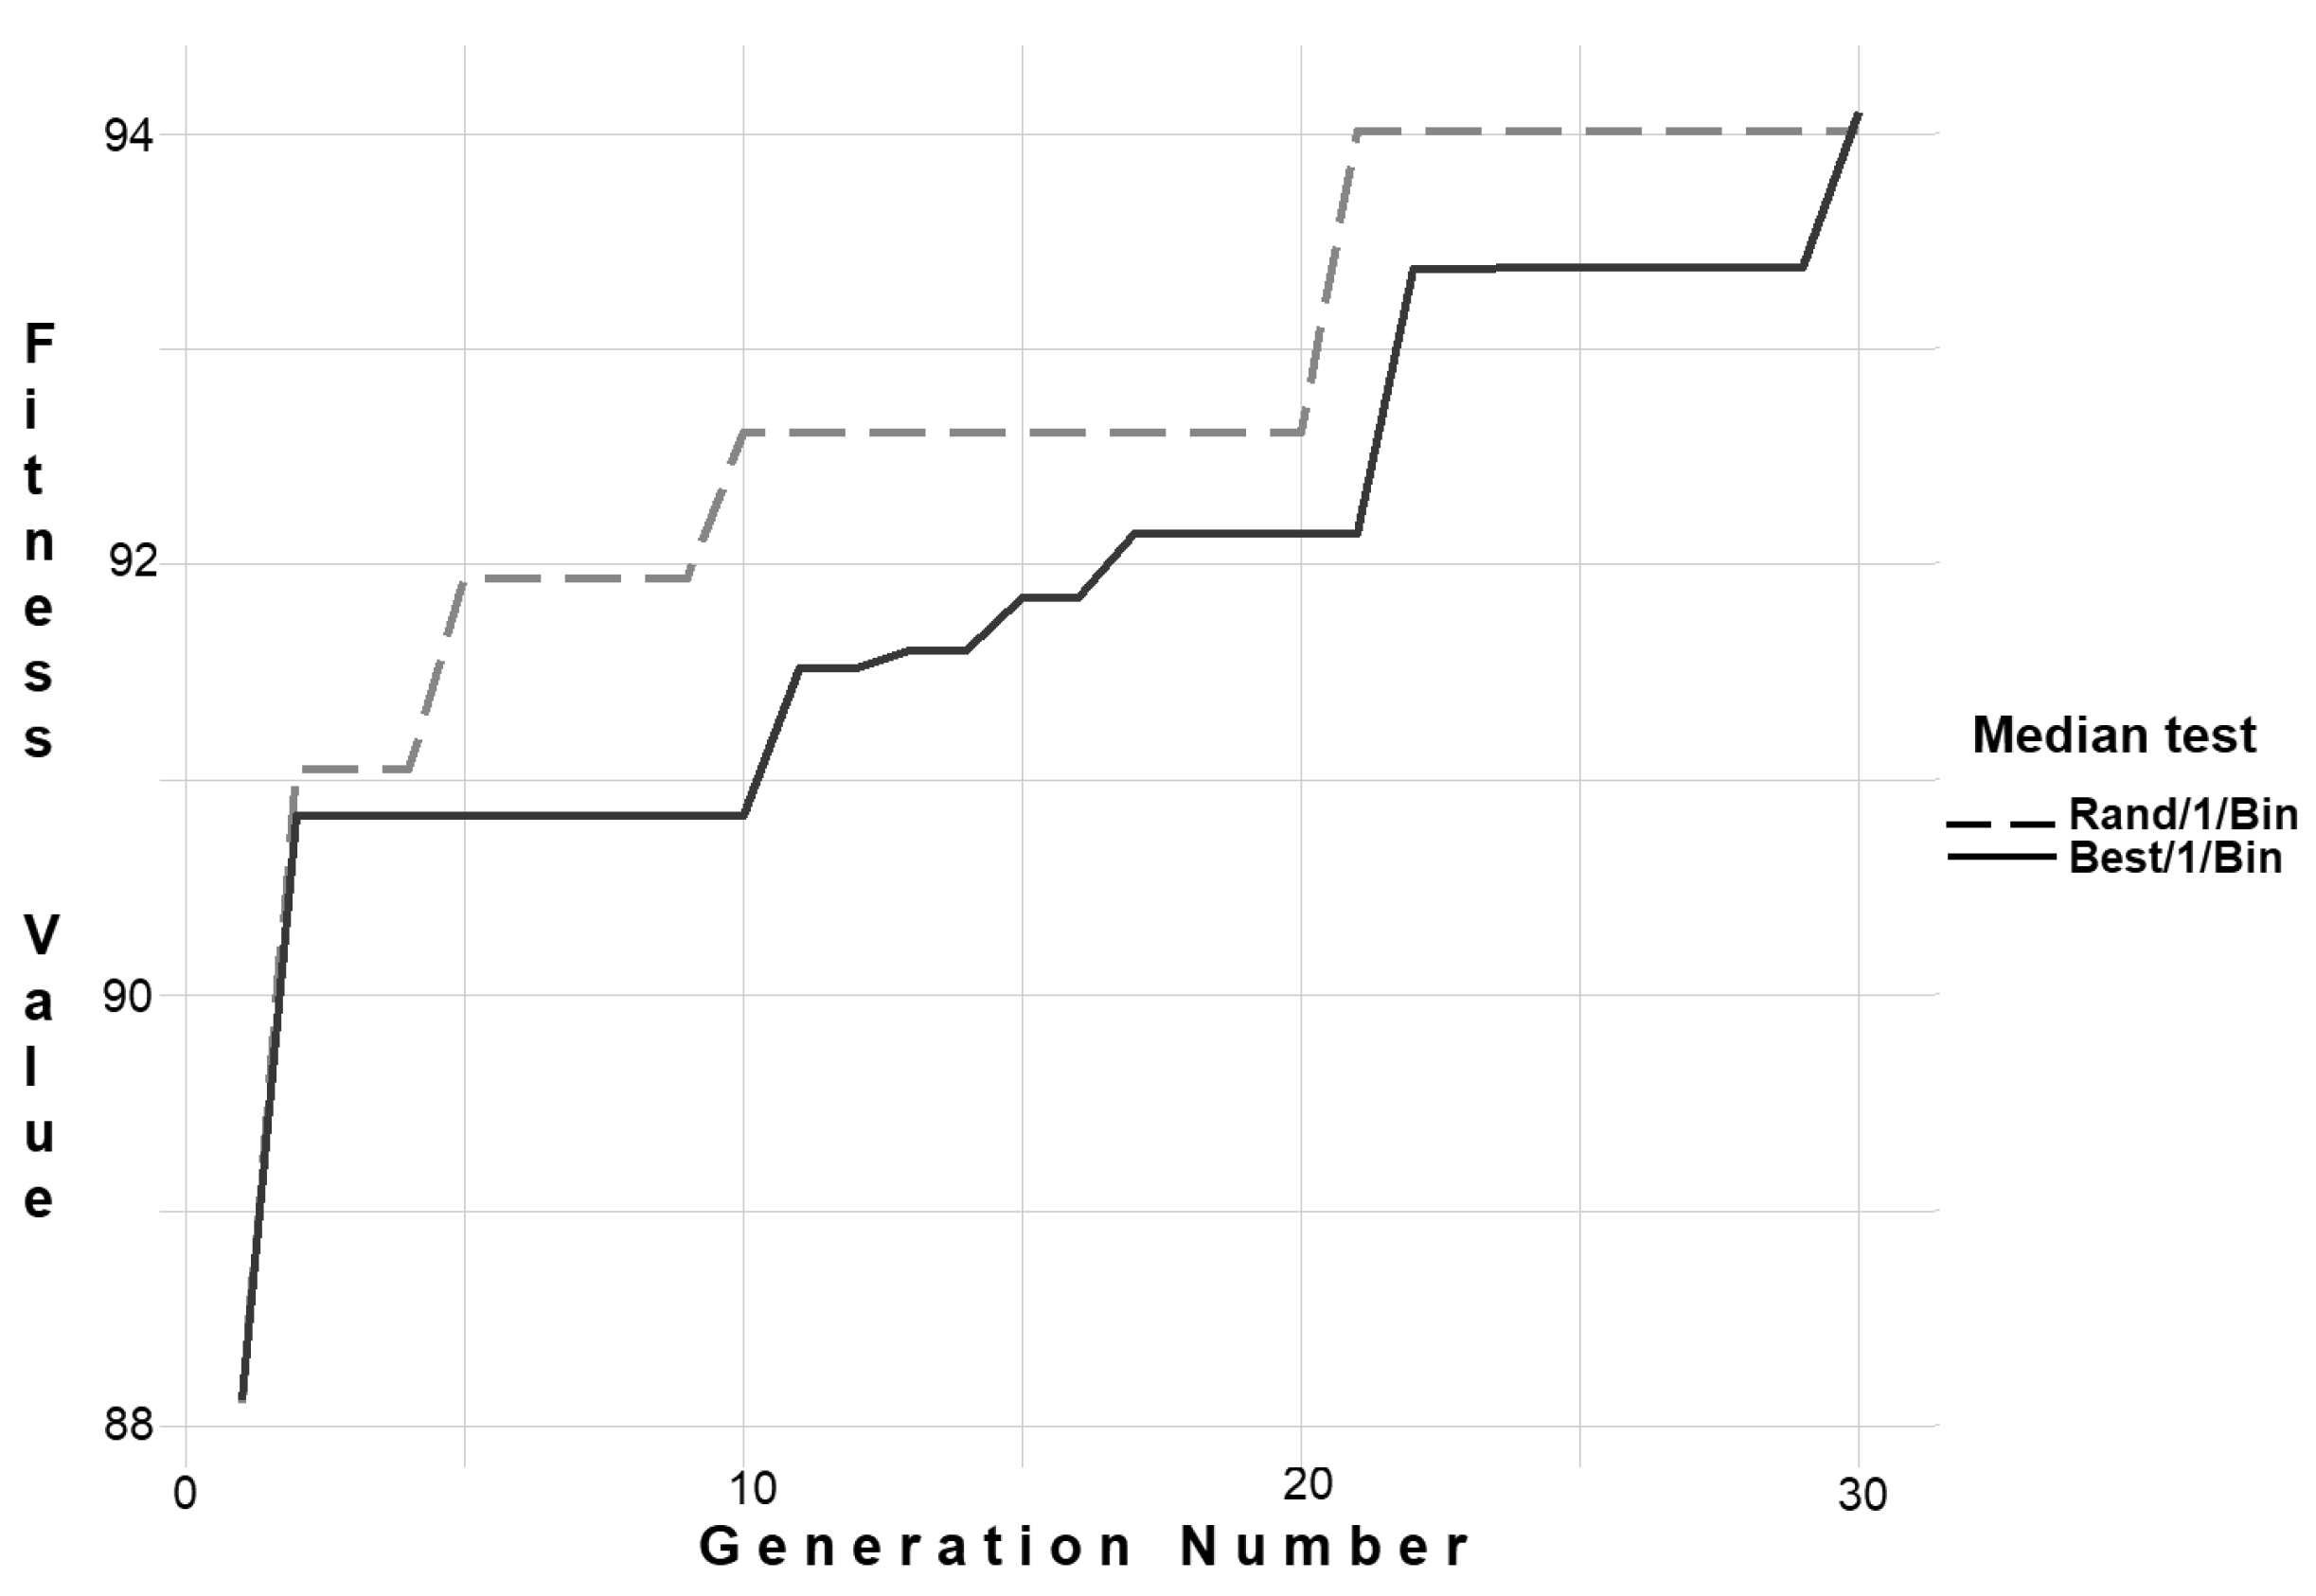
| Statistical Measure | Rand/1/Bin | Best/1/Bin |
|---|---|---|
| Best value | 96.4201 | 95.6184 |
| Mean | 93.9703 | 94.0296 |
| Median | 93.9002 | 94.0808 |
| Standard deviation | 1.0428 | 0.8942 |
| Worst value | 92.5891 | 92.5566 |
| Best test number | 14 | 6 |
| Median test number | 24 | 14 |
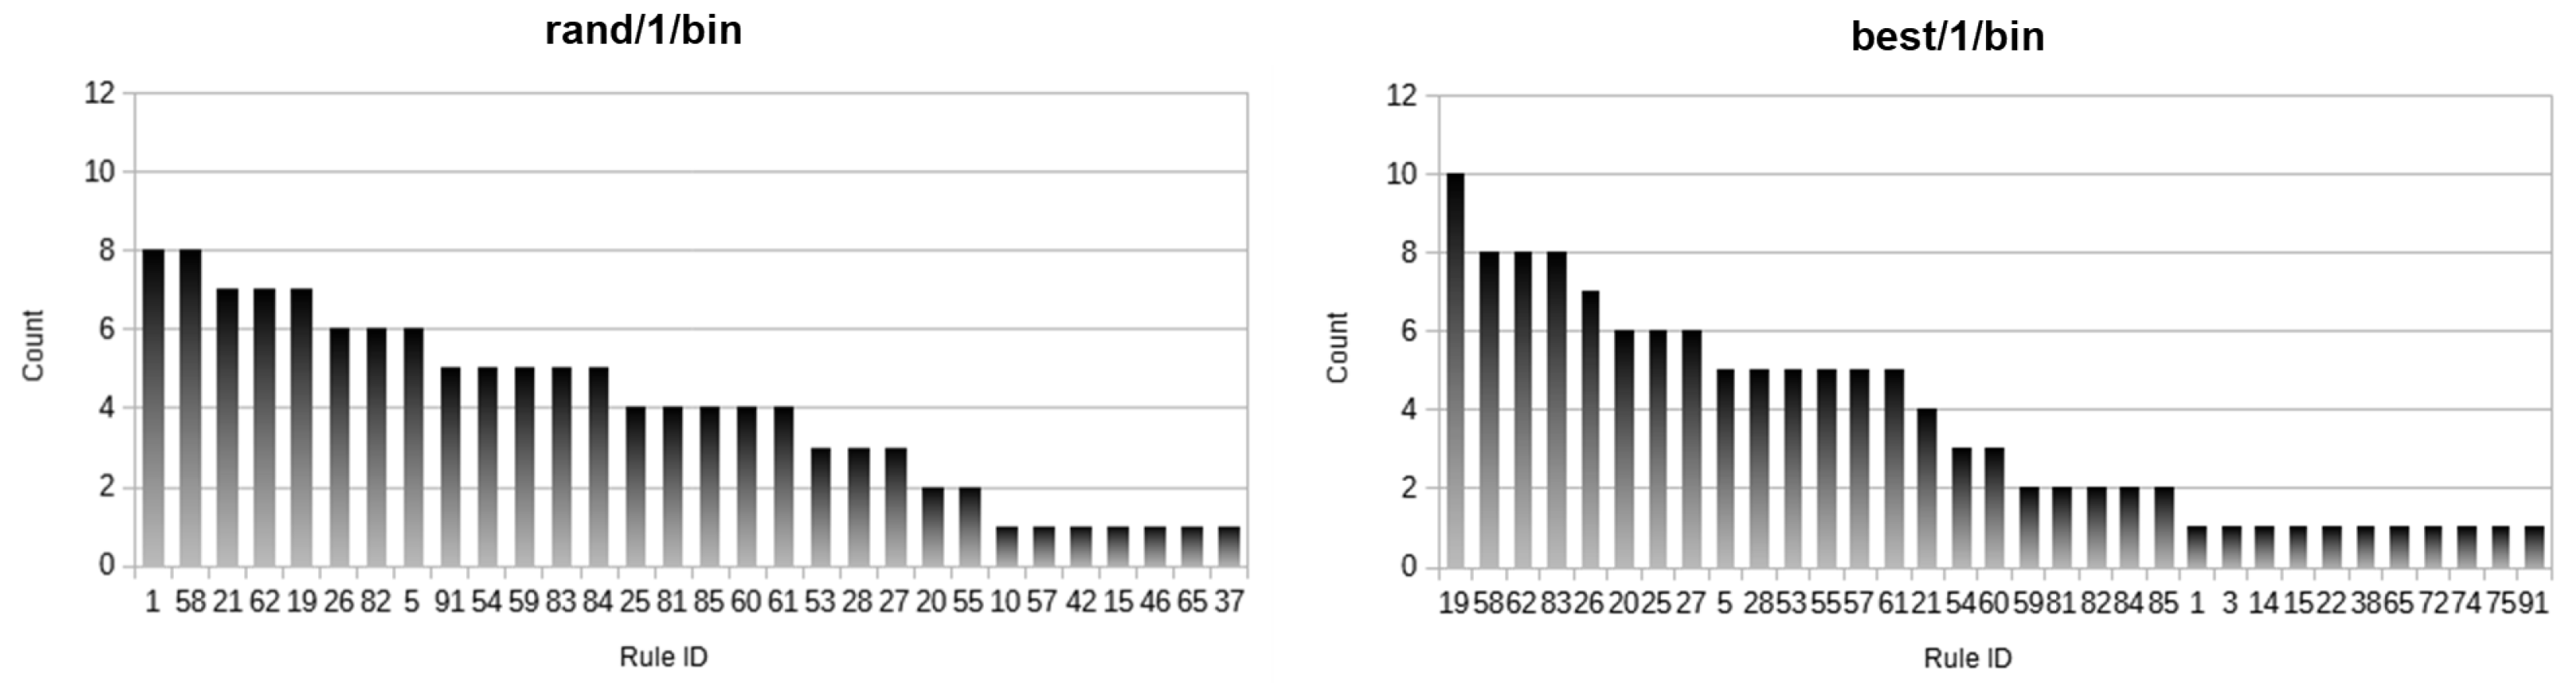
| ID | Association Rule |
|---|---|
| ine 1 | {atopobiumP,megasphaeraPVB+} |
| 3 | {jenseniiDB,megasphaeraPVB+} |
| 5 | {atopobiumP,gardnerellaPVB+} |
| 10 | {gardnerellaP,gasseriDBVB+} |
| 14 | {atopobiumP,inersDBVB+} |
| 15 | {atopobiumP,crispatusDBVB+} |
| 19 | {atopobiumP,crispatusDB,megasphaeraPVB+} |
| 20 | {atopobiumP,jenseniiDB,megasphaeraPVB+} |
| 21 | {atopobiumP,gasseriDB,megasphaeraPVB+} |
| 22 | {crispatusDB,jenseniiDB,megasphaeraPVB+} |
| 25 | {atopobiumP,crispatusDB,gardnerellaPVB+} |
| 26 | {atopobiumP,gardnerellaP,megasphaeraNVB+} |
| 27 | {atopobiumP,gardnerellaP,jenseniiDBVB+} |
| 28 | {atopobiumP,gardnerellaP,gasseriDBVB+} |
| 37 | {atopobiumP,inersDA,jenseniiDBVB+} |
| 42 | {atopobiumP,jenseniiDB,mayoredadVB+} |
| 46 | {atopobiumP,gasseriDB,inersDBVB+} |
| 53 | {atopobiumP,crispatusDB,jenseniiDB,megasphaeraPVB+} |
| 54 | {atopobiumP,crispatusDB,gasseriDB,megasphaeraPVB+} |
| 55 | {atopobiumP,gasseriDB,jenseniiDB,megasphaeraPVB+} |
| 57 | {atopobiumP,crispatusDB,gardnerellaP,megasphaeraNVB+} |
| 58 | {atopobiumP,crispatusDB,gardnerellaP,jenseniiDBVB+} |
| 59 | {atopobiumP,crispatusDB,gardnerellaP,gasseriDBVB+} |
| 60 | {atopobiumP,gardnerellaP,jenseniiDB,megasphaeraNVB+} |
| 61 | {atopobiumP,gardnerellaP,gasseriDB,megasphaeraNVB+} |
| 62 | {atopobiumP,gardnerellaP,gasseriDB,jenseniiDBVB+} |
| 65 | {crispatusDB,gardnerellaP,gasseriDB,jenseniiDBVB+} |
| 72 | {atopobiumP,crispatusDB,gasseriDB,mayoredadVB+} |
| 74 | {atopobiumP,crispatusDB,inersDB,jenseniiDBVB+} |
| 75 | {atopobiumP,crispatusDB,gasseriDB,inersDBVB+} |
| 81 | {atopobiumP,crispatusDB,gasseriDB,jenseniiDB,megasphaeraPVB+} |
| 82 | {atopobiumP,crispatusDB,gardnerellaP,jenseniiDB,megasphaeraNVB+} |
| 83 | {atopobiumP,crispatusDB,gardnerellaP,gasseriDB,megasphaeraNVB+} |
| 84 | {atopobiumP,crispatusDB,gardnerellaP,gasseriDB,jenseniiDBVB+} |
| 85 | {atopobiumP,gardnerellaP,gasseriDB,jenseniiDB,megasphaeraNVB+} |
| 91 | {atopobiumP,crispatusDB,gardnerellaP,gasseriDB,jenseniiDB,megasphaeraNVB+} |
Disclaimer/Publisher’s Note: The statements, opinions and data contained in all publications are solely those of the individual author(s) and contributor(s) and not of MDPI and/or the editor(s). MDPI and/or the editor(s) disclaim responsibility for any injury to people or property resulting from any ideas, methods, instructions or products referred to in the content. |
© 2023 by the authors. Licensee MDPI, Basel, Switzerland. This article is an open access article distributed under the terms and conditions of the Creative Commons Attribution (CC BY) license (https://creativecommons.org/licenses/by/4.0/).
Share and Cite
Salvador-González, M.C.; Canul-Reich, J.; Rivera-López, R.; Mezura-Montes, E.; de la Cruz-Hernandez, E. Evolutionary Selection of a Set of Association Rules Considering Biological Constraints Describing the Prevalent Elements in Bacterial Vaginosis. Math. Comput. Appl. 2023, 28, 75. https://doi.org/10.3390/mca28030075
Salvador-González MC, Canul-Reich J, Rivera-López R, Mezura-Montes E, de la Cruz-Hernandez E. Evolutionary Selection of a Set of Association Rules Considering Biological Constraints Describing the Prevalent Elements in Bacterial Vaginosis. Mathematical and Computational Applications. 2023; 28(3):75. https://doi.org/10.3390/mca28030075
Chicago/Turabian StyleSalvador-González, María Concepción, Juana Canul-Reich, Rafael Rivera-López, Efrén Mezura-Montes, and Erick de la Cruz-Hernandez. 2023. "Evolutionary Selection of a Set of Association Rules Considering Biological Constraints Describing the Prevalent Elements in Bacterial Vaginosis" Mathematical and Computational Applications 28, no. 3: 75. https://doi.org/10.3390/mca28030075