Article

Neuroevolution of Convolutional Neural Networks for Breast Cancer Diagnosis Using Western Blot Strips

by
José-Luis Llaguno-Roque
1,
Rocio-Erandi Barrientos-Martínez
2,
Héctor-Gabriel Acosta-Mesa
2,*,
Tania Romo-González
1 and
Efrén Mezura-Montes
2
1
Instituto de Investigaciones Biológicas, Universidad Veracruzana, Dr. Luis Castelazo Ayala S/N, Industrial Animas, Xalapa C.P. 91190, Veracruz, Mexico
2
Instituto de Investigaciones en Inteligencia Artificial, Universidad Veracruzana, Campus Sur, Calle Paseo Lote II, Sección Segunda N° 112, Nuevo Xalapa, Xalapa C.P. 91097, Veracruz, Mexico
*
Author to whom correspondence should be addressed.
Math. Comput. Appl. 2023, 28(3), 72; https://doi.org/10.3390/mca28030072
Submission received: 16 February 2023 / Revised: 9 May 2023 / Accepted: 22 May 2023 / Published: 24 May 2023

Abstract

:
Breast cancer has become a global health problem, ranking first in incidences and fifth in mortality in women around the world. In Mexico, the first cause of death in women is breast cancer. This work uses deep learning techniques to discriminate between healthy and breast cancer patients, based on the banding patterns obtained from the Western Blot strip images of the autoantibody response to antigens of the T47D tumor line. The reaction of antibodies to tumor antigens occurs early in the process of tumorigenesis, years before clinical symptoms. One of the main challenges in deep learning is the design of the architecture of the convolutional neural network. Neuroevolution has been used to support this and has produced highly competitive results. It is proposed that neuroevolve convolutional neural networks (CNN) find an optimal architecture to achieve competitive ranking, taking Western Blot images as input. The CNN obtained reached 90.67% accuracy, 90.71% recall, 95.34% specificity, and 90.69% precision in classifying three different classes (healthy, benign breast pathology, and breast cancer).

1. Introduction

Breast cancer has become a global health problem as it ranks first in the world in terms of incidence and fifth in terms of cancer-related mortality [1]. In Mexico, breast cancer is the first cause of death in women between 30 and 50 years of age, and since 2006, it has replaced cervical cancer as a public health concern, and it is a major challenge for the health system [2].
Breast cancer is identified by an accelerated and uncontrolled proliferation of mammary epithelial cells. These are healthy cells that have an increased reproductive capacity; they multiply and increase until they form tumors that, depending on their characteristics, can be malignant or benign [3].
There are several complementary approaches to the diagnosis of breast cancer. The tests traditionally used for diagnosis are breast examination, ultrasound, mammography, and biopsy. During a breast exam, the doctor checks the lymph nodes in both breasts and armpits for lumps or other abnormalities. This test identifies lumps of at least 3 mm, and detection of this size has been clinically shown to be beneficial for patient survival. The diagnostic percentage of this test is 40% to 69% [4].
Mammography is a diagnostic test, where an image is obtained and then analyzed and interpreted by a specialist. It is an expensive, painful procedure, generally performed on patients over 40 years of age. The percentage of diagnosis is from 63% to 87%, depending on the age of the patient, as well as the density of the mammary tissue. Ultrasound or sonography is a diagnostic procedure that uses sound waves to detect cysts or malformations in the breasts. It is used complementarily to mammography and allows guiding the taking of the biopsy. The diagnostic percentage is 68% to 98% [5]. A biopsy is a diagnostic test that determines the presence or absence of cancer cells in a patient’s breast tissue. If the type of biopsy is surgical, it can be a painful and invasive procedure [6].
The aforementioned diagnostic tests could be expensive, invasive, subjective, and painful. In addition, they can be ineffective in the early detection of cancer since these tests identify the disease when it is present in the patient and, most of the time, in an advanced state. The detection of breast cancer in Mexico usually occurs in late stages because Mexican women feel embarrassed when being examined by doctors, which decreases the possibility of providing an effective and successful treatment. In addition, in México, not having sufficient infrastructure to perform the procedure and not having enough trained and certified radiologists to interpret the tests [7,8] is a limitation, which is why the number of tests recommended by international organizations (19.9 mammograms per million inhabitants) is not met. Thus, in Mexico, life expectancy is very low in relation to developed countries [4]. Therefore, it is necessary to have tests that diagnose breast cancer early before it manifests as tumors in patients.
Since breast cancer is a heterogeneous disease in which tumors express a variety of aberrant proteins (antigens), which creates an immune response by the production of autoantibodies against such tumor-associated antigens, it is possible to use this antitumor reaction as an oncogenic signal before tumor formation manifests itself in the body. Therefore, methods are being developed that identify autoantibodies that recognize tumor proteins that are present up to four years before the disease is detected using the traditional test [9]. Desmetz et al. [10], by evaluating autoantibody responses to some tumor-associated antigens, have been able to accurately distinguish healthy patients from those with early stage breast cancer, particularly carcinoma in situ. Thus, developing these methods could help in the early detection of breast cancer, supporting mammographic screening, especially in women under 50 years of age. However, it is necessary to probe its efficacy since this kind of test changes with the genetical and phenotypical background of patients.
To that respect, Romo et al. [11] developed a method specific to Mexican women, which confirms the presence of autoantibodies reacting to tumor cells in the T47D cell line (ductal carcinoma of the breast), which are capable of discriminating between women with and without breast disease. This was achieved by analyzing the bands expressed in the one-dimensional Western Blot images of the autoantibody response to antigens of the T47D tumor line. Although the results obtained are promising, the analysis of the images is complex, subjective, and slow since it takes a month to create a binary base (1 present and 0 absent proteins), from which the data are obtained for discrimination between healthy patients and those with breast disease. On the other hand, an expert, with the help of commercial software, is required to align the strip bands for each patient, but the identification and final position of the bands depend exclusively and subjectively on the expert. Consequently, more precise and automated tools are needed to identify these banding patterns.
In recent years, artificial intelligence (AI) has used machine learning and computer vision techniques to support processes such as the prevention and diagnosis of breast cancer. Contributions have been made, for example, in image processing, to identify patterns that make it possible to distinguish women with breast disease from those who do not have the disease [12]. The images usually used to diagnose breast cancer are obtained from mammary tissue by means of mammography, ultrasound, thermography, histopathology (Whole Slide Image—WSI) [13,14], or they are images obtained from the reaction of the immune system from a blood sample and processed with the Western Blot technique (proteomic images) [15].
In addition, afterward, Sánchez-Silva et al. [15] proposed a semi-automated system to avoid subjectivity and shorten image analysis time in Western blot images by analyzing protein bands from the classification of patterns represented as time series [11]. These time series were obtained from the change in tone in the pixels of the bands. Because the time series are of different lengths, they were manually standardized to a predefined length using a geometric scaling transformation. The K-Nearest Neighbor (KNN) algorithm was used to classify the time series, using the Euclidean, Mahalanobis, and correlation similarity distances, achieving a classification percentage of 65.40% with three classes (healthy, benign breast pathology, and breast cancer), and an 86.06% classification percentage with two classes (healthy and breast cancer). The classification percentages achieved are similar to those of the expert of reference [11]. However, the method is considered semi-automatic since, to obtain the time series, an area is subjectively selected in each strip, which causes the variation in the lengths of the time series and needs to be standardized. To improve the work previously described in [16], it was proposed to analyze the bands of the Western Blot images of antibodies that are reactive to antigens (tumor line T47D—ductal carcinoma), using convolutional neural networks (CNN), and dispense by obtaining the time series of a subjectively chosen area to perform the classification. A classification percentage of 68.24% for three classes (healthy, benign breast pathology, and breast cancer) is obtained. The classification percentage was statistically equivalent to that seen in [15], obtaining for two classes (healthy and breast cancer) 86.00%. It is important to remark that the architecture of the CNN used was handcrafted, so the architecture used does not ensure that the best performance, in terms of accuracy, will be reached.
In the work developed in [17], they propose to automate the detection of breast cancer, analyzing the regions of invasive ductal carcinoma (IDC) tissues in 162 whole-slide images (WSI), from which 277,524 patches were obtained in digital format, RGB with a size of 50 × 50 pixels. Patches were labeled with the value of 1 for IDC positive and 0 for IDC negative. Three CNN’s architectures obtained through experimentation were used, achieving a classification accuracy of 87%. In [18], detecting breast cancer using thermographic images is proposed. Thermographic images capture the heat map of the breasts and their surroundings. The analysis of this type of images is based on the assumption that in a breast cancer process, blood vessels are formed and inflamed, producing an increase in temperature in that area. They used 3895 thermographic images of breasts in JPEG format with a dimension of 640 × 480 pixels, obtaining the information to generate 140 patients, of which 98 were healthy patients and 42 were cancer patients. For the classification, a CNN, whose parameters were optimized by means of the Bayes optimization algorithm, was used, obtaining an accuracy of 98.95%. In the work presented in [19], the objective was to differentiate malignant from benign breast cancer tumors, classifying histopathology images using convolutional neural networks. They use the BreakHis database, formed with histopathological images of mammary tissues with breast cancer from 82 patients. This database consists of 7909 images of microscopic biopsies, of which 2480 are benign and 5229 are malignant, each image has four magnification levels (40×, 100×, 200×, and 400×). The CNN architecture was obtained from the importation of previously trained layers from CNN AlexNet [20], achieving a classification accuracy of 89.66%. In [21], it was proposed to predict HER2 expression (a protein that is used as a marker of breast cancer) by analyzing ultrasound images of preoperative breast cancer patients, using a deep learning model based on DenseNet. The model was trained with 108 patients and validated with 36 patients, obtaining an accuracy of 80.56%. In [22], a framework for the classification of breast cancer from mammographic images is proposed. A pre-trained network (EfficientNet-b0) is used to classify two databases of mammography images. The first database is CBIS-DDSM, achieving a classification accuracy of 95.4%, and the second database is INbreast, achieving a classification accuracy of 99.7%.
Although CNNs are very competitive, their main disadvantage is the necessity to design their components (architecture), which in most cases is performed manually and by trial and error, consuming a lot of time in finding a suitable architecture that adapts to the requirements. Given that most network architectures have many convolution layers, filters of different sizes, and some hyperparameters at the moment of being executed, they demand excessive computational costs, both in time and in memory [23].
Several solutions have been proposed to deal with this matter; one of the most used in recent years is neuroevolution, a technique inspired by the biological process of the evolution of the human brain, through the use of evolutionary computing, which has made good progress toward optimizing the design of CNN architectures [24].
One of the most important parts of neuroevolution for the design of CNNs is neural coding, which corresponds to the computational representation of an artificial neural network. A suitable coding will allow for the creation of a design with a competitive performance and more efficient and less complex structures.
In this work, the DeepGA neuroevolution algorithm proposed by Vargas-Hakim et al. [25] is used as a framework for neuroevolution. It is based on the fundamentals of genetic algorithms, exploitation (by crossing) and exploration (by mutation), and has three fundamental characteristics: (1) A hybrid coding, which combines blockchains and binary codings; (2) The use of evolutionary operators to handle this type of encoding; (3) A linear aggregation fitness function to evaluate individuals based on their classification accuracy and the number of parameters. The goal of this work, which uses neuroevolution, is to automatically obtain a convolutional neural network architecture suitable for our problem and to classify the bands of the Western Blot images of antibodies reactive to antigens (tumor line T47D—carcinoma ductal). According to studies [26,27,28], the reaction of antibodies to tumor antigens occurs early in the process of tumorigenesis, years before clinical symptoms appear, contrary to mammographic images, WSI (Whole-Slide Images/histopathology), and ultrasound, that detect a tumor process that already exists. On the other hand, the CNN architecture obtained by neuroevolution prevents either configuring a CNN by hand or using a trained CNN, in addition to improving the classification obtained, as described in [16].

2. Materials and Methods

The pipeline process proposed in this work is described in Figure 1.

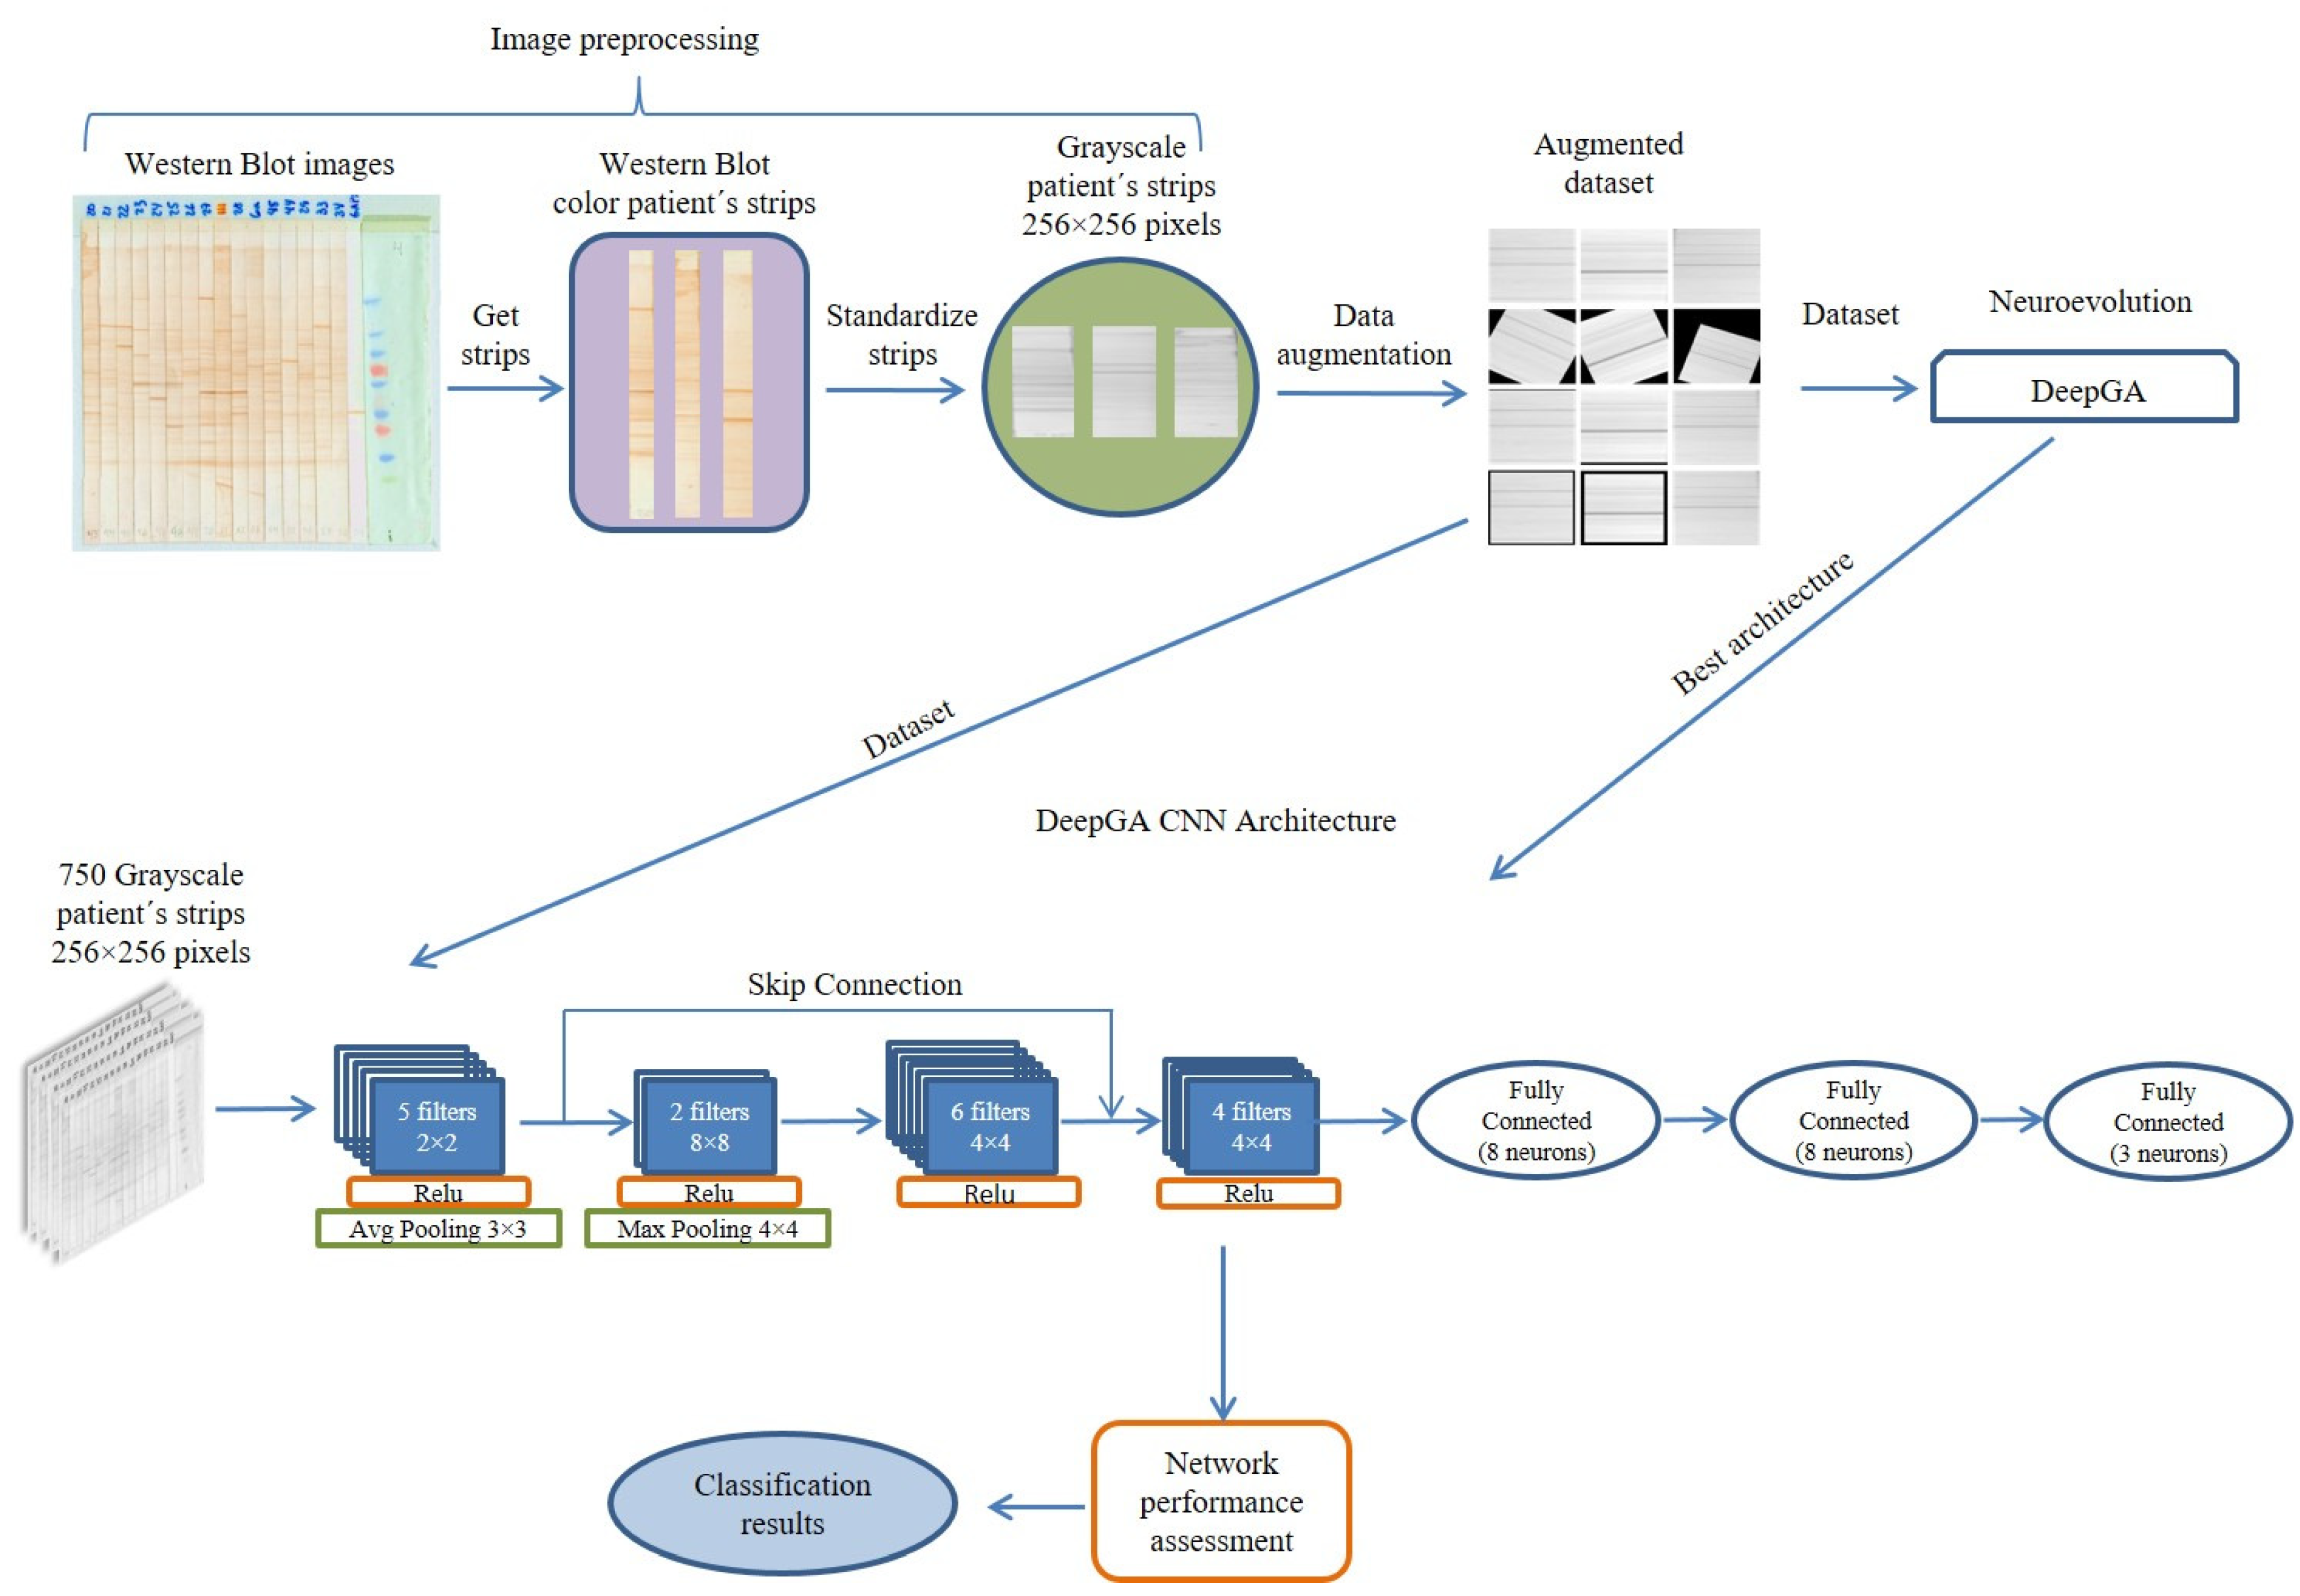
2.1. Western Blot Strips Database

For this study, a database containing 150 images corresponding to nitrocellulose membrane strips with the expression of bands obtained with the Western Blot of the reaction of antibodies to specific protein antigens (T47D) has been used. Image acquisition was performed following a protocol in a controlled environment, in addition to using commercial editing software for image enhancement, as described in [11]. A total of 50 of the images correspond to patients with breast cancer, 50 to patients with benign pathology, and 50 to healthy patients. These images have been provided by the Biology and Integral Health area of the Biological Research Institute of the Universidad Veracruzana, following ethical standards and the acquisition of informed consent from the patients who participated. The protocol was reviewed and approved by the Research Ethics Committee of the General Hospital of Mexico “Dr. Eduardo Liceaga” (DI/12/11/03/064). The study conforms to the Code of Ethics of the World Medical Association (Declaration of Helsinki), printed in the British Medical Journal (18 July 1964).

2.2. Image Preprocessing

The color images provided by the area of Biology and Integral Health of the Institute of Biological Research of the Universidad Veracruzana are composed of an average of 18 strips in which the bands of patients of the antibody reaction to specific protein antigens are expressed (T47D). In total, 50 strips were obtained from healthy patients, 50 strips from patients with benign breast disease, and 50 strips from patients with breast cancer.
Sánchez-Silva et al. [15] carried out experiments with color and grayscale images and determined that color was not relevant, so they chose to work with grayscale images. Due to the above and for the sake of simplicity in image processing, the color images were converted to grayscale in this study. On the other hand, based on previous experiments carried out with the CNNs, it has been established that the ideal transformation for the size of the strips in this work is 256 × 256 pixels.

2.3. Data Augmentation

CNNs require a large amount of data for feature extraction, as well as for training and testing, which are used for network architecture evaluation. In the medical area, it is difficult to have many images. To solve this problem, data augmentation is used, which consists of applying affine transformations (such as rotation, scaling, and/or translation) to the images of the original database to generate additional images and increase the diversity of the training set, since CNNs can classify objects in different orientations. It is recommended that the applied transformations are carried out on small scales so as not to alter the nature of the images.
For this study, 200 additional images have been generated for each of the classes, with which a database containing 750 images has been obtained. The affine transformations that were used randomly and with a range of degrees, movement or size, are: (a) Rotation, with a degree range of 10 to 30; (b) Translation with a movement range of 0.1 to 0.3; (c) Scaling with a size range of 0.5 to 1; (d) Gaussian blur, with a kernel size of 7.

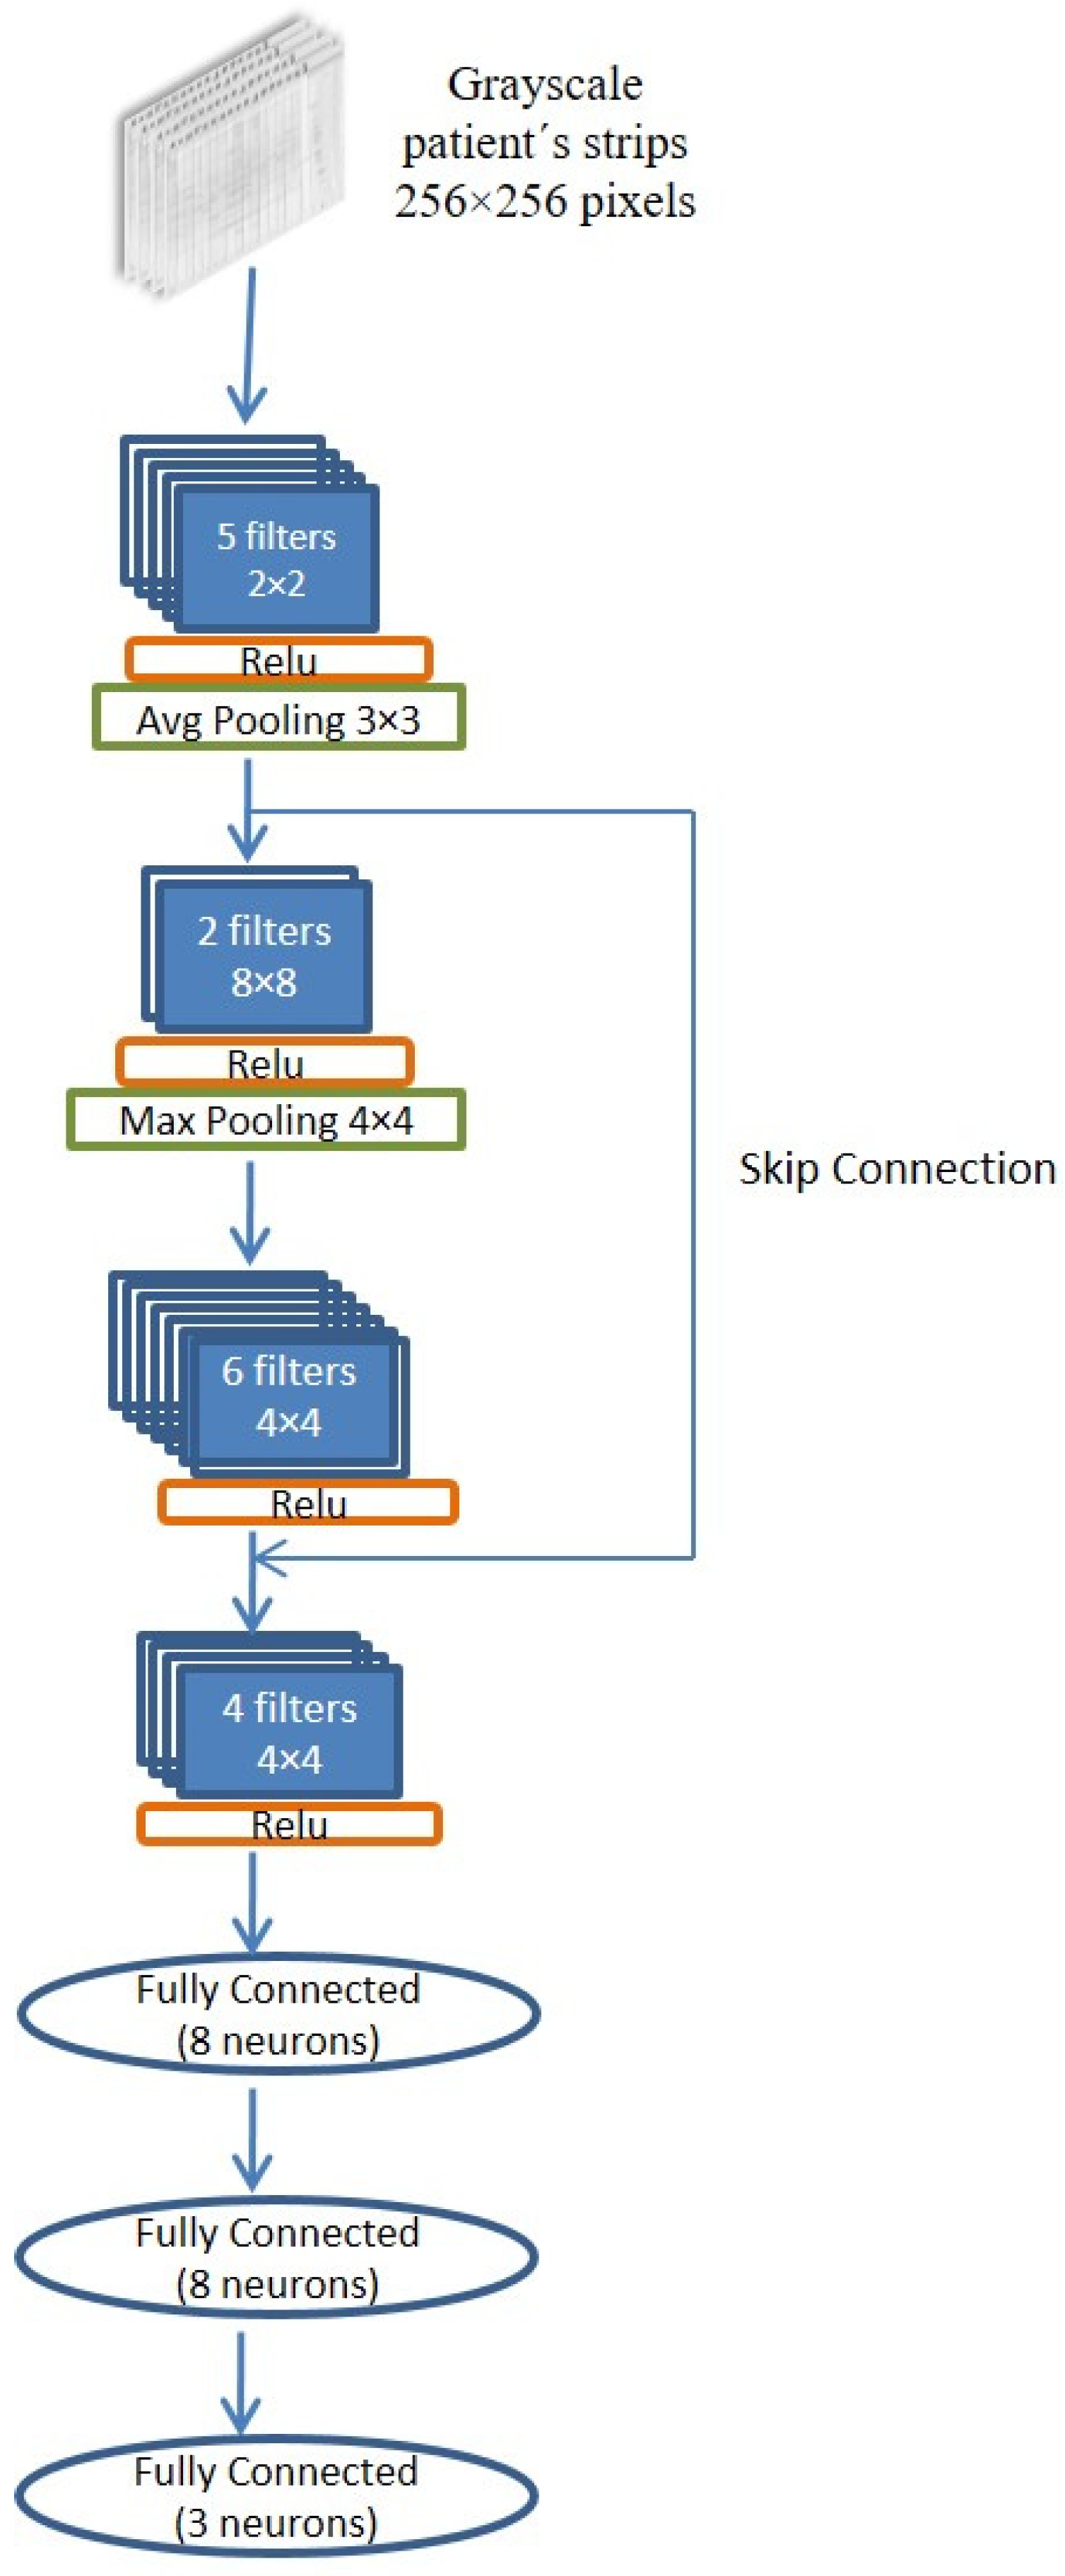
2.4. CNN Neuroevolution

Neuroevolution is an approach that harnesses evolutionary algorithms to optimize the artificial neural networks, inspired by the fact that natural brains are the products of an evolutionary process [29].
To find a CNN architecture that achieves a balance between complexity and efficiency for the classification of Western Blot strips, the DeepGA neuroevolution algorithm [25] has been used. The first step was adjust the parameters of the algorithm, which are shown in Table 1. DeepGA is formed by a neuroevolutionary framework based on genetic algorithms. Their goal is to obtain competitive CNNs through flexible hybrid coding combined with binary and blockchain coding. The parameters required by DeepGA are the population size (N = 20), the number of generations (T = 50), the crossover rate (CXPB = 0.7), the mutation rate (CXPB = 0.3), and the size of the tournament (S = 5); these values were manually adjusted experimentally. The adjustment of mutation rate (MUPB) and crossover rate (CXPB) was performed until sufficient diversity was obtained throughout the scan. Both the size of the population and the number of generations were established by virtue of time and available computational resources, for which it was not necessary to use automatic methods for parameter adjustment. The best architecture obtained by DeepGA is shown in Figure 2.

2.5. Evaluation of the Convolutional Neural Network

From the best architecture obtained in DeepGA, we proceeded to evaluate the convolutional neural network. For this, a set of 750 Western Blot strips was used, and through the hold-out technique, 70% of the data were used to train the network and the remaining 30% to test it. From the results obtained, the accuracy, recall, specificity, and precision of the network for the classification of the Western Blot strips were calculated.
The accuracy is calculated from the total number of predictions that the algorithm classified correctly divided by the total number in the data set (Equation (1)).
Accuracy = (correctly classified images)/(total images)
The recall is the number of elements correctly identified as positives out of the total number of true positives (Equation (2)).
Recall = TP/(TP + FN)
Specificity is the number of items correctly identified as negative out of the total number of negatives (Equation (3)).
Specificity = TN/(TN + FP)
Precision is the number of elements correctly identified as positive out of a total of elements identified as positive (Equation (4)).
Precision = TP/(TP + FP)

2.6. Comparison and Statistical Analysis

The result of Western Blot strip classification accuracy obtained in this work was compared by statistical test with the classification accuracy obtained in [15,16], with the aim of obtaining statistical significance between them.
The data were analyzed using one-way analysis of variance (ANOVA) for independent groups, with treatment as the factor, followed by the Tukey post hoc test for multiple mean comparisons. The results are expressed as mean + standard error of the mean, and the significance level was set at p < 0.05. The assumptions of normality and homogeneity were verified. The data were analyzed using the MINITAB17 software program.

3. Experimentation and Results

To obtain the classification accuracy of the Western Blot strips with the support of neuroevolution and convolutional neural networks, the following process was carried out:
  • The CNN obtained through the DeepGA neuroevolution algorithm (CNN-DeepGA) was trained, taking as input data the database of 750 Western blot strips; 250 belong to the class of healthy patients, 250 to the class of patients with benign pathology, and 250 to the class of patients with cancer. The parameters with which CNN-DeepGA was executed have been shown in Table 1;
  • Training CNN-DeepGA consisted of only 10 epochs (as suggested by [30]); Adam’s optimizer was used with a learning rate of 1 × 10⁻⁴. For training, we used 70% of the data set (525 images out of 750 total), while accuracy/error was calculated using 30% (225 images out of 750 total) of the remaining set for testing;
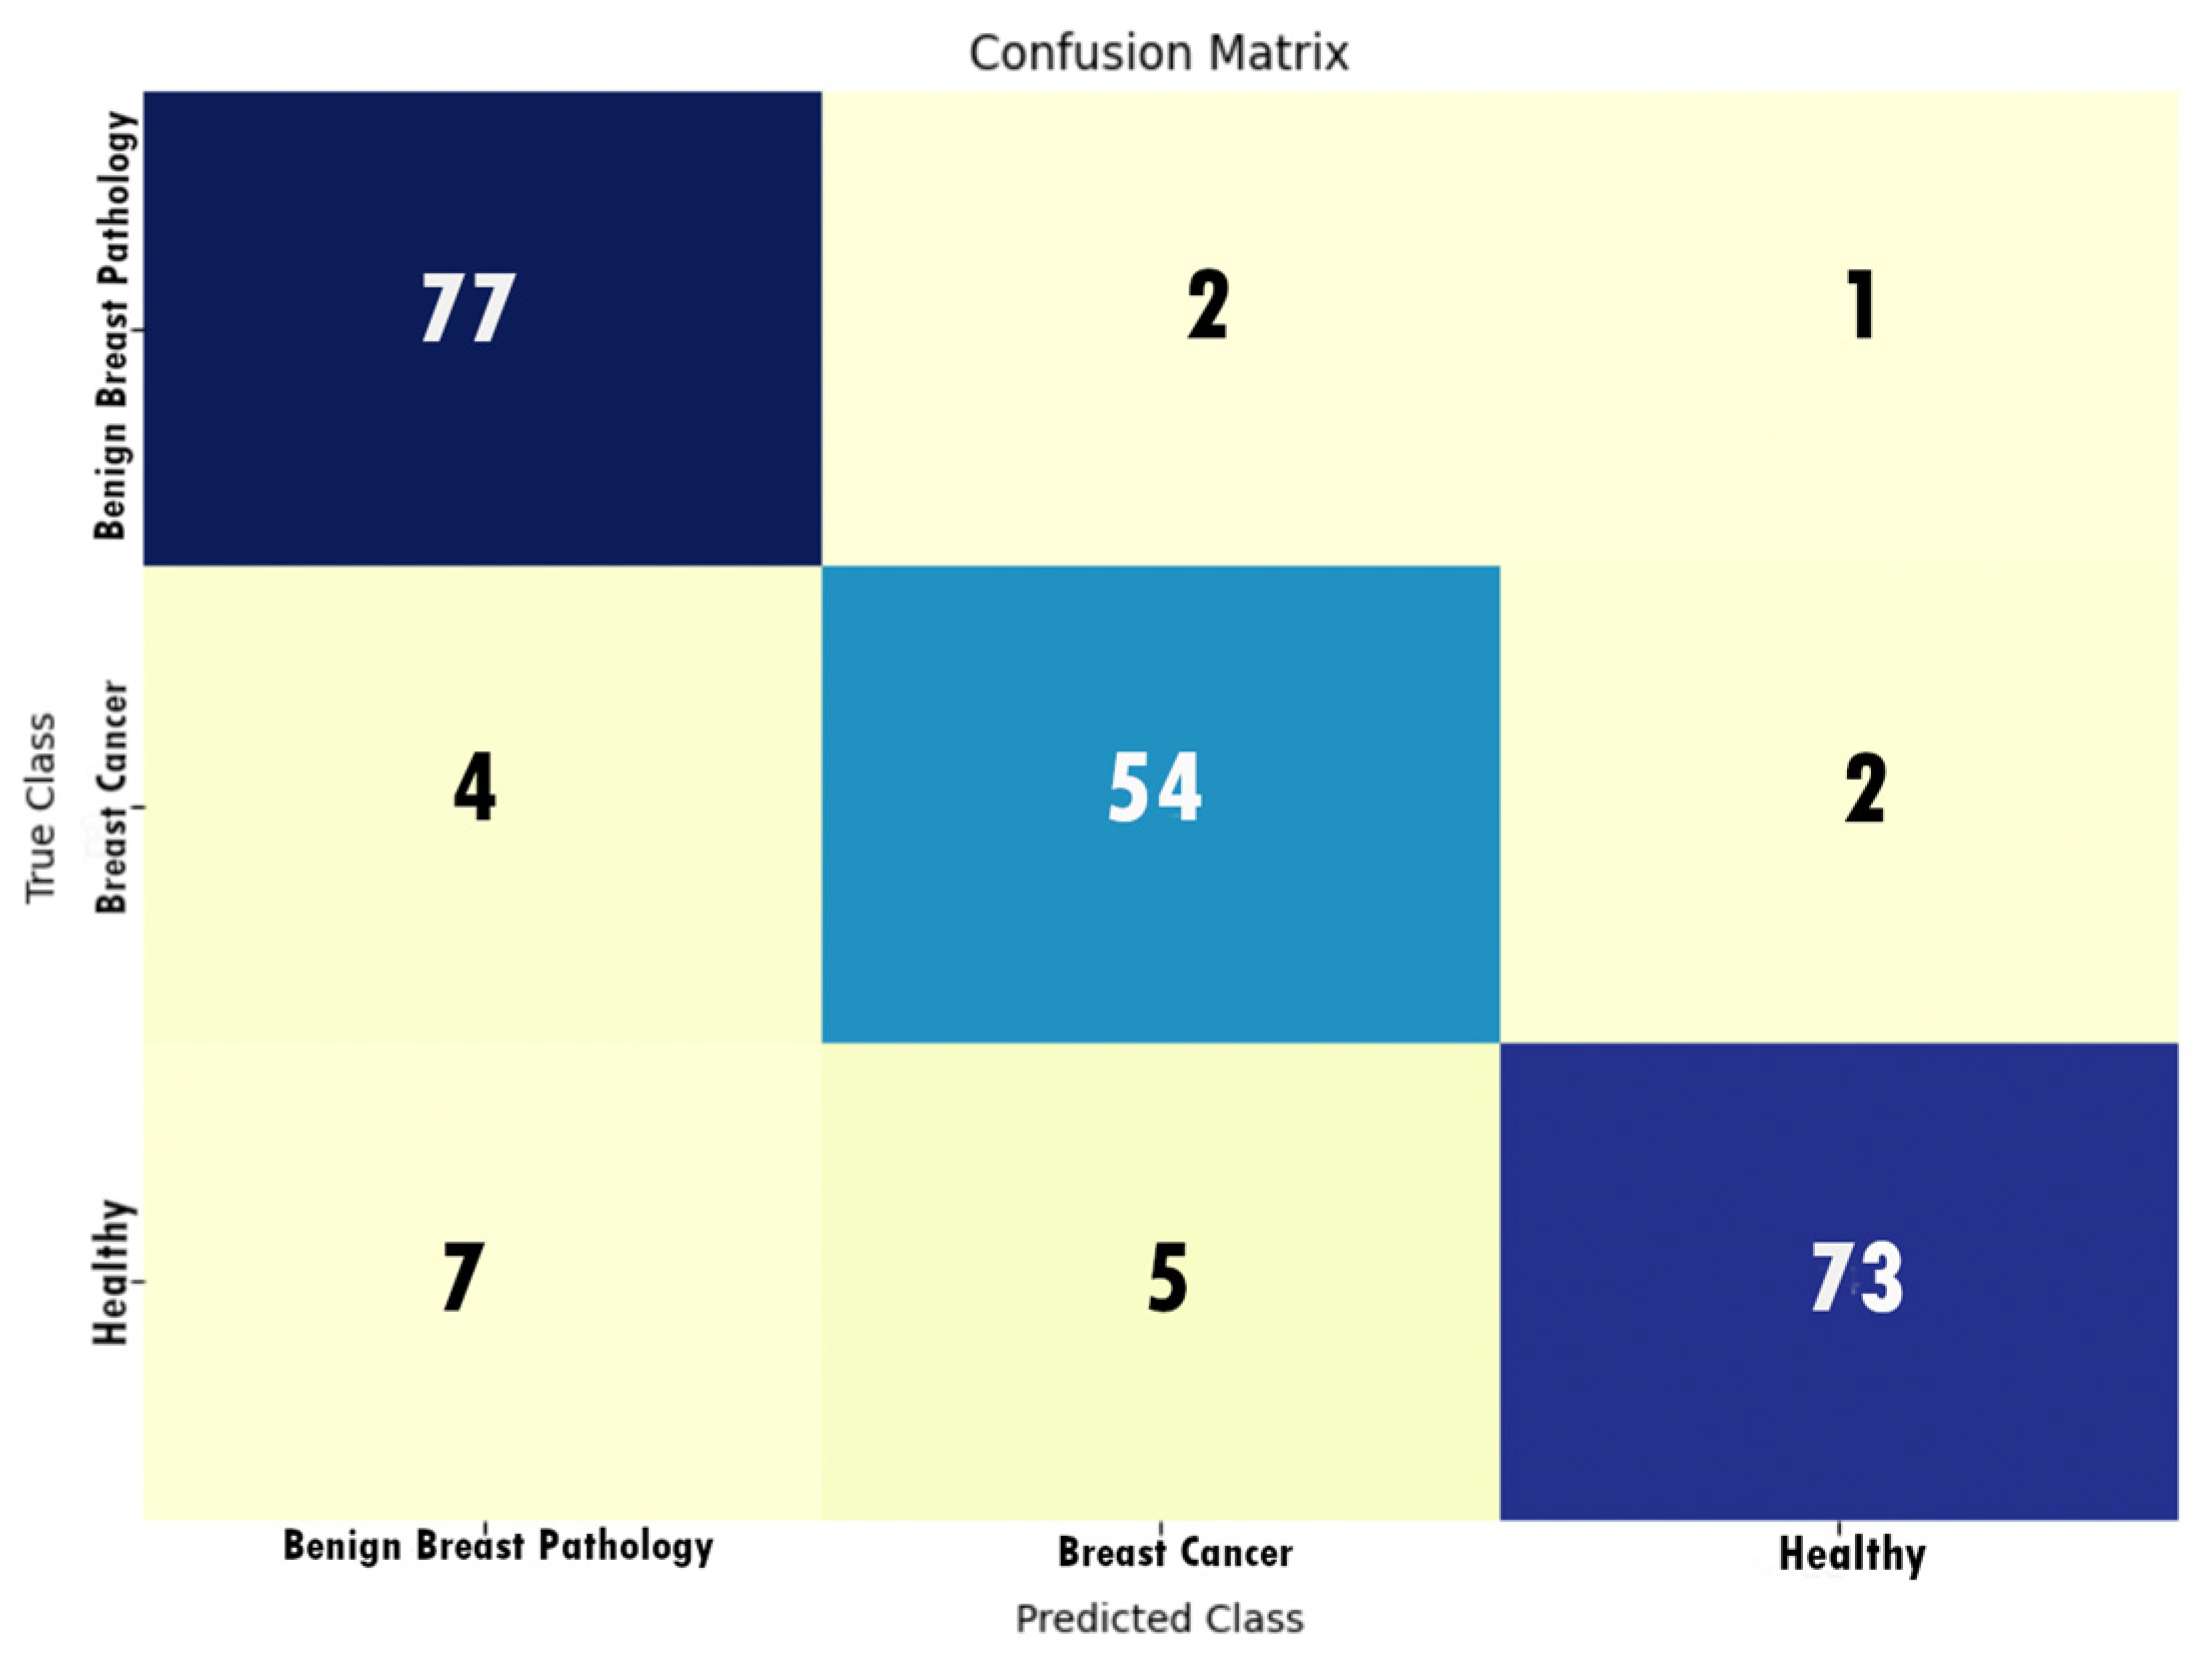
  • To evaluate the performance of CNN-DeepGA, 10 executions were carried out, obtaining the average and the standard deviation of the accuracy in each of the executions, as shown in Table 2;
  • To handle biases, such as overfitting and underfitting, a data augmentation was performed by increasing the original size of examples for each class five times, going from 50 to 250 images in each class. On the other hand, the images were obtained in a controlled environment and an editing software program was used to improve them [11]. The hold-out technique was used for the evaluation of the model; 70% of the data were used for training the network and the remaining 30% for testing it;
  • The performance of the Alexnet pretrained CNN [20] was tested with 150 Westen Blot strip images (50 healthy, 50 benign breast pathology, and 50 breast cancer). For the training consisting of 100 epochs, Adam’s optimizer was used with a learning range of 1 × 10⁻⁴. For the training set, 70% of the data set was used, while the accuracy/errors were calculated using 30% of the data set;
  • Regarding the ANOVA statistical test that was applied to establish if there was a significant difference between the results obtained in this work and those achieved in [15] and [16], the results are shown in Table 3, Table 4 and Table 5, respectively.
Table 3 shows the results obtained from the accuracy averages of the time series classification with the KNN classification algorithm (65.43%), the handcrafted CNN (66.44%), Alexnet pretrained CNN (49.46), and CNN-DeepGA (90.67%). The classification accuracy with KNN and the handcrafted CNN are statistically equivalent, and the Alexnet pretrained CNN accuracy showed the lowest values. However, the accuracy of the CNN-DeepGA classification is better and statistically significant considering the other three compared approaches. It is important to remark that the same data set was used on the different runs executed on all algorithms. Figure 3 shows the confusion matrix obtained. Table 5 shows the different metrics used to evaluate the CNN architecture obtained through DeepGA. As mentioned above, an accuracy of 90.67% was obtained; likewise, a recall of 90.71%, a specificity of 95.34%, and a precision of 90.69% were also obtained.

4. Conclusions

Breast cancer is a pathology that has spread throughout the world; it is the leading cause of death in adult women in our country. Commonly used diagnostic tests provide the existence and stage of the disease. However, it is necessary to develop effective detection techniques for this pathology. The response of the immune system to tumor antigens could be the answer to this problem. As mentioned throughout this study, there have been attempts to detect breast cancer early, using the immune response supported by artificial intelligence techniques, such as computer vision and machine learning. Early detection of breast cancer will improve the prognosis, provide adequate treatment, and reduce patient mortality.
It have been reported in some studies that the architecture of the convolutional neural network used has been obtained either manually through experimentation [17], by optimizing the CNN parameters using other algorithms, such as Bayes optimization [18], using a previously trained CNN [19,31], or by taking advantage of the structure of a predefined network [21]. In this work, it was proposed to use neuroevolution to generate a convolutional network architecture that has competitive complexity and efficiency for the classification of Western Blot strips. This was achieved by generating a CNN of four convolutional layers, which allowed a satisfactory execution in terms of time and memory, and a classification accuracy of 90.67%, a recall of 90.71%, a specificity of 95.34%, and precision of 90.69%.
Comparing our results with state-of-the-art research [15,16] and the Alexnet pretrained CNN, which also uses images of the reaction of antibodies to tumor antigens (proteomic images), we observed that the classification percentage was exceeded. Through the ANOVA statistical test, we observe that the best results are statistically significant, as we can see in Table 4.
However, the literature also shows that the diagnosis of breast cancer is carried out using images of breast tissue, coupled with machine learning. It has been mentioned in various works that images of breast tissue are obtained by histopathology (Whole Slide Image—WSI), thermography, ultrasound, and mammography. In [17,19], WSI images were used, reaching an accuracy of 87% and 89.66%, respectively. In [18], thermographic images were analyzed, achieving an accuracy of 98.95%. In [21], ultrasound images are used, and they obtain an accuracy of 80.56%. In [22], the authors used two databases of mammographic images (CBIS-DDSM, INbreast) and obtain an accuracy of 95.4% and 99.7%, respectively.
The architecture of the convolutional network obtained with the DeepGA algorithm allowed us to reach an adequate performance for it and to minimize the time used to find the best configuration of the CNN. On the other hand, the time and subjectivity in the analysis of Western Blot strips continue to be reduced when compared to a proteomics specialist.
While a good rank percentage was achieved with CNN DeepGA, improvement is possible. To achieve this, as future work is proposed to change the DeepGA hyperparameters to obtain a CNN that provides a better classification percentage than the one obtained in addition to exploring the use of another classifier in the last layer of CNN DeeppGA, as well as changing the percentage of data used in training and testing.
This work allowed us to obtain a fast and efficient automatic method for the discrimination of Western Blot images of healthy patients, benign breast pathology patients, and breast cancer patients.

Author Contributions

The authors of this paper contributed to the work as follows: Conceptualization, J.-L.L.-R., R.-E.B.-M., H.-G.A.-M., T.R.-G. and E.M.-M.; methodology, J.-L.L.-R., R.-E.B.-M. and H.-G.A.-M.; software, J.-L.L.-R. and R.-E.B.-M.; validation, J.-L.L.-R., R.-E.B.-M. and H.-G.A.-M.; formal analysis, J.-L.L.-R., R.-E.B.-M. and H.-G.A.-M.; investigation, J.-L.L.-R. and R.-E.B.-M.; data curation, J.-L.L.-R. and R.-E.B.-M.; writing—original draft preparation, J.-L.L.-R., R.-E.B.-M., H.-G.A.-M. and T.R.-G.; writing—review and editing, J.-L.L.-R., R.-E.B.-M., H.-G.A.-M., T.R.-G. and E.M.-M.; supervision, H.-G.A.-M. and T.R.-G. All authors have read and agreed to the published version of the manuscript.

Funding

This research received no external funding.

Acknowledgments

The authors appreciate the help of Gustavo Vargas Hakim with the use and support of the DeepGA algorithm.

Conflicts of Interest

The authors declare no conflict of interest.

References

  1. Sung, H.; Ferlay, J.; Siegel, R.L.; Laversanne, M.; Soerjomataram, I.; Jemal, A.; Bray, F. Global Cancer Statistics 2020: GLOBOCAN Estimates of Incidence and Mortality Worldwide for 36 Cancers in 185 Countries. CA Cancer J. Clin. 2021, 71, 209–249. [Google Scholar] [CrossRef] [PubMed]
  2. Hernández-Nájera, O.; Cahuana-Hurtado, L.; Ávila-Burgos, L. Costos de atención del cáncer de mama en el Instituto de Seguridad y Servicios Sociales de los Trabajadores del Estado, México. Salud Publica Mex. 2021, 63, 538–546. [Google Scholar] [CrossRef] [PubMed]
  3. Hablemos de El Cáncer de Mama. Available online: https://www.seom.org/seomcms/images/stories/recursos/infopublico/publicaciones/HABLEMOS_CANCER_MAMA.pdf (accessed on 15 February 2023).
  4. Torres-Arreola, L.d.P.; Vladislavovna Doubova, S.C.d.M. Detección Oportuna En El Primer Nivel de Atención. Rev. Méd. Inst. Mex. Seguro Soc. 2007, 45, 157–166. [Google Scholar] [PubMed]
  5. Lara-Tamburrino, M.d.C.; Tapia-Vega, A.X.; Quiróz-Rojas, L.Y. Integración de la imagen en la patología mamaria. Gac. Mex. Oncol. 2013, 12, 116–123. [Google Scholar]
  6. Cadavid-Fernández, N.; Carretero-Barrio, I.; Moreno-Moreno, E.; Rodríguez-Villena, A.; Palacios, J.; Pérez-Mies, B. The Role of Core Needle Biopsy in Diagnostic Breast Pathology. Rev. Senol. Patol. Mamar. 2022, 35, S3–S12. [Google Scholar] [CrossRef]
  7. Chávarri-Guerra, Y.; Villarreal-Garza, C.; Liedke, P.E.; Knaul, F.; Mohar, A.; Finkelstein, D.M.; Goss, P.E. Breast Cancer in Mexico: A Growing Challenge to Health and the Health System. Lancet Oncol. 2012, 13, e335–e343. [Google Scholar] [CrossRef]
  8. Brandan, M.E. Detección del Cáncer de Mama: Estado de la Mamografía en México. Rev. Inst. Nac. Cancerol. 2006, 27, 16. [Google Scholar]
  9. Chapman, C.; Murray, A.; Chakrabarti, J.; Thorpe, A.; Woolston, C.; Sahin, U.; Barnes, A.; Robertson, J. Autoantibodies in Breast Cancer: Their Use as an Aid to Early Diagnosis. Ann. Oncol. 2007, 18, 868–873. [Google Scholar] [CrossRef]
  10. Desmetz, C.; Lacombe, J.; Mange, A.; Maudelonde, T.; Solassol, J. Autoanticorps et diagnostic précoce des cancers. Med. Sci. 2011, 27, 633–638. [Google Scholar] [CrossRef]
  11. Romo-González, T.; Esquivel-Velázquez, M.; Ostoa-Saloma, P.; Lara, C.; Zentella, A.; León-Díaz, R.; Lamoyi, E.; Larralde, C. The Network of Antigen-Antibody Reactions in Adult Women with Breast Cancer or Benign Breast Pathology or without Breast Pathology. PLoS ONE 2015, 10, e0119014. [Google Scholar] [CrossRef]
  12. Yue, W.; Wang, Z.; Chen, H.; Payne, A.; Liu, X. Machine Learning with Applications in Breast Cancer Diagnosis and Prognosis. Designs 2018, 2, 13. [Google Scholar] [CrossRef]
  13. Mahoro, E.; Akhloufi, M.A. Applying Deep Learning for Breast Cancer Detection in Radiology. Curr. Oncol. 2022, 29, 8767–8793. [Google Scholar] [CrossRef] [PubMed]
  14. Nasser, M.; Yusof, U.K. Deep Learning Based Methods for Breast Cancer Diagnosis: A Systematic Review and Future Direction. Diagnostics 2023, 13, 161. [Google Scholar] [CrossRef]
  15. Sánchez-Silva, D.M.; Acosta-Mesa, H.G.; Romo-González, T. Semi-Automatic Analysis for Unidimensional Immunoblot Images to Discriminate Breast Cancer Cases Using Time Series Data Mining. Int. J. Patt. Recogn. Artif. Intell. 2018, 32, 1860004. [Google Scholar] [CrossRef]
  16. Llaguno-Roque, J.-L.; Barrientos-Martínez, R.-E.; Acosta-Mesa, H.-G.; Romo, T. Western Blot Pattern Classification Using Convolutional Neural Networks for Breast Cancer Diagnosis. In Proceedings of the 4th Workshop on New Trends in Computational Intelligence and Applications (CIAPP 2022), Monterrey, Mexico, 24 October 2022. [Google Scholar]
  17. Alanazi, S.A.; Kamruzzaman, M.M.; Islam Sarker, M.N.; Alruwaili, M.; Alhwaiti, Y.; Alshammari, N.; Siddiqi, M.H. Boosting Breast Cancer Detection Using Convolutional Neural Network. J. Healthc. Eng. 2021, 2021, 5528622. [Google Scholar] [CrossRef]
  18. Ekici, S.; Jawzal, H. Breast Cancer Diagnosis Using Thermography and Convolutional Neural Networks. Med. Hypotheses 2020, 137, 109542. [Google Scholar] [CrossRef] [PubMed]
  19. Yamlome, P.; Akwaboah, A.D.; Marz, A.; Deo, M. Convolutional Neural Network Based Breast Cancer Histopathology Image Classification. In Proceedings of the 2020 42nd Annual International Conference of the IEEE Engineering in Medicine & Biology Society (EMBC), Montreal, QC, Canada, 20–24 July 2020; IEEE: Montreal, QC, Canada; pp. 1144–1147. [Google Scholar]
  20. Krizhevsky, A.; Sutskever, I.; Hinton, G.E. ImageNet Classification with Deep Convolutional Neural Networks. Commun. ACM 2017, 60, 84–90. [Google Scholar] [CrossRef]
  21. Xu, Z.; Yang, Q.; Li, M.; Gu, J.; Du, C.; Chen, Y.; Li, B. Predicting HER2 Status in Breast Cancer on Ultrasound Images Using Deep Learning Method. Front. Oncol. 2022, 12, 829041. [Google Scholar] [CrossRef]
  22. Jabeen, K.; Khan, M.A.; Balili, J.; Alhaisoni, M.; Almujally, N.A.; Alrashidi, H.; Tariq, U.; Cha, J.-H. BC2NetRF: Breast Cancer Classification from Mammogram Images Using Enhanced Deep Learning Features and Equilibrium-Jaya Controlled Regula Falsi-Based Features Selection. Diagnostics 2023, 13, 1238. [Google Scholar] [CrossRef]
  23. Zhu, Z.; Wang, S.-H.; Zhang, Y.-D. A Survey of Convolutional Neural Network in Breast Cancer. Comput. Model. Eng. Sci. 2023, 136, 2127–2172. [Google Scholar] [CrossRef]
  24. Baldominos, A.; Saez, Y.; Isasi, P. Evolutionary Convolutional Neural Networks: An Application to Handwriting Recognition. Neurocomputing 2018, 283, 38–52. [Google Scholar] [CrossRef]
  25. Vargas-Hákim, G.-A.; Mezura-Montes, E.; Acosta-Mesa, H.-G. Hybrid Encodings for Neuroevolution of Convolutional Neural Networks: A Case Study. In Proceedings of the GECCO’21: Genetic and Evolutionary Computation Conference, Lille, France, 10–14 July 2021; Association for Computing Machinery: New York, NY, USA; pp. 1762–1770. [Google Scholar]
  26. Macdonald, I.K.; Parsy-Kowalska, C.B.; Chapman, C.J. Autoantibodies: Opportunities for Early Cancer Detection. Trends Cancer 2017, 3, 198–213. [Google Scholar] [CrossRef]
  27. Rauf, F.; Anderson, K.S.; LaBaer, J. Autoantibodies in Early Detection of Breast Cancer. Cancer Epidemiol. Biomark. Prev. 2020, 29, 2475–2485. [Google Scholar] [CrossRef] [PubMed]
  28. Yang, R.; Han, Y.; Yi, W.; Long, Q. Autoantibodies as Biomarkers for Breast Cancer Diagnosis and Prognosis. Front. Immunol. 2022, 13, 1035402. [Google Scholar] [CrossRef] [PubMed]
  29. Stanley, K.O.; Clune, J.; Lehman, J.; Miikkulainen, R. Designing Neural Networks through Neuroevolution. Nat. Mach. Intell. 2019, 1, 24–35. [Google Scholar] [CrossRef]
  30. Sun, Y.; Xue, B.; Zhang, M.; Yen, G.G. Automatically Designing CNN Architectures Using Genetic Algorithm for Image Classification. IEEE Trans. Cybern. 2020, 50, 3840–3854. [Google Scholar] [CrossRef]
  31. Zhou, L.-Q.; Wu, X.-L.; Huang, S.-Y.; Wu, G.-G.; Ye, H.-R.; Wei, Q.; Bao, L.-Y.; Deng, Y.-B.; Li, X.-R.; Cui, X.-W.; et al. Lymph Node Metastasis Prediction from Primary Breast Cancer US Images Using Deep Learning. Radiology 2020, 294, 19–28. [Google Scholar] [CrossRef]
Figure 1. Proposed pipeline process.
Mca 28 00072 g001
Figure 2. Deep-CNN architecture.
Mca 28 00072 g002
Figure 3. Confusion matrix.
Mca 28 00072 g003
Table 1. List of parameters used in DeepGA.
ParametersValues
Population Size20
Number of Generation50
Crossover Rate0.7
Mutation Rate0.5
Tournament Size4
Table 2. Results of CNN-DeepGA performance evaluation.
Accuracy
195.83
294.82
394.76
483.33
587.77
687.50
783.48
887.50
991.67
10100.00
Average90.67
Standard deviation5.60
Table 3. Accuracy results.
ExecutionsKNN Time Series-Geometric Scaling [15] Handcrafted CNN [16] Alexnet [20]CNN-DeepGA
171.1168.8950.0095.83
266.6666.6745.9594.82
362.2264.4454.0594.76
464.4468.8939.1983.33
564.4462.2245.9587.77
660.5064.4448.6587.50
771.1171.1155.4183.48
860.5066.6754.0587.50
968.8866.6755.4191.67
1064.4464.4445.95100.00
Average65.4366.4449.4690.67
Stand. Dev.3.942.665.345.60
Table 4. Analysis of the mean and standard deviation results.
FactorNAverageStand. Dev.95% CI
KNN1065.433.94(62.52, 68.35)
Handcrafted-CNN1066.442.662(63.531, 69.357)
Alexnet pretrained CNN1049.465.34(46.55, 52.37)
CNN-DeepGA1090.675.60(87.75, 93.58)
Table 5. Metrics used to evaluate the CNN architecture obtained through DeepGA.
Metric%
Accuracy90.67
Recall90.71
Specificity95.34
Precision90.69
Disclaimer/Publisher’s Note: The statements, opinions and data contained in all publications are solely those of the individual author(s) and contributor(s) and not of MDPI and/or the editor(s). MDPI and/or the editor(s) disclaim responsibility for any injury to people or property resulting from any ideas, methods, instructions or products referred to in the content.

