Article

Oxidative Coupling of Methane in Membrane Reactors; A Techno-Economic Assessment

by
Aitor Cruellas
1,
Jelle Heezius
1,
Vincenzo Spallina
2,
Martin van Sint Annaland
1,
José Antonio Medrano
1 and
Fausto Gallucci
1,*
1
Department of Chemical Engineering and Chemistry, Eindhoven University of Technology, P.O. Box 513, 5600 MB Eindhoven, The Netherlands
2
Department of Chemical Engineering and Analytical Science, The University of Manchester, Oxford Road, Manchester M13 9PL, UK
*
Author to whom correspondence should be addressed.
Processes 2020, 8(3), 274; https://doi.org/10.3390/pr8030274
Submission received: 18 January 2020 / Revised: 10 February 2020 / Accepted: 17 February 2020 / Published: 27 February 2020
(This article belongs to the Special Issue Catalysis in Membrane Reactors)

Abstract

:
Oxidative coupling of methane (OCM) is a process to directly convert methane into ethylene. However, its ethylene yield is limited in conventional reactors by the nature of the reaction system. In this work, the integration of different membranes to increase the overall performance of the large-scale oxidative coupling of methane process has been investigated from a techno-economic point of view. A 1D membrane reactor model has been developed, and the results show that the OCM reactor yield is significantly improved when integrating either porous or dense membranes in packed bed reactors. These higher yields have a positive impact on the economics and performance of the downstream separation, resulting in a cost of ethylene production of 595–625 €/tonC2H4 depending on the type of membranes employed, 25–30% lower than the benchmark technology based on oil as feedstock (naphtha steam cracking). Despite the use of a cryogenic separation unit, the porous membranes configuration shows generally better results than dense ones because of the much larger membrane area required in the dense membranes case. In addition, the CO2 emissions of the OCM studied processes are also much lower than the benchmark technology (total CO2 emissions are reduced by 96% in the dense membranes case and by 88% in the porous membranes case, with respect to naphtha steam cracking), where the high direct CO2 emissions have a major impact on the process. However, the scalability and the issues associated with it seem to be the main constraints to the industrial application of the process, since experimental studies of these membrane reactor technologies have been carried out just on a very small scale.

1. Introduction

The oxidative coupling of methane process (OCM), which aims to substitute (at least partially) the conventional ethylene production technologies, has been widely studied by the scientific community since the 80′s [1]. The OCM technology could be included within the “fuel switching scenario” framework, which proposes to broaden the feedstocks employed to produce hydrocarbons with high added value [2,3]. The end purpose of this shifting is to direct the chemical industry towards a decarbonization, leading to a more sustainable and less CO2 pollutant way of producing valuable hydrocarbons and reduce the dependence on oil.
In the specific case of the oxidative coupling of methane, the conversion of methane is directed towards ethylene, trying to minimize the side-products, mainly CO and CO2, which significantly hampers the yield of this process [4]. This process, which requires high temperatures (around 800 °C) to break the methane C-H bond, involves catalytic reactions and it is known as the direct route for the production of ethylene from methane (reaction 1).
2   C H 4 + O 2 C 2 H 4 + 2   H 2 O    Δ H ° = 141.1   k J m o l   C H 4
However, it is also composed by many parallel and consecutive reactions [5]. The primary reactions of the process are the following (reactions 2–4):
2   C H 4 + 1 2 O 2 C 2 H 6 + H 2 O    Δ H ° = 88.4   k J m o l   C H 4
C H 4 + 2   O 2 C O 2 + 2   H 2 O    Δ H ° = 802.6   k J m o l   C H 4
C H 4 + 1 2 O 2 C O + 2   H 2    Δ H ° = 36.0   k J m o l   C H 4
As it can be observed in the reactions, the primary desired formation of ethane competes with the combustions (both complete and incomplete). The produced ethane can be subsequently dehydrogenated (both via the oxidative and the non-oxidative way) to produce ethylene, the main product of the reaction (reactions 5 and 6).
C 2 H 6 + 1 2   O 2 C 2 H 4 + H 2 O    Δ H ° = 105.4 k J m o l   C 2 H 6
C 2 H 6 C 2 H 4 + H 2    Δ H ° = 136.4   k J m o l   C 2 H 6
During this dehydrogenation, the undesired combustions and/or steam reforming of ethane and/or ethylene are also likely to occur. Overall, the selectivity towards ethylene is hindered by these undesired reactions, leading to the typical “conversion-selectivity problem”. That is, low selectivity towards the desired products are expected when CH4 conversion is increased and high C2′s selectivity can just be kept when the methane conversion is carefully limited. Furthermore, the overall reaction is exothermic, leading to the possible formation of hotspots that lower the reactor yield unless a proper reactor cooling and heat management is carried out, as experimentally demonstrated in conventional packed bed reactors, widely studied for OCM [6]. There are many alternatives proposed in the open literature to deal with it [7], and they suggest that a deeper understanding of the mass and heat transfer in the system is required to accordingly modify the conventional reactor designs [8,9,10]. On the other hand, the heat generated in the OCM reaction system can be turned into an advantage if it is properly handled, as the energy released can be used to produce energy/heat, thus reducing the need of electricity import [11,12].
Nowadays, the research on OCM technology is based mostly in obtaining improved catalysts formulations to increase the reactor performance. This has resulted in continuous improvement using advanced characterization techniques [13,14,15] that help understand the overall reaction mechanism. In addition, the search for OCM catalysts which could be active at lower temperatures has gained relevance in the last years [16,17,18,19]. Another possibility to increase the OCM performance is the use of the membrane reactor technology, which has arisen in the last years as a rapid and feasible reactor configuration alternative to enhance the yield of the process [20,21,22]. In a membrane reactor, the oxygen can be distributed along the reactor, favoring the selectivity towards the coupling reaction (reaction 3) over the oxidation ones [4,5,7,23]. Moreover, by distributing the oxygen along the reactor, the formation of hotspots is minimized and results in an easier heat management.
In a recent work [12], it has been demonstrated that an ethylene yield of 15% as for the current OCM state-of-the-art leads to a higher production cost that cannot compete with the conventional ethylene production technologies. This poor yield, which leads to a very expensive separation train of the process (the separation train becomes very intensive because of the large and broad amount of undesired by-products formed during the OCM reaction because of the very low yield achieved), is the main cause of the high ethylene cost achieved with this technology.
The results of that work also indicate that nowadays the cost of ethylene produced from OCM technology can compete with the naphtha steam cracking only if a 25–30% reactor yield is reached. This is possible by improving the catalysts reactivity as well as by developing intensified reactor configurations. In the latter case, as it would be with a membrane reactor, the chances of competing with the conventional ethylene production technologies would be significantly increased because at higher conversion and selectivity, as it is theoretically to occur with this configuration [6], the necessity of importing electricity, shown as one of the main constrains of the conventional OCM [12], is expected to be reduced due to the easier separation train of the process which is carried out at cryogenic conditions.
Therefore, in this work a techno-economic analysis on the membrane reactor configuration for OCM has been carried out following a similar methodology. From the authors’ knowledge, this work represents the first time that the industrial viability of this OCM configuration, widely used experimentally, will be evaluated from a process’ performance point of view. In addition, the membrane reactor configuration will be compared with the conventional OCM (in a packed bed), highlighting the changes that the different reactor configurations require in the process and analyzing the influence of these modifications. Because of their suitability to operate in a similar temperature range as OCM reaction takes place, dense oxygen (MIEC) membranes are, ideally, the most interesting to be implemented for the process, since the O2 separation from air is carried out in-situ in the reactor by the membranes themselves, thus avoiding the use of the energy-intensive air separation unit. However, their O2 flux is relatively low [24] and can deteriorate in the presence of CO2 or H2O. Therefore, not just these membranes are selected for the comparison, but also the use of porous tubes, from where pure O2 can be fed into the reaction prior purification in an air separation unit.
In the following section, the methodology selected for this techno-economic comparison will be given, followed by a detailed description of the OCM plants considered for the analysis. Subsequently, the results of this study will be presented, and a sensitivity analysis on the main variables discussed. Finally, the main conclusions of this work, as well as the potential improvements for the OCM technology, will be given.

2. Methodology

This work follows the same approach as the one described in a recent publication [12], where the OCM reactor is the base of the whole process scheme. From a reactor point of view, the analysis has been based on three different indicators, shown in Equations (1)–(3):
CH 4   conversion   X C H 4 = F i n C H 4 F o u t C H 4   F i n C H 4
C 2   selectivity   S C 2 = 2 ( F o u t C 2 H 4 +   F o u t C 2 H 6   F i n C 2 H 4   F i n C 2 H 6 )   F i n C H 4   F o u t C H 4
C 2   yield   Y C 2 = X C H 4 S C 2
These indicators are obtained with an in-house mono-dimensional plug flow OCM reactor model integrated in the process design software Aspen Plus. Within the Aspen model, also an economic evaluator has been integrated, such that the economic evaluation is carried out simultaneously to the thermodynamic assessments. This economic evaluation has been performed by using the well-known NETL (National Energy Technology Laboratory) method [25], which divides the expenses into operational (OPEX) and capital (CAPEX) expenditures in order to determine the normalized cost of ethylene (Equation (4)):
C o s t   o f   e t h y l e n e   [ t o n ] = ( O P E X C 2 H 4 + C A P E X C 2 H 4 + C O & M ,   f i x e d ) y ( m ˙ C 2 H 4 ) y
where ( m ˙ C 2 H 4 ) y is the flow rate of ethylene produced per year (tonC2H4/year) and C O & M ,   f i x e d are the yearly operating and maintenance costs.
The values used to carry out these O&M calculations are summarized in Table 1:
The OPEX costs calculation of the plant have been calculated as follows:
O P E X C 2 H 4 = ( O P E X f e e d s t o c k + O P E X e l e c t r i c i t y + O P E X O & M + O P E X c a t a l y s t ) y [ M y ]
And:
O P E X f e e d s t o c k = C i m ˙ i 3600 h y e a r 10 6 [ M y ]
where Ci is the specific cost of natural gas per kilogram of ethylene produced (€/kg), mi is the flow rate of ethylene produced from the designed plant (kg/s), and hyear are the number of hours per year in which the plant is assumed to be running (7884 effective hours per year are considered).
Differently, C A P E X C 2 H 4 has been calculated as indicated in Table 2.
The capital charge factor, which depends on some financial parameters such as inflation rate and it is weighted along the lifetime of the plant, has been taken equal to 0.1 [11]. The scale-up factor correlation, shown below, has been employed to calculate the cost of every single unit of the plant and later merged into the calculation of the total bare erected cost of the plant:
C = n C 0 ( S n S 0 ) f
where C0 is the cost of the component based on literature data, S0 is the capacity of the scaling parameter which is based on literature data, S is the capacity that has to be scaled, n is the number of units to be considered, and the f is the scaling factor. The prices and scaling parameters of all the units used in this work are taken from the work of Spallina et al. [11].
To allow for a fair comparison, the size of the plant has also been kept the same as in the previous work [12], that is, the target of the simulations is to produce 31.9 kgC2H4/s, which equals to a production of 1 million-ton of ethylene per year and it is assumed that this plant is located in Europe.
Additional to the procedure employed to calculate the most relevant economic parameters, an environmental performance analysis was also carried out within this study, where the environmental indicators are shown in Table 3.
The direct CO2 emissions refer to the fuel that is burnt in the plant, which is used in the plant for heat integration and electricity generation. Differently, the indirect CO2 emissions refer to the net production/consumption of energy in the plant. If electricity needs to be imported in the plant, this will bring along the CO2 emissions happening during the electricity generation. Similarly, if the plant has a surplus of electricity that can be exported, this will result in a decrease in carbon emissions (considered as negative CO2 emissions) as this electricity is already produced. The same analogy is considered for the case of heat import/export. The carbon emissions values are taken from the work of Spallina et al. [11], where it is assumed that the imported/exported electricity comes from a natural gas combined cycle plant (NGCC) with an efficiency of 58% emitting 96 gCO2/MJ (ECO2,CC) [26]. In the case of the imported/exported heat, it is assumed that it is produced in an industrial boiler (90% efficiency) with 63 gCO2/MJ (ECO2,TH) emissions [27,28].
Finally, the undesired reactions occurring within the OCM reactor are the last source of CO2 (CO2 captured). This CO2, together with the rest of the products and the unconverted reactants, goes subsequently to the separation train, where all this CO2 is captured by means of an acid gas removal ( m ˙ C O 2 , c a p t u r e d ).

3. Model Description

In this section, first the reactor model used for the OCM simulations is presented, and subsequently the overall processes.

3.1. Oxidative Coupling of Methane (OCM) Membrane Reactor Model

The OCM reactor has been simulated by means of a 1D plug-flow reactor model. The core of the model is similar to one described in a previous work [12], where the main characteristics and parameters selected (see Table 4) are extensively justified.
The developed reactor model has been expanded in this work by adding the membranes from where oxygen will be fed into the OCM reactor. Perovskites and fluorites are the most common MIEC membranes investigated in literature [22]. Perovskites achieve generally higher O2 permeation fluxes since they are able to transport both ions and electrons. Differently, fluorites present high ionic conductivity but very poor electronic conductivity. That is why they are often mixed with some electronic conductors (which can be ceramic or metallic) to form the so-called “dual-phase” O2 membranes. BSCF (Ba0.5Sr0.5Co0.8Fe0.2O3-δ) membranes are one of the most common perovskite materials and, although it is known that they can suffer stability issues when in contact with some species produced during OCM (like CO2) [22], this type of mixed ionic-electronic conducting (MIEC) membranes have been selected to run the simulations of the dense membranes case in this work, due to its well-known permeation behavior [24]. These membranes are considered to be tubular (allowing for an easier integration in the membrane reactor) and supported, that is, a thin oxygen selective layer (in the range of micrometers) of BSCF in this case is added on top of a porous ceramic support which helps increasing the mechanical stability of the membrane.
The oxygen flux to describe these membranes is shown in Equation (8):
J m = D v k r ( ( p i m , a ) n ( p i m , f ) n ) 2 δ k f ( p i m , a p i m , f ) n + D v ( ( p i m , a ) n + ( p i m , f ) n )
where p i m , a is the pressure of the specie i (oxygen) in the air side (retentate), p i m , f is the pressure of the specie i (oxygen) in the fuel side (permeate), and the exponent n is set to 0.5. δ is the thickness of the selective layer of the membrane and Dv, kr, and kf are parameters characteristics of the membrane which depend on temperature through an Arrhenius-type relation. As mentioned previously, the permeability parameters correspond to a BSCF membrane and are shown in Table 5.
As shown in Equation (8) [24], the permeation of the selected membranes, at a given temperature, is constant and independent from their thickness and pressure applied when the oxygen partial pressure at the reactor side is close to 0, a phenomena occurring during OCM reaction because of the fast oxygen consumption in the permeate (reaction) side, which impedes its accumulation. If that is the case, most of the terms of the equation are cancelled out, being the oxygen permeation determined by kr, the constant of the reaction rate for the oxygen recombination after its permeation (in form of ions) through the membrane bulk.
Differently, porous membranes are not selective to oxygen, and the driving force for these membranes is governed by the total pressure difference between the retentate and permeate side. For simplicity of the model, a uniform permeation profile along the reactor axial length has been considered (back permeation and other phenomena that can reduce the performance of the porous membrane reactor are not considered in the 1D model). The membranes have been assumed to be asymmetric Al2O3 with a constant oxygen flux of 0.25 mol/m2/s (5 × 10⁻⁶ mol/m2/s/Pa with an assumed constant pressure difference of 0.5 bar between retentate and permeate). These values are typically found in the literature for this type of porous membrane [29]. Since the optimization of the membranes formulation and operating condition is out-of-the-scope of this work, the selected assumptions to calculate the oxygen permeation lead to a fixed reactor performance in terms of CH4 conversion, C2 selectivity and C2 yield for both the porous and the dense membranes case, while major differences still remain in the process scheme due to the different integration. Oppositely to dense membranes, the permeation flux of this type of membranes can be easily tuned by modifying their physical properties (material, thickness, pore size) or by changing the retentate–permeate pressure difference, although the back-permeation effect needs to be accounted for. This fact provides several advantages to these membranes. For instance, thicker (tubular) membranes can be integrated in the reactor, thus increasing their mechanical stability and facilitating successful operation of long-term experiments. This “membrane tuning” also allows for their application in a broader range of conditions (mainly pressures and temperatures). On the other side, the impossibility of tuning the membrane parameters of dense membranes gives some constraints to their application. For instance, the fact that the oxygen permeation increases with temperature and is significant just above 800 °C (at least for the specific membrane selected for this work) limits their operability. These constraints also result in the necessity of finding a compromise between membrane properties and process parameters, such as the operating conditions in the reactor are optimal to simultaneously ensure a proper membrane operation and a decent reaction operation when comparing both types of membranes.
Differently to the conventional packed bed OCM reactor work [12], where the optimized length of the reactor depends on the inlet conditions, in this case the reactor length has been fixed to 2 m for simplicity of all the calculations.

3.2. Dense Membrane Reactor OCM Process Scheme

As described in Section 3.1, BSCF membranes will be integrated in the OCM reactor for the dense membrane reactor OCM process. The scheme of this plant is shown in Figure 1.
In this process scheme, air is first compressed up to 10 bar and pre-heated before being fed through the membranes, where oxygen will permeate towards the reaction section. Subsequently, the mid pressure and high temperature depleted air stream leaving the reactor from inside the membranes is used to burn the purge of the recycle stream in the combustion chamber of a gas turbine to generate part of the electricity required in the plant. Differently to other OCM configurations, no cooling tubes inside the reactor are installed, since the air inside the membranes acts also as a coolant. That is, the heat released because of the exothermic reactions is taken by the air fed through the membranes. Thereby, it can be said that the dense membranes are also acting as cooling tubes. The amount of air injected in the retentate side (from which then oxygen permeates) is adjusted in each of the simulations to balance the heat released by the reaction and to assure isothermal conditions in the reactor. This OCM reactor configuration does not have any influence on the configuration of the separation train (but only on its CAPEX/OPEX) [12]. Firstly, the outlet reactor stream is quenched to stop the gas-phase reactions that can negatively affect the selectivity of the process. Subsequently, the gas is cooled to an ambient temperature and fed to the acid gas removal absorption unit, where CO2 is purified. The next step is the purification of ethylene by means of two cryogenic distillation columns; in the first one (de-methanizer), C2 components are separated from the other incondensable species, while in the second one (de-ethanizer) pure ethylene is obtained while ethane is recycled into the reactor. The remaining species coming from the de-methanizer are fed into the methanizer, in which CO and H2 are converted back into methane before recycling them back to the OCM reactor. Part of this recirculation stream is purged to be burnt in a boiler, thus producing electricity required by the system. In this process scheme, heat is integrated by producing high pressure steam to be fed in a steam cycle, and the cryogenic temperatures are obtained by means of a refrigeration cycle. The mass balance of the base-case simulation of this configuration is shown in Appendix A.

3.3. Porous Membrane Reactor OCM Process Scheme

The process scheme of the porous membrane reactor case is shown in Figure 2.
In this case, the air separation is carried out in the cryogenic air separation unit. The separated oxygen, with a purity of 95% (being the remaining 5% N2 and Ar), is evenly fed by means of the porous membranes into the reactor, where OCM takes place. The integration of porous membranes in the reactor is combined with the integration of cooling tubes (considered to have a heat transfer coefficient of 100 W/m2 × K [31]) to remove the heat released when performing OCM. High pressure liquid water is fed through these tubes, producing steam when carrying out the reaction. As it can be seen in the scheme, the steam produced is further used in the steam cycle to produce electricity. Since the heat of the reaction is managed differently to the dense membranes case, no gas turbine is included in this process scheme. All the units located downstream the reactor are identical as in the dense membrane reactor flowsheet. Similarly, a complete heat and material balance for the base-case simulation are given in Appendix A.

4. Results

The different process schemes previously described will be analysed and compared in this section. The processes employing a membrane reactor, which have been detailed in this work, will be firstly detailed. Subsequently, a techno-economic comparison between the selected process schemes will be carried out, focusing on the differences that the different reactor configurations imply on the rest of the plant.

4.1. Membrane Reactor OCM Process Scheme

As previously explained, two different configurations (employing a dense and a porous membrane reactor) have been considered to study the feasibility of the membrane reactor. The integration of membranes is expected to increase the C2 reactor yield because of the even distribution of the oxygen along all the reactor length, hence favoring the desired reactions over the undesired ones. In this work, first a complete sensitivity analysis has been carried out on a reactor level, where the reaction temperature and the CH4/O2 ratio has been varied. Since the economic evaluation calculator is embedded in the Aspen software, though this sensitivity also the economic indicators could be obtained. To study both configurations in detail, Figure 3 is presented. Since both dense and porous membranes distribute the oxygen homogeneously along the reactor length (see assumptions in Section 3.1), no reactor performance differences are found between these configurations and therefore the C2 yield reported in Figure 3 is valid for both the dense and the porous membrane reactor cases. However, the ethylene price obtained for each case studied differ between the porous and the dense configuration.
It can be observed in the graph that the reactor yield achieved with the OCM membrane reactor configurations (both porous and dense), ranges from approximately 30% to above 60%, and it clearly overcomes the maximum reactor yield obtained with the conventional packed bed reactor (around 14% in the case in which the lowest ethylene price was obtained) [6,12]. This increase in the reactor performance is translated into a steep decrease in the ethylene price calculated from the process plant. When reaching higher yields, like in this case, the process becomes more efficient, reducing the energy requirement for the refrigeration in the separation train and decreasing the amount of natural gas required to reach the selected C2H4 production (1 MTPY) because of the higher conversion and selectivity reached in the reactor towards the desired products.
The maximum C2 reactor yield is found to be 63.1% (84.8% CH4 conversion with 74.5% C2 selectivity), achieved at 820 °C and with a CH4/O2 ratio of 1.5. The temperature at which this maximum is found maximizes the C2 selectivity, as it is known to be in the range of “optimal operating conditions” while the big amounts of oxygen fed (low CH4/O2 ratio) maximize the conversion of CH4. However, the highest reactor yield does not imply a minimization in the ethylene price, that is, the optimal operating conditions in terms of minimization of the C2H4 price are not found at the maximum C2 reactor yield. This conclusion was also withdrawn in the OCM conventional packed bed reactor case [12], meaning that the final ethylene price is not just a function of the C2 reactor performance, but also to all the equipment associated to the process plant and the utilities required.
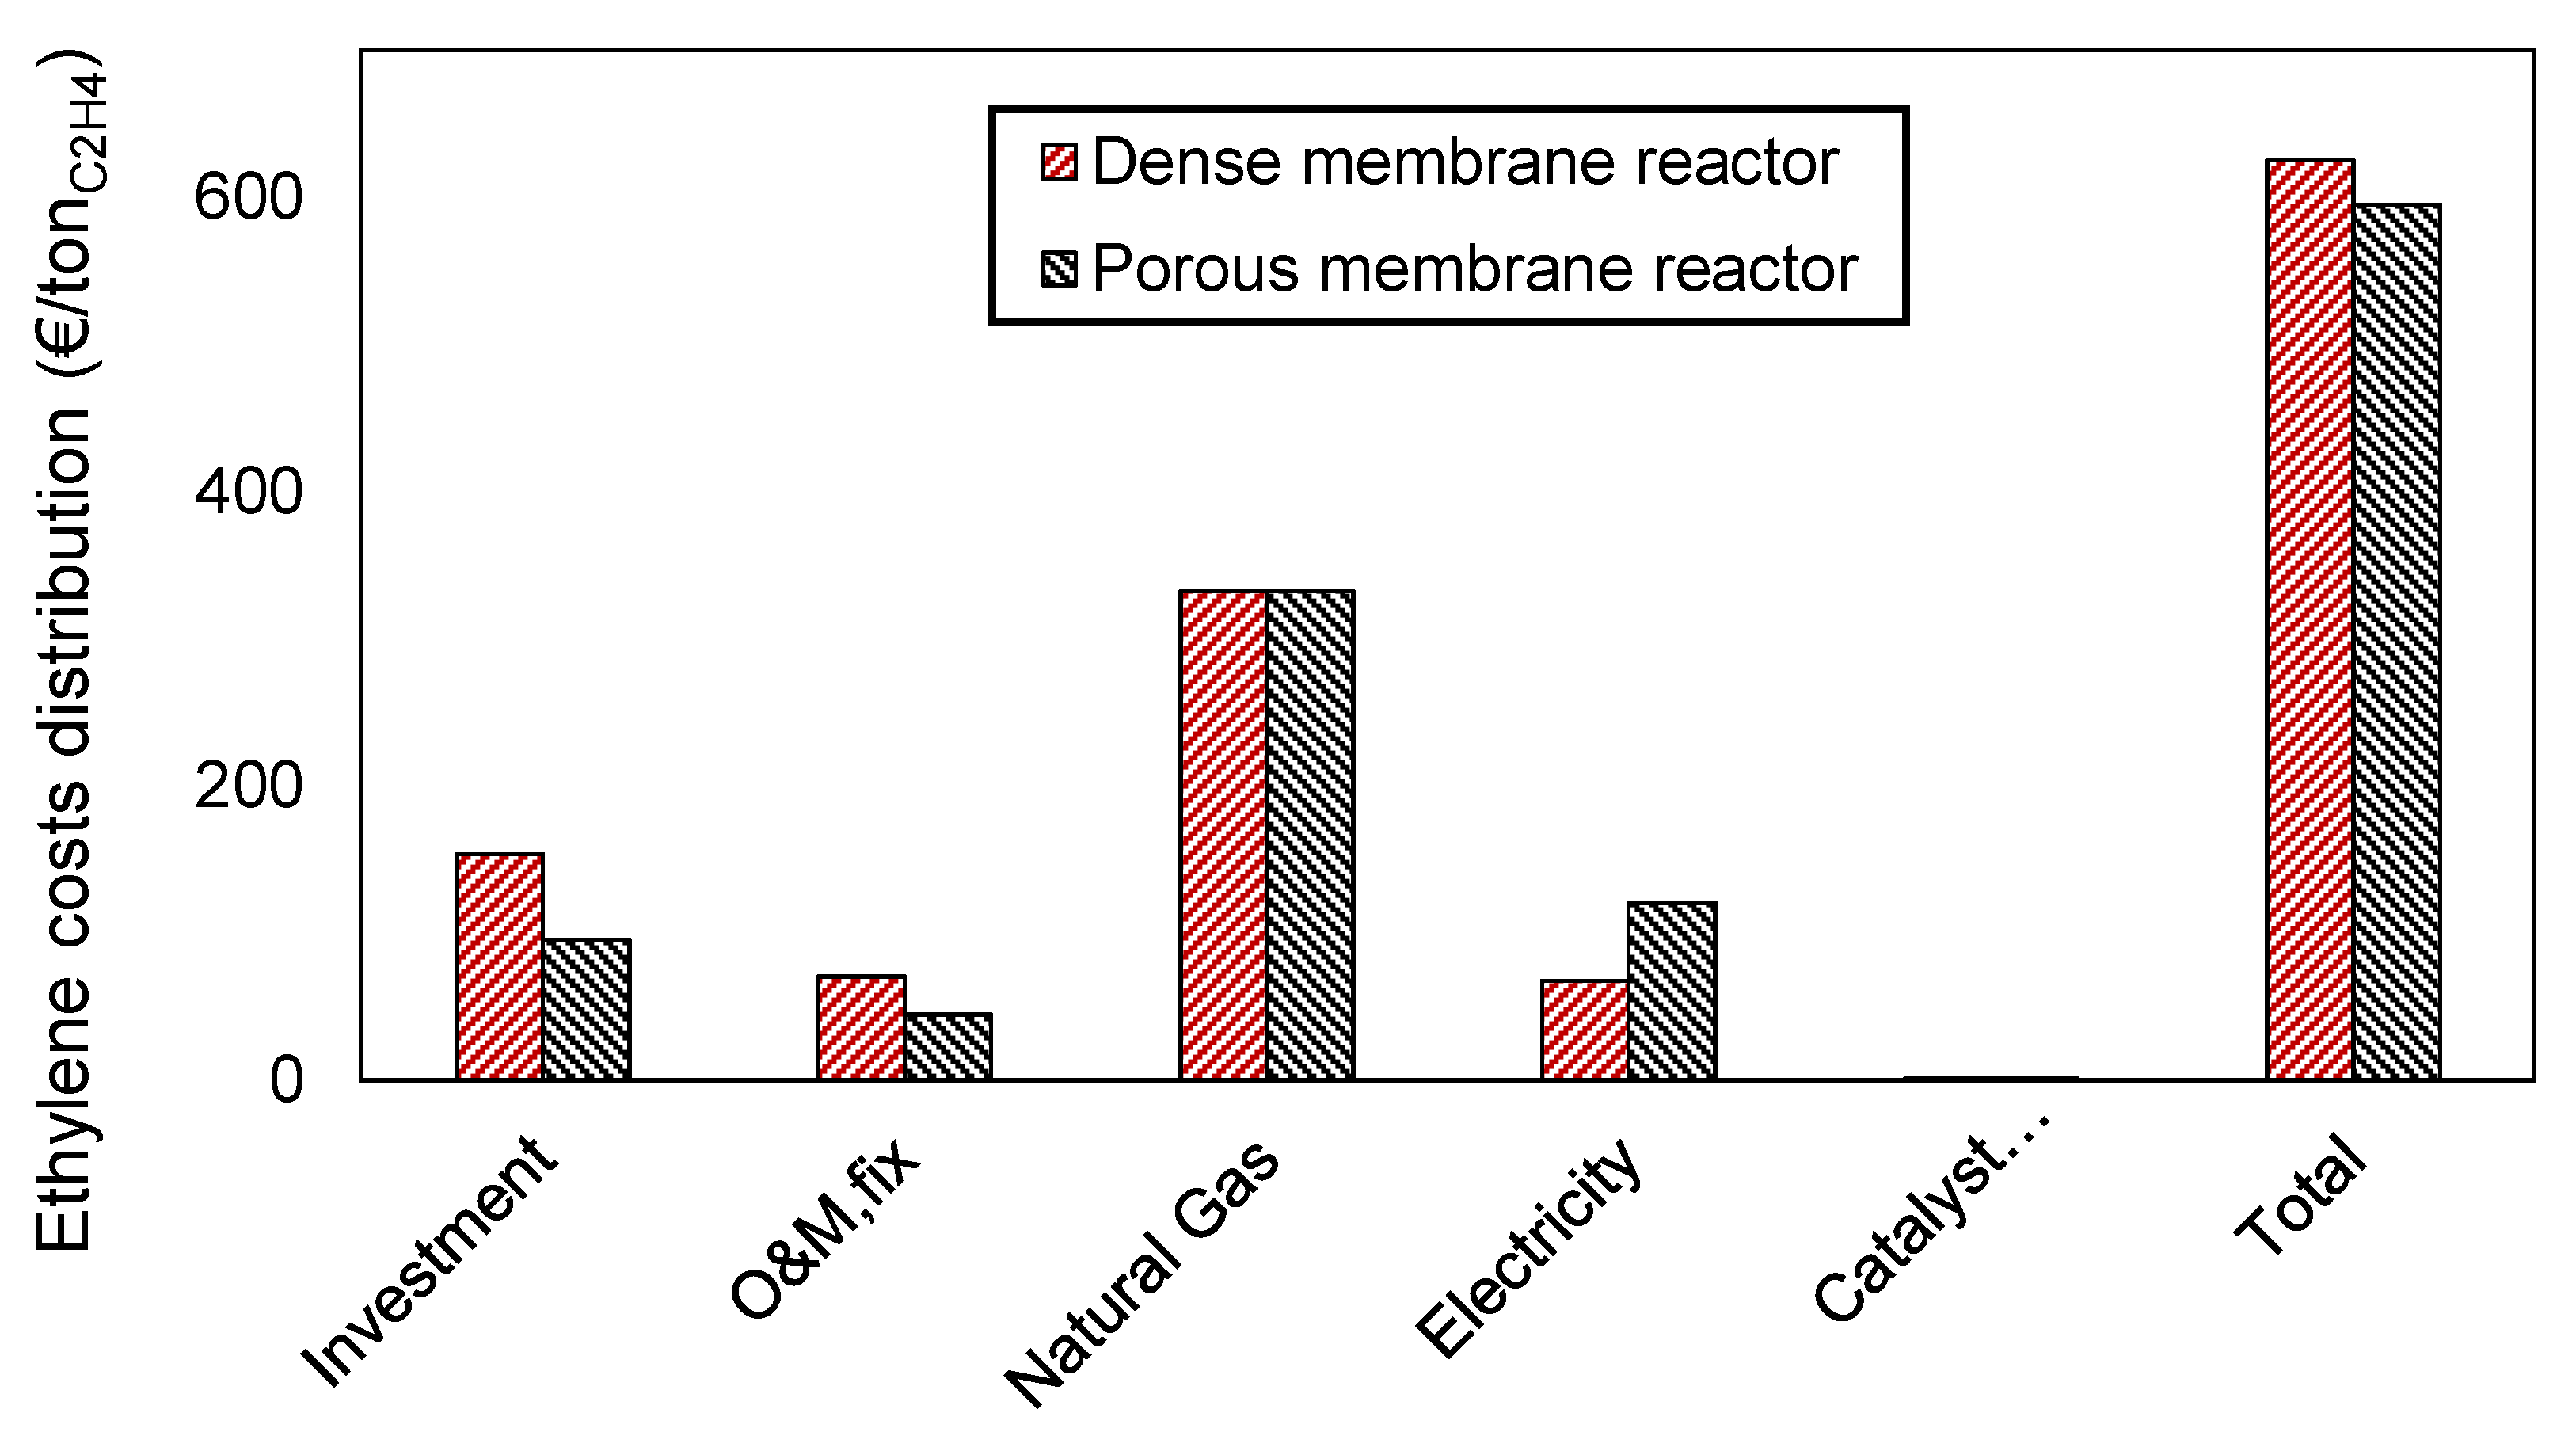
The lowest ethylene price for the case of the MIEC membranes reactor is found to be 625 €/tonC2H4 at 800 °C and a CH4/O2 ratio of 2.5 while for the porous membranes case is 595 €/tonC2H4 (again at 800 °C and CH4/O2 ratio of 2.5). As shown in 
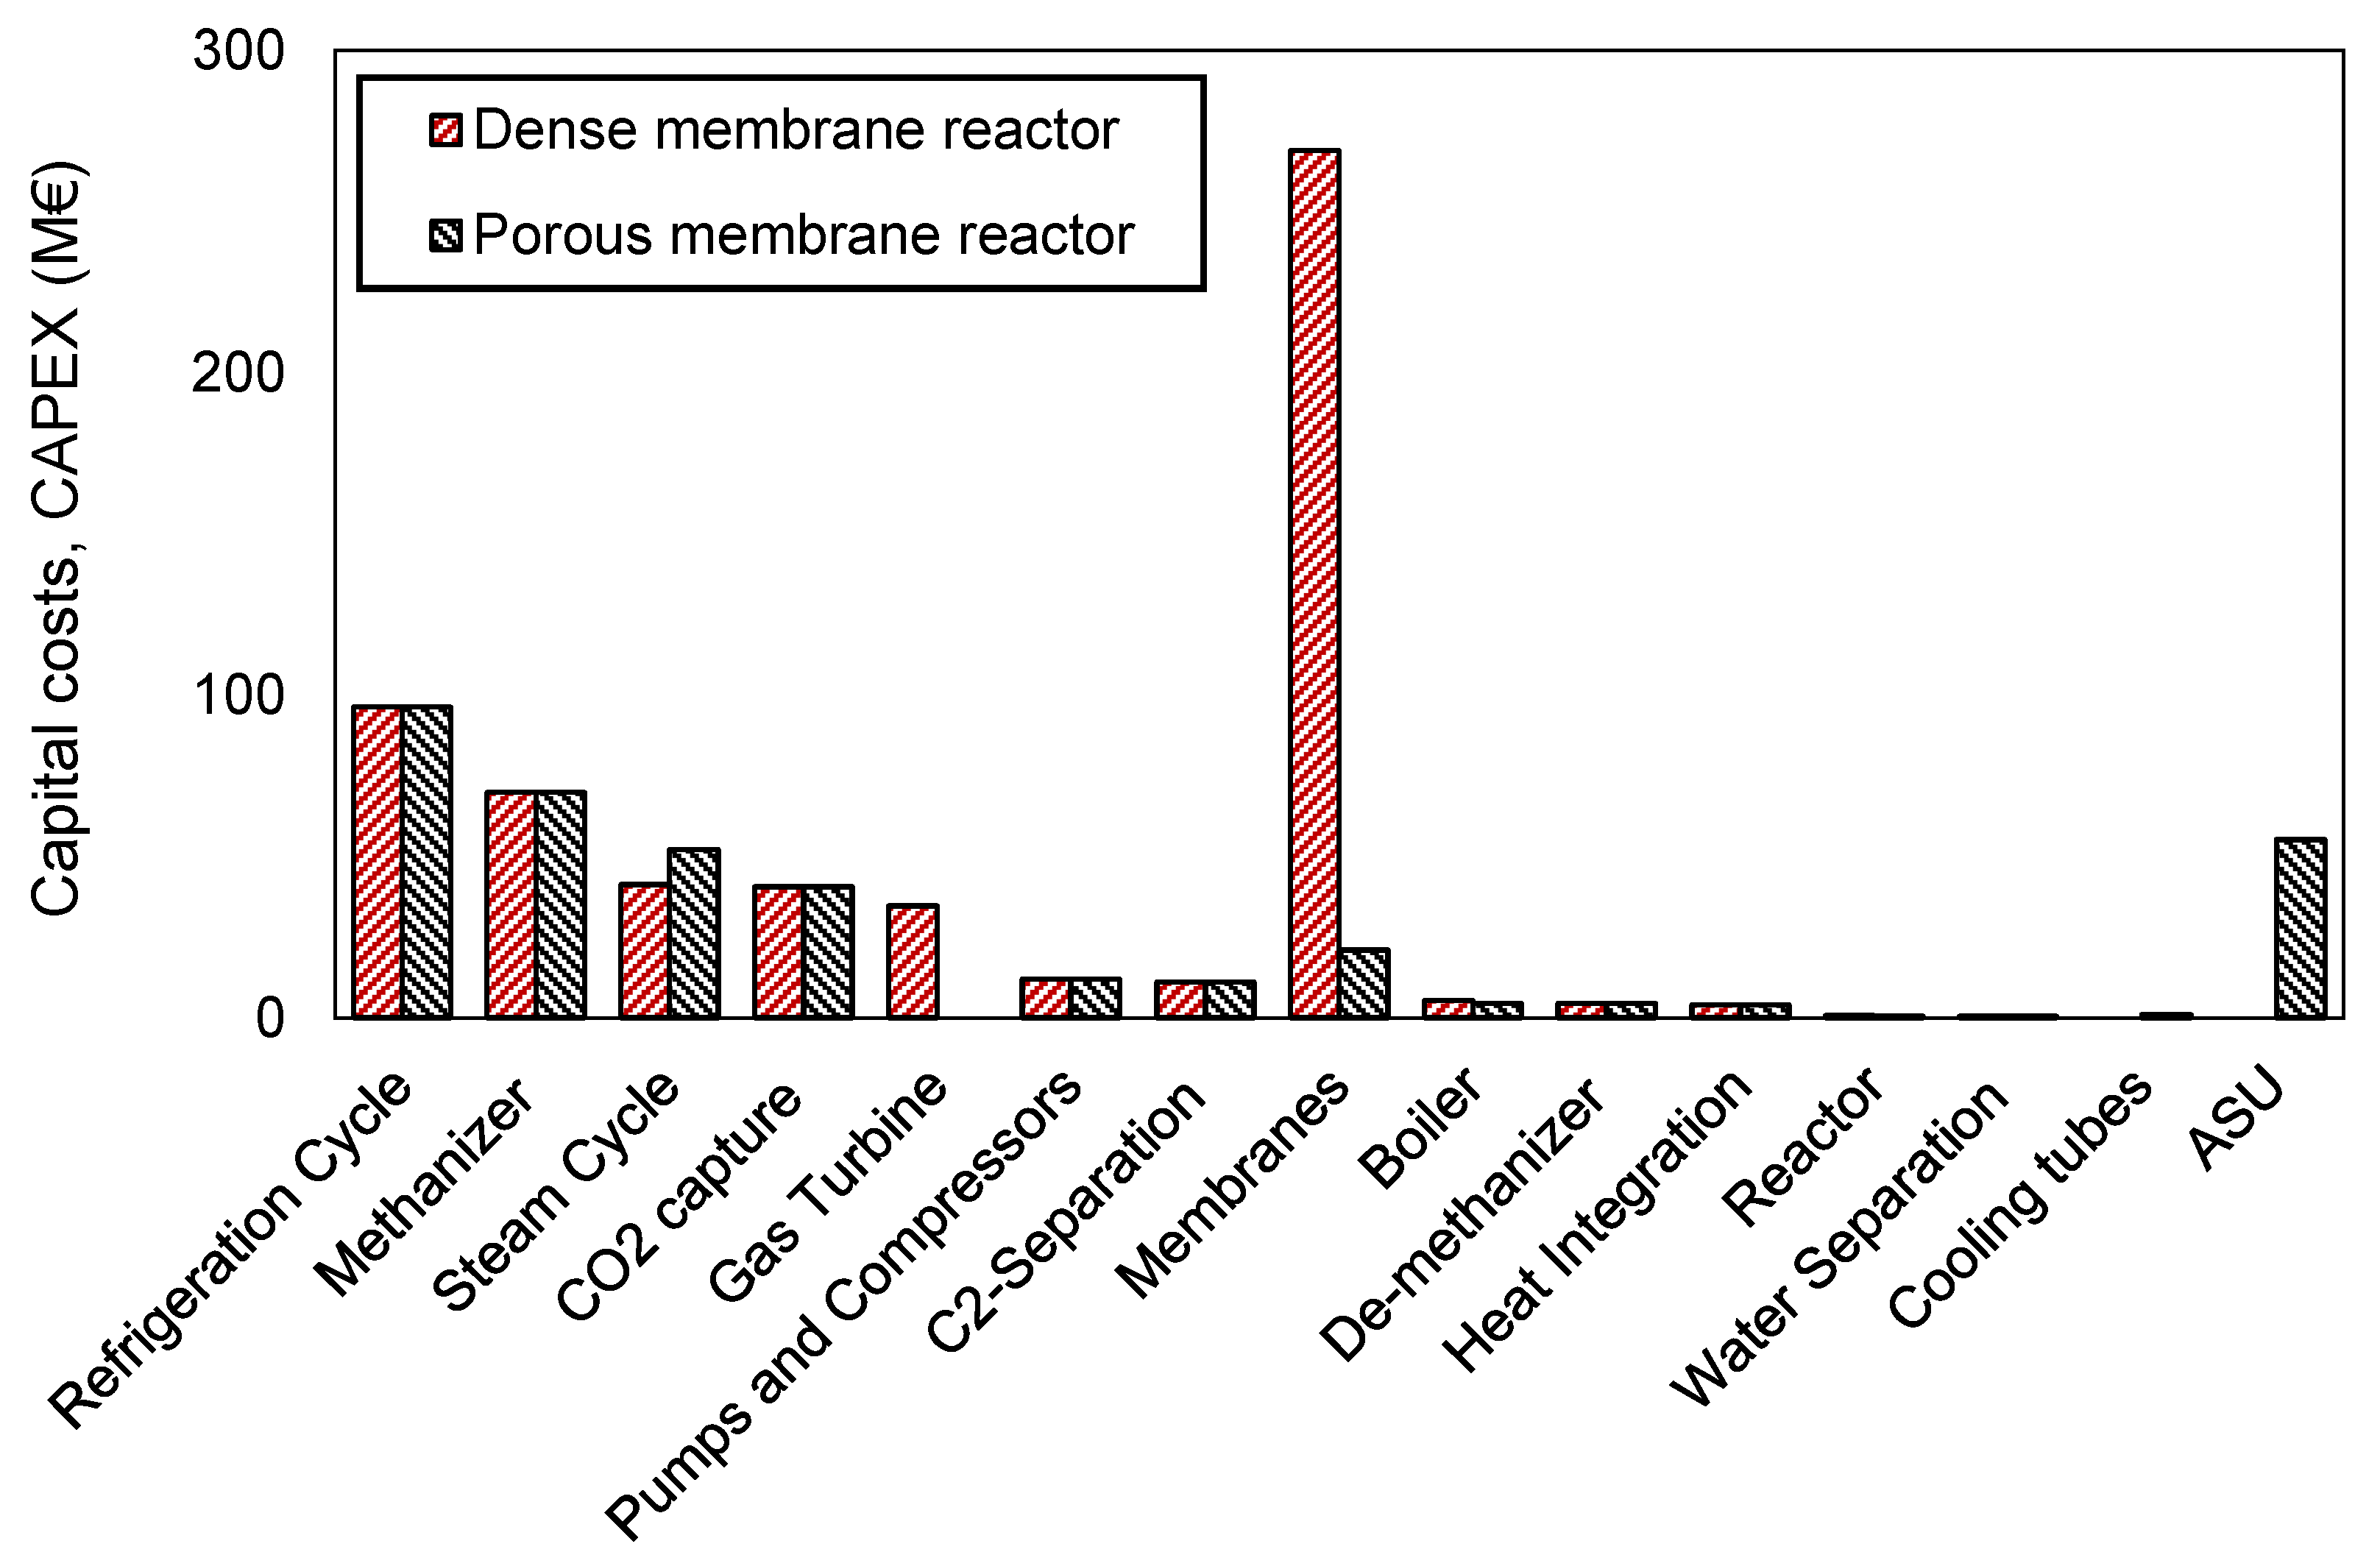
Figure 3, the ethylene price is generally 30–70 € more expensive when employing dense membranes compared to the porous membranes configuration. In order to identify the differences between the two plants, the CAPEX and OPEX of the optimal cases are here presented. In terms of CAPEX, the disaggregated unit costs are shown in Figure 4.
The total plant cost (BEC) of the two plants is 367 M€ for the porous configuration and 590 M€ for the dense configuration. It is clearly seen that the biggest difference between both configurations relates to the membrane cost. Dense membranes are considered to be supported, namely a porous support in which a dense layer of a material selective to oxygen is coated. Because of that, they will always be more expensive than the porous membranes (respectively 1000 €/m2 and 700 €/m2 in this work). However, this price difference cannot explain the large difference in the total cost of the membranes. This remarkable difference is associated to the flux of oxygen that dense and porous membranes can offer. The oxygen flux of porous membranes is roughly one order of magnitude higher than the dense ones, this being translated in a reduction of the membrane area required to feed the desired amount of oxygen into the reactor (the membrane area required for the optimal porous membranes case is 6010 m2 while for the dense case is 53,812 m2). Considering that BSCF membranes are employed for these calculations and that these membranes are known to have high oxygen fluxes (among oxygen-selective membranes), the differences shown here could be even increased when employing the flux of a CO2-tolerant dense membrane.
Therefore, the repercussion of the membrane cost part in the total CAPEX cost is major in the case of the dense membranes, accounting for almost 50% of the total CAPEX, while it decreases to 6% when porous membranes are employed.
The second important variation between both configurations is the need of the air separation unit (ASU) to feed pure oxygen into the reactor in the case of the porous membranes’ reactor. This unit accounts in this specific case for roughly 15% of the total plant cost (≈55 M€), although in some conditions it can be up to 30% of all the CAPEX. The need of an ASU does not just impact the investments, but also the utilities, as electricity needs to be supplied to this unit in order to operate at cryogenic conditions.
Differently, the cost caused by the integration of cooling tubes in the porous membrane reactor is negligible when compared to the total CAPEX cost. Through these tubes, heat is recovered by producing high pressure steam, which is subsequently used in the steam cycle, posing a benefit in the net electricity generation compared to the dense membrane case. This argumentation is supported by the fact that the cost of the steam cycle in the porous membrane case is larger, meaning that larger steam turbine and heat rejection units are required.
On the other hand, in the dense membranes case technology, the heat removed from the reactor is taken by the depleted air at the outlet of the MIEC membranes. This high temperature high-pressure air burns part of the recycle stream, increasing the temperature and accelerating the gas velocity to drive the gas turbine, where electricity is produced. Opposite to the porous case, the heat management strategy for the dense membranes case is translated into the gas turbine cost, and a surplus of electricity generated.
The disaggregated ethylene cost, containing OPEX (electricity, natural gas, and catalyst replacement) and CAPEX (investment and O&M), is shown in Figure 5.
In both membrane reactors, the cost of the raw material emerges as the main contributor to the final ethylene cost. It should be mentioned here that this fact is strongly influenced by the selection of the location of the plant (Europe), which subsequently determines the price and composition of natural gas. As typically happens for chemical plants, and as presented in our previous work on conventional OCM packed bed case [12], the OPEX cost weights more than the CAPEX (showed in the graph as “investment”, referring to the cost of all the units shown in Figure 4, and “O&Mfix”). The higher yearly fixed costs are related to a higher cost of maintenance for the dense membranes and, overall, it can be said that the cost of the dense membranes is the main contributor to the higher price with the dense configuration.

4.1.1. Sensitivity on Membrane Costs

To analyse in detail how the cost of the membranes affects the overall ethylene price calculated in each of the selected configurations, a sensitivity analysis has been carried out.
As can be seen in Figure 6, the cost of the membranes in both configurations has been varied in a wide range to investigate its effect in the final ethylene price. This sensitivity is essential because of the lack of data regarding this parameter when considering industrial applications, since none of the membranes simulated here have been produced at industrial scale for the specific OCM process in such large quantity.
The fact that the trend line in the dense membranes case is much steeper than the porous one indicates that this configuration is more impacted by the membranes price. As explained before, this mostly relates to the larger membrane area required for this configuration. Differently, the porous configuration remains (almost) unaffected by the increment in the membrane price, since the increase in price considered for this sensitivity is not sufficient to significantly influence the relatively low membrane area required. Subsequently, it can be said that the porous membranes case is independent from the membrane’s price (in the price range analysed), this factor being especially relevant because of the uncertainty of their industrial scale price.
Going to the specific values, it is noticeable that both dense and porous membranes are competitive in most of the cases analysed compared with the conventional naphtha steam cracking, resulting in an ethylene price lower than 1000 €/tonC2H4. The different tendency of both configurations is also remarkable: the lower the price of the membranes, the more competitive the dense membranes case will be in comparison with the porous membranes one. Actually, if the fabrication of dense membranes does not overcome 1000 €/m2, this technology can already compete with the porous membranes one while if the price is set below 500 €/m2 starts to be even more convenient because the investment cost will drop significantly while no relevant effects are detected in the porous configuration where the ASU affects significantly the overall costing.
As previously mentioned, the lack of industrial scale dense membranes gives uncertainty to their predicted cost, which has been used to run all the simulations in this work. That is the main reason why it is essential to highlight that the characteristics of the employed membranes in a hypothetic OCM reactor can strongly modify the economics of the process. For instance, the performance of dense membranes is currently limited by the relatively low O2 flux achieved with this type of membranes. If the oxygen flux considered in this work is doubled because of the employment of a different membrane, the membrane area required in the process would be halved and also the cost associated to these membranes. A proper selection of the membrane characteristics can make the oxygen flux through the membrane to vary in even more than one order of magnitude, thus affecting the total membrane area and the total cost of the membranes. In particular, the type of membrane (supported or self-supported), membrane material (fluorite, perovskite), membrane thickness, membranes lifetime (currently set to 5 years), or recyclability to a certain extent are examples of parameters that need to be addressed for a proper membrane reactor design, given their effect in the final total plant cost. A trade-off between high oxygen flux, low cost, and membrane stability and durability under OCM conditions (both chemical and mechanical) should be made to find the most suitable membrane for this specific application.

4.1.2. Analysis of Electricity Production/Consumption

Besides the difference in investment and fixed costs, the rest of OPEX variables seems to be very similar when comparing porous and dense membranes configurations, although some differences caused by the modifications in the plant scheme can be analysed. Even if the net electricity demand is very similar for both configurations, there is a different distribution of the energy demand throughout the plant as presented in Table 6.
The steam cycle in the porous membrane configuration produces almost twice the electricity than in the dense membranes case. This is mainly related to the different strategy used to remove the heat produced by the OCM reaction. In the porous membranes process scheme, the cooling tubes placed inside the OCM reactor allow the generation of an additional amount of HP steam, thus increasing the power produced in the steam cycle. On the contrary, the heat of reaction is taken by the depleted air in the dense membranes process case. This hot stream is used to burn part of the recirculated gases, hence producing electricity in a gas turbine. Therefore, the electricity production/consumption distribution clearly evidences the different approaches taken for the heat management inside the reactor in both configurations. The second relevant difference relates, as aforementioned, to the air separation unit. It can be seen in the table that the air separation unit does not only affect the CAPEX, but also has a non-negligible influence to the electricity balance of the process, being responsible for around 30% of the total electricity that needs to be imported in the porous membranes case (43 MW out of 163 MW).

4.2. Comparison of Different Reactor Configurations

One of the main assumptions taken to perform the economic evaluation detailed in Section 4.1 relates to the kinetics selected to run the OCM reactor [5]. This OCM kinetics was initially developed and validated for specific packed bed lab-scale reactor conditions, and its validation when integrating membranes was not carried out. Nevertheless, the high C2 reactor yields (up to 60%) achieved in this work with the membrane reactor are in agreement with other modelling OCM membrane reactor works [6]. However, these yields have never been validated with experiments. As a matter of fact, the discrepancies in results between modelling and experimental works are significant and should be somehow considered. Therefore, and in order to make a more reliable evaluation, two extra scenarios have been considered here. The reactor performance obtained with the membrane reactors has been reduced by decreasing the reaction rate of the desired primary reaction (oxidative production of ethane from methane) such that a more reasonable C2 yield, from an experimental point of view, is achieved. The system has been adjusted in a way that, as a result, a C2 yield of around 30% is obtained, which is in line with the best OCM experimental publications when employing a membrane reactor [22]. Following the approach of this work, this modification has been applied to the dense and the porous membrane reactor cases. The techno-economic evaluation of the previously mentioned membrane based processes and the experimental state-of-the-art membrane reactor configurations (indicated as low yield) have been also compared with the conventional OCM packed bed process [12] and to the naphtha steam cracking [11] in order to have a broader framework of the ethylene production market.
A summary of all the selected configurations together with the main operating parameters of each of them are listed in Table 7.

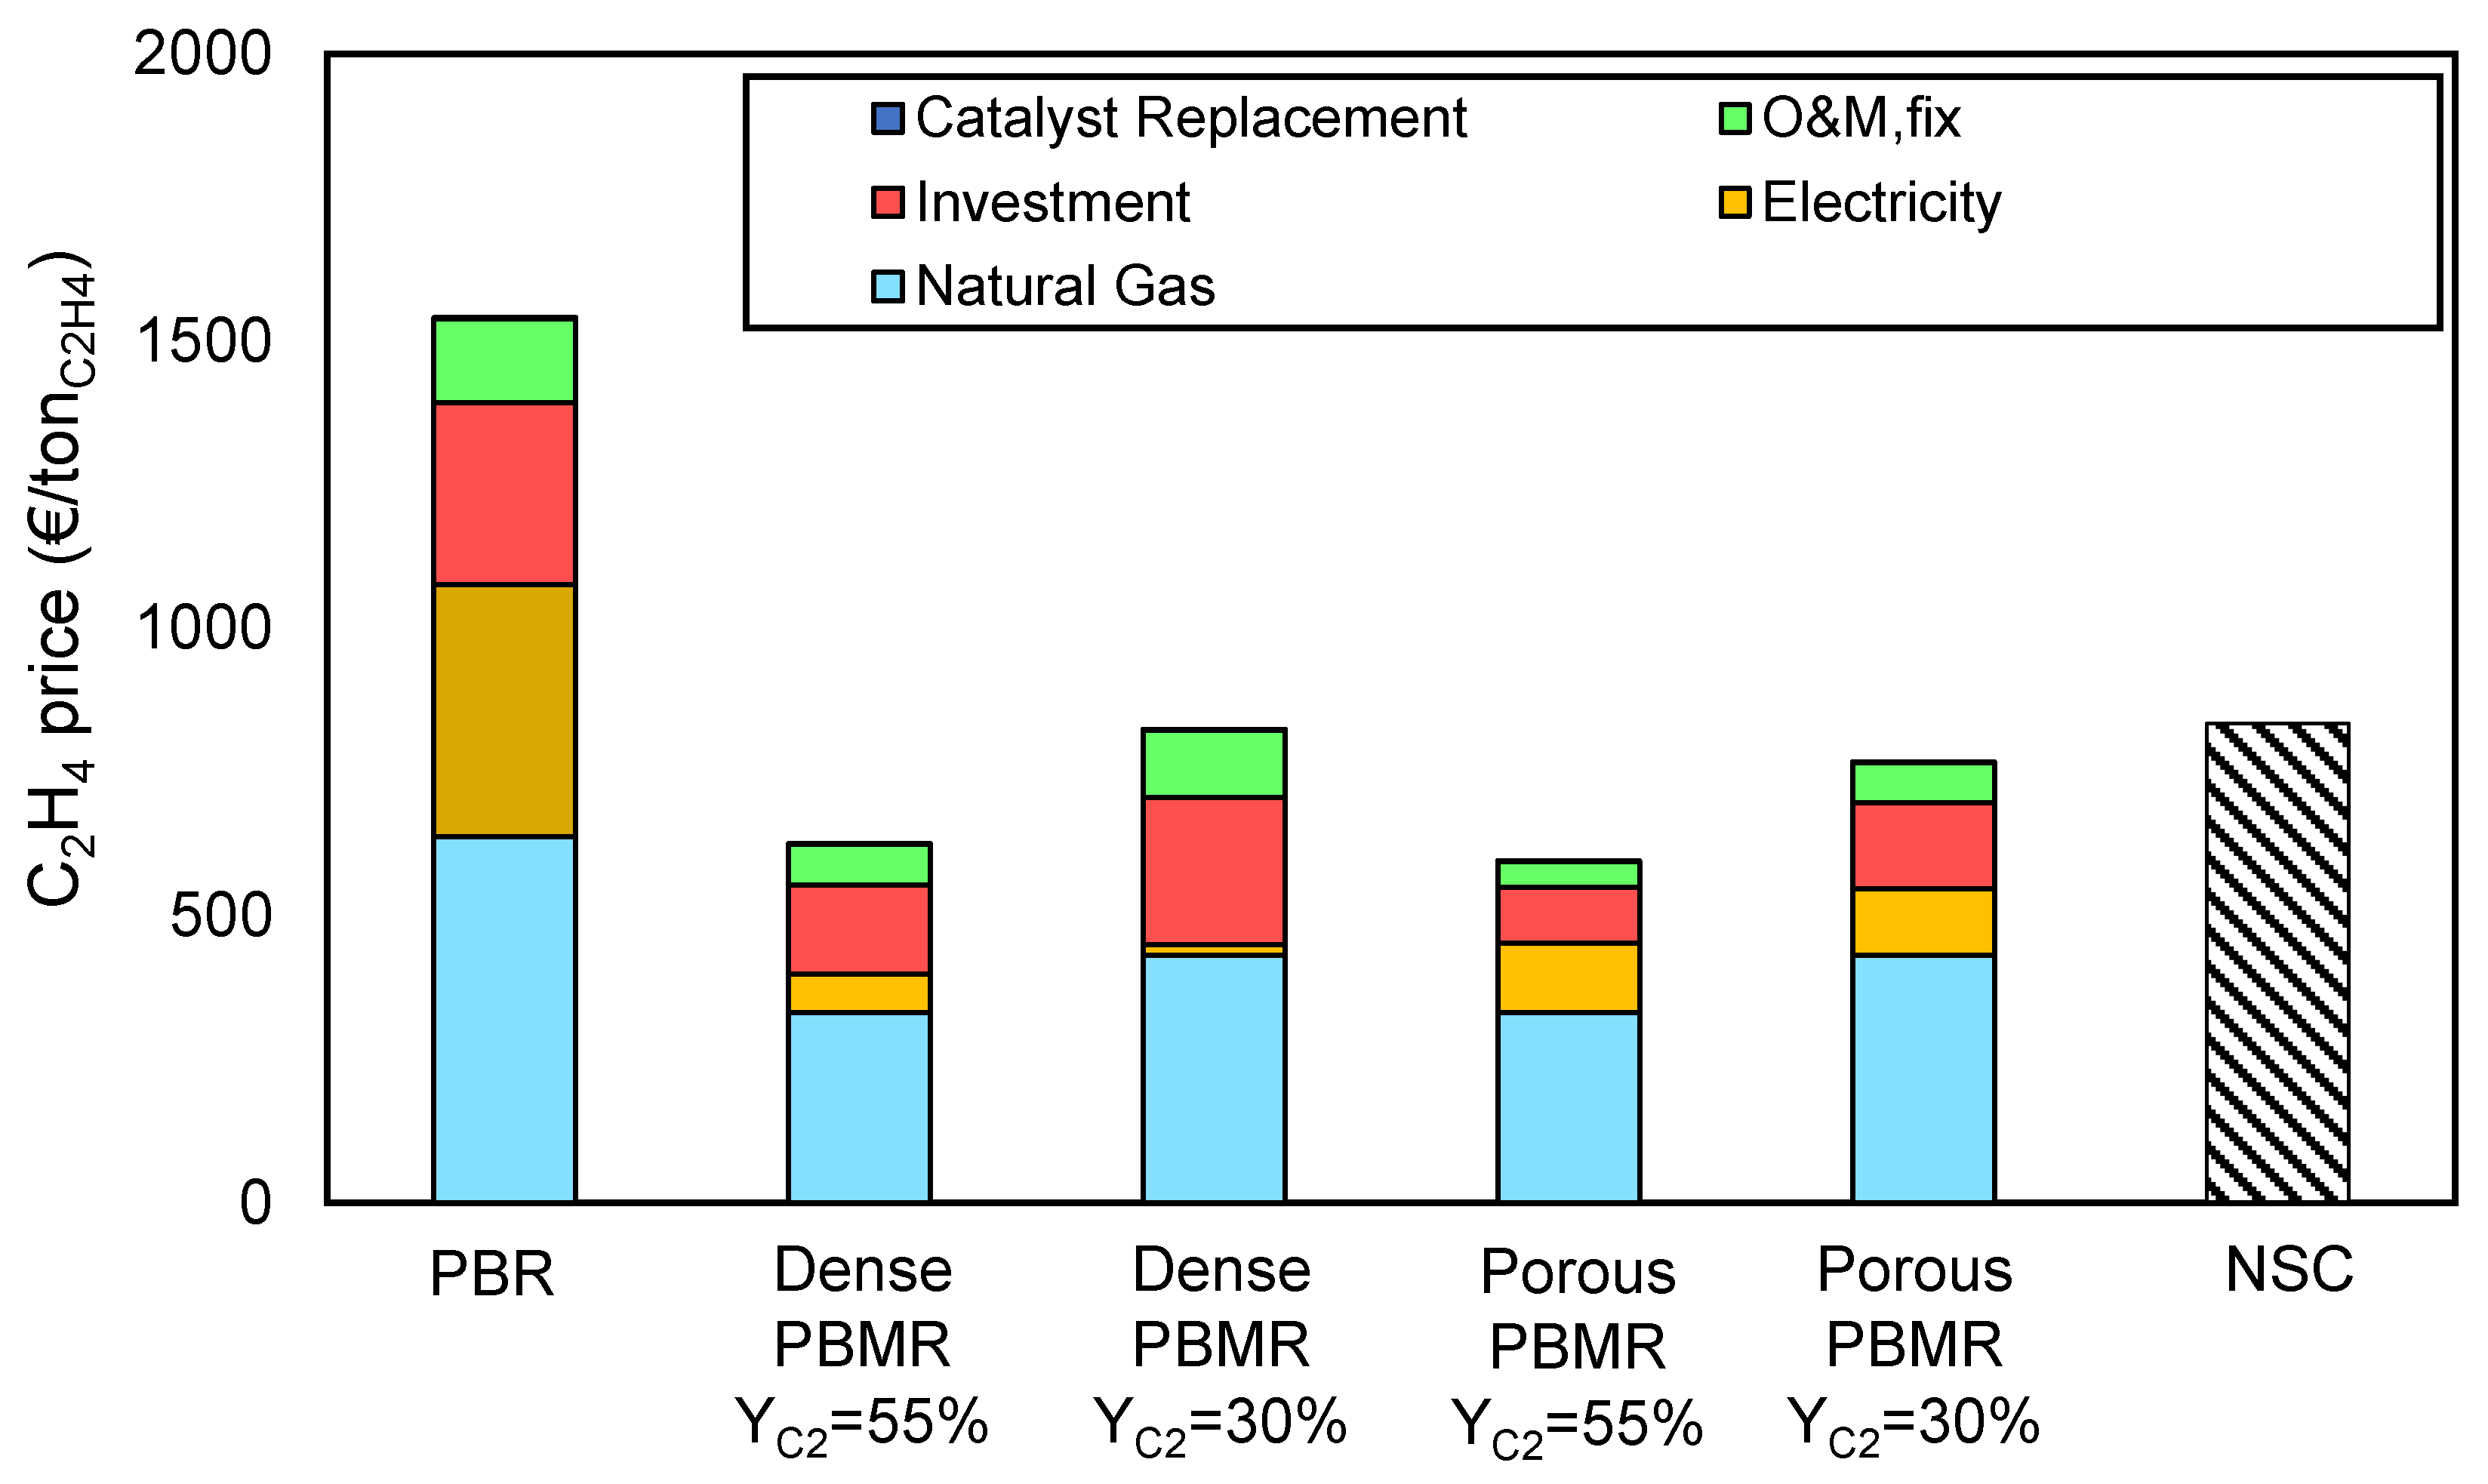
4.2.1. Ethylene Price

The first index chosen to evaluate all these configurations is the final ethylene price that comes out from the process, disaggregated into the main cost contributors. The results of this comparison can be seen in Figure 7.
Among the different OCM technologies, the maturity of the packed bed is the main advantage of the conventional packed bed configuration. However, it seems clear that a breakthrough in the technology is required to industrially compete with conventional ethylene production technologies, represented in this graph by the naphtha steam cracking. One of the most promising options to reach this necessary breakthrough is the integration of membranes in the reactor. It has already been widely explained that this reactor modification would increase the C2 reactor yield, increasing the profitability of the process. The first consequence of this performance improvement relates to the decrease in the cost related to the raw material, natural gas. The more optimized methane conversion occurring in the OCM reactor decreases the total feed inlet requirement, thus reducing the costs associated with the overall cost of purchasing raw material. Secondly, electricity demand and investment are strongly reduced when employing a membrane reactor. The higher yields in all the membrane reactor cases makes all the separation train cheaper. For instance, the stream comprising the incondensable gases remained after the C2 separation, which actually contains some of the undesired products formed in the OCM reaction (stream P16 in Figure 1 and Figure 2) is reduced from 20.6 in the conventional OCM packed bed reactor to 3.9 kmol/s when the membrane reactor is employed. This is reflected in the investment cost, since the size of all the units downstream the reactor could be lowered, also including a lower electricity demand due to the lower amount of energy required to carry out the component separations in the various distillation columns utilized during the process (in particular the de-methanizer and de-ethanizer, which are very energy-consuming because of the utilization of cryogenic temperatures).
The ethylene price in the cases in which the C2 reactor yield has been decreased are still comparable to the price calculated by Spallina et al. [11] for the conventional naphtha steam cracking. This means that if the membrane reactor experiments, in which the 30% C2 yield has been overcome [32,33,34], can be extrapolated at industrial conditions without any loss in performance, the OCM technology could be located within the range of industrial viability for ethylene production. However, this step is not as straight-forward as it could seem, since most of these experimental works are carried out at very specific conditions. Commonly, in the experiments at lab scale the extent of reaction is controlled by diluting the feed with an inert (usually N2) and by using low flow feeds (in the range of mL) in small reactors. With these actions, the reaction temperature can be easily kept in the optimal OCM range, where selectivity towards the desired products is maximized. Instead, these shortcuts cannot be applied when attempting the industrial application of the process, since they will significantly hinder its efficiency. As a result, the upscaling of the OCM membrane reactor process can be complex and it has not been yet experimentally tested.
When confronting the dense-porous cases, it turns out that the ethylene price obtained from the porous configurations (for both reduced and non-reduced C2 reactor yield) is just slightly lower. In terms of technology maturity, MIEC membranes are still very far from commercialization and most of the research has been devoted to pure O2 production or solid oxide fuel cells in which the presence of an electric field improves the oxygen transfer rate [35]. If the fact that the maturity of porous membranes is much larger than the one of dense (MIEC) membranes is taken into account, porous membranes like the ones simulated in this work are commercially available while MIEC dense membranes are certainly not produced at industrial scale yet (it is very doubtful that in a relatively short timeframe the number of membranes required to run the OCM dense membrane reactor plant can be produced), it comes out that the feasibility of the porous membrane reactor configuration clearly overcomes the one of the dense membranes case. In addition, possible extra issues of dense membranes that have not been tested yet, like long term stability of membranes and sealing, possible interaction with the catalyst, etc., can direct the decision more towards the implementation of the porous membranes case, where many more aspects are simplified.

4.2.2. CO2 Emissions

Another relevant parameter to study in detail, especially considering all the political-environmental aspects that are currently being discussed in the society, is the environmental impact and the carbon footprint of the process. Because of that, the CO2 emissions derived from all the aforementioned processes have been evaluated and are shown in Figure 8.
Differently to the conventional NSC, where the need of a fuel to supply heat to the reaction cracking reaction directly impacts the CO2 emissions, the OCM technology requires a CO2 separation unit in the plant which is able to deliver a stream of pure CO2 which can be sent for long storage or used as carbon feedstock without being emitted to the atmosphere. This comes from the fact that CO2 is produced itself in the process (as a by-product of the OCM reaction), being consequently necessary its removal from the outlet reactor stream in order to be able to obtain pure ethylene. That is also the reason why the CO2 capture rate in the conventional OCM case, that is, packed bed reactor (PBR), is much larger than in all the other cases because of the more C2 unselective reactions taking place in such configuration.
In the case of NSC, CO2 is not produced in the cracking process itself, but as off-gas from the combustion of light alkanes derived from the cracking technology to provide heat and/or electricity to the process. As a result, no CO2 is captured in the NSC process and all the positive CO2 emissions are considered to be direct and are originated by the combustion of these hydrocarbons. The negative value shown in the indirect CO2 emissions relies on the fact that, when combusting these hydrocarbons, the heat produced is recovered by high pressure steam to power a steam cycle, resulting in a large production of electricity, larger than that required in the plant, and thus having a surplus that can be exported. Therefore, the negative emissions refer to the CO2 that is saved when exporting electricity.
When comparing the different OCM configurations, it can be observed that direct CO2 emissions, related to the CO2 emitted within the process (in the particular of OCM in the boilers used to supply energy for the plant), are much higher in the PBR configuration than in all the other cases. The large unconverted methane stream of this particular configuration, which partially goes to the burner to produce electricity, is the main cause of this big contribution. Since the reaction is more selective towards the desired products, this term gets strongly reduced when integrating membranes in the reactor.
Similarly, the indirect CO2 emissions, which account for the import/export of electricity and/or heat, are also much larger in the PBR respect to all the other OCM cases. These emissions come from the need of electricity import because of the very energy intensive separation train required to separate the big amounts of undesired products formed in the OCM reactor from ethylene. In the case of integrated renewable plant to account for the electricity demand, the indirect CO2 emissions could be removed, significantly reducing the footprint of the process. In the medium-long term scenario this is likely to happen, although several technical and policy-related aspects are still open to guarantee that the quantity of electricity required will be available for more than 8000 h per years.
Overall, the total CO2 emissions (accounting for direct, indirect, and captured) are much lower for the OCM cases that for the NSC. In particular, total CO2 emissions in the OCM dense membranes configuration case are reduced by 96% and in the OCM porous membranes configuration by 88% when compared to the NSC. This factor is especially relevant if taxes are applied to CO2 emissions, as is likely to happen in the near future. The conventional packed bed is still CO2 positive because of the requirement of importing electricity, while the cases of which membranes are integrated are roughly CO2 neutral. In addition, these cases have the potential to become CO2 emissions-negative if the electricity that they demand comes from a renewable source, hence removing the indirect CO2 emissions contribution.

5. Conclusions

A techno-economic evaluation of different OCM membrane reactor configurations has been carried out in this work. These reactors consist mainly of the integration of membranes in the reactor, favoring an increment of the reactor performance by evenly distributing the oxygen along the axial reactor length. Two types of membrane reactor, which subsequently imply two different OCM process schemes, have been simulated in this work. In the first of these two options, which integrates dense oxygen selective membranes, the O2-N2 separation is carried out in-situ in the reactor, avoiding the utilization of the energy intensive air separation unit to purify O2. The second membrane reactor configuration investigated, which is based on porous membranes, has shown better results (even though the air separation is required in this case), reducing the ethylene cost of production between 5 and 10% with respect to the dense membranes case. The reason for this finding is the larger membrane area required in the dense membranes study because of the lower flux of this type of membranes (membrane area required in the dense membranes configuration is around one order of magnitude higher than the porous one). The unfavorable economics and the current status of technology development of the dense membranes case leads to the conclusion that OCM using porous membranes is more convenient and nowadays more reliable. Nevertheless, the effective performance of the membrane reactor could possibly drastically change these results. A one-dimensional reactor model has been used to run all the simulations, consequently assuming that, in the reactor, radial dispersion is infinitely fast. Therefore, the local oxygen concentration in the region close to the porous membrane wall has not been properly calculated. As a consequence, the fact that porous membranes employ higher oxygen fluxes, thus increasing local oxygen concentrations more than in the dense case, has not been considered. Higher local oxygen concentrations would mean lower selectivity towards the desired products, reducing the reactor performance. An exhaustive evaluation of this situation, which would consist on linking the Aspen process scheme simulation to a two-dimensional reactor model accounting for radial dispersion, would be necessary to study the influence/clarify this aspect.
Both configurations lead to a much lower ethylene price compared with the reference naphtha steam cracking, being therefore a price competitive with conventional technology. In particular, the viability of the process has been shown for the cases in which the reactor performance has been matched to experimental works reported in literature, being still the ethylene price below the one calculated with the naphtha steam cracking technology. These promising results should increase the efforts to achieve larger prototype and move forward the development of the OCM membrane reactor technologies. In particular, dealing with and solving the issues that are “hidden” at a small scale, such as heat management or reliability of the kinetics used for these simulations. In addition, the price of the membranes (both dense and porous) has been shown to be crucial for the OCM process, reaching in some cases even 50% of the total CAPEX cost. Therefore, an accurate evaluation/study of this parameter, being able to more precisely predict the membrane cost, would be necessary to continue with the scale-up of the process.
Finally, the results are also promising from an environmental point of view. In all the OCM cases, the overall CO2 emissions are much lower than in the conventional NSC. Specifically, the independency of the electricity (the OCM membrane reactor technologies are almost neutral in electricity demand), translated into low indirect CO2 emissions, helps balancing the CO2 emissions. Thereby and on contrary to NSC, the OCM membrane cases are very close to reach the “zero” CO2 emissions target, something which could be accomplished in the near future if the electricity that these processes demand is obtained from a renewable source.

Author Contributions

A.C., J.H., J.A.M. and F.G. performed the simulations and analyzed the data, V.S. designed the process scheme of the plant and reviewed the paper, A.C. and J.A.M. wrote the paper and M.v.S.A. and F.G. reviewed it. F.G. funding acquisition. All authors have read and agreed to the published version of the manuscript.

Funding

This project has received funding from the European Union’s Horizon 2020 research and innovation programme under grant agreement No 679933.

Acknowledgments

The present publication reflects only the author’s views and the European Union is not liable for any use that may be made of the information contained therein.
Processes 08 00274 i001

Conflicts of Interest

The authors declare no conflict of interest.

Appendix A

Table A1. OPTIMAL DENSE MEMBRANES CASE.
(A)
(A)
StreamVapor FractionTemperaturePressureMole FlowMass Flow
°Cbarkmol/skg/s
A011.025.01.031.3907.5
A021.0600.010.031.3907.5
A031.0600.010.029.8859.4
A041.0810.09.529.8859.4
EX011.0110.01.030.1864.4
P011.025.070.02.745.9
P021.0280.070.02.745.9
P031.0303.412.06.193.0
P041.0600.09.016.3300.6
P051.0600.09.010.10.0
P061.0305.09.010.10.0
P071.0183.09.06.20.0
P081.040.09.05.6104.8
P091.051.910.24.684.9
P101.040.09.05.183.9
P111.0−65.034.05.183.9
P120.2−32.218.01.233.8
P131.0−32.718.01.131.9
P141.015.018.01.131.9
P151.015.017.90.11.9
P161.035.012.03.950.1
P171.035.012.03.545.1
P181.0350.012.03.445.1
P191.0353.110.53.774.7
P201.035.012.00.45.0
P210.038.0110.00.311.9
W010.0305.0105.03.970.1
W021.0500.092.03.970.1
W030.0305.0105.00.00.0
W041.0315.0100.00.00.0
W050.0140.0120.03.868.5
W061.0500.0100.03.868.5
W071.0500.092.05.7102.1
W081.0171.06.00.59.1
W090.945.00.15.292.9
(B)
(B)
StreamMole Fractions
O2N2ArCH4C2H4C2H6COH2CO2H2O
A010.2070.7830.0100.0000.0000.0000.0000.0000.0000.000
A020.2070.7830.0100.0000.0000.0000.0000.0000.0000.000
A030.1670.8220.0110.0000.0000.0000.0000.0000.0000.000
A040.1670.8220.0110.0000.0000.0000.0000.0000.0000.000
EX010.1530.8170.0100.0000.0000.0000.0000.0000.0050.015
P010.0000.0300.0000.9200.0000.0400.0000.0000.0100.000
P020.0000.0300.0000.9200.0000.0400.0000.0000.0100.000
P030.0000.1310.0000.6160.0030.0250.0000.2070.0040.013
P040.0000.0890.0000.1500.1290.0050.0090.1850.0510.382
P050.0000.0890.0000.1500.1290.0050.0090.1850.0510.382
P060.0000.0890.0000.1500.1290.0050.0090.1850.0510.382
P070.0000.0890.0000.1500.1290.0050.0090.1850.0510.382
P080.0000.1420.0000.2410.2060.0090.0150.2980.0810.008
P090.0000.1420.0000.2410.2060.0090.0150.2980.0810.008
P100.0000.1560.0000.2640.2270.0090.0170.3270.0000.000
P110.0000.1560.0000.2640.2270.0090.0170.3270.0000.000
P120.0000.0000.0000.0000.9600.0400.0000.0000.0000.000
P130.0000.0000.0000.0000.9990.0010.0000.0000.0000.000
P140.0000.0000.0000.0000.9990.0010.0000.0000.0000.000
P150.0000.0000.0000.0000.2880.7120.0000.0000.0000.000
P160.0010.2040.0000.3450.0020.0000.0220.4270.0000.000
P170.0010.2040.0000.3450.0020.0000.0220.4270.0000.000
P180.0000.2140.0000.3880.0000.0000.0000.3750.0000.024
P190.0000.0000.0000.0000.0000.0000.0000.0000.0001.000
P200.0010.2040.0000.3450.0020.0000.0220.4270.0000.000
P210.0000.0000.0000.0000.0000.0000.0000.0001.0000.000
W010.0000.0000.0000.0000.0000.0000.0000.0000.0001.000
W020.0000.0000.0000.0000.0000.0000.0000.0000.0001.000
W030.0000.0000.0000.0000.0000.0000.0000.0000.0001.000
W040.0000.0000.0000.0000.0000.0000.0000.0000.0001.000
W050.0000.0000.0000.0000.0000.0000.0000.0000.0001.000
W060.0000.0000.0000.0000.0000.0000.0000.0000.0001.000
W070.0000.0000.0000.0000.0000.0000.0000.0000.0001.000
W080.0000.0000.0000.0000.0000.0000.0000.0000.0001.000
W090.0000.0000.0000.0000.0000.0000.0000.0000.0001.000
Table A2. OPTIMAL POROUS MEMBRANES CASE.
(A)
(A)
StreamVapor fractionTemperaturePressureMole FlowMass Flow
°Cbarkmol/skg/s
A011.025.01.07.2206.3
A021.0600.010.05.7158.2
A031.0600.010.01.548.1
A041.0810.09.51.954.5
EX011.0110.01.039.61138.0
P011.025.070.02.745.9
P021.0280.070.02.745.9
P031.0303.412.06.193.0
P041.0600.09.016.3300.6
P051.0600.09.010.10.0
P061.0305.09.010.10.0
P071.0183.09.06.20.0
P081.040.09.05.6104.8
P091.051.910.24.684.9
P101.040.09.05.183.9
P111.0−65.034.05.183.9
P120.2−32.218.01.233.8
P131.0−32.718.01.131.9
P141.015.018.01.131.9
P151.015.017.90.11.9
P161.035.012.03.950.1
P171.035.012.03.545.1
P181.0350.012.03.445.1
P191.0353.110.53.774.7
P201.035.012.00.45.0
P210.038.0110.00.311.9
W010.0305.0105.07.7138.4
W021.0315.0100.07.7138.4
W030.0305.0105.03.970.1
W041.0500.092.03.970.1
W050.0305.0105.00.00.0
W061.0315.0100.00.00.0
W070.0140.0120.04.376.6
W081.0500.0100.04.376.6
W091.0500.092.08.2146.7
W101.0171.06.00.59.1
W110.945.00.17.6137.5
(B)
(B)
StreamMole Fractions
O2N2ArCH4C2H4C2H6COH2CO2H2O
A010.2080.7830.0100.0000.0000.0000.0000.0000.0000.000
A020.0000.9960.0040.0000.0000.0000.0000.0000.0000.000
A030.9500.0190.0310.0000.0000.0000.0000.0000.0000.000
A040.2080.7830.0100.0000.0000.0000.0000.0000.0000.000
EX010.1530.8170.0100.0000.0000.0000.0000.0000.0050.015
P010.0000.0300.0000.9200.0000.0400.0000.0000.0100.000
P020.0000.0300.0000.9200.0000.0400.0000.0000.0100.000
P030.0000.1310.0000.6160.0030.0250.0000.2070.0040.013
P040.0000.0890.0000.1500.1290.0050.0090.1850.0510.382
P050.0000.0890.0000.1500.1290.0050.0090.1850.0510.382
P060.0000.0890.0000.1500.1290.0050.0090.1850.0510.382
P070.0000.0890.0000.1500.1290.0050.0090.1850.0510.382
P080.0000.1420.0000.2410.2060.0090.0150.2980.0810.008
P090.0000.1420.0000.2410.2060.0090.0150.2980.0810.008
P100.0000.1560.0000.2640.2270.0090.0170.3270.0000.000
P110.0000.1560.0000.2640.2270.0090.0170.3270.0000.000
P120.0000.0000.0000.0000.9600.0400.0000.0000.0000.000
P130.0000.0000.0000.0000.9990.0010.0000.0000.0000.000
P140.0000.0000.0000.0000.9990.0010.0000.0000.0000.000
P150.0000.0000.0000.0000.2880.7120.0000.0000.0000.000
P160.0010.2040.0000.3450.0020.0000.0220.4270.0000.000
P170.0010.2040.0000.3450.0020.0000.0220.4270.0000.000
P180.0000.2140.0000.3880.0000.0000.0000.3750.0000.024
P190.0000.0000.0000.0000.0000.0000.0000.0000.0001.000
P200.0010.2040.0000.3450.0020.0000.0220.4270.0000.000
P210.0000.0000.0000.0000.0000.0000.0000.0001.0000.000
W010.0000.0000.0000.0000.0000.0000.0000.0000.0001.000
W020.0000.0000.0000.0000.0000.0000.0000.0000.0001.000
W030.0000.0000.0000.0000.0000.0000.0000.0000.0001.000
W040.0000.0000.0000.0000.0000.0000.0000.0000.0001.000
W050.0000.0000.0000.0000.0000.0000.0000.0000.0001.000
W060.0000.0000.0000.0000.0000.0000.0000.0000.0001.000
W070.0000.0000.0000.0000.0000.0000.0000.0000.0001.000
W080.0000.0000.0000.0000.0000.0000.0000.0000.0001.000
W090.0000.0000.0000.0000.0000.0000.0000.0000.0001.000
W100.0000.0000.0000.0000.0000.0000.0000.0000.0001.000
W110.0000.0000.0000.0000.0000.0000.0000.0000.0001.000

References

  1. Keller, G.E.; Bhasin, M.M. Synthesis of Ethylene via Oxidative Coupling of Methane. I. Determination of active catalysts. J. Catal. 1982, 73, 9–19. [Google Scholar] [CrossRef]
  2. Karakaya, C.; Kee, R.J. Progress in the direct catalytic conversion of methane to fuels and chemicals. Prog. Energy Combust. Sci. 2016, 55, 60–97. [Google Scholar] [CrossRef] [Green Version]
  3. Galadima, A.; Muraza, O. Revisiting the oxidative coupling of methane to ethylene in the golden period of shale gas: A review. J. Ind. Eng. Chem. 2016, 37, 1–13. [Google Scholar] [CrossRef]
  4. Kondratenko, E.V.; Peppel, T.; Seeburg, D.; Kondratenko, V.A.; Kalevaru, N.; Martin, A.; Wohlrab, S. Methane conversion into different hydrocarbons or oxygenates: Current status and future perspectives in catalyst development and reactor operation. Catal. Sci. Technol. 2017, 7, 366–381. [Google Scholar] [CrossRef]
  5. Stansch, Z.; Mleczko, L.; Baerns, M. Comprehensive kinetics of oxidative coupling of methane over the La2O3/CaO catalyst. Ind. Eng. Chem. Res. 1997, 36, 2568–2579. [Google Scholar] [CrossRef]
  6. Cruellas, A.; Melchiori, T.; Gallucci, F.; Van Annaland, M. Oxidative Coupling of Methane: A Comparison of Different Reactor Configurations. Energy Technol. 2019, 1900148. [Google Scholar] [CrossRef]
  7. Cruellas, A.; Melchiori, T.; Gallucci, F.; Van Annaland, M. Advanced reactor concepts for oxidative coupling of methane. Catal. Rev. 2017, 59, 234–294. [Google Scholar] [CrossRef] [Green Version]
  8. Balakotaiah, V.; Sun, Z.; West, D.H. Autothermal reactor design for catalytic partial oxidations. Chem. Eng. J. 2019, 374, 1403–1419. [Google Scholar] [CrossRef]
  9. Vandewalle, L.A.; Van de Vijver, R.; Van Geem, K.M.; Marin, G.B. The role of mass and heat transfer in the design of novel reactors for oxidative coupling of methane. Chem. Eng. Sci. 2019, 198, 268–289. [Google Scholar] [CrossRef]
  10. Vandewalle, L.A.; Lengyel, I.; West, D.H.; Van Geem, K.M.; Marin, G.B. Catalyst ignition and extinction: A microkinetics-based bifurcation study of adiabatic reactors for oxidative coupling of methane. Chem. Eng. Sci. 2019, 199, 635–651. [Google Scholar] [CrossRef]
  11. Spallina, V.; Velarde, I.C.; Jimenez, J.A.M.; Godini, H.R.; Gallucci, F.; Van Annaland, M. Techno-economic assessment of different routes for olefins production through the oxidative coupling of methane (OCM): Advances in benchmark technologies. Energy Convers. Manag. 2017, 154, 244–261. [Google Scholar] [CrossRef]
  12. Cruellas, A.; Bakker, J.J.; van Annaland, M.; Medrano, J.A.; Gallucci, F. Techno-economic analysis of oxidative coupling of methane: Current state of the art and future perspectives. Energy Convers. Manag. 2019, 198, 111789. [Google Scholar] [CrossRef]
  13. Vamvakeros, A.; Jacques, S.D.M.; Middelkoop, V.; di Michiel, M.; Egan, C.K.; Ismagilov, I.Z.; Vaughan, G.B.M.; Gallucci, F.; van Annaland, M.; Shearing, P.R.; et al. Real time chemical imaging of a working catalytic membrane reactor during oxidative coupling of methane. Chem. Commun. 2015, 51, 12752–12755. [Google Scholar] [CrossRef] [PubMed] [Green Version]
  14. Matras, D.; Jacques, S.D.M.; Godini, H.R.; Khadivi, M.; Drnec, J.; Poulain, A.; Cernik, R.J.; Beale, A.M. Real-Time Operando Diffraction Imaging of La–Sr/CaO During the Oxidative Coupling of Methane. J. Phys. Chem. C 2018, 122, 2221–2230. [Google Scholar] [CrossRef] [Green Version]
  15. Matras, D.; Jacques, S.D.M.; Poulston, S.; Grosjean, N.; Bosch, C.E.; Rollins, B.; Wright, J.; di Michiel, M.; Vamvakeros, A.; Cernik, R.J.; et al. Operando and Postreaction Diffraction Imaging of the La–Sr/CaO Catalyst in the Oxidative Coupling of Methane Reaction. J. Phys. Chem. C 2019, 123, 1751–1760. [Google Scholar] [CrossRef] [Green Version]
  16. Wang, P.; Zhao, G.; Liu, Y.; Lu, Y. TiO2-doped Mn2O3-Na2WO4/SiO2 catalyst for oxidative coupling of methane: Solution combustion synthesis and MnTiO3-dependent low-temperature activity improvement. Appl. Catal. A 2017, 544, 77–83. [Google Scholar] [CrossRef]
  17. Wang, P.; Zhao, G.; Wang, Y.; Lu, Y. MnTiO3 low-temperature oxidative coupling of methane over TiO2-doped Mn2O3-Na2WO4/SiO2 catalyst. Sci. Adv. 2017, 3, e1603180. [Google Scholar] [CrossRef] [Green Version]
  18. Wang, P.; Zhang, X.; Zhao, G.; Liu, Y.; Lu, Y. Oxidative coupling of methane: MOx-modified (M = Ti, Mg, Ga, Zr) Mn2O3-Na2WO4/SiO2 catalysts and effect of MOx modification. Chin. J. Catal. 2018, 39, 1395–1402. [Google Scholar] [CrossRef]
  19. Lim, S.; Choi, J.-W.; Suh, D.J.; Lee, U.; Song, K.H.; Ha, J.-M. Low-temperature oxidative coupling of methane using alkaline earth metal oxide-supported perovskites. Catal. Today 2019. [Google Scholar] [CrossRef]
  20. Jaso, S.; Godini, H.R.; Arellano-garcia, H.; Omidkhah, M.; Wozny, G. Analysis of attainable reactor performance for the oxidative methane coupling process. Chem. Eng. Sci. 2010, 65, 6341–6352. [Google Scholar] [CrossRef]
  21. Godini, H.R.; Gili, A.; Görke, O.; Simon, U.; Hou, K.; Wozny, G. Performance Analysis of a Porous Packed Bed Membrane Reactor for Oxidative Coupling of Methane: Structural and Operational Characteristics. Energy Fuels 2014, 28, 877–890. [Google Scholar] [CrossRef]
  22. Plazaola, A.A.; Labella, A.C.; Liu, Y.; Porras, N.B.; Tanaka, A.D.P.; Annaland, V.M.S.; Gallucci, F. Mixed Ionic-Electronic Conducting Membranes (MIEC) for Their Application in Membrane Reactors: A Review. Processes 2019, 7, 128. [Google Scholar] [CrossRef] [Green Version]
  23. Tiemersma, T.P.; Tuinier, M.J.; Gallucci, F.; Kuipers, J.A.M.; Annaland, M.V.S. A kinetics study for the oxidative coupling of methane on a Mn/Na2WO4/SiO2 catalyst. Appl. Catal. A 2012, 433–434, 96–108. [Google Scholar] [CrossRef]
  24. Xu, S.J.; Thomson, W.J. Oxygen permeation rates through ion-conducting perovskite membranes. Chem. Eng. Sci. 1999, 54, 3839–3850. [Google Scholar] [CrossRef]
  25. NETL. Cost Estimation Methodology for NETL Assessments of Power Plant Performance; NETL: Pittsburgh, PA, USA, 2011.
  26. Martínez, I.; Romano, M.C.; Chiesa, P.; Grasa, G.; Murillo, R. Hydrogen production through sorption enhanced steam reforming of natural gas: Thermodynamic plant assessment. Int. J. Hydrogen Energy 2013, 38, 15180–15199. [Google Scholar] [CrossRef]
  27. Boiler Efficiency Guide. 2010. Available online: www.cleaverbrooks.com (accessed on 18 January 2020).
  28. Iea—Energy Technology Group. Industrial Combustion Boilers. 2010, pp. 1–5. Available online: www.iea-etsap.org (accessed on 18 January 2020). [CrossRef]
  29. Arratibel, A.; Astobieta, U.; Tanaka, D.A.P.; van Annaland, M.; Gallucci, F. N2, He and CO2 diffusion mechanism through nanoporous YSZ/γ-Al2O3 layers and their use in a pore-filled membrane for hydrogen membrane reactors. Int. J. Hydrogen Energy 2016, 41, 8732–8744. [Google Scholar] [CrossRef]
  30. Spallina, V.; Melchiori, T.; Gallucci, F.; Annaland, M.V.S. Auto-Thermal Reforming Using Mixed Ion-Electronic Conducting Ceramic Membranes for a Small-Scale H2 Production Plant. Molecules 2015, 20, 4998–5023. [Google Scholar] [CrossRef] [Green Version]
  31. Çengel, Y.A. Introduction to Thermodynamics and Heat Transfer; McGraw-Hill Higher Education: Berlin, Germany, 2008. [Google Scholar]
  32. Akin, F.T.; Lin, Y.S. Controlled Oxidative Coupling of Methane by Ionic Conducting Ceramic Membrane. Catal. Lett. 2002, 78, 239–242. [Google Scholar] [CrossRef]
  33. Bhatia, S.; Thien, C.Y.; Mohamed, A.R. Oxidative coupling of methane (OCM) in a catalytic membrane reactor and comparison of its performance with other catalytic reactors. Chem. Eng. J. 2009, 148, 525–532. [Google Scholar] [CrossRef]
  34. Othman, N.H.; Wu, Z.; Li, K. An oxygen permeable membrane microreactor with an in-situ deposited Bi1.5Y0.3Sm0.2O3−δ catalyst for oxidative coupling of methane. J. Membr. Sci. 2015, 488, 182–193. [Google Scholar] [CrossRef]
  35. Sunarso, J.; Hashim, S.S.; Zhu, N.; Zhou, W. Perovskite oxides applications in high temperature oxygen separation, solid oxide fuel cell and membrane reactor: A review. Prog. Energy Combust. Sci. 2017, 61, 57–77. [Google Scholar] [CrossRef]
Figure 1. Dense membrane reactor OCM process flow diagram.
Processes 08 00274 g001
Figure 2. Porous membrane reactor OCM process flow diagram.
Processes 08 00274 g002
Figure 3. OCM reactor yield at different reactor temperatures and operating CH4/O2 ratios (valid for both porous and dense membrane reactor cases represented with bars), and overall C2H4 price obtained based on the process scheme for the porous and the dense membrane reactor cases.
Processes 08 00274 g003
Figure 4. Disaggregated capital costs (BEC), CAPEX (Capital costs), for the OCM plant employing a dense membrane reactor (red) and a porous membrane reactor (black).
Processes 08 00274 g004
Figure 5. Disaggregated ethylene costs, including CAPEX and OPEX (Operational costs), for the OCM plant employing a dense membrane reactor (red) and a porous membrane reactor (black).
Processes 08 00274 g005
Figure 6. Calculated C2H4 price for the OCM porous and dense membrane reactor configurations when changing the cost of the membranes (in €/m2) and C2H4 price achieved with the conventional naphtha steam cracking (NSC).
Processes 08 00274 g006
Figure 7. Cost distribution of the OCM process when using four different reactor configurations; packed bed (PBR), dense membranes reactor, dense membranes reactor with a reduced yield, porous membranes reactor and porous membranes reactor with a reduced yield, and of the conventional naphtha steam cracking (NSC).
Processes 08 00274 g007
Figure 8. CO2 captured, direct CO2 emissions, indirect CO2 emissions, and total CO2 emissions (all of them in tonCO2/tonC2H4) for the five cases considered; packed bed (PBR), dense membranes reactor, dense membranes reactor with a reduced yield, porous membranes reactor, and porous membranes reactor with a reduced yield, and conventional naphtha steam cracking (NSC).
Processes 08 00274 g008
Table 1. Assumptions for the O&M costs calculations and consumables.
O&M Fixed
LaborM€/year1.5
Maintenance% TOC2.5
Insurance% TOC2.0
O&M Variable
Catalyst€/kg50.0
Catalyst ReplacementYears5
Membranes ReplacementYears5
Plant LifetimeYears25
Consumables
Cooling Water€/ton0.35
Natural Gas price (Europe)€/GJLHV5
Electricity€/MWh85
CO2€/tonCO20
Table 2. Capital (CAPEX) costs calculations by using the NETL (National Energy Technology Laboratory) method [25].
Capital Costs (CAPEX)
Plant ComponentsCost (M€)
Component AA
Component BB
Component CC
Component DD
BEC (Bare Erected Costs)A + B + C + D
Direct costs as percentage of BEC
Total Installation Cost (TIC)80% of BEC
Total Plant Costs (TPC)BEC + TIC
Indirect Costs (IC)14% of TPC
Engineering Procurement and Construction (EPC)TPC + IC
Contingency10% of EPC
Owner’s Cost5% of EPC
Total contingencies and owner’s costs (TCOC)15% of EPC
Total Overnight Costs (TOC)EPC + TCOC
CCF (Capital charge factor)0.1
CAPEXC2H4 [M€/year]TOC × CCF
Table 3. Definition of the indexes used for the evaluation of the environmental performance of the process.
Environmental Performance Indexes
Direct CO2 emissions E C O 2 ,   d i r e c t = m ˙ C O 2 , d i r e c t m ˙ C 2 H 4
Indirect CO2 emissions (*) m ˙ C O 2 , i n d i r e c t = + W e l e c t r , i m p o r t e d / e x p o r t e d E C O 2 ,   C C + W h e a t , i m p o r t e d / e x p o r t e d E C O 2 , T H
E C O 2 ,   i n d i r e c t = m ˙ C O 2 , i n d i r e c t m ˙ C 2 H 4
CO2 captured C C   ( % ) = m ˙ C O 2 , c a p t u r e d m ˙ C O 2 , c a p t u r e d + m ˙ C O 2 , d i r e c t + m ˙ C O 2 , i n d i r e c t
(*) E C O 2 ,   C C = 96 g C O 2 M J e l   ;   E C O 2 ,   T H = 63 g C O 2 M J e l .
Table 4. Characteristics assumed for the simulation of the 1D oxidative coupling of methane (OCM) reactor model.
OCM Reactor Characteristics
Diameter [m]3
Inlet gas velocity [m/s]1
Bed porosity [–]0.5
Inlet pressure [bar]10
Pressure drop in the reactor [bar]1
Catalyst typeLa2O3/CaO[5]
Catalyst density [kg particle/m3 reactor]3600[5]
Active weight fraction0.27[5]
Catalyst dilution [ C a t a l y s t   w e i g h t   [ k g ] T o t a l   s o l i d   w e i g h t   [ k g ] ] 1
Reactor length [m]2
Type of porous membraneAsymmetric Al2O3[29]
Porous membrane diameter [m]0.01
Porous membrane length [m]2
Porous membrane price [€/m2]700
Type of dense membraneBSCF[24]
Dense membrane layer [m]5 × 10⁻⁵
Dense membrane length [m]2
Dense membrane price [€/m2]1000
Number of reactors10–40 (*)
(*) Depending on the simulation and its conditions.
Table 5. Values of the permeability parameters resulting from the fitting of experimental data [30].
Pre-Exponential FactorActivation Energy (kJ/mol)
D v ( m 2 s 1 ) 9.82391.8
k r ( m o l   m 2 s 1 ) 15.3656.3
k f ( m   s 1   P a 0.5 ) 308.5267.0
Table 6. Production (positive) and consumption (negative) of electricity (in MW) in the OCM plant for the dense membrane reactor and porous membrane reactor configurations.
ELECTRICITY PRODUCTIONS/CONSUMPTIONS (in MW)
Dense MembranesPorous Membranes
Steam cycle102.9159.6
Refrigeration cycle−201.7−201.7
Syngas Compressor−24.7−24.7
CO2 Capture−7.8−7.8
Gas turbine45.30.0
Air Compressor0.0−15.8
Air Fan0.0−1.8
Air Separation Unit (ASU)0.0−43.3
Other Auxiliary−4.9−4.9
TOTAL−91.0−163.4
Table 7. Main parameters of the different OCM configurations and the naphtha steam cracking (NSC) considered to carry out the economic analysis.
OCMNSC [11]
Classic PBRDense PBMRDense PBMR (Lower Yield)Porous PBMRPorous PBMR (Lower Yield)
Temperature [°C]850800800800800-
Pressure [bar]1010101010-
CH4/O2 [–]32.52.52.52.5-
CH4 conversion (%)31.864.045.264.045.2-
C2 selectivity (%)43.886.367.386.367.3-
C2 yield (%)13.955.230.555.230.5-
Ethylene price (€/ton)1541625824595768835

