Article

Separation of Protein-Binding Anthraquinones from Semen Cassiae Using Two-Stage Foam Fractionation

1
School of Chemical Engineering and Materials, Changzhou Institute of Technology, No. 666 Liaohe Road, Changzhou 213032, China
2
Lianyungang TCM Branch of Jiangsu Union Technical Institute, Lianyungang 222006, China
3
School of Biological Science, Jining Medical University, No. 669 Xueyuan Road, Donggang District, Rizhao 276800, China
*
Authors to whom correspondence should be addressed.
Processes 2019, 7(7), 463; https://doi.org/10.3390/pr7070463
Submission received: 24 June 2019 / Revised: 14 July 2019 / Accepted: 16 July 2019 / Published: 19 July 2019
(This article belongs to the Special Issue Green Separation and Extraction Processes)

Abstract

:
Anthraquinones are compounds of high medicinal value in many plants. Based on their good protein binding affinity, foam fractionation was attempted to separate them using proteins in the aqueous extract of Semen Cassiae as collectors. Firstly, the interaction between anthraquinones and Semen Cassiae proteins has been analyzed by the Stem–Volmer equation with physcion as a standard. The results show that physcion had good interaction with the proteins via hydrophobic forces. More importantly, the proteins effectively assisted the foam fractionation of several anthraquinones including aurantio-obtusifolin, aloe-emodin, rhein, emodin, chrysophanol, and physcion. On this basis, a two-stage foam fractionation technology was developed for process intensification using a foam fractionation with vertical sieve trays (VSTs). VSTs, initial feed concentration of total anthraquinones, temperature, volumetric air flow rate and pore diameter of gas distributor had significant effects on enrichment ratio and recovery yield of anthraquinones. Under suitable conditions, the enrichment ratio of total anthraquinones reached 47.0 ± 4.5 with a concentration of 939 ± 94 mg/L in the foamate while their total recovery percentage reached more than 47.7%. In addition, foam fractionation also increased the purity and hydroxyl radical scavenging activity of total anthraquinones. The results had significant implications for the separation of anthraquinones from Semen Cassiae.

1. Introduction

Semen Cassiae, a traditional Chinese medicine, is a dried ripe seed of Cassia obtusifolia L. [1]. It possesses antiseptic, diuretic, antidiarrheal, antioxidant, and heptaprotection effects, thus having wide applications in daily life [2,3,4]. These beneficial effects are mainly attributed to a diversity of emodin-type anthraquinones in the Chinese medicine [5]. At present, more than 40 anthraquinones have been identified from Semen Cassiae, of which the representative ones and their typical structures are presented in Table 1 [5,6,7].
The isolation of anthraquinones from Semen Cassiae usually consists of two steps: extraction and purification. In the former step, organic solvents and water are common extraction agents [8]. The subsequent purification of anthraquinones from extract liquors mainly depends on various chromatographic techniques [2,9]. These chromatographic techniques have satisfactory separation performances, but they have high cost. Therefore, it is necessary to develop a cost-effective separation method to reduce the costs of the separation of anthraquinones from the extract liquors of Semen Cassiae.
Foam fractionation is such a cost-effective method that uses bubbles as media to separate various compounds with or without surface activity from their diluted aqueous solutions [10,11]. It has high efficiency, low-cost, and is pollution free, so it is widely used in the separation of high-value natural compounds from plants [12,13]. On this ground, we will attempt to use foam fractionation to separate anthraquinones from the aqueous extract of Semen Cassiae. Because anthraquinones have no surface activity, it is the key to choose a suitable surface-active compound as a collector to assist their foam fractionation [14]. At present, there have not been reports on the suitable surface-active compound for the adsorption of anthraquinones at the gas–liquid interface. However, a large number of studies have confirmed that anthraquinones have good protein binding affinity [15,16,17]. Thus we propose that proteins in Semen Cassiae may also have good interactions with anthraquinones. Proteins often have good surface activity [18], so the ones in Semen Cassiae can serve as the collector for foam fractionation of anthraquinones from their aqueous extract. In this case, the addition of other surface-active compounds into aqueous extract will be unnecessary.
In the current work, we will first analyze the interactions of anthraquinones and proteins in Semen Cassiae using fluorescent spectrometry and high-performance liquid chromatography (HPLC). Then, we will use a foam fractionation column with vertical sieve trays (VSTs) to intensify the separation of total anthraquinones from their aqueous extract, due to its good ability to enhance interfacial adsorption [19]. Using the column, a two-stage foam fractionation technology will be optimized by studying the effects of initial feed concentration of total anthraquinones, temperature, volumetric air flow rate, and pore diameter of gas distributor. Finally, the hydroxyl radical scavenging activity of total anthraquinones in the aqueous extract and the second-stage foamate will be compared. All the efforts are aimed at providing a cost-effective method for the separation of anthraquinones from Semen Cassiae.

2. Materials and Methods

2.1. Materials

Semen Cassiae was purchased from Tong Ren Tang Group, Beijing, China and it had a total-anthraquinones content ~12.3 mg/g. Standards of alizarin, aurantio-obtusifolin, aloe-emodin, rhein, emodin, chrysophanol, and physcion, with purity >96.0%, were purchased from Beijing Wanjia Shouhua Biotechnology Co. Ltd., Beijing, China. Methyl alcohol, acetonitrile, phosphoric acid, and other Chemical reagents were of analytical grade and purchased from Tianjin Yingdaxigui Co. Ltd., Tianjin, China.

2.2. Preparation of Aqueous Extract of Semen Cassiae

The total anthraquinones were extracted by water from Semen Cassiae as the following procedures. First, the purchased Semen Cassiae was washed, dried, and then powdered with particle sizes of 300–500 μm. Second, the powder was triply mixed with tap water at a ratio of 1.0 g/10.0 mL and each mixing time was 2.0 h. After each mixing, the supernatant was recovered by centrifugation at 4300× g for 10 min. In detail, the first mixing was operated at 50 °C to obtain a suitable number of soluble proteins, and the last two mixings at 80 °C to improve the extraction yield of total anthraquinones. Third, all the aqueous extracts were mixed and then centrifuged at 4300× g for 10 min to remove the solid residues. The extraction yield of total anthraquinones reached 72.3 ± 3.5% with a mass ratio of total anthraquinones vs. total proteins about 1/10.3 (m/m). The prepared aqueous extract was stored at 4 °C for use.

2.3. Preparation of Semen Cassiae Proteins

Semen Cassiae proteins was extracted from the powder mentioned in the above subsection. First, the powder of Semen Cassiae was mixed with n-hexane-acetone (3:1) at a mass–volume ratio of 1 g/20 mL. Then, extraction was performed at 4.0 °C for 48.0 h to remove lipids and anthraquinones in the powder. Second, n-hexane-acetone was removed by centrifugation at 4300× g for 10 min, and the residual powder was dried by air drying. Third, a 50 mmol/L KH2PO4-NaOH buffer solution (pH 8.0) was used to extract proteins from the dried powder at 4.0 °C for 10.0 h. After the aqueous extract, proteins in the extract liquor were precipitated by saturated ammonium sulfate at 4.0 °C for 10.0 h. Finally, the precipitate was dialyzed twice against deionized water at 4.0 °C using a dialysis tube of 3.5 kDa in MW cut-off and then dried by freeze drying to obtain the sample of Semen Cassiae proteins.

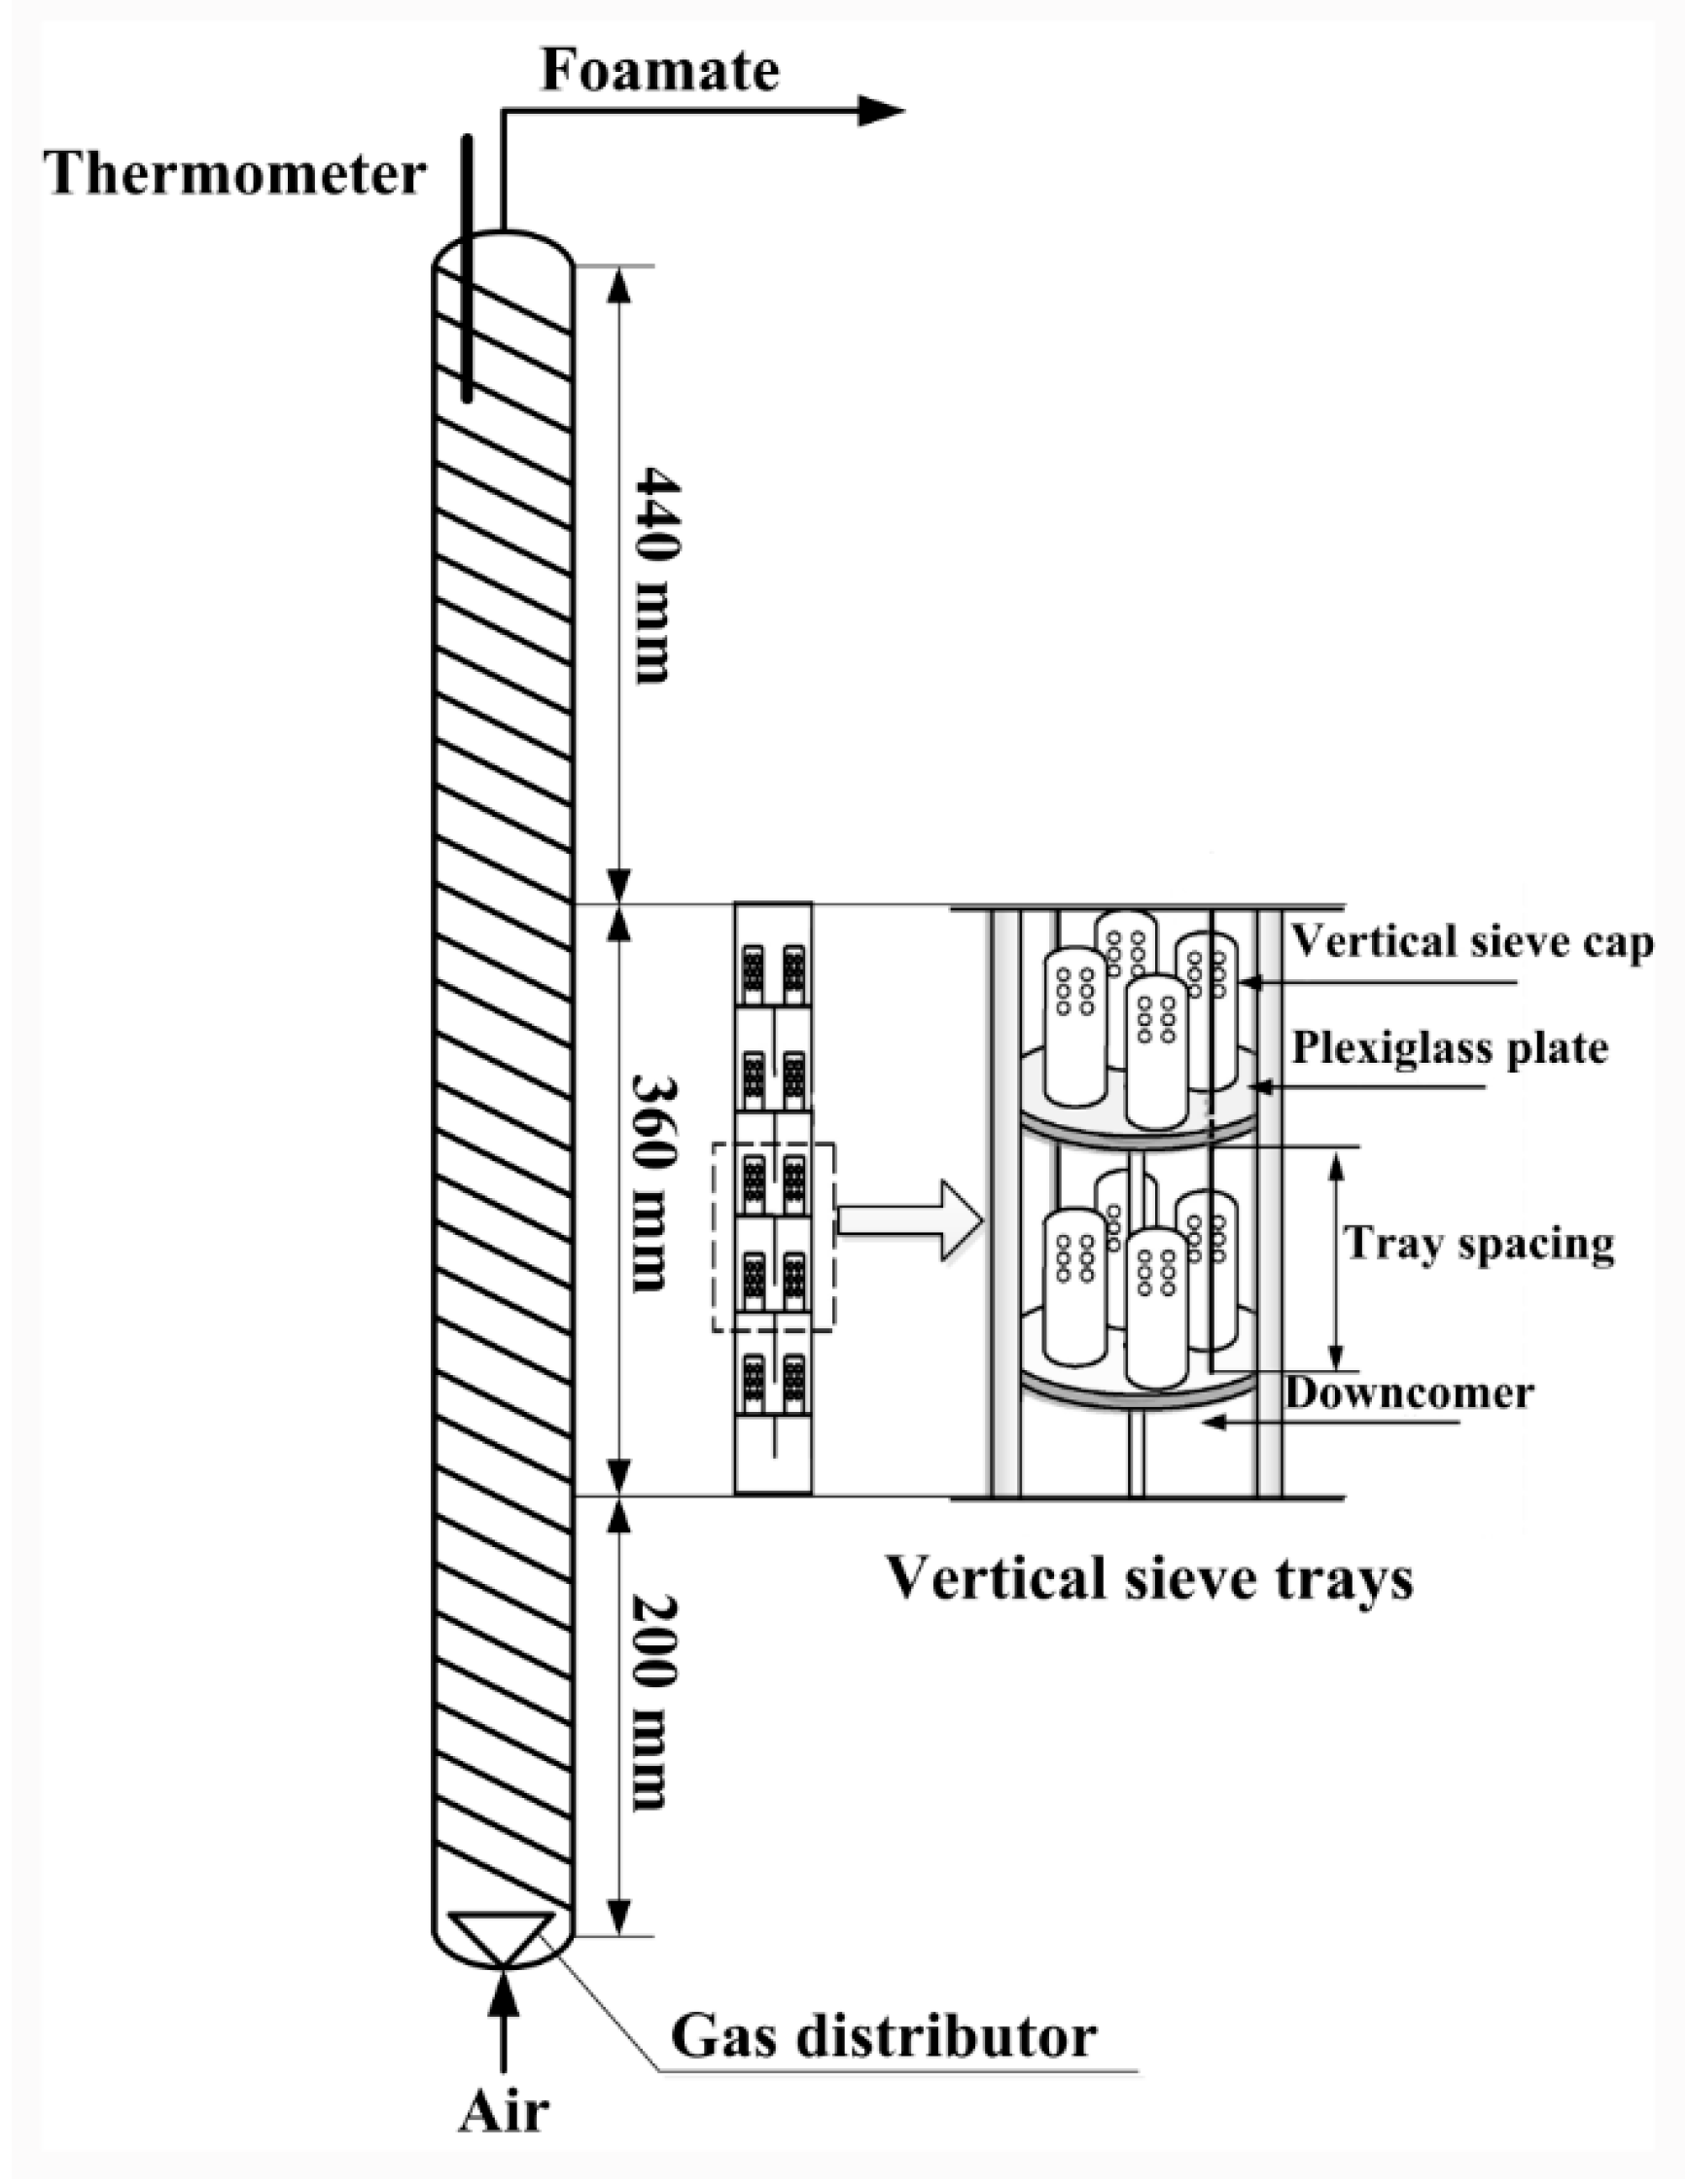
2.4. Separation of Total Anthraquinones from the Aqueous Extract of Semen Cassiae Using Foam Fractionation

The separation of total anthraquinones from their aqueous extract was carried out in a foam fractionation column with VSTs, of which the schematic diagram is presented in Figure 1. The foam fractionation column was made of a transparent plexiglass tube with a height of 1000 mm and an internal diameter of 50 mm. At 200–560 mm from the column bottom, five VSTs with a spacing of 60 mm were installed, and their specific structural parameters have been described by Zhang et al. [19]. A silicone tube connected to a 501 ultrathermostat (Shanghai Experimental Instrument Factory Co. Ltd., Shanghai, China) was twined to control the foam temperature. The temperature was monitored by a thermometer attached to the top of the column. At the bottom of the column, a gas distributor made of polyethylene was installed and four gas distributors with pore diameters of 100 ± 20 μm, 200 ± 20 μm, 400 ± 20 μm, and 600 ± 20 μm were used in the experiments. In addition, the liquid loading volume was 1000 mL in each experiment.
Using the foam fractionation column in Figure 1, a two-stage foam fractionation technology was developed to highly enrich total anthraquinones from the aqueous extract of Semen Cassiae, according to the work of Li et al. [18]. Its schematic diagram is illustrated in Scheme 1. In the first stage, an aqueous extract with a low concentration of total anthraquinones (C0) was separated at room temperature to obtain the foamate with a relatively high concentration of Cf1, and the residual solution was discharged. The objective of this stage was to obtain a high recovery of total anthraquinones with a suitable enrichment. In the second stage, with the first-stage foamate as the feed solution, the total anthraquinones was further enriched by elevating temperature. In this stage, the foamate with a high concentration of total anthraquinones (Cf2) could be used as the raw material for the purification of anthraquinones. Simultaneously, the residual solution was diluted to have a total-anthraquinones concentration of C0 to serve as the first-stage feed solution.

2.5. Measurement of Intrinsic Fluorescence Spectrum of Semen Cassiae Proteins

Each solution of Semen Cassiae proteins was centrifuged at 8600× g for 10 min and its intrinsic fluorescence spectrum was measured using an F-4500 fluorescence spectrophotometer (Hitachi Co., Tokyo, Japan) at room temperature (20.0 °C). The spectrum of each solution from 300 nm to 500 nm was collected at an excitation wavelength of 283 nm with a slit of 5.0 nm for both excitation and emission with a scanning speed of 1200 nm/min. Each spectrum was an average of 8 accumulations.

2.6. Measurement of the Concentration of Total Anthraquinones

The concentration of total anthraquinones was measured according to Anjusha and Gangaprasad [20]. One milliliter of an anthraquinone-containing solution was dried, and then the solid was mixed with 5 mL of 80% ethanol to extract anthraquinones. The extraction process was operated at 80 °C for 45 min and triply repeated. The absorbance of the extract liquor was determined at 434 nm on a 752N UV–Vis spectrophotometer (Shanghai precision & scientific instrument Co. Ltd., Shanghai, China). The concentration of total anthraquinones was estimated with alizarin as a standard.

2.7. HPLC Analysis of Semen Cassiae Anthraquinones

HPLC analysis of Semen Cassiae anthraquinones in the extract liquor in Section 2.6 was done with a modified method on the basis of Xu et al. [5]. The analysis was conducted on a DiamonsilTM C18-column (250 × 4.6 mm, 5 µm) at 30 °C using an Agilent 1100 liquid chromatography system equipped with a G1315B diode array detector. The detection wavelength of anthraquinones was fixed at 284 nm and the injection volume at 20 μL. The mobile phase consisted of acetonitrile (A) and 0.1% aqueous phosphoric acid (v/v) (B) using the following gradient program with a flow rate of 1.0 mL/min; 28% A at 0–15 min, 44% A at 15–30 min, and 60% A at 30–50 min.

2.8. Hydroxyl Radical Scavenging Activity

The hydroxyl radical scavenging activity of Semen Cassiae anthraquinones in the crude extract and the foamate was estimated according to Husain et al. [21] with some modifications. Firstly, both 2 mL of 0.1% H2O2 solution and 2 mL of 6mM FeSO4 solution were added into three glass test tubes named GTT1, GTT2 and GTT3. Subsequently, 2 mL of deionized water was injected into GTT1 and 2 mL of anthraquinone-containing sample solution into GTT2 and GTT3. Then, the mixture in each tube was homogeneously mixed and stood for 5 min. After that, 2 mL of 6 mM ethanol solution of salicylic acid added into GTT1 and GTT2 and 2 mL of deionized water into GTT3. Finally, the three tubes were placed in water bath of 37.0 °C for 30 min’s reaction and then the mixtures were centrifuged at 8600× g for 10 min to obtain the supernatants. The absorbance of each supernatant in them was measured at 510 nm using the 752N UV–Vis spectrophotometer. The sample solutions were centrifuged at 8600× g for 10 min before addition. The clearance ratio of hydroxyl radical (EOH) was used to evaluate the hydroxyl radical scavenging activity of anthraquinones and defined as EOH = (1 − (A2A3)/A1) × 100%, where A1, A2, and A3 are the absorbances of the mixture in GTT1, GTT2, and GTT3, respectively.

2.9. Evaluation of the Foam Fractionation Performances

The foam fractionation performances were evaluated by enrichment ratio (E) and recovery percentage (R) defined as Equations (1) and (2), respectively.
E = C f C 0
R = V f C f V 0 C 0 × 100 %
where C0 and Cf are the total-anthraquinone concentrations in the feed solution and the foamate, respectively; V0 and Vf are the volumes of the feed solution and the foamate, respectively.

2.10. Statistical Analysis

Each experiment was at least triply repeated. Significant differences between mean values were determined by using Microsoft Excel. Significance was considered at p < 0.05. The standard deviation is provided for the measured values.

3. Results and Discussion

3.1. Stem–Volmer Analysis of Interaction between Physcion and Proteins Derived from Semen Cassiae

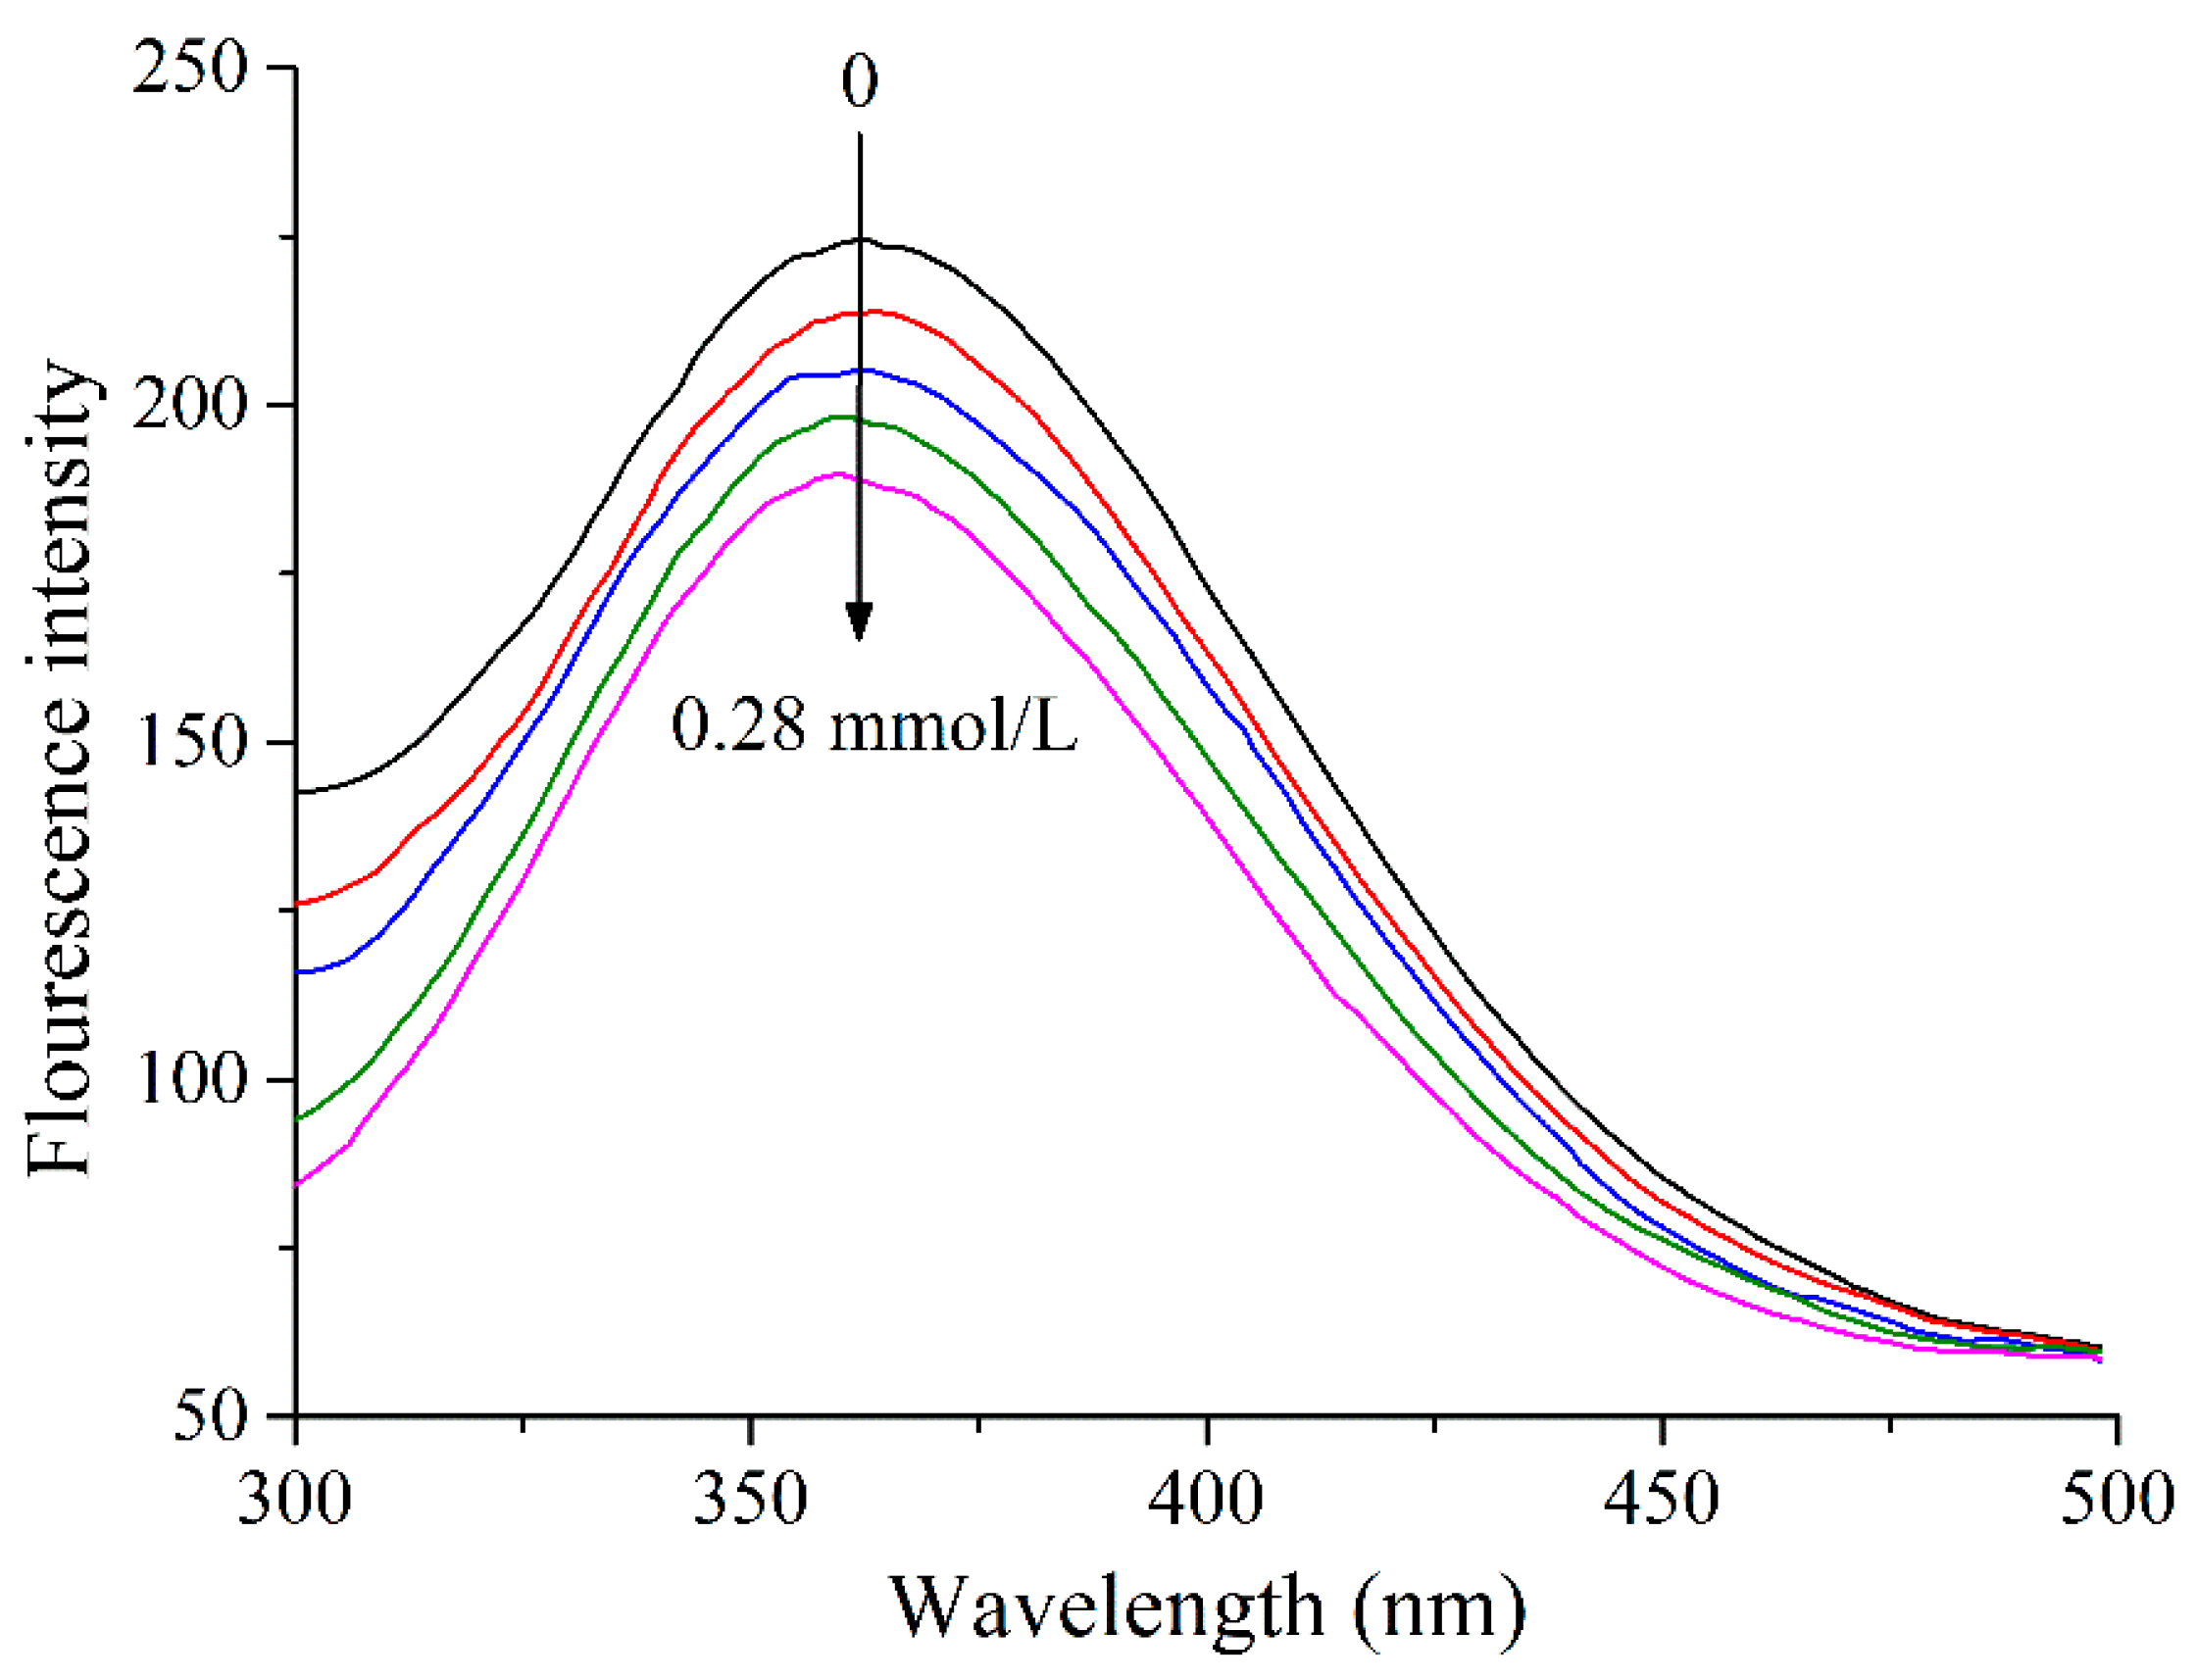
3.1.1. Fluorescence Quenching Spectra of Semen Cassiae Proteins with Physcion

Stem–Volmer analysis is a typical method to investigate the interaction between a small organic compound with a protein [22]. Using this method and physcion as a representative ingredient of anthraquinones, we attempted to analyze the interaction between anthraquinones and proteins derived from Semen Cassiae. Note that there were various proteins in Semen Cassiae, so all proteins were considered as a whole in this work. In this subsection, we first investigated the intrinsic fluorescence spectra of Semen Cassiae proteins at five physcion concentrations of 0, 0.07, 0.14, 0.21, and 0.28 mmol/L. In the experiments, Semen Cassiae proteins were dissolved in a 0.02 mol/L Na2HPO4-NaH2PO4 solution (pH 7.4) to have a concentration of soluble proteins of 0.20 g/L determined by the Coomassie brilliant blue method [23]. Then, the fluorescence spectrum of each solution was measured at 26.0 °C. The results in Figure 2 show that the fluorescence intensity of Semen Cassiae proteins gradually reduced as the concentration of physcion increased, indicating that physcion had an interaction with Semen Cassiae proteins. Furthermore, the maximal emission wavelength of Semen Cassiae proteins underwent a slight blue shift. Thus, the addition of physcion made the microenvironment of chromophoric groups of Semen Cassiae proteins more hydrophobic [24].

3.1.2. Binding Constants and Binding Sites of Physcion and Semen Cassiae Proteins

When physcion was bound with Semen Cassiae proteins, the binding equilibrium could be analyzed by the modified Stem–Volmer equation defined as Equation (3) using the fluorescence quenching spectra of Semen Cassiae proteins with physcion [25].
log ( F 0 F F ) = log K a + n log [ Q ]
where F0 and F are the fluorescence intensity of Semen Cassiae proteins with and without physcion at the maximal emission wavelength, respectively; Ka, n, and [Q] are the binding constant, the number of binding sites, and the concentration of physcion, respectively. Thus, a linear fitting of the plot of log (F0F)/F vs. log [Q] was carried out to obtain the value of Ka and n. Table 2 shows the values of Ka and n at 26.0, 31.0 and 37.0 °C. The values of Ka indicate that physcion had a good interaction with Semen Cassiae proteins, but the interaction was weaker than that of physcion and BSA [26]. In addition, the values of n were close to 1, so there was only one ingredient in Semen Cassiae proteins was associated with physcion and only one binding site on this protein.

3.1.3. Binding Mode and Nature of the Binding Force between Physcion and Semen Cassiae Proteins

In this subsection, we further analyzed the binding mode and nature of the binding force between physcion and Semen Cassiae proteins using the Van’ t Hoff equation (Equation (4)) and Gibbs function (Equation (5)) on the basis of the data in Table 2.
ln K a = Δ H R T + Δ S R
Δ G = Δ H T Δ S
where ∆H, ∆S, and ∆G are the changes of enthalpy, entropy, and Gibbs free energy, respectively, and T is temperature. From the intercept and slope of the plot of ln Ka vs. 1/T, we obtained the values of ∆H and ∆S and then calculated the values of ∆G at 26.0, 31.0, and 37.0 °C according to Equation (2). The results are summarized in Table 3. The negative values of ∆G indicate that the interaction between physcion and Semen Cassiae proteins was spontaneous. Furthermore, both ∆H and ∆S were positive, so hydrophobic forces were mainly responsible for the interaction [25]. The current results were consistent with those of the interaction between physcion and BSA [26].

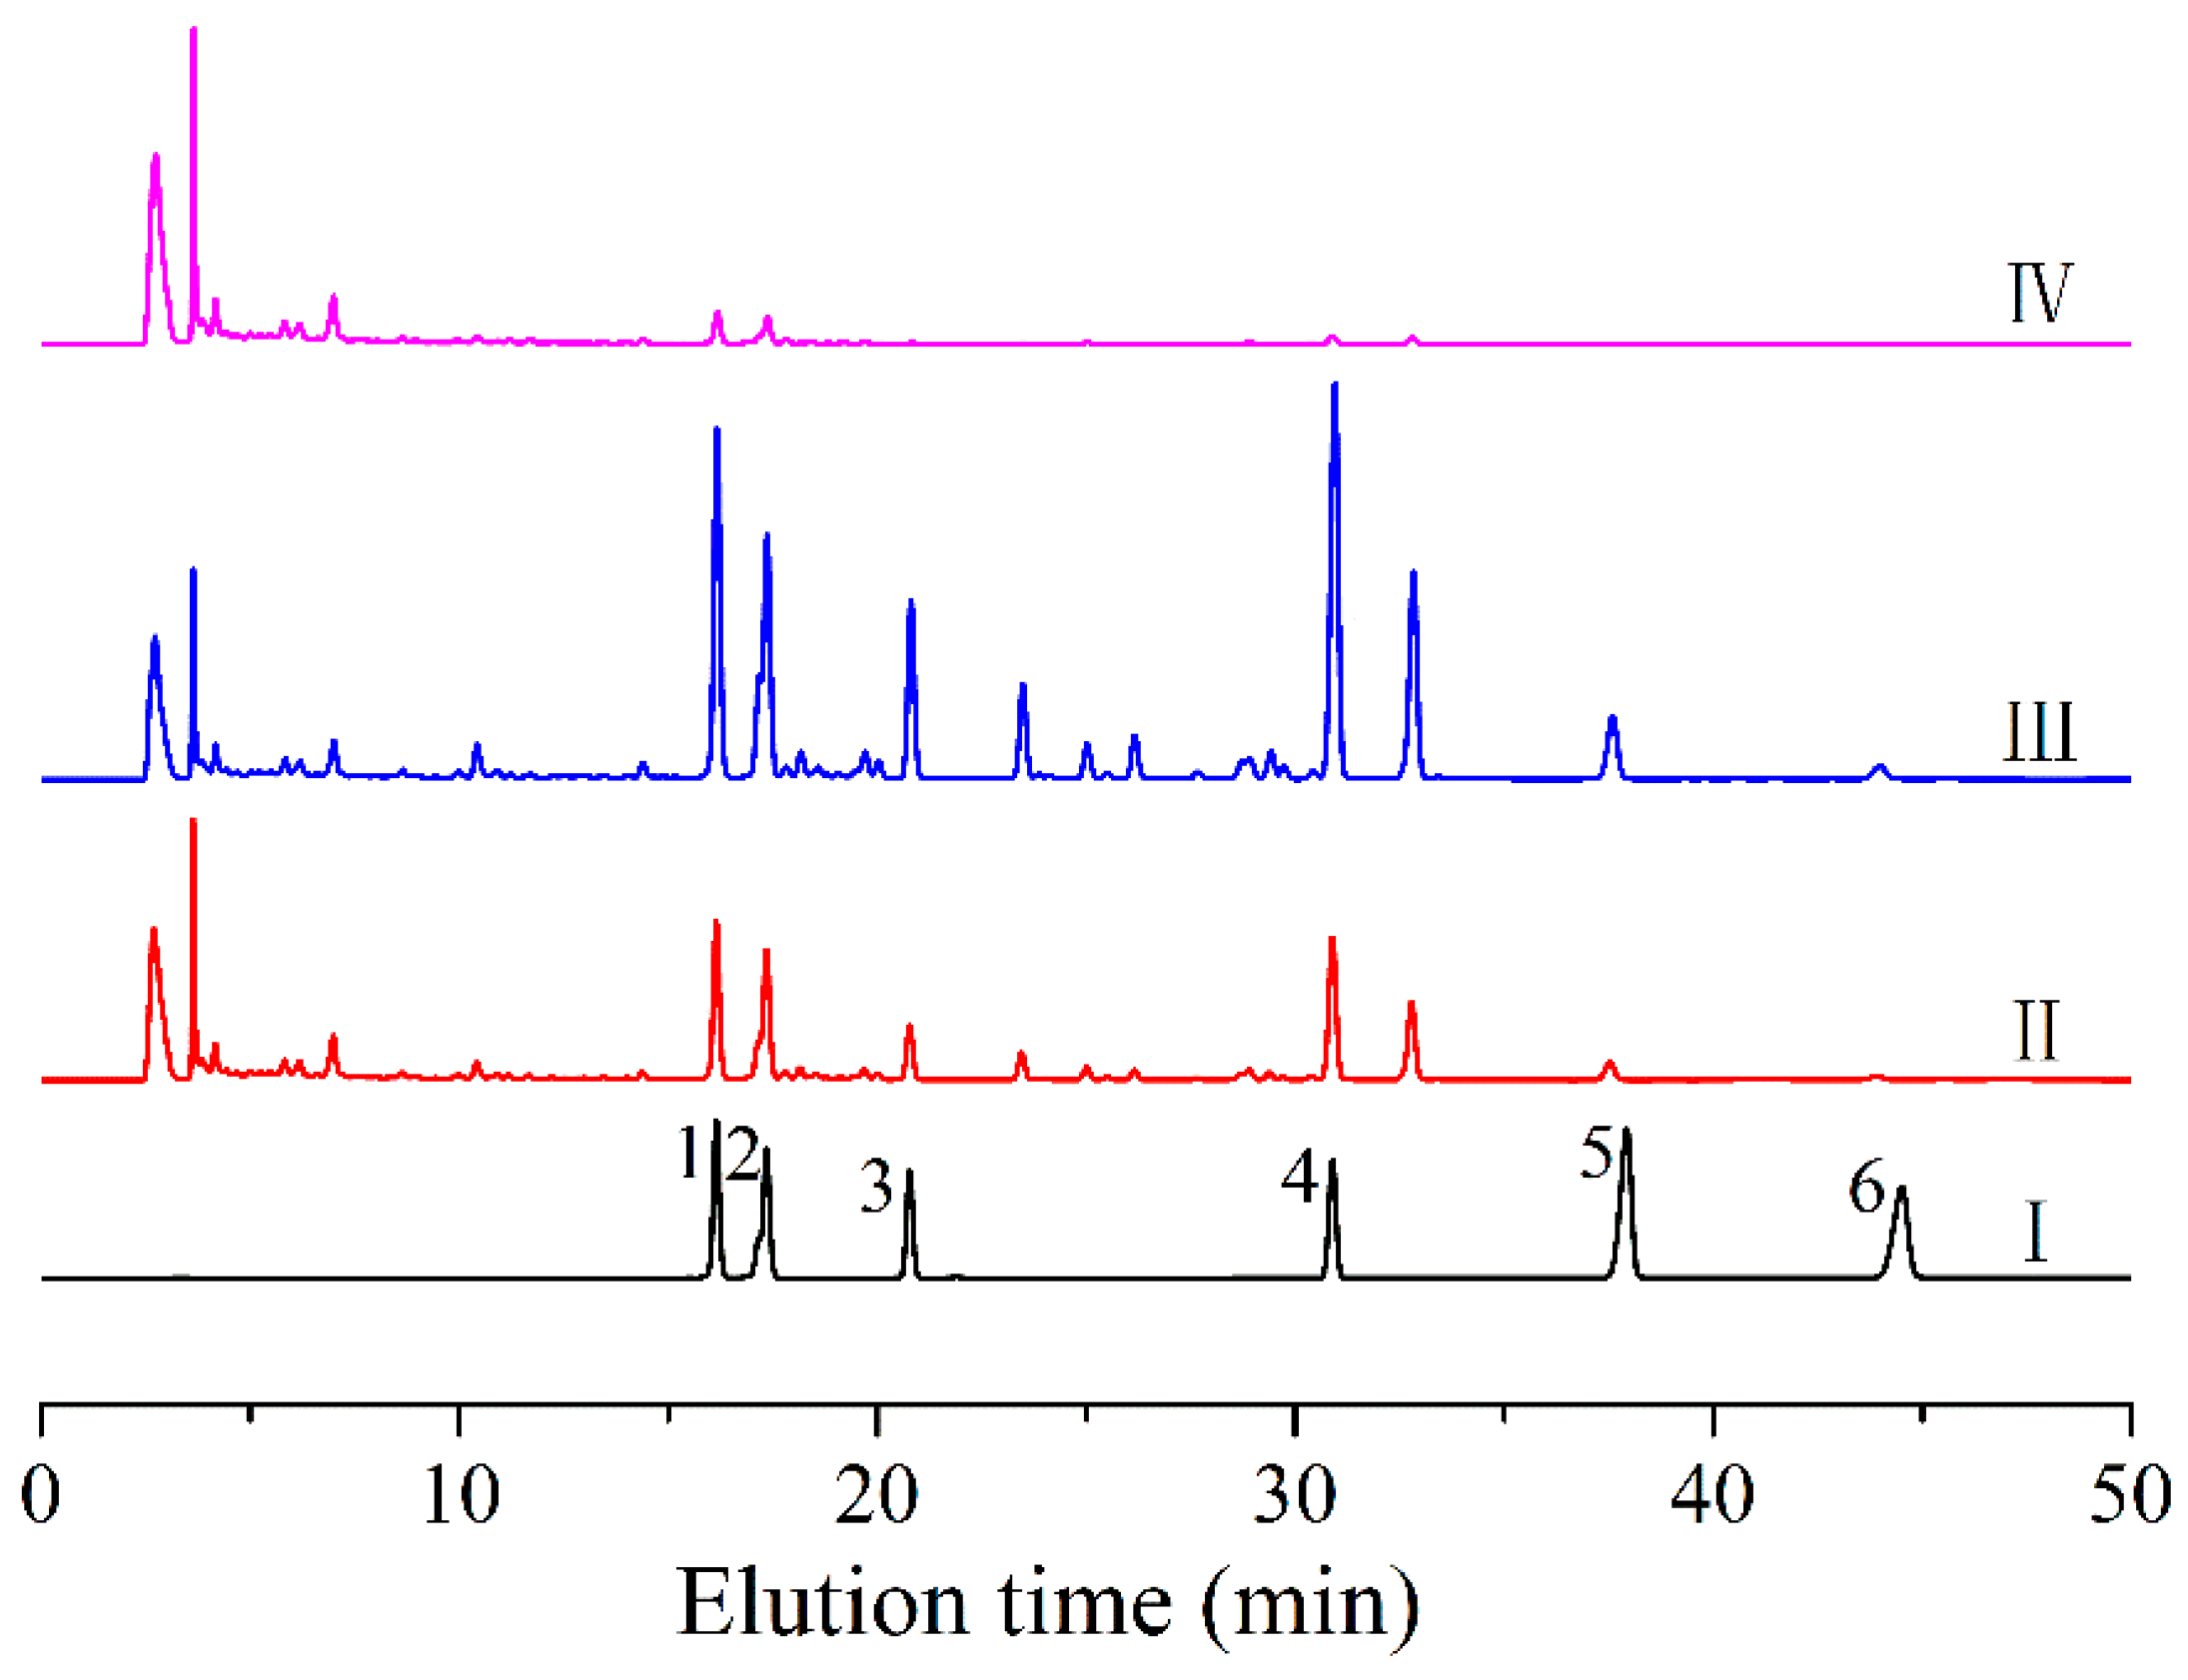
3.2. HPLC Analysis of Foam Fractionation of Anthraquinones from Semen Cassiae Extract

The above subsection determined that physcion had a good interaction with Semen Cassiae proteins. By that analogy, other anthraquinones might interact with these proteins so that the proteins could serve as a collector for foam fractionation of anthraquinones. However, it was clear whether the Semen Cassiae proteins were the major collector. Thus, we compared the foam fractionation processes of anthraquinones from a Semen Cassiae extract without any further treatment and another one with the removal of proteins by 10-min boiling water bath. Both the experiments were operated at initial concentration of total anthraquinones 50 mg/L, volumetric air flow rate 200 mL/min, pore diameter of gas distributor of 200 ± 20 μm, and temperature 30.0 ± 1.0 °C. The results show that stable foam could not be generated from the extract without proteins so that the separation was in a failure. While in the presence of proteins, the foam was stable enough to keep the foam fractionation running and at last, an enrichment ratio of total anthraquinones of 2.8 ± 0.3 with a recovery yield of 71.8 ± 3.1% was acquired. Therefore, Semen Cassiae proteins played the major role in assisting the foam fractionation of anthraquinones.
Then, with aurantio-obtusifolin, aloe-emodin, rhein, emodin, chrysophanol and physcion as standards, we used HPLC to analyze the ingredients of anthraquinones in the feed solution, foamate, and residual solution obtained under the above foam fractionation conditions. The HPLC chromatograms in Figure 3 describes that the concentration of each standard anthraquinone in the feed solution was much lower than that in the foamate and much higher than that in the residual solution. Based on the data in Figure 3, we calculated the enrichment ratios and recovery yields of standard anthraquinones. The corresponding results in Table 4 show that their enrichment ratios were ranged from 2.0 to 3.4 and recovery yields from 51.3% to 87.2%. In particular, physcion had a very low content in the feed solution, but its enrichment ratio and recovery yield reached 2.7 and 69.2%, close to those of total anthraquinones. These results further confirmed that Semen Cassiae proteins were a suitable collector for foam fractionation of anthraquinones from the Semen Cassiae extract.

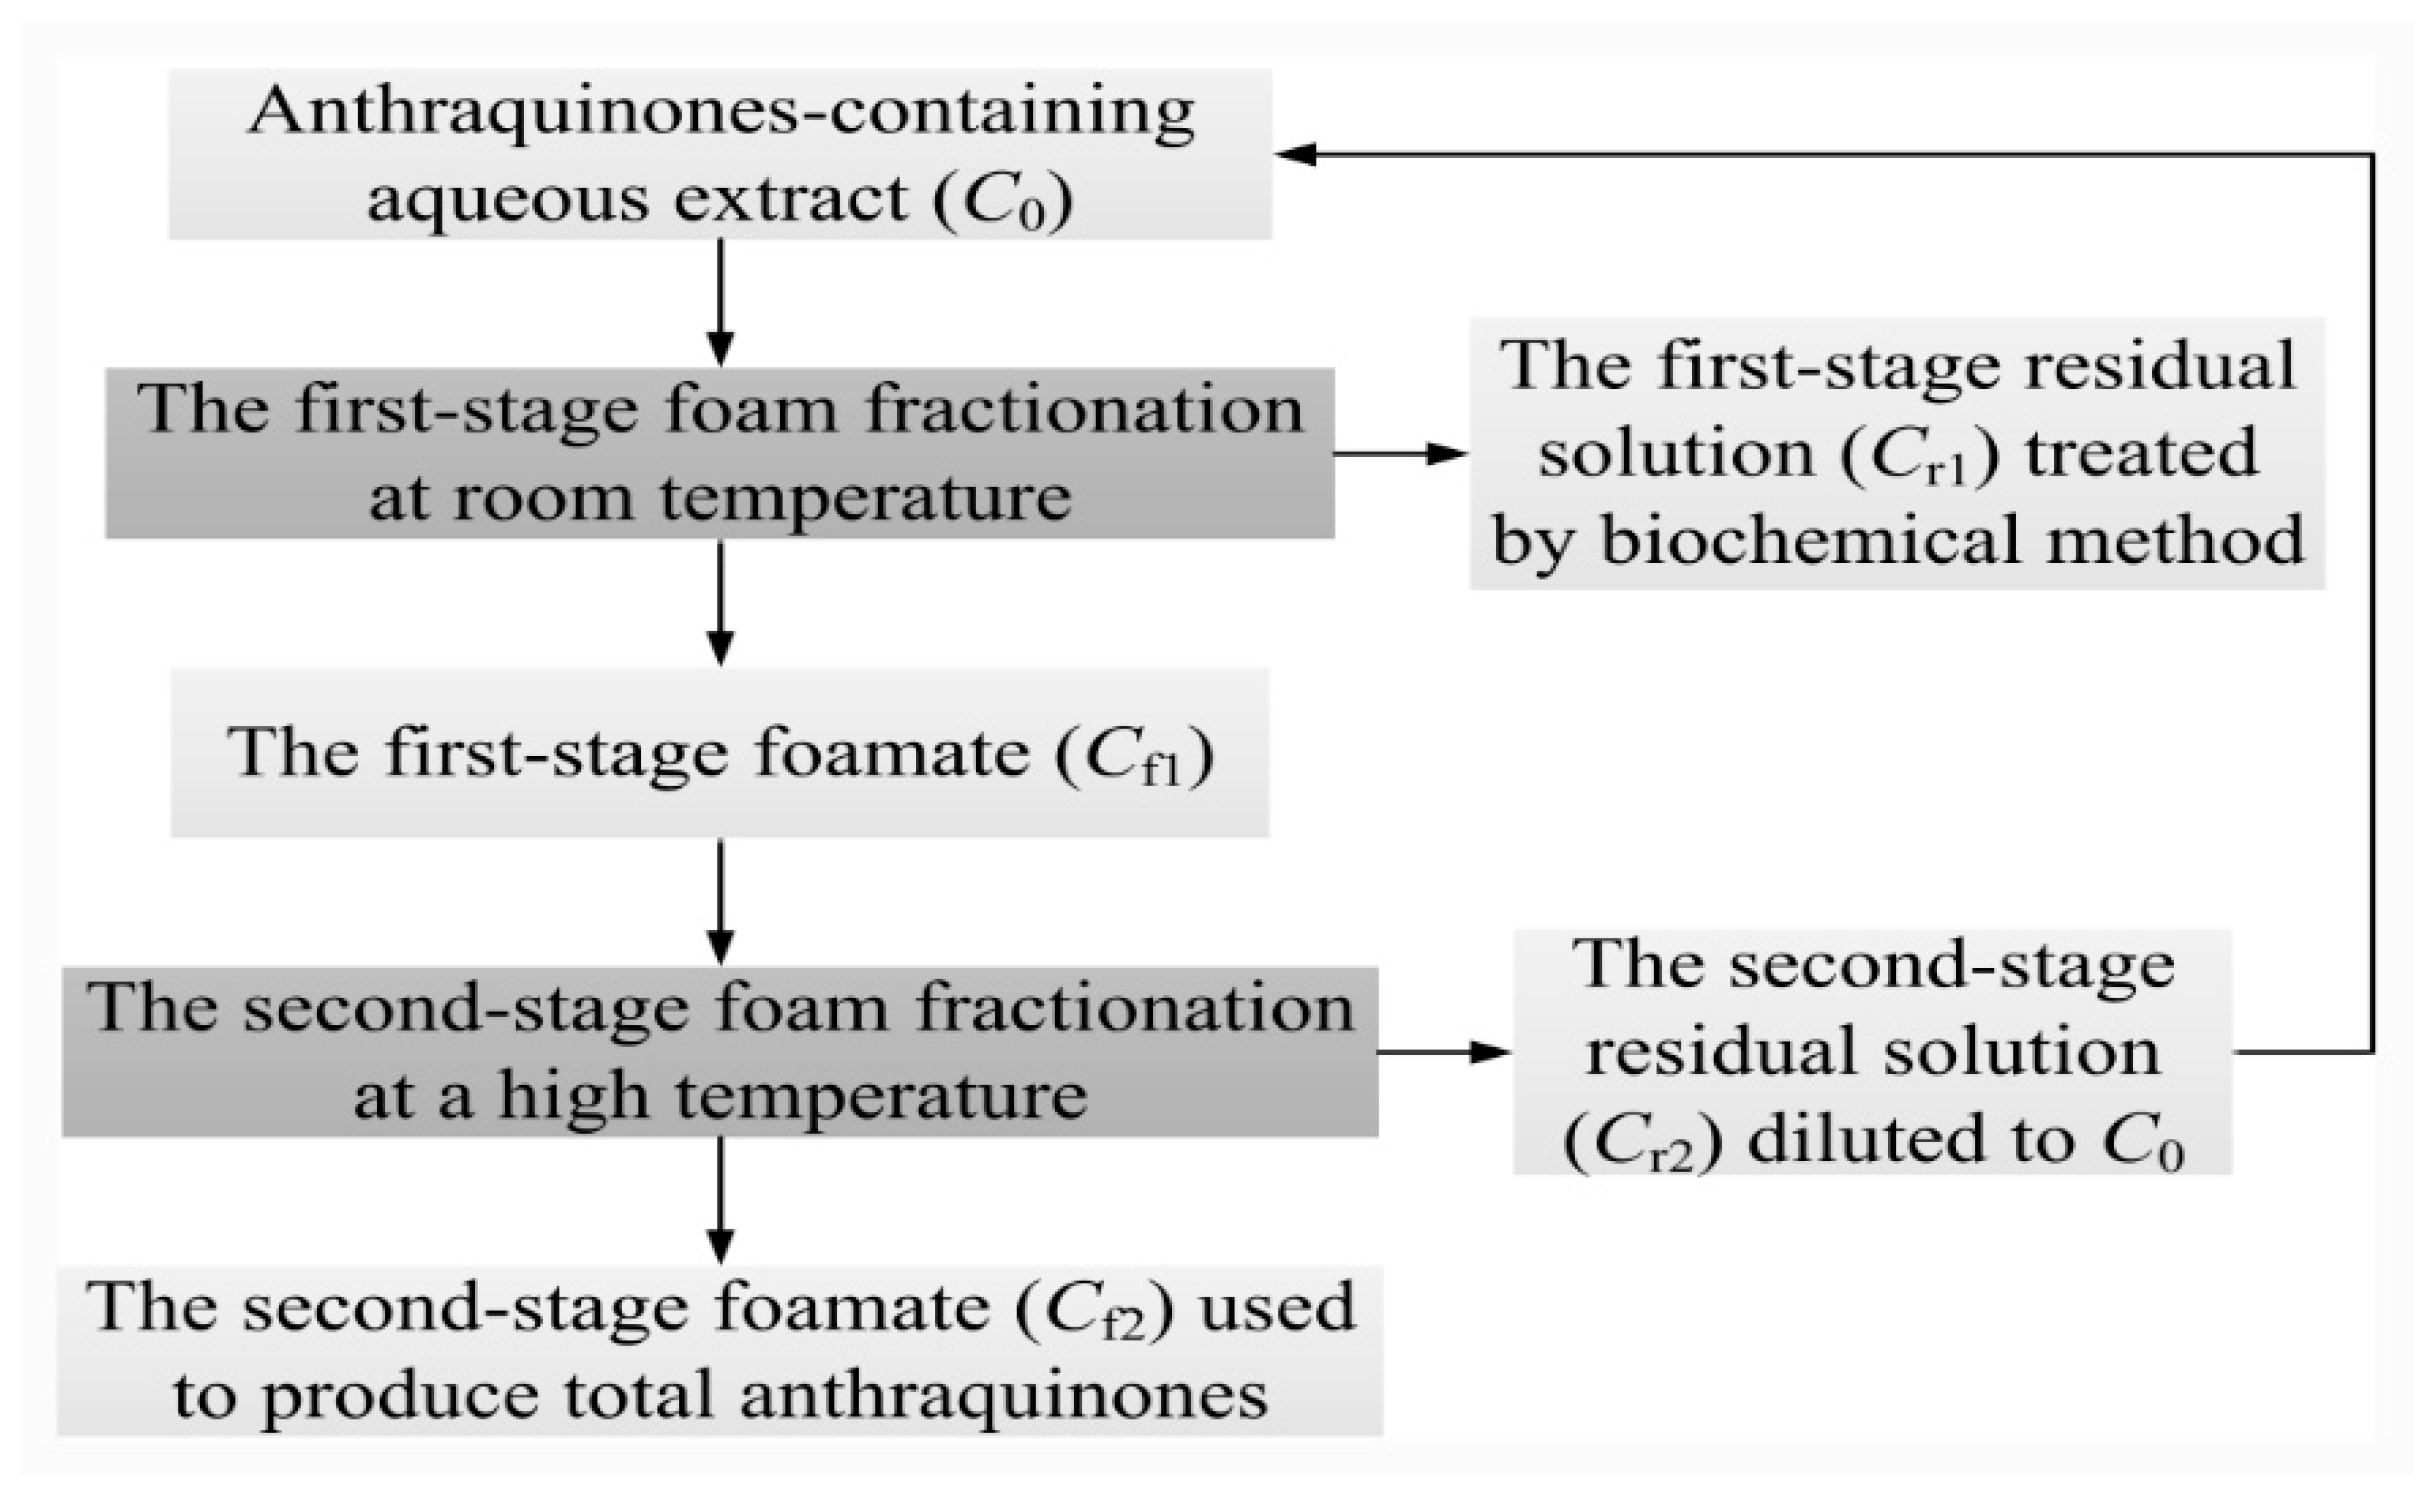
3.3. Two-Stage Foam Fractionation of the Protein-Binding Anthraquinones from Aqueous Extract of Semen Cassiae

3.3.1. Optimization of the First-Stage Foam Fractionation

Based on the results in the above subsections, we attempted to use Semen Cassiae proteins as the collector for the two-stage foam fractionation of total anthraquinones from their aqueous extract. In this subsection, we would optimize the first-stage foam fractionation process by studying the effects of VSTs, initial feed concentration of total anthraquinones, volumetric air flow rate, and pore diameter of gas distributor on E and R.

Effects of VSTs on E and R

To clearly understand the role of VSTs in foam fractionation of total anthraquinones, their effects on E and R were firstly investigated at initial feed concentration of total anthraquinones 50 mg/L, volumetric air flow rate 200 mL/min, pore diameter of gas distributor of 200 ± 20 μm, and temperatures of 25 ± 1 °C and 40 ± 1 °C. The results in Table 5 show that at each temperature, R with VSTs was higher than that without VST and the relative increases at 25 ± 1 °C and 40 ± 2 °C were 30.5 ± 1.5% and 64.5 ± 3.2%, respectively. Furthermore, VSTs did not significantly improved E at 25 ± 1 °C, but increased E by 26.9 ± 2.5% at 40 ± 2 °C. It is indicated that VSTs were able to intensify the foam fractionation of total anthraquinones from their aqueous extract, particularly at an elevated temperature. VSTs caused the contraction of the bubble flow and thus increased the velocity and the turbulence intensity of the bubbles in the bulk solution [19]. Thus, they could enhance the adsorption of the Semen Cassiae proteins and the protein-binding anthraquinones at the gas–liquid interface. The enhanced protein adsorption also increased the stability of rising foam. As a result, VSTs effectively improved R. However, the enhancement of protein adsorption also reduced bubble size in foam, and hence increased liquid holdup in foam [27]. Because it had a similar level to the increase of liquid holdup in foam at 25 ± 1 °C and a higher level at 40 ± 2 °C, E did not increase at 25 ± 1 °C but significantly increased at 40 ± 2 °C. In addition, elevating temperature could accelerate foam drainage by reducing the solution viscosity, so it increased E but decreased R [28].

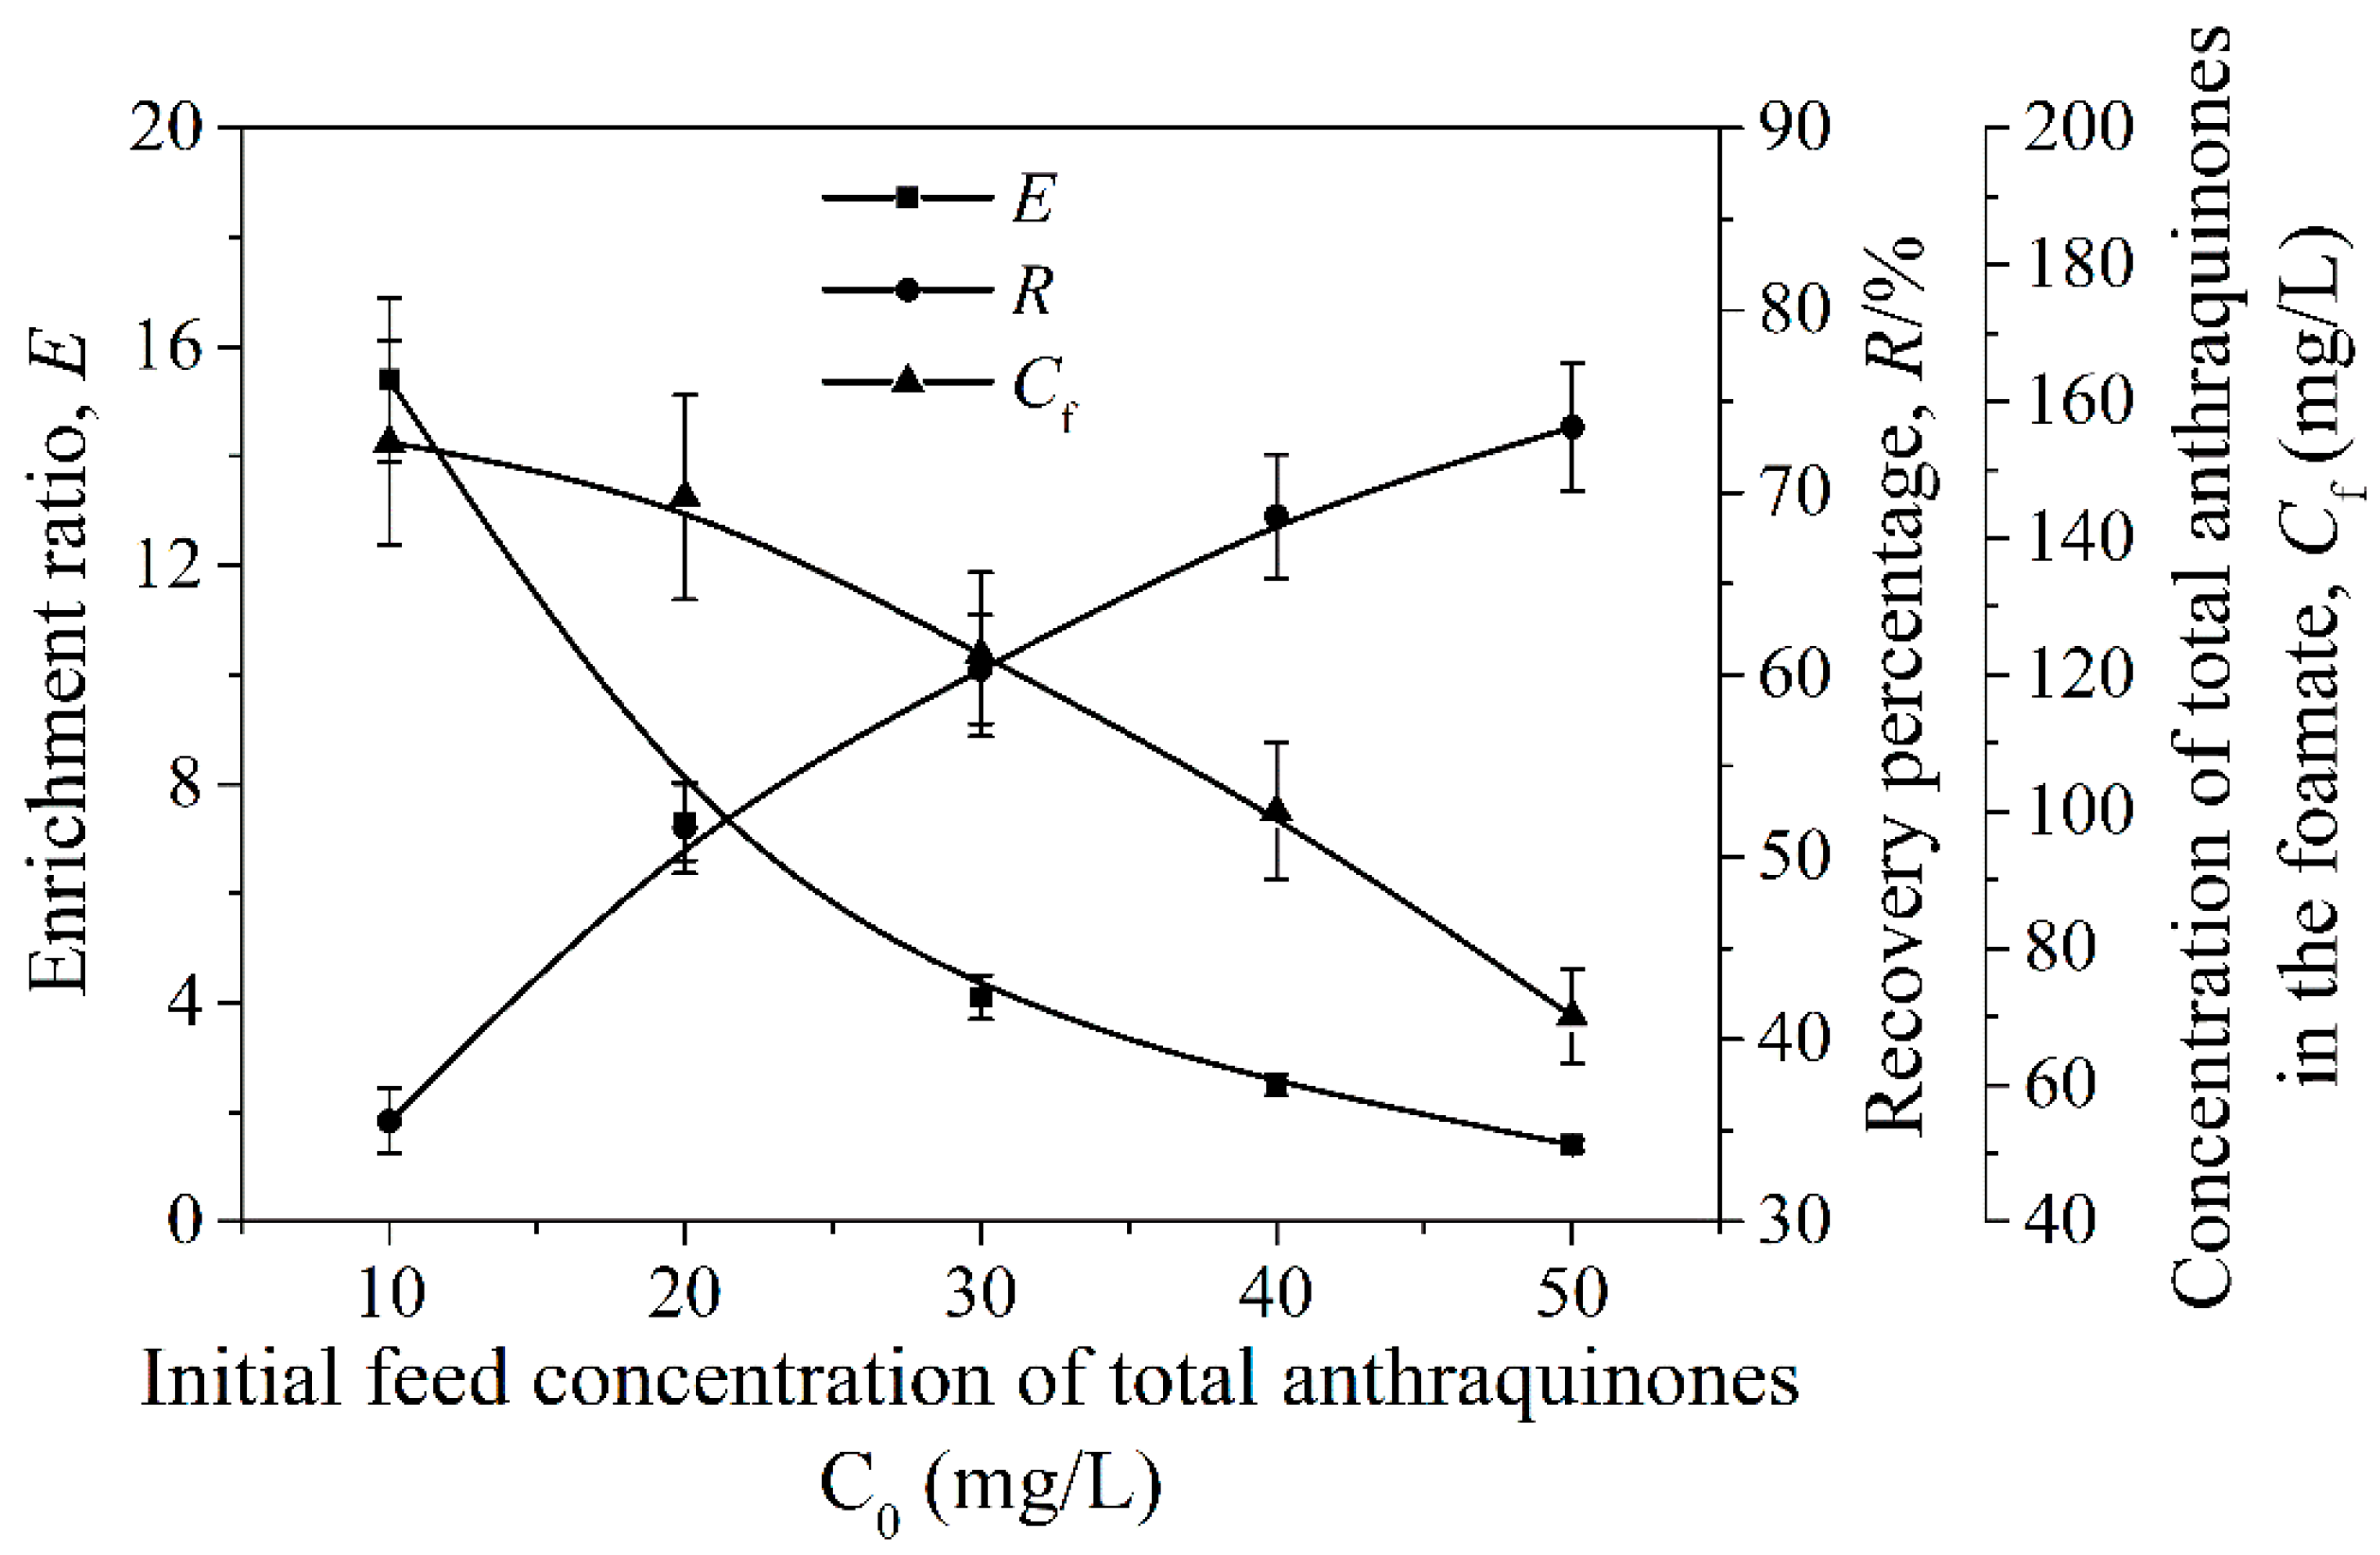
Effects of Initial Feed Concentration of Total Anthraquinones on E, R and Cf

In foam fractionation, decreasing initial feed concentration often increases enrichment ratio but reduces recovery yield [29]. Thus, to select a suitable initial feed concentration (C0) of total anthraquinones for the two-stage foam fractionation technology, its effects on E, R, and Cf were investigated using the foam fractionation column with VSTs. The experiments were operated at volumetric airflow rate 200 mL/min, pore diameter of gas distributor of 200 ± 20 μm and temperature 25 ± 1 °C. The initial feed concentration of total anthraquinones was set at 10, 20, 30, 40, and 50 mg/L. Figure 4 illustrated that the increase in C0 reduced E and Cf, but increased R. The results were consistent with those of Li et al. [18] in foam fractionation of bromelain. The protein concentration in the aqueous extract of Semen Cassiae increased with C0. Increasing protein concentration could decrease the protein enrichment ratio and increase the protein recovery yield [30]. Furthermore, the anthraquinones in the extract had good protein-binding affinity. Therefore, E decreased while R increased with increasing C0. According to Equation (1), Cf was determined jointly by C0 and E. The decrease in E was larger than the increase in C0, so Cf gradually decreased as C0 increased. In Figure 4, Cf at 20 mg/L had no significant difference from that at 10 mg/L while R at 20 mg/L was 45.3 ± 2.2% higher than that at 10 mg/L. Thus, 20 mg/L was chosen as a suitable initial feed concentration of total anthraquinones for the two-stage foam fractionation technology.

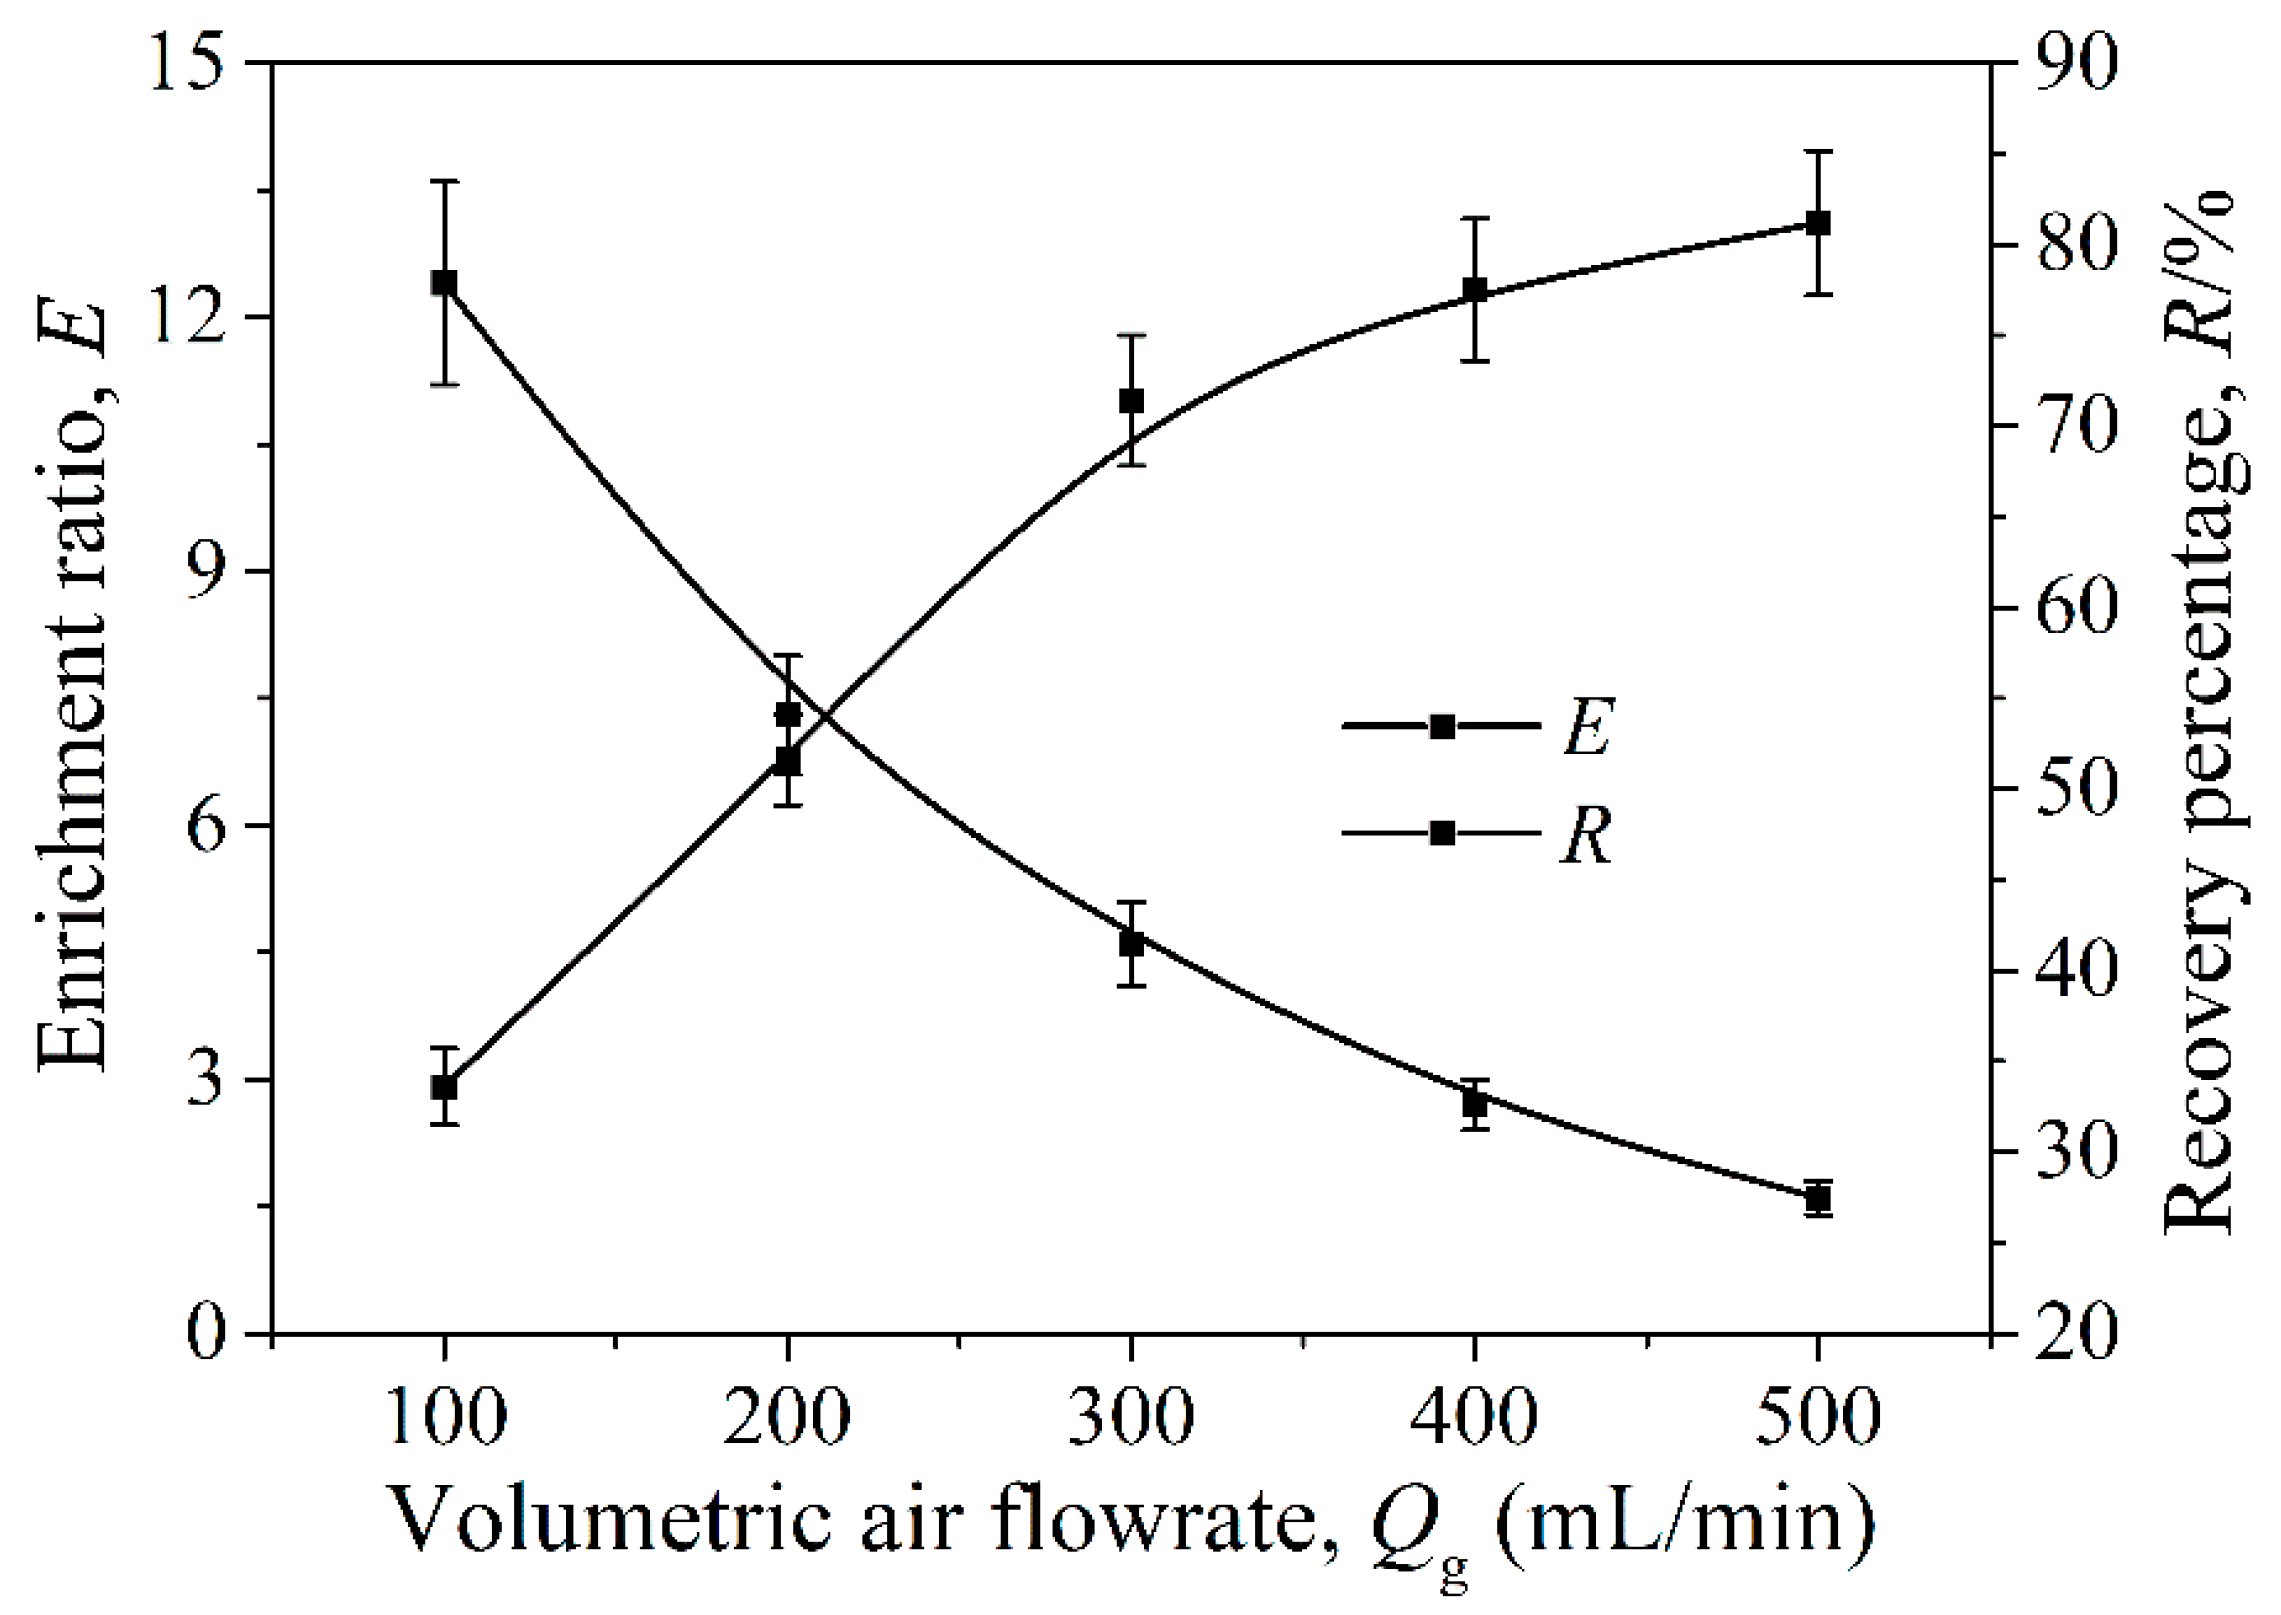
Effects of Volumetric Air Flow Rate on E and R

In this subsection, the effects of volumetric air flow rate (Qg) on E and R were investigated at pore diameter of gas distributor of 200 ± 20 μm and temperature 25 ± 1 °C. The studied Qg values were 100, 200, 300, 400, and 500 mL/min. From Figure 5, E decreased from 12.4 ± 1.2 to 1.6 ± 0.2, while R increased from 33.6 ± 2.1% to 81.6 ± 4.0% with Qg increasing from 100 mL/min to 500 mL/min. The results were in agreement with those of in foam fractionation of surfactin [31]. The increase in Qg accelerated the generation rate of bubbles so that the total area of the gas–liquid interface increased. Then, the amount of total anthraquinones binding with adsorbed proteins at the gas–liquid interface rose. However, increasing Qg shortened the time for foam drainage in the foam fractionation column, so the liquid holdup in rising foam increased. Therefore, R increased while E decreased as Qg increased. The statistical analysis of the results in Figure 5 indicates that with Qg increasing over 300 mL/min, R did not significantly increased while E significantly decreased. To obtain a high R with a relative high E, 300 mL/min was selected as a suitable Qg.

Effects of Pore Diameter of Gas Distributor on E and R

Bubble size, as an important parameter influencing foam fractionation performances, is readily affected by pore diameter of gas distributor (dg) [32]. Thus, in this subsection, the effects of dg on E and R were investigated at volumetric airflow rate 300 mL/min and temperature 25 ± 1 °C. The studied dg values were 100 ± 20, 200 ± 20, 400 ± 20, and 600 ± 20 μm. Increasing dg could increase bubble size in rising foam and whereby decrease the foam liquid holdup [33]. As a result, E increased from 4.1 ± 0.5 to 7.4 ± 0.7, while R reduced from 74.5 ± 3.4% to 58.4 ± 2.9% as dg increased, as illustrated in Table 6. Furthermore, in the range of dg from 200 ± 20 μm to 400 ± 20 μm, the increase in E was more significant than the increase in R. Thus, 400 ± 20 μm was selected as a suitable dg.
Based on the above efforts, a high E and R of 6.1 ± 0.6 and 65.2 ± 3.2% were obtained at liquid loading volume 1000 mL, volumetric airflow rate 300 mL/min, pore diameter of gas distributor of 400 ± 20 μm and temperature 25 ± 1 °C. In the foamate, the concentration of total anthraquinones reached 122 ± 12 mg/L with a total protein concentration of 1637 mg/L.

3.3.2. Optimization of the Second-Stage Foam Fractionation

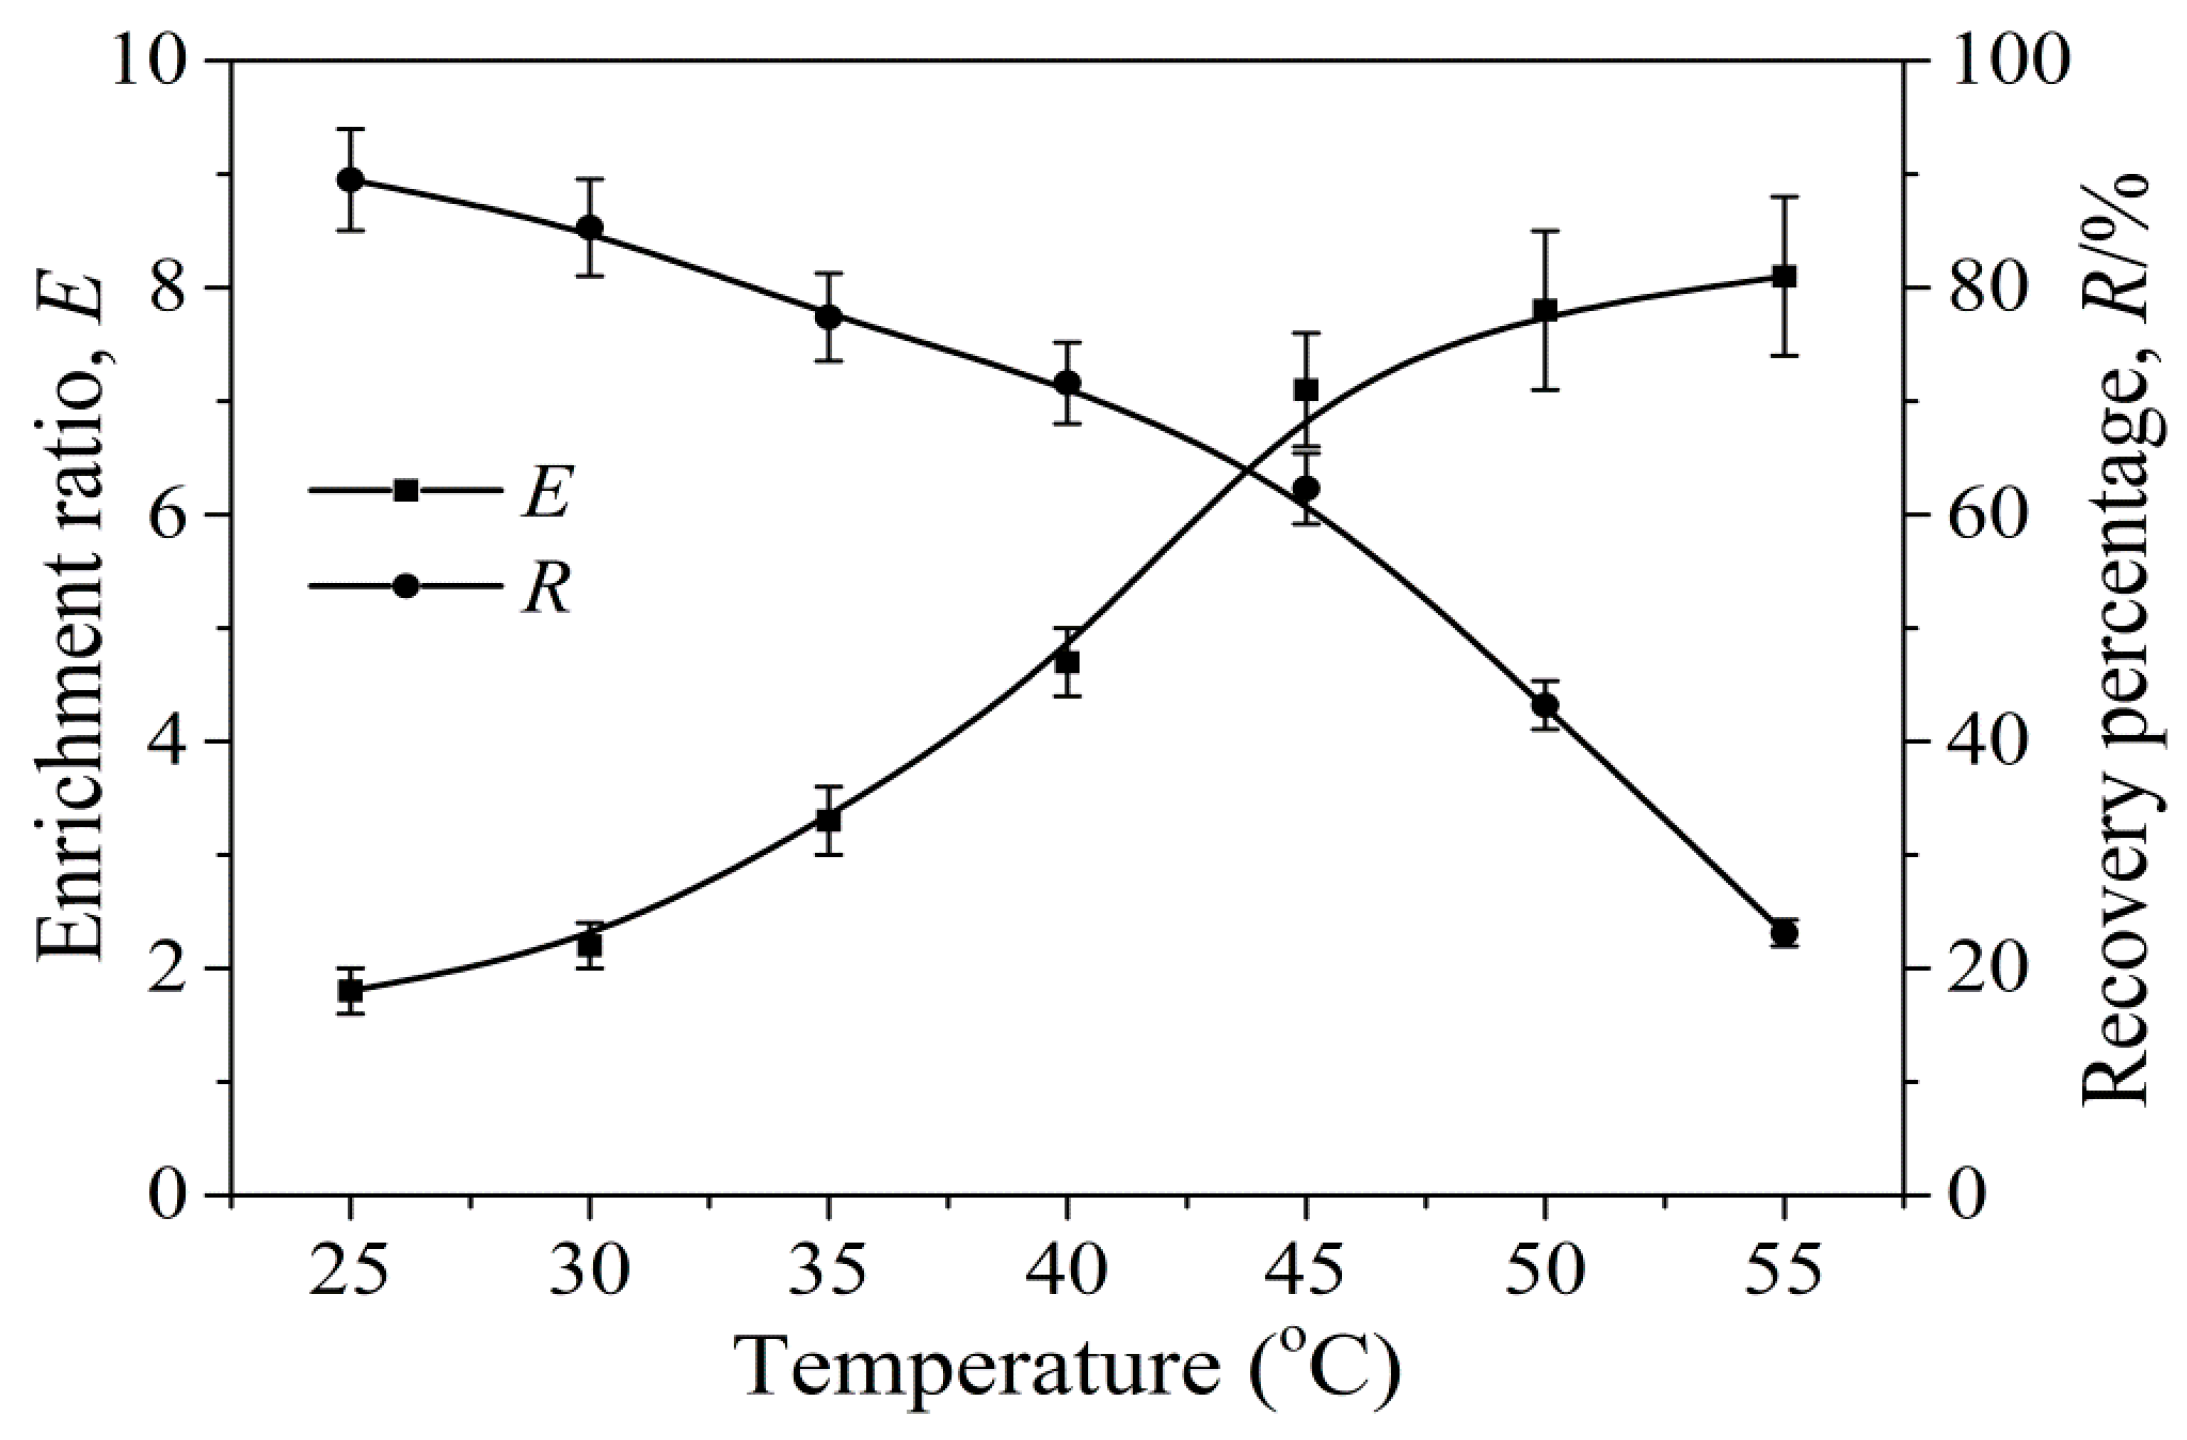
Effects of Temperature on E and R

Using the first-stage foamate as the feed solution the second-stage foam fractionation was optimized in this subsection. Because the feed solution had a relatively high protein concentration which readily resulted in a low enrichment ratio, we attempted to use elevating temperature to increase the concentration of total anthraquinones in the foamate [34]. Thus, the effects of temperature on E and R were investigated using the foam fractionation column in Figure 1. The experiments were carried out at volumetric airflow rate 200 mL/min and pore diameter of gas distributor of 400 ± 20 μm. The studied temperatures were 25, 30, 35, 40, 45, 50, and 55 °C. Elevating temperature could enhance foam drainage by reducing the solution viscosity [18]. Thus, Figure 6 shows that E increased from 1.8 ± 0.2 to 8.1 ± 0.7 while R decreased from 89.5 ± 4.5% to 23.1 ± 1.2% with temperature increasing from 25 °C to 55 °C. The similar trends were also observed by Wu et al. [13] in foam fractionation of trans-resveratrol. In the temperature range of 45 °C to 55 °C, the increased temperature could intensify molecular movement so that the Semen Cassiae proteins were not readily adsorbed at the gas–liquid interface [35]. In addition, the interactions between proteins and anthraquinones might become weak. Therefore, the sharp decrease in R and the slight increase in E were observed in this temperature range.

Optimization of the Second-Stage Foam Fractionation Using Orthogonal Test

Because the effects of temperature, volumetric air flow rate and pore diameter of gas distributor on E and R had been investigated in the above subsections, an orthogonal test was used to further optimize the second-stage foam fractionation using the three factors with their levels in Table 7. Table 8 shows the results of the orthogonal test and the direct analyzes for them. According to the values of KE, volumetric air flow rate had the most significant effect on E. The results were similar to those of Li et al. [18]. At 50 °C, volumetric air flow rate 100 mL/min and pore diameter of gas distributor 600 ± 20 μm, the highest E of 10.4 ± 1.1 with a low R of 23.5 ± 1.5%. In terms of R, it was most significantly affected by temperature. In addition, the influence of temperature was more distinct than that of volumetric air flow rate. At 40 °C, volumetric air flow rate 300 mL/min and pore diameter of gas distributor 600 ± 20 μm, the highest R of 85.7 ± 4.7% was obtained with a low E of 3.9 ± 0.4. However, both the results were not suitable for the second-stage foam fractionation due to the low E or R. At 45 °C, volumetric air flow rate 200 mL/min and pore diameter of gas distributor 600 ± 20 μm, both E (7.7 ± 0.8) and R (58.4 ± 3.1%) were relatively high, so the conditions were suitable for the second-stage foam fractionation.
Using the two-stage foam fractionation technology, E reached as high as 47.0 ± 4.5 with a concentration of total anthraquinones of 939 ± 94 mg/L while R reached more than 47.7% by reusing the second-stage residual solution as the first-stage feed solution. Therefore, with Semen Cassiae proteins as collectors, total anthraquinones were effectively recovered from the extract of Semen Cassiae by the two-stage foam fractionation technology.

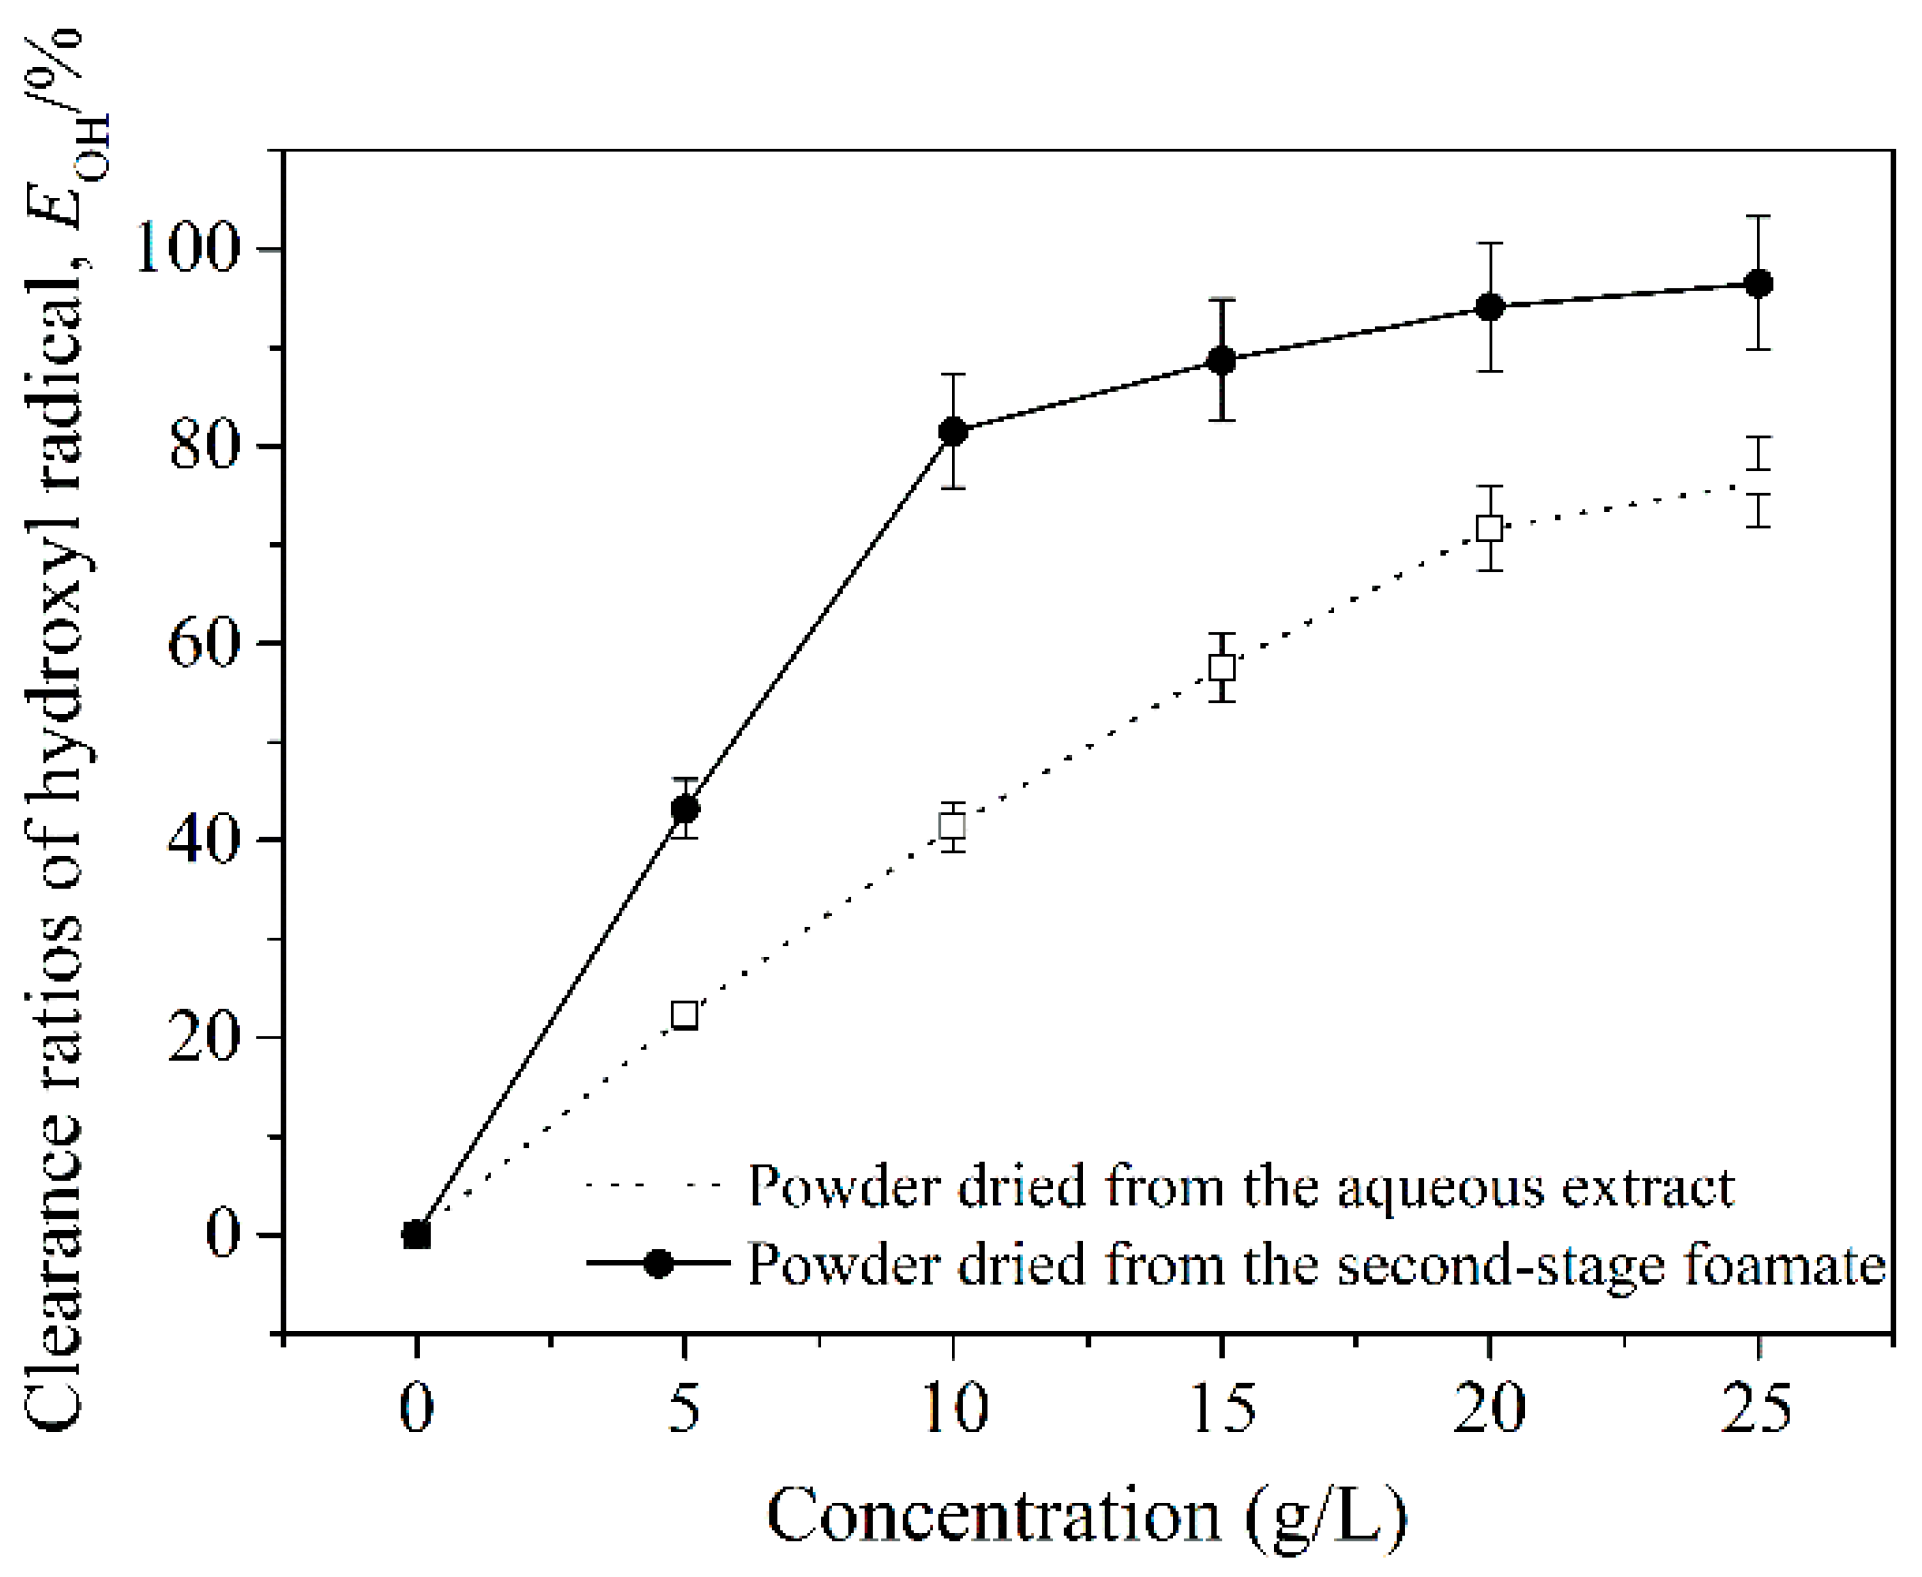
3.4. Hydroxyl Radical Scavenging Activity of Semen Cassiae Anthraquinones in Aqueous Extract and Foamate

Based on the above results, we dried the aqueous extract of Semen Cassiae and the second-stage foamate using freeze drying and compared their hydroxyl radical scavenging activity in light of the antioxidant activity of anthraquinones. The relative contents of total anthraquinones in the two kinds of freeze-dried powders were measured to be 4.5 ± 0.4% (m/m) and 9.6 ± 0.7% (m/m), respectively. In the experiments, the two kinds of freeze-dried powders were dissolved in deionized water to prepare the anthraquinone-containing sample solutions at concentrations of 0, 5.0, 10.0, 15.0, 20.0, and 25.0 g/L. Figure 7 shows the clearance ratios of hydroxyl radical (EOH) of the two powders at different concentrations. Both values of EOH rose quickly and then slowly with the powder concentration increasing. Because foam fractionation improved the relative content of total anthraquinones, the increase of EOH of the powder dried from the second-stage foamate was more significant. More importantly, the maximal EOH of the powder dried from the second-stage foamate was much higher than that of the powder dried from the aqueous extract. The results indicate that foam fractionation also increased the relative content of anthraquinones with high antioxidant activity in the total ones.

4. Conclusions

The Stem–Volmer analysis determined that physcion was able to interact with the proteins derived from Semen Cassiae. Furthermore, aurantio-obtusifolin, aloe-emodin, rhein, emodin, chrysophanol, and physcion could be enriched effectively by foam fractionation with the Semen Cassiae proteins as collectors. Based on these results, a two-stage foam fractionation technology was used to separate total anthraquinones from the aqueous extract of Semen Cassiae without addition of any surface-active compounds. Under the optimal conditions of initial concentration of total anthraquinones 20 mg/L, liquid loading volume 1000 mL, and volumetric airflow rate 300 mL/min—pore diameter of gas distributor of 400 ± 20 μm and temperature 25 ± 1 °C for the first stage and temperature 45 °C, volumetric airflow rate 200 mL/min, and pore diameter of gas distributor 600 ± 20 μm for the second stage—the enrichment ratio and recovery yield of total anthraquinones reached 47.0 ± 4.5 and more than 47.7%, respectively. In addition, the purity and hydroxyl radical scavenging activity of total anthraquinones in the second-stage foamate were much higher than those of total anthraquinones in the aqueous extract. The results had significant implications for the separation of anthraquinones from Semen Cassiae. In the future, the specific affinity between each anthraquinone and protein in the extract of Semen Cassiae should be clearly studied. On this basis, the selectivity of foam fractionation will be improved to obtain a high-level purification of anthraquinones.

Author Contributions

Conceptualization, M.W.; Data curation, L.D., Y.W. and R.L.; Formal analysis, C.Y.; Investigation, C.Y.; Methodology, Y.W.; Resources, Z.W.; Software, Z.W.; Supervision, Y.S.; Writing—original draft, L.D. and R.L.; Writing—review & editing, R.L.

Funding

This research was funded by Nature Science Foundation of Changzhou Institute of Technology (Grant No. YN18035), Innovation and Entrepreneurship Training Program for College Students of Changzhou Institute of Technology (Grant No. 2018247Y), Qinglan Project of Jiangsu Province (Grant No. 2019) and Science and Technology Development Project of Chinese Medicine of Shandong Province, China (Grant No. 2017-268).

Conflicts of Interest

The authors declare no conflict of interest.

References

  1. Yang, B.; Hu, J.; Zhu, X.; Zhuang, Y.; Yin, F.; Qin, K.; Cai, B. Qualitative analysis of multiple compounds in raw and prepared Semen Cassiae coupled with multiple statistical strategies. J. Sep. Sci. 2017, 40, 4718–4729. [Google Scholar] [CrossRef] [PubMed]
  2. Zhang, W.D.; Wang, Y.; Wang, Q.; Yang, W.J.; Gu, Y.; Wang, R.; Song, X.M.; Wang, X.J. Quality evaluation of Semen Cassiae (Cassia obtusifolia L.) by using ultra-high performance liquid chromatography coupled with mass spectrometry. J. Sep. Sci. 2012, 35, 2054–2062. [Google Scholar] [CrossRef] [PubMed]
  3. Yang, C.; Wang, S.; Guo, X.; Sun, J.; Liu, L.; Wu, L. Simultaneous determination of seven anthraquinones in rat plasma by ultra high performance liquid chromatography-tandem mass spectrometry and pharmacokinetic study after oral administration of Semen Cassiae extract. J. Ethnopharmacol. 2015, 169, 305–313. [Google Scholar] [CrossRef] [PubMed]
  4. Kwon, K.S.; Lee, J.H.; So, K.S.; Park, B.K.; Lim, H.; Choi, J.S.; Kim, H.P. Aurantio-btusin, an anthraquinone from cassiae semen, ameliorates lung inflammatory responses. Phytother. Res. 2018, 32, 1537–1545. [Google Scholar] [CrossRef] [PubMed]
  5. Xu, L.; Chan, C.O.; Lau, C.C.; Yu, Z.; Mok, D.K.; Chen, S. Simultaneous determination of eight anthraquinones in Semen Cassiae by HPLC-DAD. Phytochem. Anal. 2012, 23, 110–116. [Google Scholar] [CrossRef] [PubMed]
  6. Xu, Y.L.; Tang, L.Y.; Zhou, X.D.; Zhou, G.H.; Wang, Z.J. Five new anthraquinones from the seed of Cassia obtusifolia. Arch. Pharmacal Res. 2015, 38, 1054–1058. [Google Scholar] [CrossRef] [PubMed]
  7. Wang, N.; Su, M.; Liang, S.; Sun, H. Investigation of six bioactive anthraquinones in slimming tea by accelerated solvent extraction and high performance capillary electrophoresis with diode-array detection. Food Chem. 2016, 199, 1–7. [Google Scholar] [CrossRef] [PubMed]
  8. Duval, J.; Pecher, V.; Poujol, M.; Lesellier, E. Research advances for the extraction, analysis and uses of anthraquinones: A review. Ind. Crop. Prod. 2016, 94, 812–833. [Google Scholar] [CrossRef]
  9. Weng, W.C.; Sheu, S.J. Separation of anthraquinones by capillary electrophoresis and high-performance liquid chromatography. J. High Resolut. Chromatogr. 2000, 23, 143–148. [Google Scholar] [CrossRef]
  10. Ghosh, R.; Sahu, A.; Pushpavanam, S. Removal of trace hexavalent chromium from aqueous solutions by ion foam fractionation. J. Hazard. Mater. 2019, 367, 589–598. [Google Scholar] [CrossRef]
  11. Wanschura, R.; Windeisen, E.; Richter, K. Application of foam fractionation to wood. Wood Sci. Technol. 2019, 53, 349–371. [Google Scholar] [CrossRef]
  12. Liu, W.; Lv, Y.; Tian, S.; Zhang, M.; Shu, T.; Hu, N.; Wu, Z. Foam fractionation for effective recovery of resveratrol from the leaching liquor of Polygonum cuspidatum by using partially ethylated β-cyclodextrin as collector and frother. Ind. Crop. Prod. 2018, 112, 420–426. [Google Scholar] [CrossRef]
  13. Wu, Z.; Li, N.; Zhang, X.; Xu, Y.; Shu, T.; Liu, W.; Hu, B. Effective recovery of trans-resveratrol from the leaching solution of muscat grape pomace by developing a novel technology of foam fractionation. J. Food Eng. 2019, 241, 41–50. [Google Scholar] [CrossRef]
  14. Huang, J.; Zhu, L.; Zeng, G.; Shi, L.; Shi, Y.; Yi, K.; Li, X. Recovery of Cd (II) and surfactant in permeate from MEUF by foam fractionation with anionic-nonionic surfactant mixtures. Coll. Surf. A Hysicochem. Eng. Asp. 2019, 570, 81–88. [Google Scholar] [CrossRef]
  15. Eksborg, S.; Ehrsson, H.; Ekqvist, B. Protein binding of anthraquinone glycosides, with special reference to adriamycin. Cancer Chemother. Pharmacol. 1982, 10, 7–10. [Google Scholar] [CrossRef] [PubMed]
  16. Bi, S.; Song, D.; Kan, Y.; Xu, D.; Tian, Y.; Zhou, X.; Zhang, H. Spectroscopic characterization of effective components anthraquinones in Chinese medicinal herbs binding with serum albumins. Spectrochim. Acta Part. A Mol. Biomol. Spectrosc. 2005, 62, 203–212. [Google Scholar] [CrossRef] [PubMed]
  17. Xu, H.; Lu, Y.; Zhang, T.; Liu, K.; Liu, L.; He, Z.; Xu, B.; Wu, X. Characterization of binding interactions of anthraquinones and bovine β-lactoglobulin. Food Chem. 2019, 281, 28–35. [Google Scholar] [CrossRef] [PubMed]
  18. Li, R.; Ding, L.; Wu, Z.; Wang, Y.; Liu, W.; Wang, Y. β-cyclodextrin assisted two-stage foam fractionation of bromelain from the crude extract of pineapple peels. Ind. Crop. Prod. 2016, 94, 233–239. [Google Scholar] [CrossRef]
  19. Zhang, Z.; Zhang, Y.; Wu, Z.; Zhang, Q.; Wang, Y. Intensification of the interfacial adsorption of whey soy protein in the liquid phase using a foam separation column with the vertical sieve tray internal. Ind. Crop. Prod. 2014, 53, 308–313. [Google Scholar] [CrossRef]
  20. Anjusha, S.; Gangaprasad, A. Callus culture and in vitro production of anthraquinone in Gynochthodes umbellata (L.) Razafim. & B. Bremer (Rubiaceae). Ind. Crop. Prod. 2017, 95, 608–614. [Google Scholar]
  21. Husain, S.R.; Cillard, J.; Cillard, P. Hydroxyl radical scavenging activity of flavonoids. Phytochemistry 1987, 26, 2489–2491. [Google Scholar] [CrossRef]
  22. Yan, H.; Hider, R.C.; Ma, Y. Synthesis, characterisation and quantum chemical studies of a new series of iron chelatable fluorescent sensors. Mol. Phys. 2019, 117, 661–671. [Google Scholar] [CrossRef]
  23. Sedmak, J.J.; Grossberg, S.E. A rapid, sensitive, and versatile assay for protein using Coomassie brilliant blue G250. Anal. Biochem. 1977, 79, 544–552. [Google Scholar] [CrossRef]
  24. Qin, Y.; Zhang, Y.; Yan, S.; Ye, L. A comparison study on the interaction of hyperoside and bovine serum albumin with Tachiya model and Stern-Volmer equation. Spectrochim. Acta Part. A Mol. Biomol. Spectrosc 2010, 75, 1506–1510. [Google Scholar] [CrossRef]
  25. Qi, J.; Li, B.; Wang, X.; Zhang, Z.; Wang, Z.; Han, J.; Chen, L. Three-dimensional paper-based microfluidic chip device for multiplexed fluorescence detection of Cu2+ and Hg2+ ions based on ion imprinting technology. Sens. Actuators B Chem. 2017, 251, 224–233. [Google Scholar] [CrossRef]
  26. Panigrahi, G.K.; Suthar, M.K.; Verma, N.; Asthana, S.; Tripathi, A.; Gupta, S.K.; Saxena, J.K.; Das, M. Investigation of the interaction of anthraquinones of Cassia occidentalis seeds with bovine serum albumin by molecular docking and spectroscopic analysis: Correlation to their in vitro cytotoxic potential. Food Res. Int. 2015, 77, 368–377. [Google Scholar] [CrossRef]
  27. Asghari, A.K.; Norton, I.; Mills, T.; Sadd, P.; Spyropoulos, F. Interfacial and foaming characterisation of mixed protein-starch particle systems for food-foam applications. Food Hydrocoll. 2016, 53, 311–319. [Google Scholar] [CrossRef] [Green Version]
  28. Li, R.; Xintong, J.; Youshuang, Z.; Yuran, Z.; Jing, G. Precipitation of proteins from soybean whey wastewater by successive foaming and defoaming. Chem. Eng. Process. 2018, 128, 124–131. [Google Scholar] [CrossRef]
  29. Chen, Y.C.; Parlar, H. Enrichment behavior of immunoglobulin by foam fractionation using response surface methodology. Sep. Purif. Technol. 2013, 107, 102–108. [Google Scholar] [CrossRef] [Green Version]
  30. Li, R.; Fu, N.; Wu, Z.; Wang, Y.; Wang, Y. Protein aggregation in foam fractionation of bovine serum albumin: Effect of protein concentration. Biochem. Eng. J. 2015, 103, 234–241. [Google Scholar] [CrossRef]
  31. Firmani Perna, R.; Pereira Gonçalves, M.C.; Costapinto Santana, C. Ascertainment of surfactin concentration in bubbles and foam column operated in semi-batch. Processes 2019, 7, 154. [Google Scholar] [CrossRef]
  32. Huang, Y.; Zhao, S.; Ding, Y.D.; Liao, Q.; Huang, Y.; Zhu, X. Optimizing the gas distributor based on CO2 bubble dynamic behaviors to improve microalgal biomass production in an air-lift photo-bioreactor. Bioresour. Technol. 2017, 233, 84–91. [Google Scholar] [CrossRef]
  33. Li, R.; Chen, X.E.; Chang, Y.; Zhang, L.; Zhang, Y.; Zhu, Y.; Wang, T. Increase of bubble size playing a critical role in foam-induced protein aggregation: Aggregation of BSA in foam fractionation. Chem. Eng. Sci. 2017, 174, 387–395. [Google Scholar] [CrossRef]
  34. Liu, W.; Wu, Z.; Wang, Y.; Li, R.; Huang, D. Isolation of soy whey proteins from isoflavones in the concentrated solution using foam fractionation. Sep. Purif. Technol. 2015, 149, 31–37. [Google Scholar] [CrossRef]
  35. Delahaije, R.J.; Lech, F.J.; Wierenga, P.A. Investigating the effect of temperature on the formation and stabilization of ovalbumin foams. Food Hydrocoll. 2019, 91, 263–274. [Google Scholar] [CrossRef]
Figure 1. Schematic diagram of the foam fractionation column with vertical sieve trays.
Processes 07 00463 g001
Scheme 1. Schematic diagram of the two-stage foam fractionation technology for separating total anthraquinones from their aqueous extract.
Processes 07 00463 sch001
Figure 2. Fluorescence quenching spectra of Semen Cassiae proteins at 25.0 °C, concentration of soluble proteins 0.2 g/L, and physcion concentrations of 0, 0.07, 0.14, 0.21 and 0.28 mmol/L.
Processes 07 00463 g002
Figure 3. HPLC chromatograms of anthraquinones in standard solution (I), feed solution (II) foamate (III) and residual solution (IV). The standard solution had six anthraquinones of 1-urantio-obtusifolin, 2-aloe-emodin, 3-rhein, 4-emodin, 5-chrysophanol, and 6-physcion.
Processes 07 00463 g003
Figure 4. Effects of initial feed concentration of total anthraquinones in the feed solution on enrichment ratio and recovery percentage of total anthraquinones and their concentration in the foamate.
Processes 07 00463 g004
Figure 5. Effects of volumetric airflow rate on enrichment ratio and recovery percentage of total anthraquinones.
Processes 07 00463 g005
Figure 6. Effects of temperature on enrichment ratio and recovery percentage of total anthraquinones.
Processes 07 00463 g006
Figure 7. Variations of clearance ratio of hydroxyl radical with concentrations of powders dried from the aqueous extract of Semen Cassiae and the second-stage foamate.
Processes 07 00463 g007
Table 1. Representative anthraquinones isolated from Semen Cassiae and their molecular structures.
AnthraquinonylR1R2R3R6R7R8
Emodin Processes 07 00463 i001HOHHHHH
ChrysophanolOHHCH3HHOH
RheinOHHHCOOHHOH
PhyscionOHHOCH3CH3HOH
ObtusinOCH3OHCH3OCH3OCH3OH
Physcion-8-O-β-glucosideOHHCH3OCH3HGlu
Table 2. Binding constants (Ka) and binding sites (n) of physcion and Semen Cassiae proteins at 26.0, 31.0 and 37.0 °C.
Temperature (°C)Ka (mol−1)nLinear Correlation Coefficient, R2
26.01.17 × 1031.0600.9981
31.01.33 × 1030.9830.9990
37.01.63 × 1030.9250.9971
Table 3. Thermodynamic parameters of interaction between physcion and Semen Cassiae proteins.
Temperature (°C)G (kJ/mol)H (kJ/mol)S (J/mol·K)
26.0−17.4523.3136.3
31.0−18.13
37.018.95
Table 4. Enrichment ratios and recovery yields of urantio-obtusifolin, aloe-emodin, rhein, emodin, chrysophanol, and physcion calculated on the basis of the data in Figure 3.
Aurantio-ObtusifolinAloe-EmodinRheinEmodinChrysophanolPhyscion
E2.22.03.22.83.42.7
R/%56.451.382.071.887.169.2
Table 5. Effects of vertical sieve trays (VSTs) on enrichment ratio (E), and recovery percentage (R) of total anthraquinones at temperatures 25 ± 1 °C and 40 ± 2 °C.
E R/%
TemperatureWith VSTWithout VSTWith VSTWithout VST
25 ± 1 °C1.4 ± 0.11.5 ± 0.173.6 ± 3.556.4 ± 2.7
40 ± 2 °C6.6 ± 0.65.2 ± 0.541.8 ± 2.125.4 ± 1.6
Table 6. Effects of pore diameter of gas distributor on enrichment ratio (E) and recovery percentage (R) of total anthraquinones.
Pore Diameter of Gas Distributor (μm)ER/%
100 ± 204.1 ± 0.574.5 ± 3.4
200 ± 204.6 ± 0.571.4 ± 3.6
400 ± 206.1 ± 0.665.2 ± 3.2
600 ± 207.4 ± 0.758.4 ± 2.9
Table 7. Factors and levels of the orthogonal test for the second-stage foam fractionation.
FactorsLevels
123
A, temperature (°C)404550
B, volumetric air flow rate (mL/min)100200300
C, pore diameter of gas distributor (μm)200 ± 20 μm400 ± 20 μm600 ± 20 μm
Table 8. The direct analyses for the results of the orthogonal test.
No.ABCER/%
140100200 ± 20 6.4 ± 0.663.4 ± 3.2
240200400 ± 20 4.7 ± 0.571.6 ± 3.5
340300600 ± 20 3.9 ± 0.485.7 ± 4.7
445100400 ± 20 9.3 ± 0.743.5 ± 2.6
545200600 ± 20 7.7 ± 0.858.4 ± 3.1
645300200 ± 20 4.1 ± 0.564.9 ± 3.3
750100600 ± 20 10.4 ± 1.123.5 ± 1.5
850200200 ± 20 7.3 ± 0.651.7 ± 2.8
950300400 ± 20 5.5 ± 0.556.8 ± 2.5
M1E5.008.705.93
M2E7.036.566.50
M3E7.734.507.33
M1R73.5743.4760.00
M2R55.6060.5757.30
M3R44.0069.1355.87
KE2.734.201.40
KR29.5725.664.13
MiE, and MiR denote the mean values of enrichment ratios and recovery percentages obtained at the ith level of each factor, respectively. KE and KR denote the differences between the maximal and minimal values of MiE and MiR of each factor, respectively.

