Article

Optimization of Total Anthocyanin Content, Stability and Antioxidant Evaluation of the Anthocyanin Extract from Vietnamese Carissa Carandas L. Fruits

1
Department of Chemical Engineering, HCMC University of Technology, VNU-HCM, Ho Chi Minh City 700000, Vietnam
2
Tan Ke High School, Ben Tre Province 930000, Vietnam
3
NTT Hi-Tech Institute, Nguyen Tat Thanh University, Ho Chi Minh City 755414, Vietnam
4
Center of Excellence for Biochemistry and Natural Products, Nguyen Tat Thanh University, Ho Chi Minh City 755414, Vietnam
5
Institute of Natural Products Chemistry, Vietnam Academy of Science and Technology, Ha Noi 100803, Vietnam
6
Graduate University of Science and Technology, Vietnam Academy of Science and Technology, Ha Noi 100803, Vietnam
7
Nghe An Oncology Hospital, Vinh City 43100, Vietnam
*
Authors to whom correspondence should be addressed.
Processes 2019, 7(7), 468; https://doi.org/10.3390/pr7070468
Submission received: 19 June 2019 / Revised: 15 July 2019 / Accepted: 15 July 2019 / Published: 20 July 2019
(This article belongs to the Special Issue Green Separation and Extraction Processes)

Abstract

:
In this study, the extraction of anthocyanin colorant from karanda fruit (Carissa carandas L.) was carried out and optimized with multiple single factor assays. Selected conditions for yield maximization consisted of ripen fruits with black-purple color, material size of thin slices (1.0–1.5 mm), solvent of EtOH 50%, material/ solvent ratio of 1:3, temperature of 50 °C, extraction time of 45 min, and two extraction cycles. The anthocyanin content in the extract was 277.2 mg/L, which is equivalent to 9.33 mg anthocyanin per gram of dry material. Aqueous solutions of the extract and dried extracts from Carissa carandas fruit were evaluated for stability at two temperature conditions, namely room temperature (30 ± 2 °C) and 45 °C. The temperature exerted great impact on color change, anthocyanin content and the degree of polymerization of anthocyanin. Aqueous solutions of extract with citric acid (3.0–5.0 g/L) were generally more color stable and less anthocyanin degradable than those without citric acid. In the DPPH (1,1-diphenyl-2-picrylhydrazyl) scavenging assay, The half maximal inhibitory concentration (IC50) of the dried extract was 87.56 μg/mL, which was approximately 29 times higher than that of vitamin C. After 3-month storage at −18 °C, IC50 of the dried extract was 173.67 μg/mL.

1. Introduction

Color is specified as one of the most vital properties that determines the acceptability of beverages and foods. Since the colorant in food is mostly due to the appearance of pigments, synthetic colorants are usually added to give the acceptable color in the final product. Synthetic pigments are generally highly durable over time and under exposure of high temperature and light intensity [1]. In addition, it was found that synthetic pigments could be toxic, adversely affecting human health. In contrast, natural pigments are highly safe for human health and was demonstrated to exert valuable biological activities such as antioxidant and anti-inflammatory properties. However, these pigments are less stable and could easily decompose under moderate temperature and light intensity.
Among many types of natural pigment of plant origin, anthocyanin represents the largest group of water-soluble pigments. Anthocyanin is a family of flavonoids and is an active ingredient in most fruits and flowers. Recently, more than 635 different anthocyanins have been isolated and 23 anthocyanidins have been described [2]. Anthocyanins, similar to other natural pigments, are unstable and could decompose during the extraction, purification, production, and storage. The factors that affect the potent of anthocyanin could include the chemical structure of color, pH, and temperature [2,3]. However, the endurance of anthocyanin depends on many other factors such as ascorbic acid, metals, sugar, oxygen, light, and enzymes in the manufacturing process and polymerization [1,2].
The Carissa carandas L., commonly referred to as karanda or in Vietnamese as ‘si-rô’, is a flowering species that originates from Bangladesh and India and grows in dry forests and on the Himalayas, where the elevation is 300–1800 m above sea level [4]. It is a plant that belongs to the Apocynaceae family and has extended lifespan [4]. The Carissa carandas fruit is rich in iron, vitamin C, and possesses high antioxidant activity [5,6]. While unripe fruits are white, the ripen fruits are dark purple in color. In Vietnam, the Carissa carandas fruit, often grown in Ben Tre province, is suggested to be a suitable alternative for lemon due to the sour flavor. However, relatively little is explored about its nutritional and application value. Reportedly, the Carissa carandas fruit contained approximately 13% crude protein, 7.8% polyphenol, 5.3% oil, 58% hydrocarbon, and 31.4% free acid. Besides, the Carissa carandas oil was found to contain coumarin [4,5,6].
One of the main pigment found in the Carissa carandas fruit was cyanidin-3-rhamnoglucoside, which is the most common form of anthocyanin and figures for its antioxidant properties and role as an excellent natural colorant in food and medicine [4,7]. In a previous study involving Carissa carandas fruits harvested from Thailand, the fruits were further revealed to contain three anthocyanin pigments at high content, which are cyanidin-3-glucoside (19.85 mg/kg lyophilized fruit juice), peonidin-3-glucoside, and malvidin-3-glucoside [8]. This evidence suggests the use of Carissa carandas as a promising ingredient for manufacture of functional beverage and its potential for pigment production.
Given the abundance of anthocyanin pigments existing in Carissa carandas fruits and the emerging need for natural food pigments, the present investigation focuses on examining the extraction process of anthocyanins from Carissa carandas fruits grown in Vietnam. Specifically, the extraction of anthocyanin from the fruit was evaluated with respect to multiple parameters including solvent type, solid loading, incubation temperature, extraction durations, fruit ripeness, number of extraction cycles, and material size. Obtained extracts were also evaluated for color stability, total anthocyanin content, polymeric anthocyanin content, and antioxidant activity in extended storage periods. The results of the study is expected to aid the development of a larger-scale extraction procedure for a natural pigment from Carissa carandas fruits, thus opening new use and improving the value of Vietnamese locally available materials.

2. Materials and Methods

2.1. Materials and the Extraction Method

Carissa carandas L. fruits were harvested in Ba Tri district, Ben Tre province, Vietnam in July 2017. The taxonomic identification of the species was made by Institute of Tropical Biology, Vietnam. The materials were categorized based on ripeness level and washed under running tap water. Fruits were then blenderized, homogenized, weighed, and put into polyethylene vacuum bags at −18 °C until extraction was performed. Ethanol (C2H5OH) was purchased from Sigma Aldrich (city, state abbreviation, US).
The solid–liquid extraction process was employed with ethanol in this study. To be specific, blenderized fresh fruits (30 g) were extracted under different extraction parameters including ethanol concentration (0–100% v/v), extraction temperature (30–80 °C), extraction time (15–90 min), material–solvent ratio (1:2–1:5 g/mL) and the number of extraction cycle (1, 2 and 3 times). In experiments with multiple extraction cycles, the materials after being extracted were reused for extraction under conditions identical to the previous cycle. The filtrate was concentrated under vacuum at 50 °C to afford Carissa carandas crude extracts. The crude extracts were stored at −18 °C until used.

2.2. Determination of the Moisture Content of Fresh Fruits or Crude Extracts

Moisture is determined by the Ohaus Moisture Analyzer (MB45, Parsippany, NJ, USA) moisture meter in which water in the fresh fruits or crude extract was evaporated until the mass is constant [9]. Experiments were performed three times to obtain the average measurement.

2.3. Determination of Total Anthocyanin Content

The anthocyanin content was first qualitatively identified using ammonia HCl test following a previous procedure [10]. To be specific, 2 mL of the extract was added with 2 mL of 2N HCl and ammonia. The color change from pink-red to blue-violet indicates the presence of anthocyanin. The total anthocyanin content was determined by the pH differential method which bases on the structural changes in chemical forms of anthocyanin and absorbance measurements at pH 1.0 and 4.5. Crude extracts were diluted separately with 0.025 M hydrochloric acid–potassium chloride buffer (pH = 1) and 0.4M sodium acetate buffer (pH = 4.5). Each sample was diluted with the buffers to give an absorbance reading between 0.2 and 1.4. The absorbance of the mixture was measured at 𝜆vis-max and 700 nm using a UV-Vis spectrophotometer (UV1601; Shimadzu, Kyoto, Japan). The total anthocyanin content was expressed as cyanidin-3-glucoside equivalents as in the following equation [11,12,13,14].
Anthocyanin   pigment   ( mg / L )   =   A   ×   MW   ×   DF   ×   V   ×   1000 a   × l   × m  
where A is the absorbance, MW is the molecular weight of cyanidin-3-glucosode (449.2 g/mol), DF is the dilution factor, V is the solvent volume (mL), a is the molar absorptivity (26,900 L.mol−1.cm−1), and l is the cell path length (1 cm).

2.4. Evaluation of Colorants

To evaluate the difference between the two colors or to evaluate the change in color over time in the CIE-LCh color space, the value ΔE, the geometrical distance between the two colors, is given.
Δ E   =   ( Δ L ) 2 + ( Δ C ) 2 +   ( Δ h ) 2
The absorption at the 420 nm wavelength of the bisulfite sample represents the browning index of the product. Color intensity is the total absorption at the wavelength λvis-max and at 420 nm. The ratio between polymer colorants and color intensity represents the percentage of colorants that are polymerized. Diluted extract (2.8 mL) was dissolved into two cuvettes. The first cuvette was added with 0.2 mL of bisulfite solution and the second was added with 0.2 mL of distilled water. Both cuvettes were allowed to stand for 15 min. The absorbance was measured at λvis-max, 420 nm, and 700 nm. [11,12,15].
Percentage of polymer color (P(%)) is calculated according to the following formula.
CD is color density (mixed with distilled water).
CD = [(A420 nm − A700 nm) + (A𝛌 vis-max − A700 nm) × DF]
PC is polymeric color (sample with bisulfite solution).
PC = [(A420 nm − A700 nm) + (A𝛌 vis-max − A700 nm) × DF]
P ( % )   =   P C C D × 100

2.5. Determination of the Antioxidant Capacity

The DPPH (2,2-diphenyl-1-picrylhydrazyl) free radical scavenging assay was employed according to the method by Braca et al. [16]. Since antioxidant compounds are capable of scavenging free radicals, the antioxidant activity could be measured by reduction of the color of the DPPH solution. The solution of the dried extract (150 µL) was mixed with 2850 µL of DPPH solution, followed by shaking and incubating for 30 min in the dark. After 30 min, the absorbance was measured at 515 nm. IC50 was calculated based on the plot of % inhibition with respect to concentration. [17,18]. Ascorbic acid (Vitamin C) was used as the positive control.

3. Results and Discussion

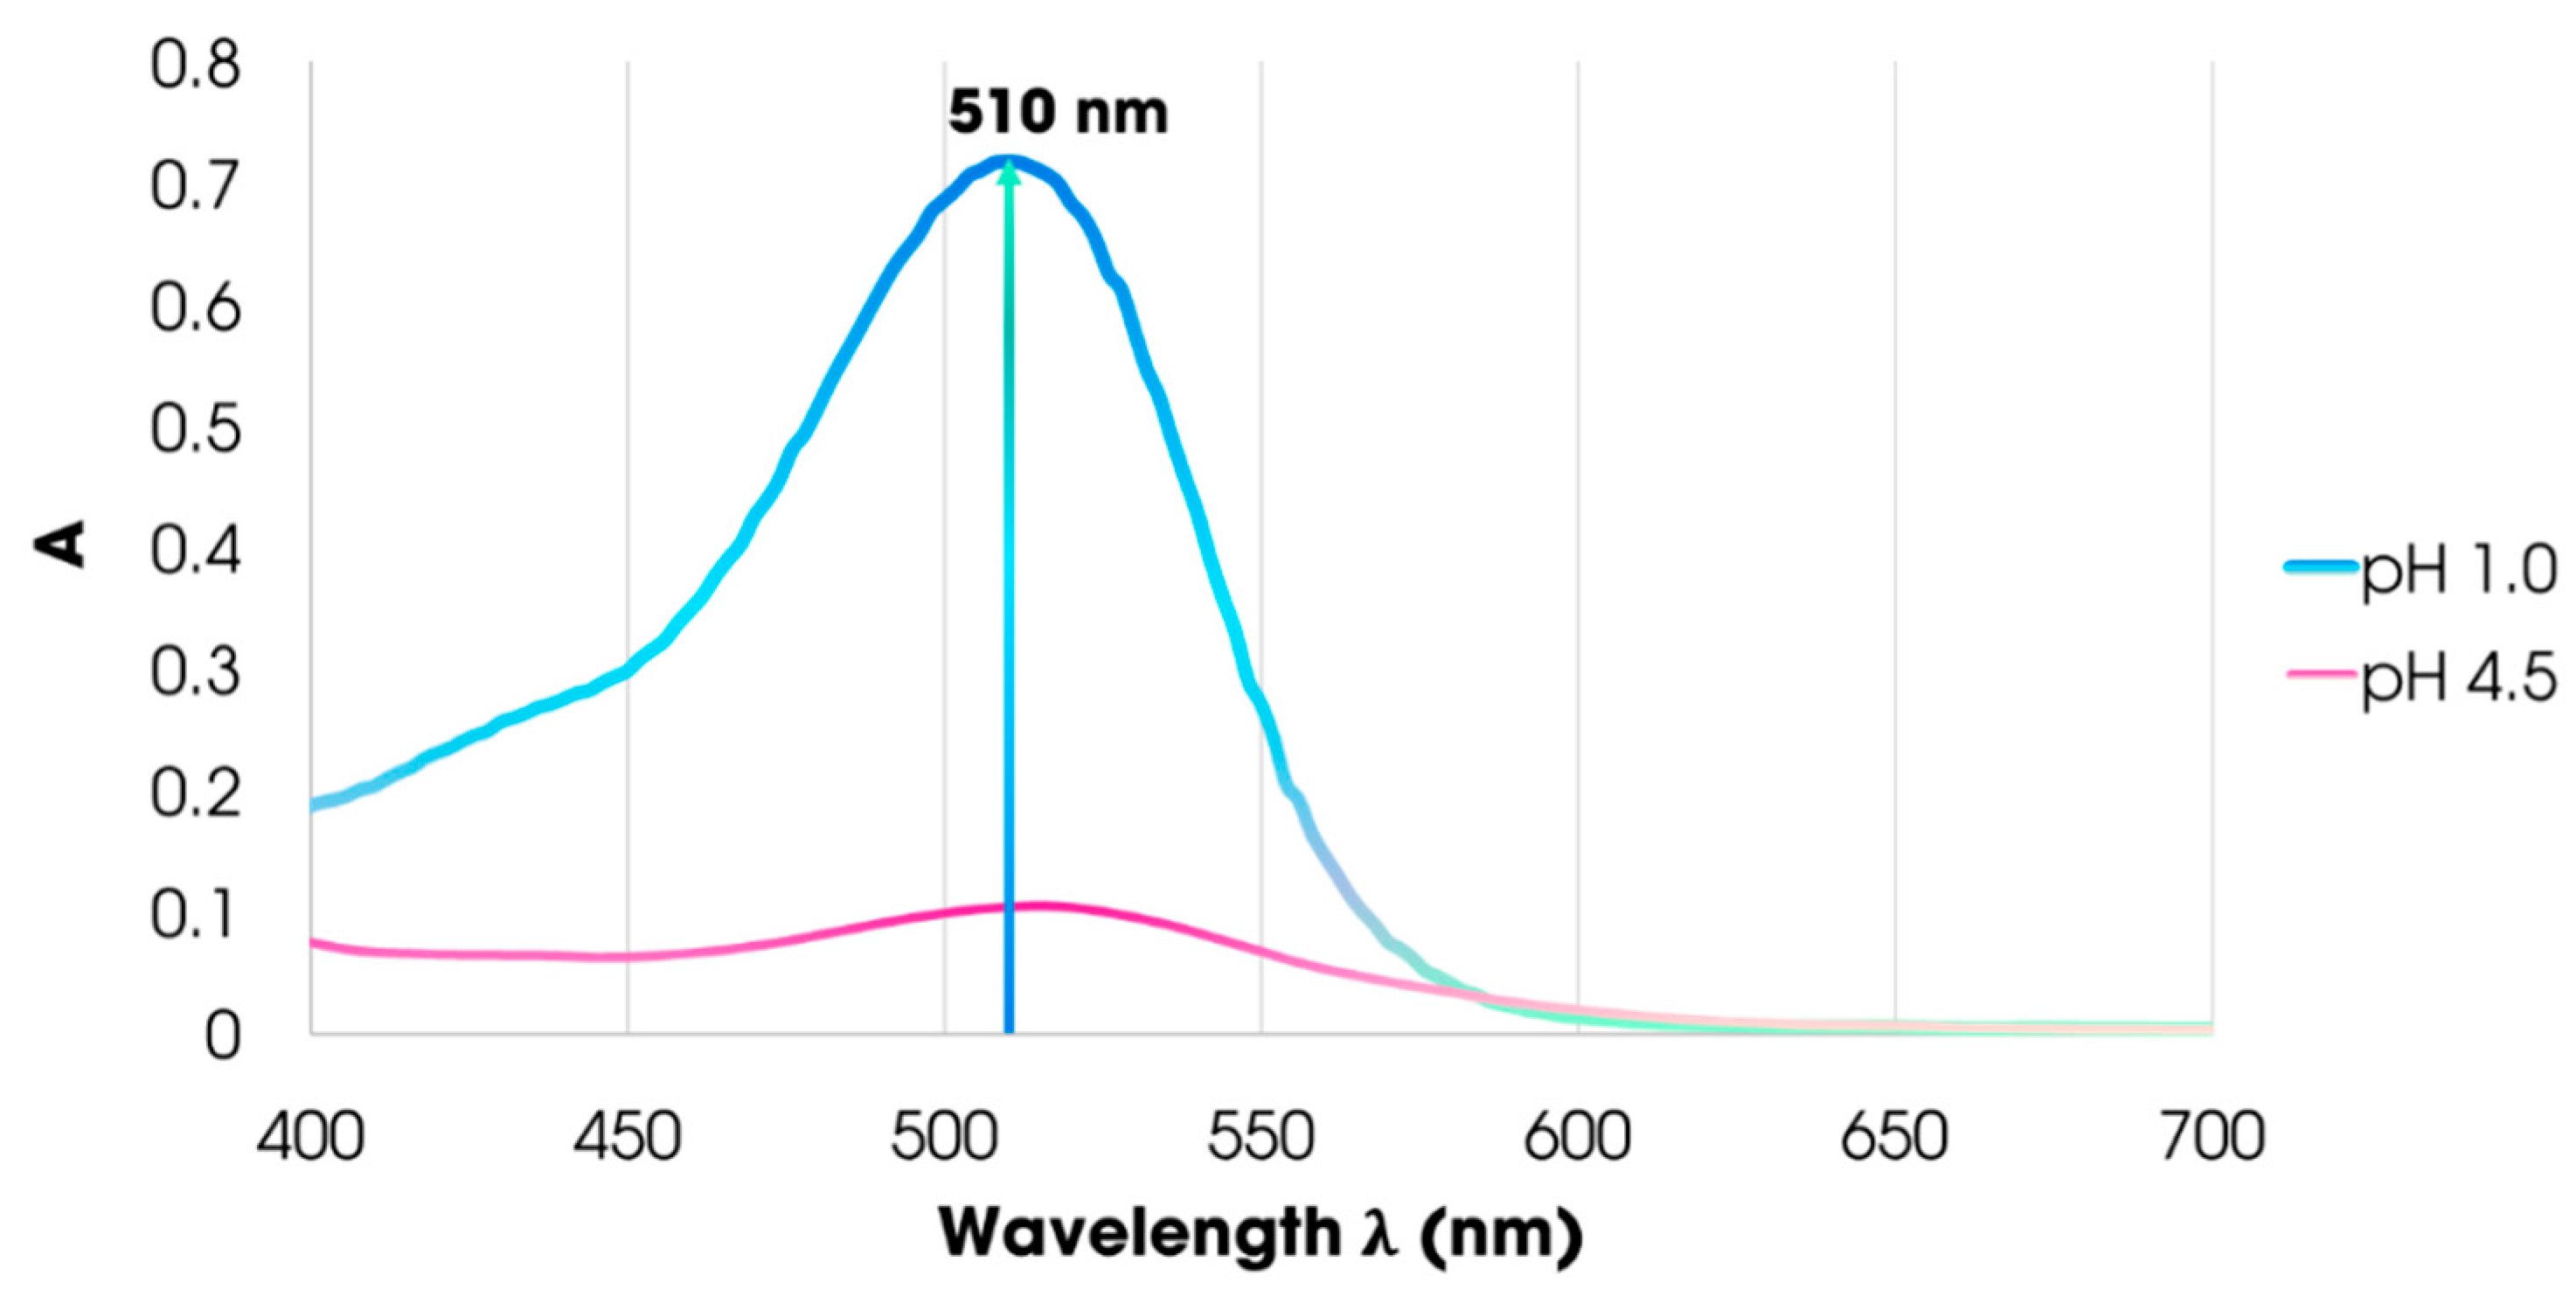
3.1. Maximum Absorption Wavelength of the Carissa Carandas Extract

In order to determine the maximum absorbance spectrum, the extract was dissolved in distilled water and scanned through the spectrometer with the wavelength ranging from 400 to 700 nm. Figure 1 shows that the absorption peak ranged from 500 to 530 nm, which is consistent with the absorption spectrum of the anthocyanin color group [19]. As can be seen from Figure 1, Maximum absorption point was reached at wavelength λvis-max = 510 nm. Therefore, subsequent surveys and calculations will be evaluated at this wavelength of maximum absorption. This result is in line with the color anthocyanin of Carissa carandas in another study [2].

3.2. Moisture of Carissa Carandas Fruit

The average moisture content of the fruit accounted for 82.51% of the fresh weight. Since the fresh materials retained high moisture content, it is advisable to undertake the extraction immediately following the harvest to avoid damage. In addition, preservation should be conducted in the freezer at −18 °C to reduce the loss of anthocyanin in the fruit.

3.3. The Effect of Extraction Conditions on Total Anthocyanin Content

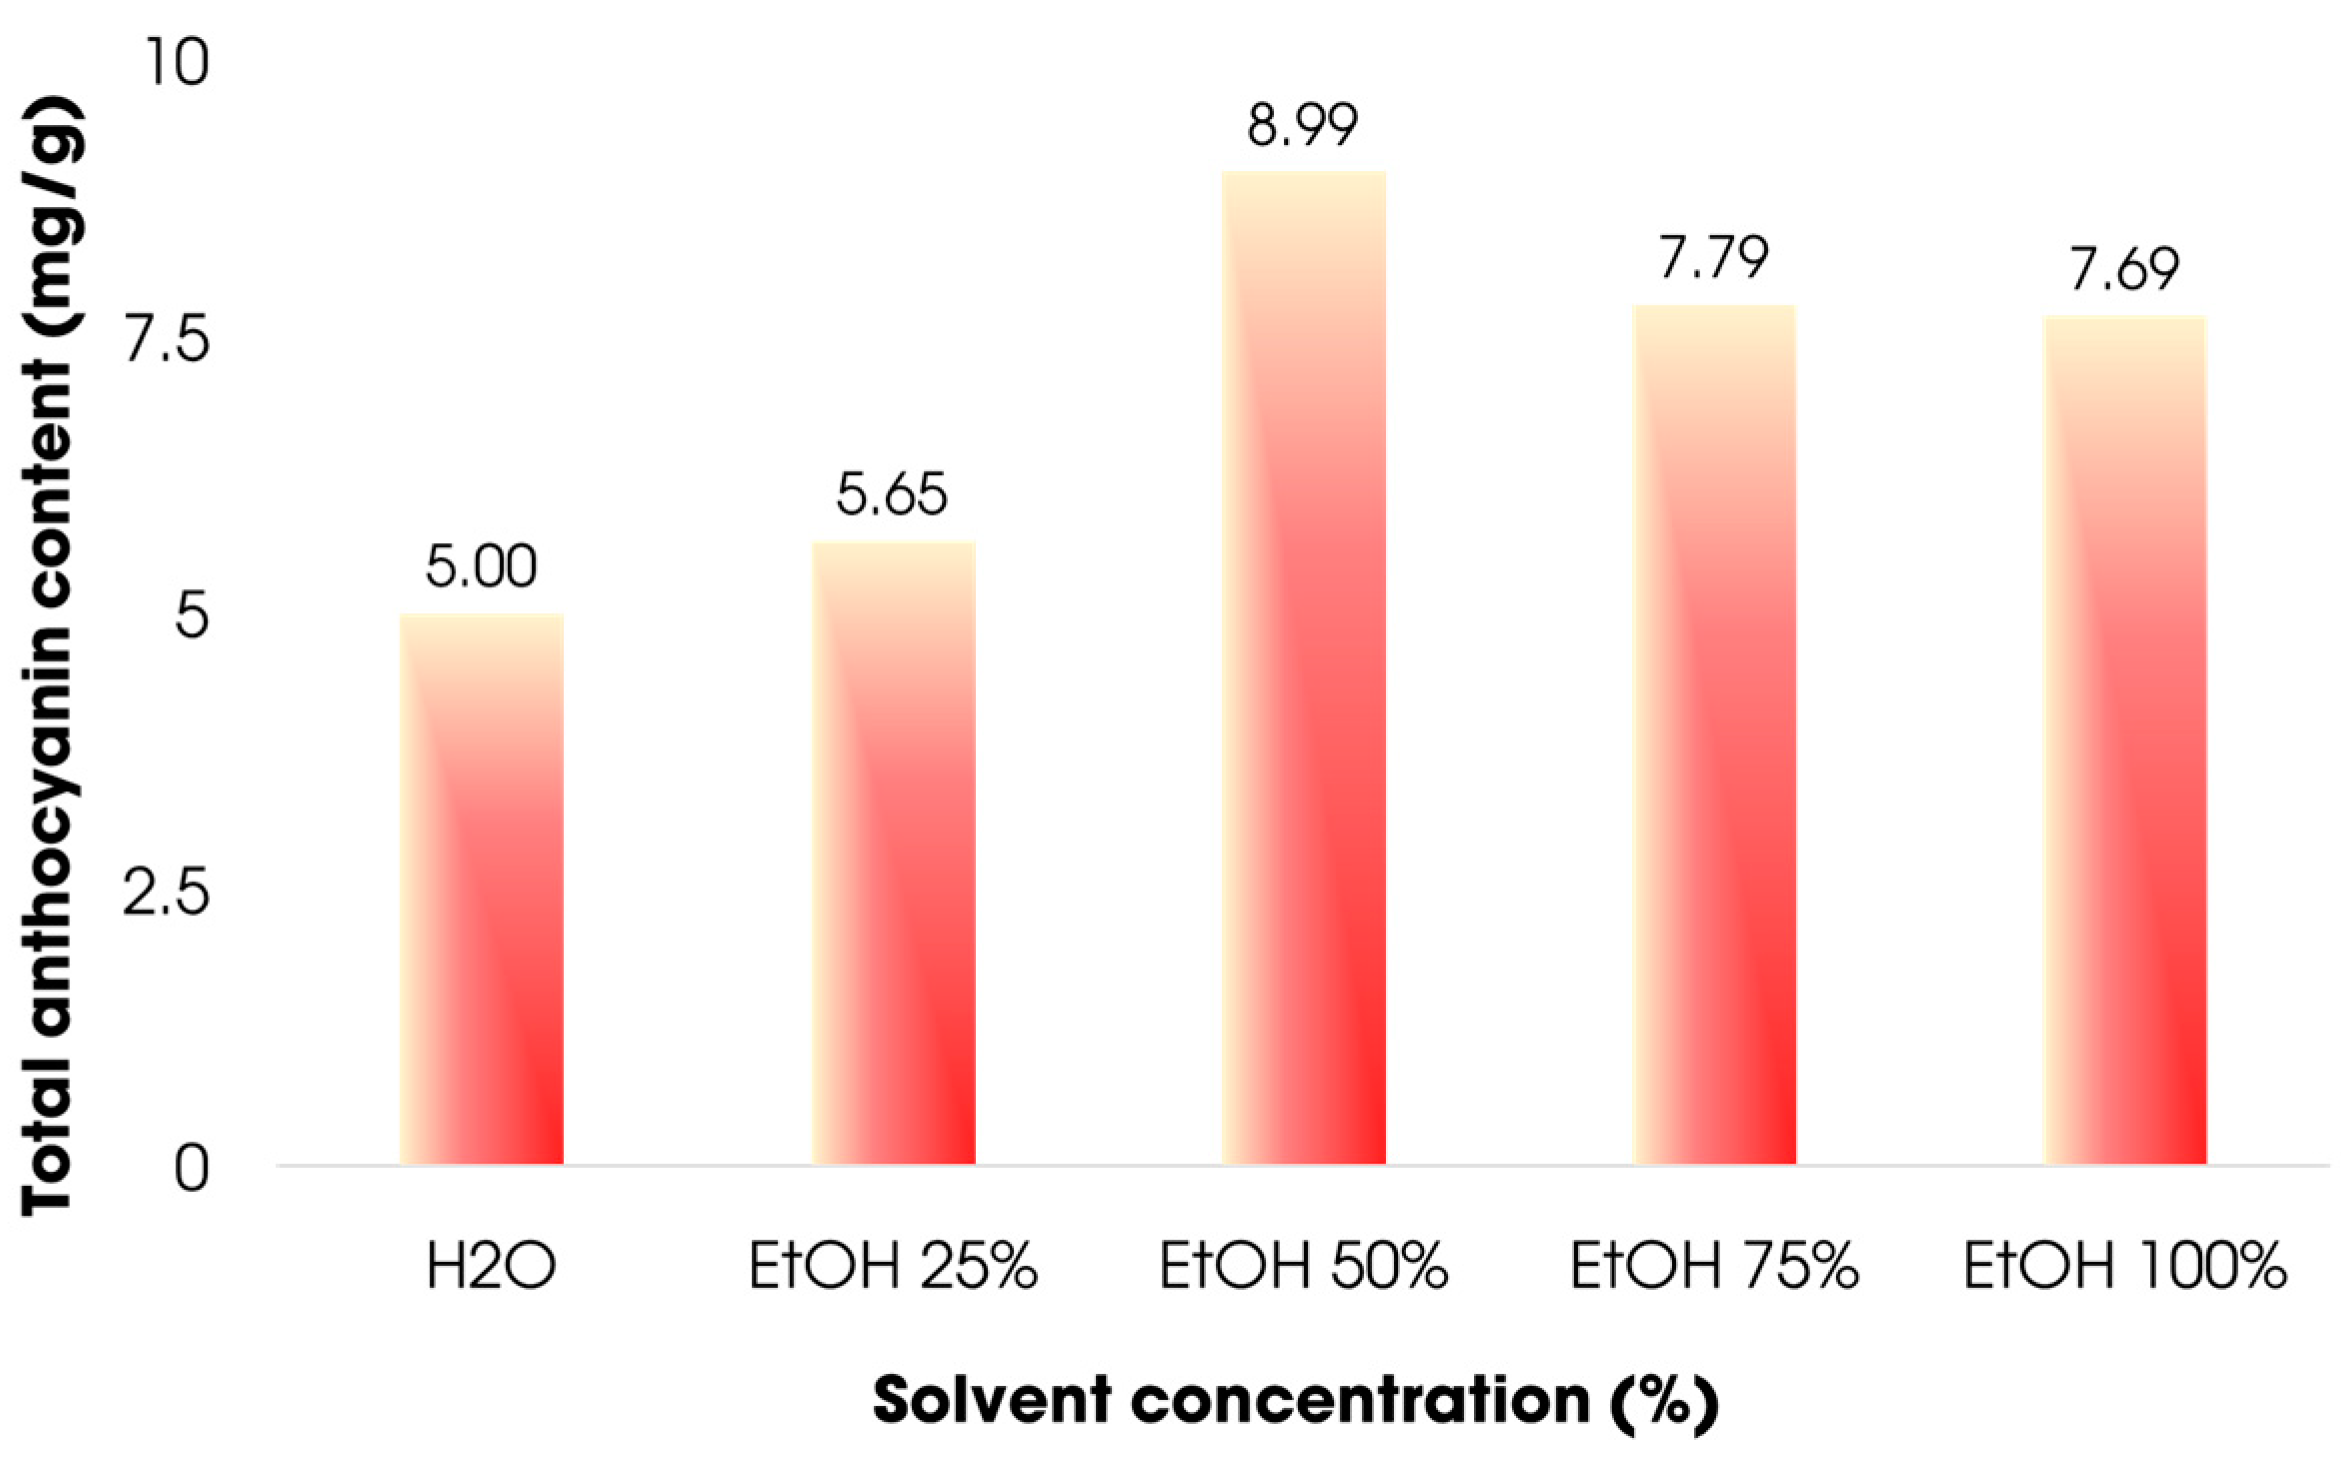
3.3.1. Effect of Solvent Concentration

In order to investigate the effect of solvent condition on the extraction yields of anthocyanin from Carissa carandas fruits, extraction attempts under different concentrations of ethanol in distilled water, ranging from 25% to 100% v/v, were carried out. Figure 2 showed that as the ethanol level increased from 0 to 50%, the anthocyanin content grew considerably from 5.00 to 8.99 mg/g. In contrast, when the alcohol content increased to 75% and 100%, the anthocyanin content decreased steadily due to the high solubility of anthocyanin molecules in moderate alcohol concentration medium. In addition, at higher alcohol concentrations, undesirable impurities such as mucus and resin may form, adversely affecting the quality of the pigment. Therefore, 50% of ethanol was selected as the optimal condition for further investigation.

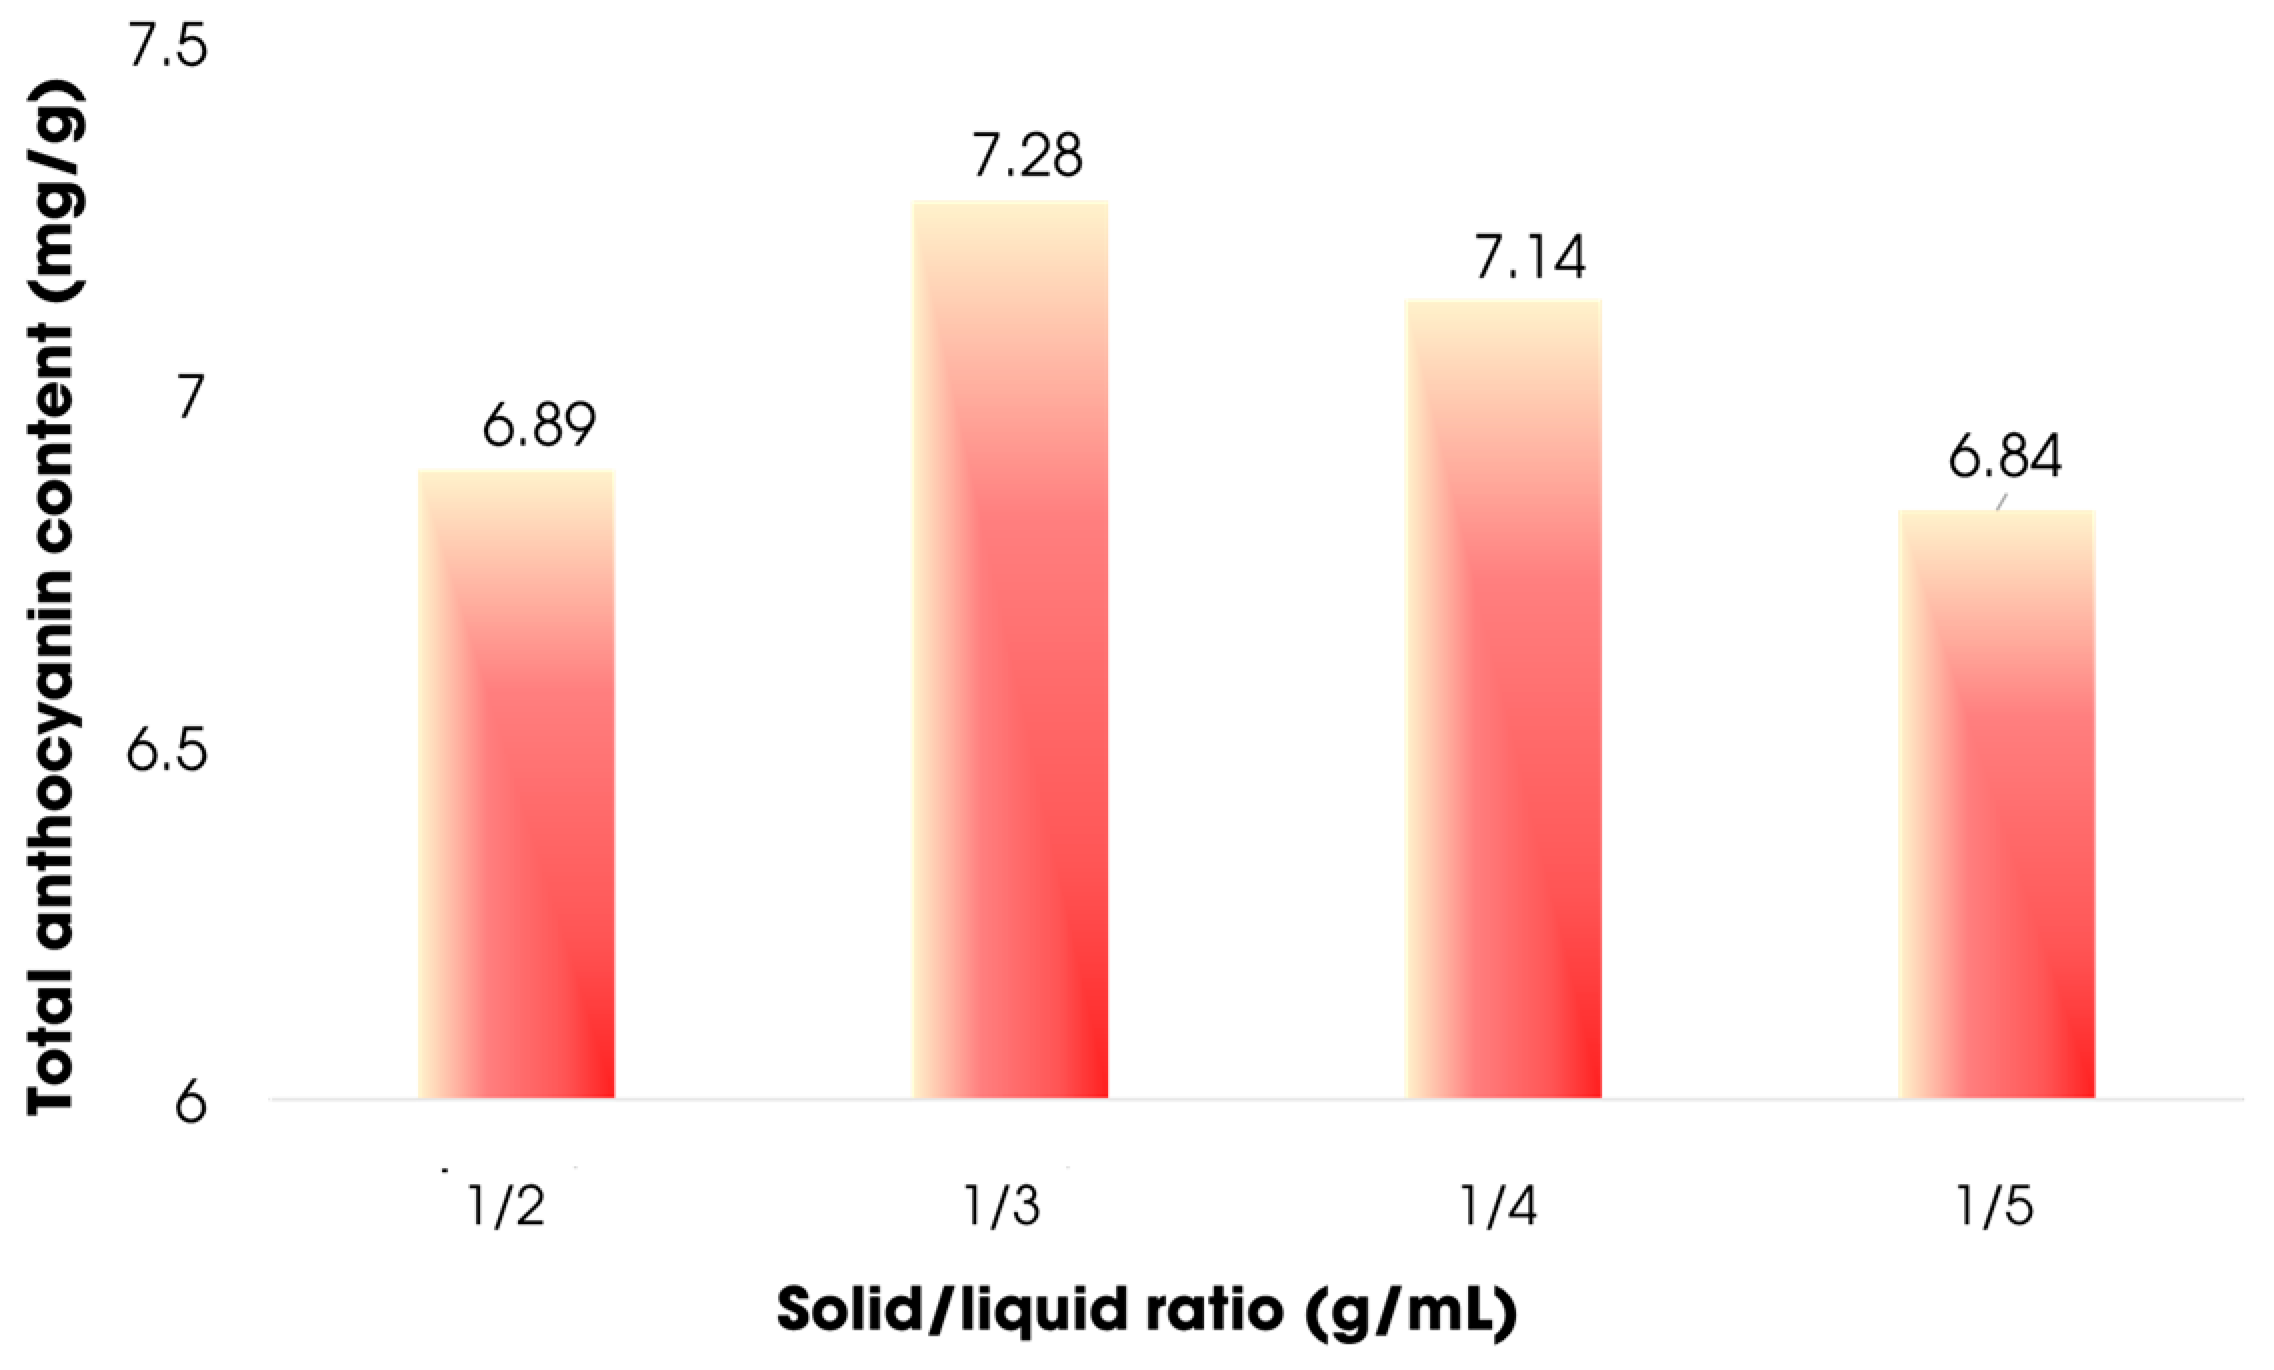
3.3.2. Effect of Solid:Liquid Ratio

The Figure 3 illustrates the effect of solid:liquid ratio to anthocyanin extraction. It was shown that increasing the ratio between material and solvent from 1/2 to 1/3, the total anthocyanin content rose significantly from 6.89 mg/g to 7.28 mg/g. However, as the ratio exceeded 1/3, the anthocyanin yields were found to be declining. It is possibly because the high volume of the solvent requires more time to heat up, which in turn results in longer exposure to light that contributes to the anthocyanin degradation [12]. Therefore, at 1:3 solid/liquid ratio, the anthocyanin content peaked at 7.28 mg/g and was selected for further investigation.

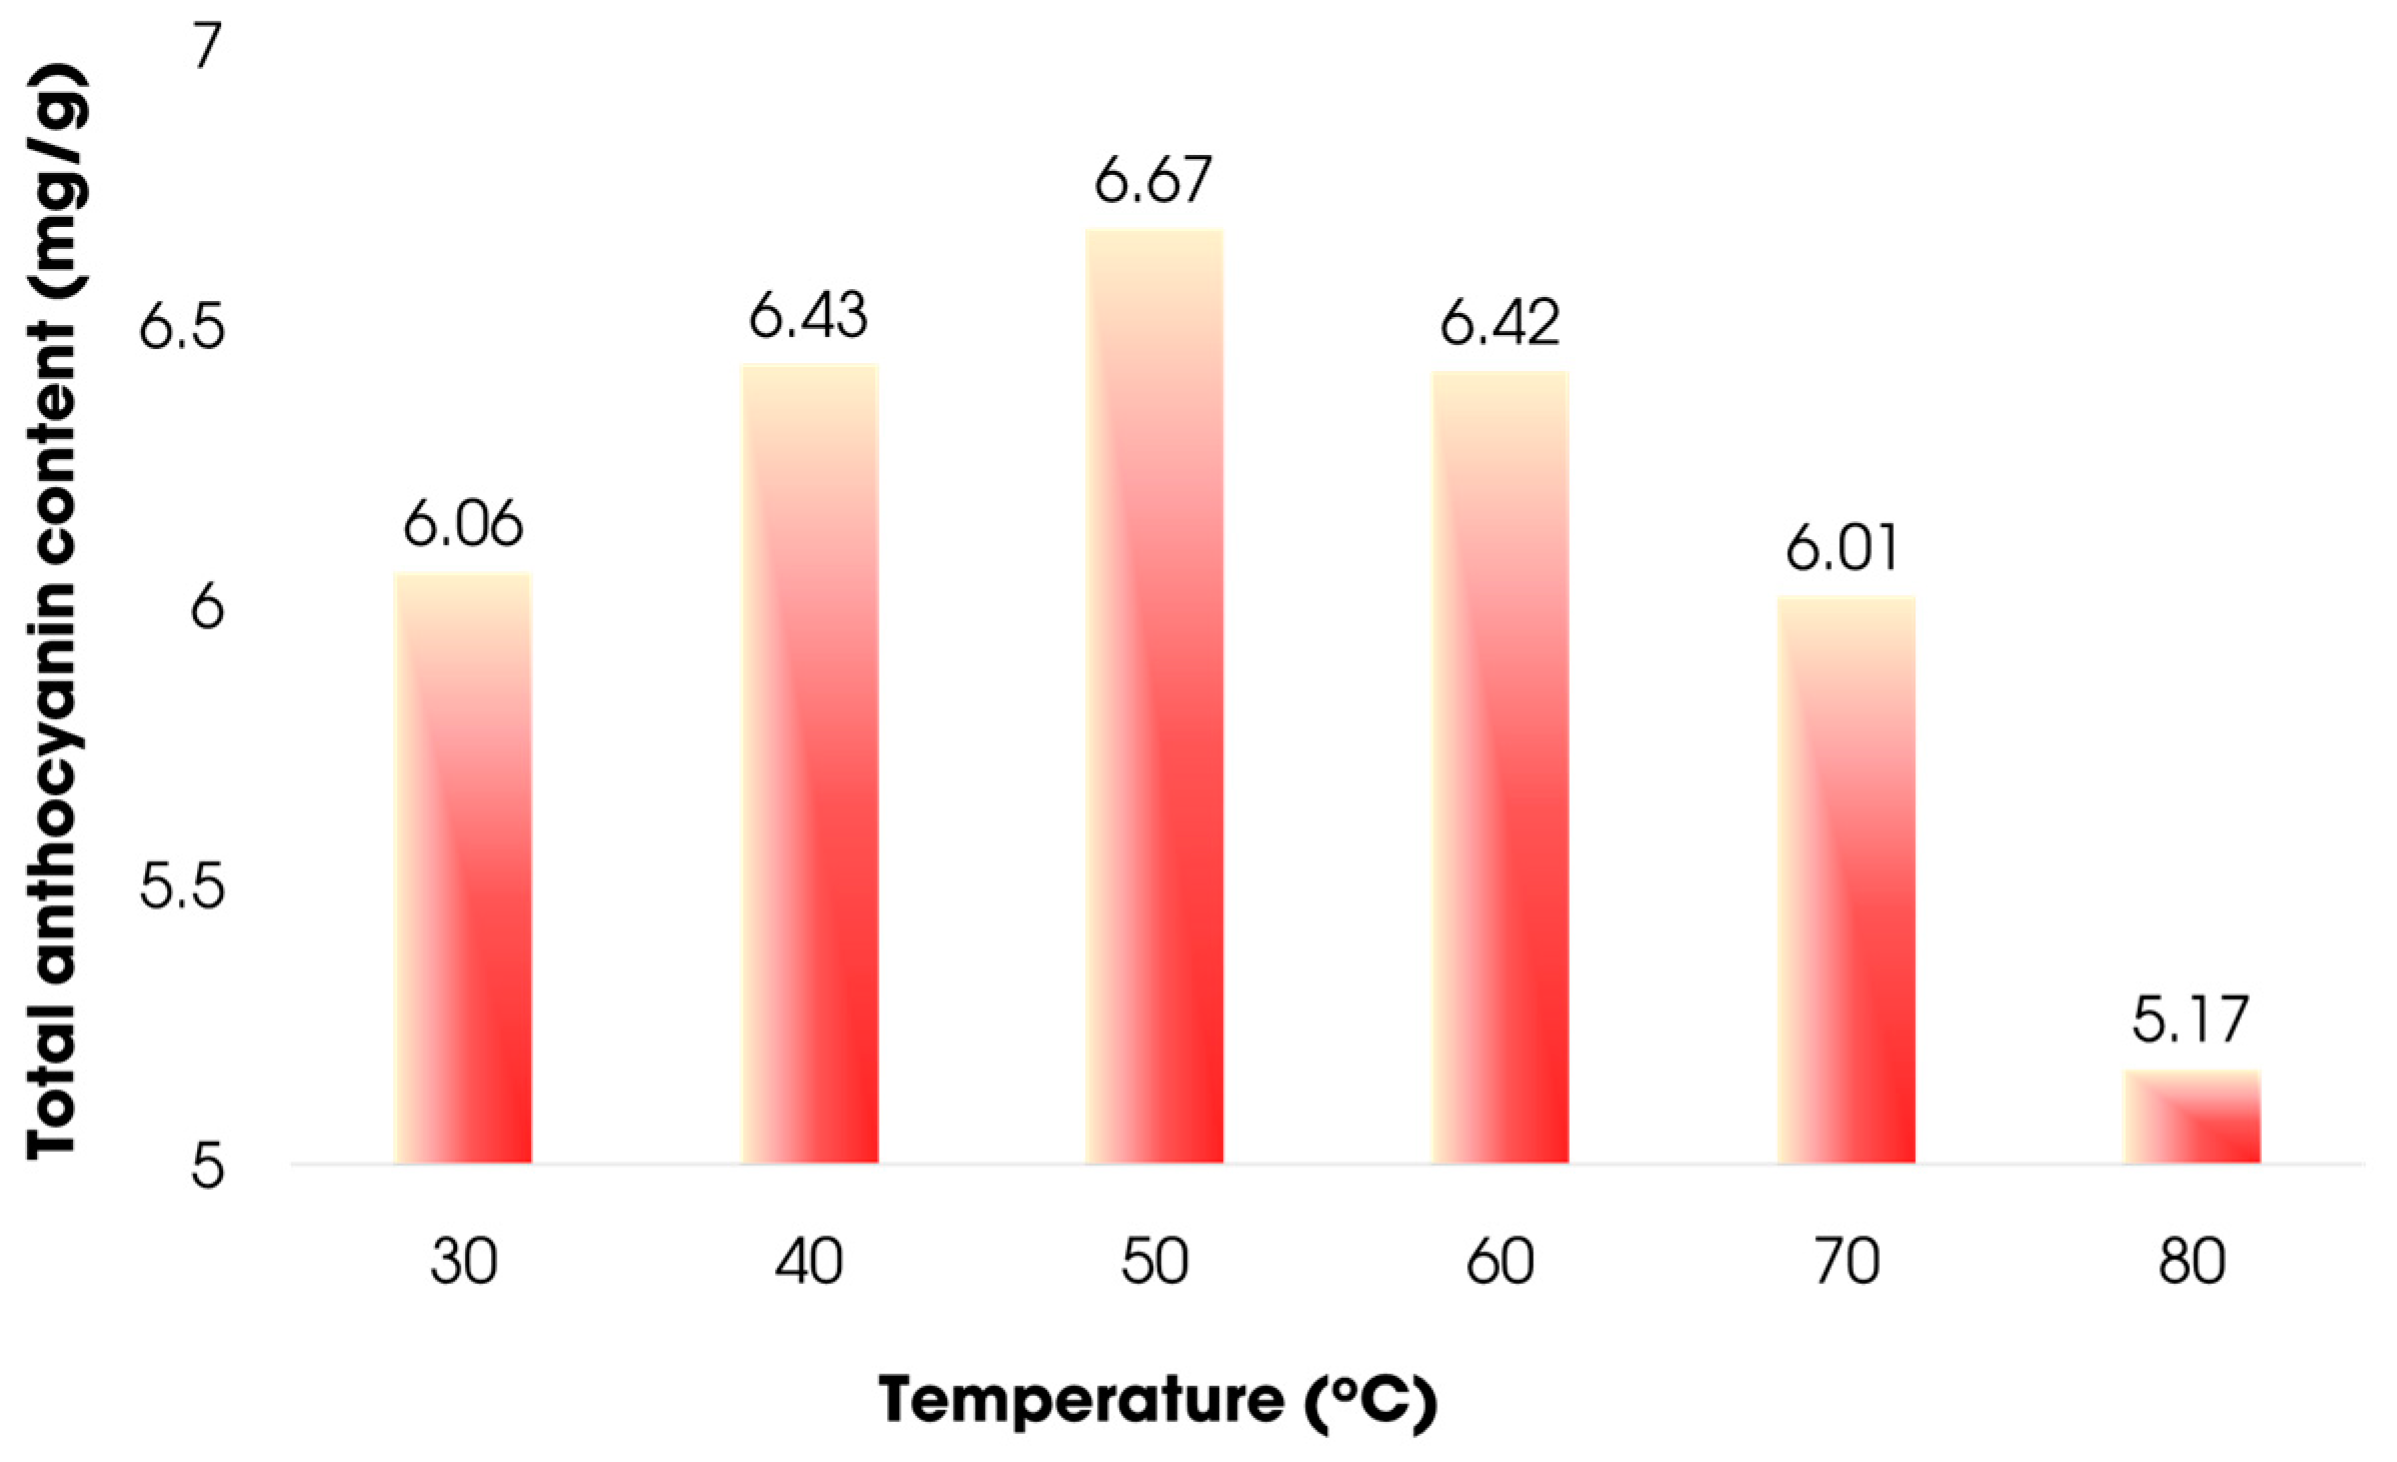
3.3.3. Effect of Temperature of Extraction

The effect of temperature on the anthocyanin yield was examined following the determined concentration and ratio. Figure 4 showed that when the extraction temperature increased gradually from 30 °C to 50 °C, the anthocyanin content reached the peak of 6.67 mg/g at 50 °C. However, as the temperature continues to rise past 50 °C, the concentration of anthocyanin in the extract decreases moderately. Apart from the temperature-induced decomposition of anthocyanin, this phenomenon could be explained by the thermodynamic process, accelerated by thermal treatment, enabling the formation of resin, wax, and mucus in the solution and resulting in decreased extraction efficiency [13].

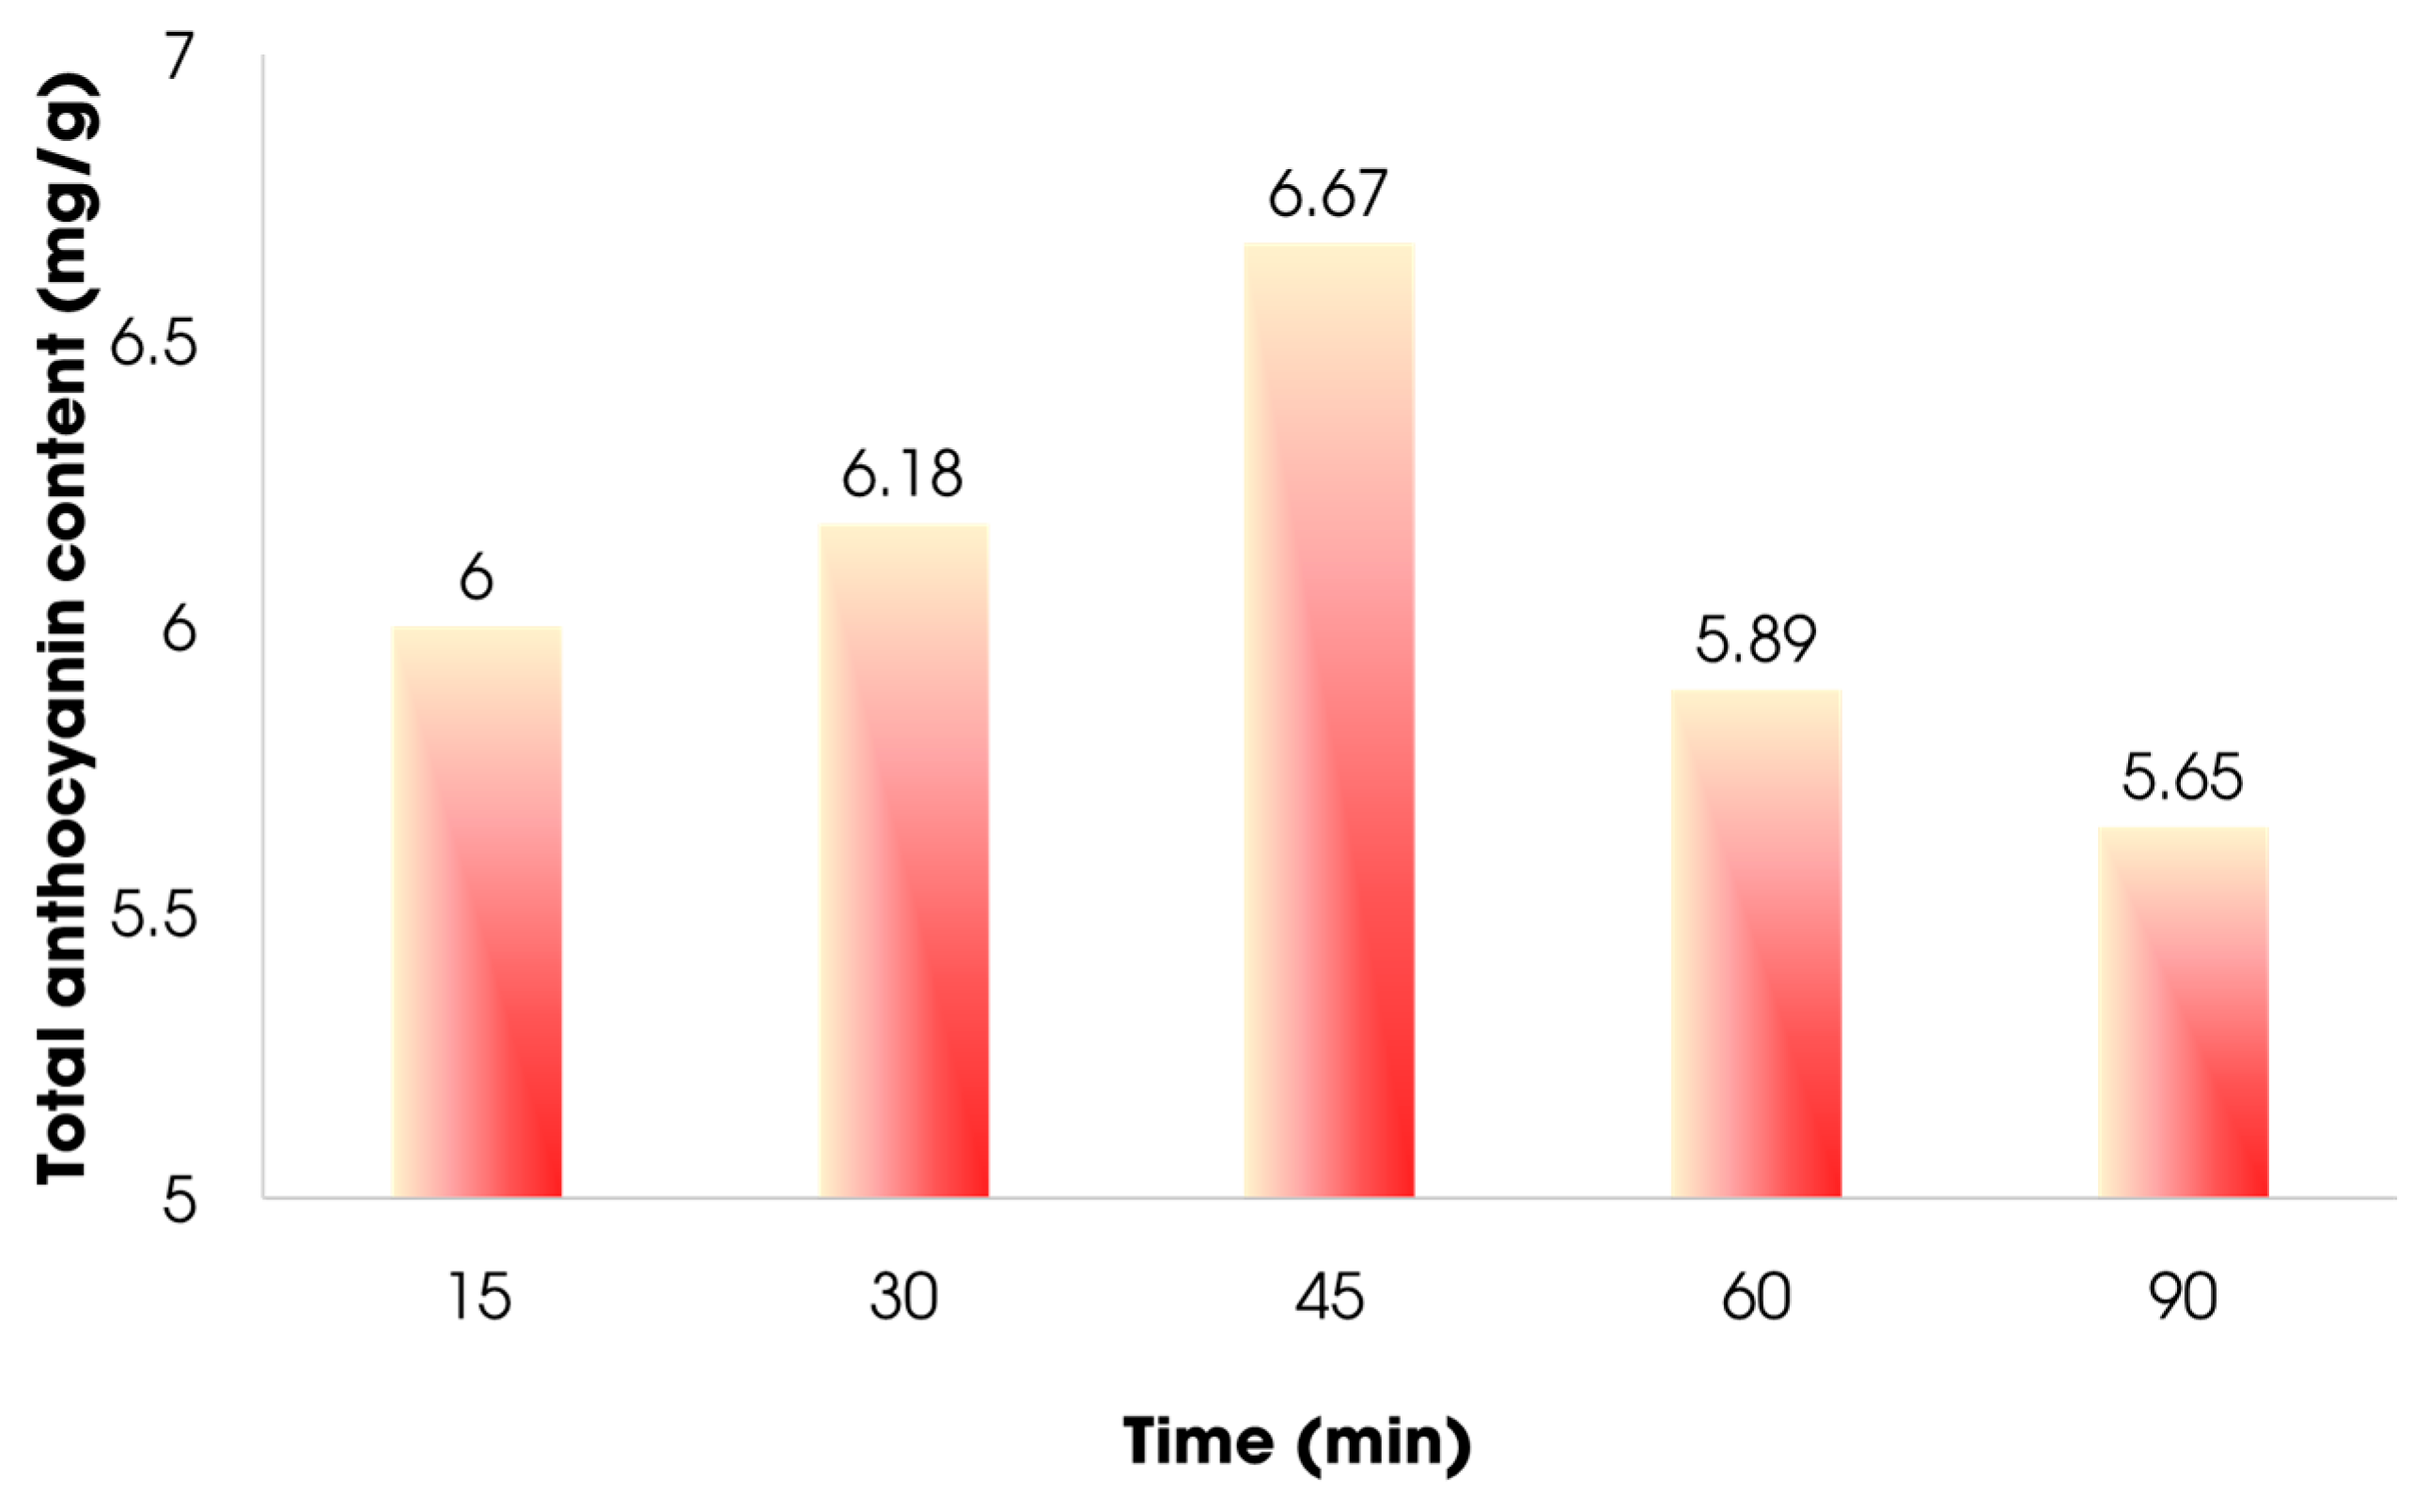
3.3.4. Effect of Time in Extraction Process

The effect of time on the obtained anthocyanin content exhibited a similar trend to the effect of temperature, as shown in Figure 5. To be specific, the anthocyanin content peaked at 6.64 mg/g after 45 min of extraction and a sharp drop was observed with longer time. The decline may be due to anthocyanin decomposition caused by the long exposure to high temperature [13,14]. From these results, concentration of ethanol of 50%, solid/liquid ratio at 1:3 g/mL, temperature of 50 °C and reaction time of 45 min were considered to be optimal conditions for anthocyanins extraction from Vietnamese Carissa carandas L. fruit.

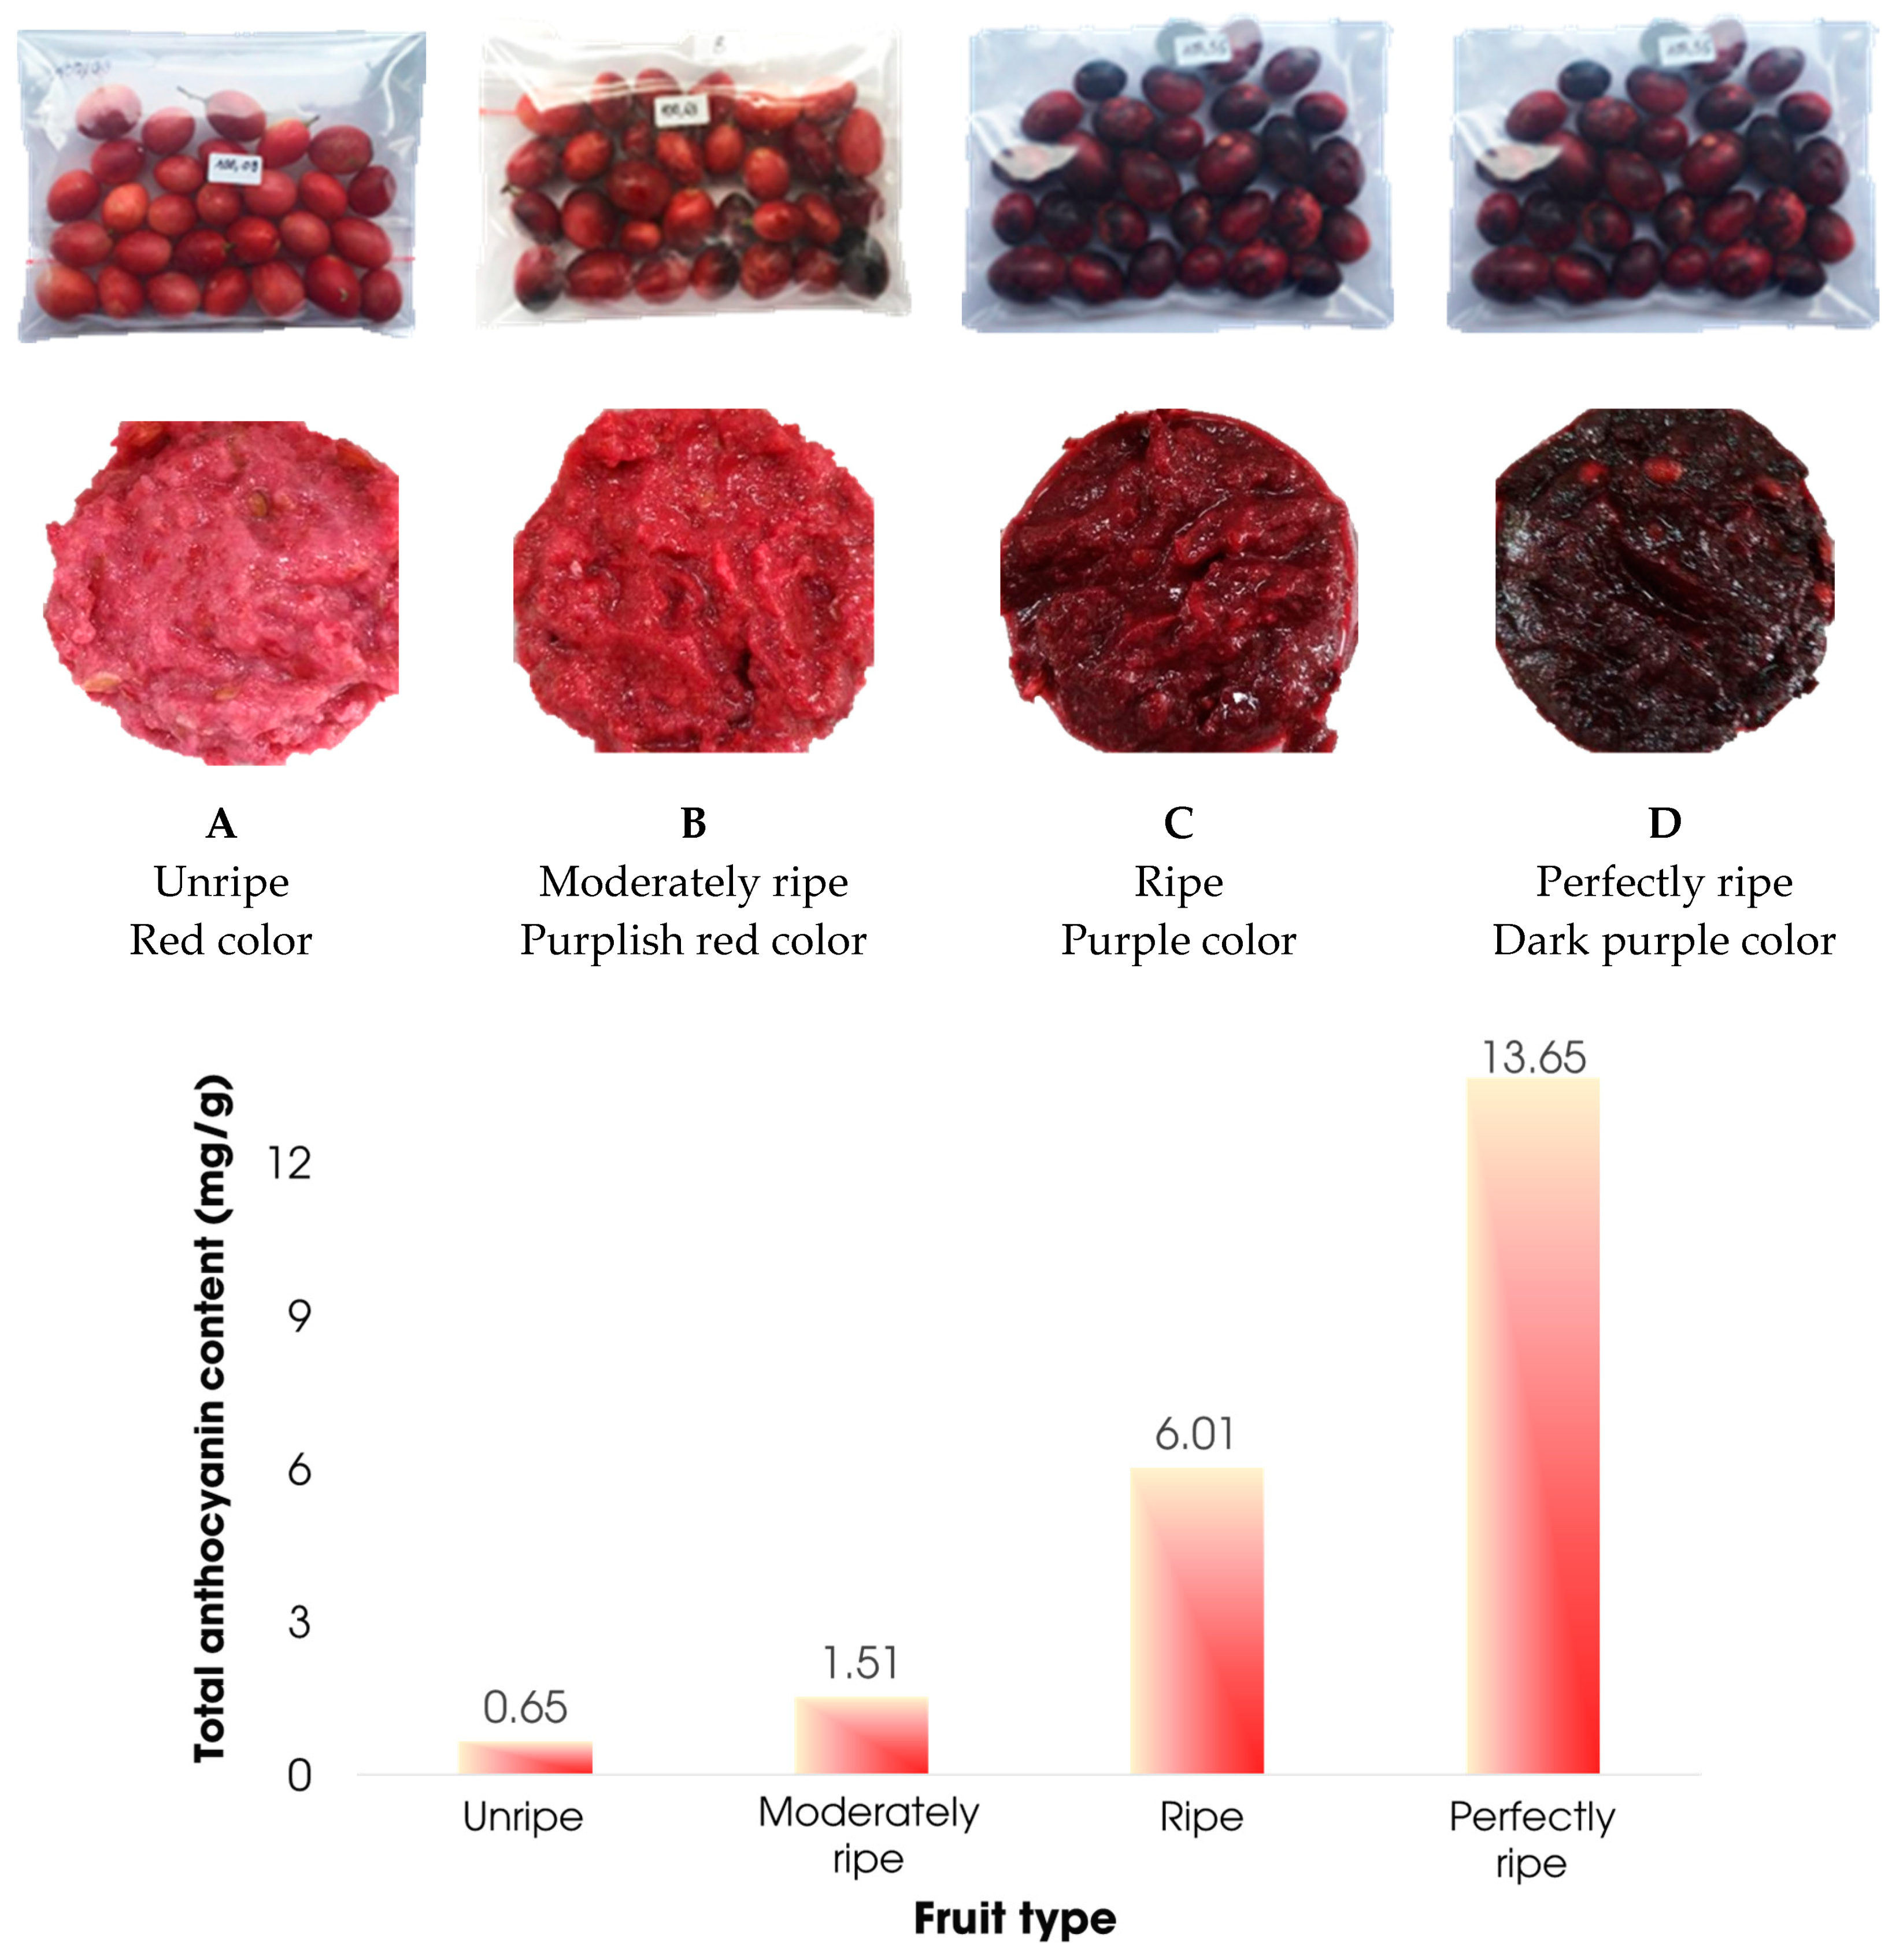
3.3.5. Effect of fruit ripeness

Materials of different maturity levels were extracted with following conditions: ethanol 50% v/v, solid/liquid ratio at 1:3 g/mL, temperature at 50 °C, extraction time of 45 min and through two extraction cycles. Ripeness was determined based on visual color of the harvested fruit. Figure 6 revealed that the anthocyanin content increased corresponding to the maturity level of Carissa carandas fruits. As can be seen from the figure, although with perfectly ripe fruits, the level of anthocyanin reached the highest point of 13.65 mg/g, our acquaintance and experiments with the fruit advised that Carissa carandas fruits at this stage are difficult to harvest and preserve due to its vulnerability to damage. Therefore, the ripened fruits should be used for anthocyanin extraction.

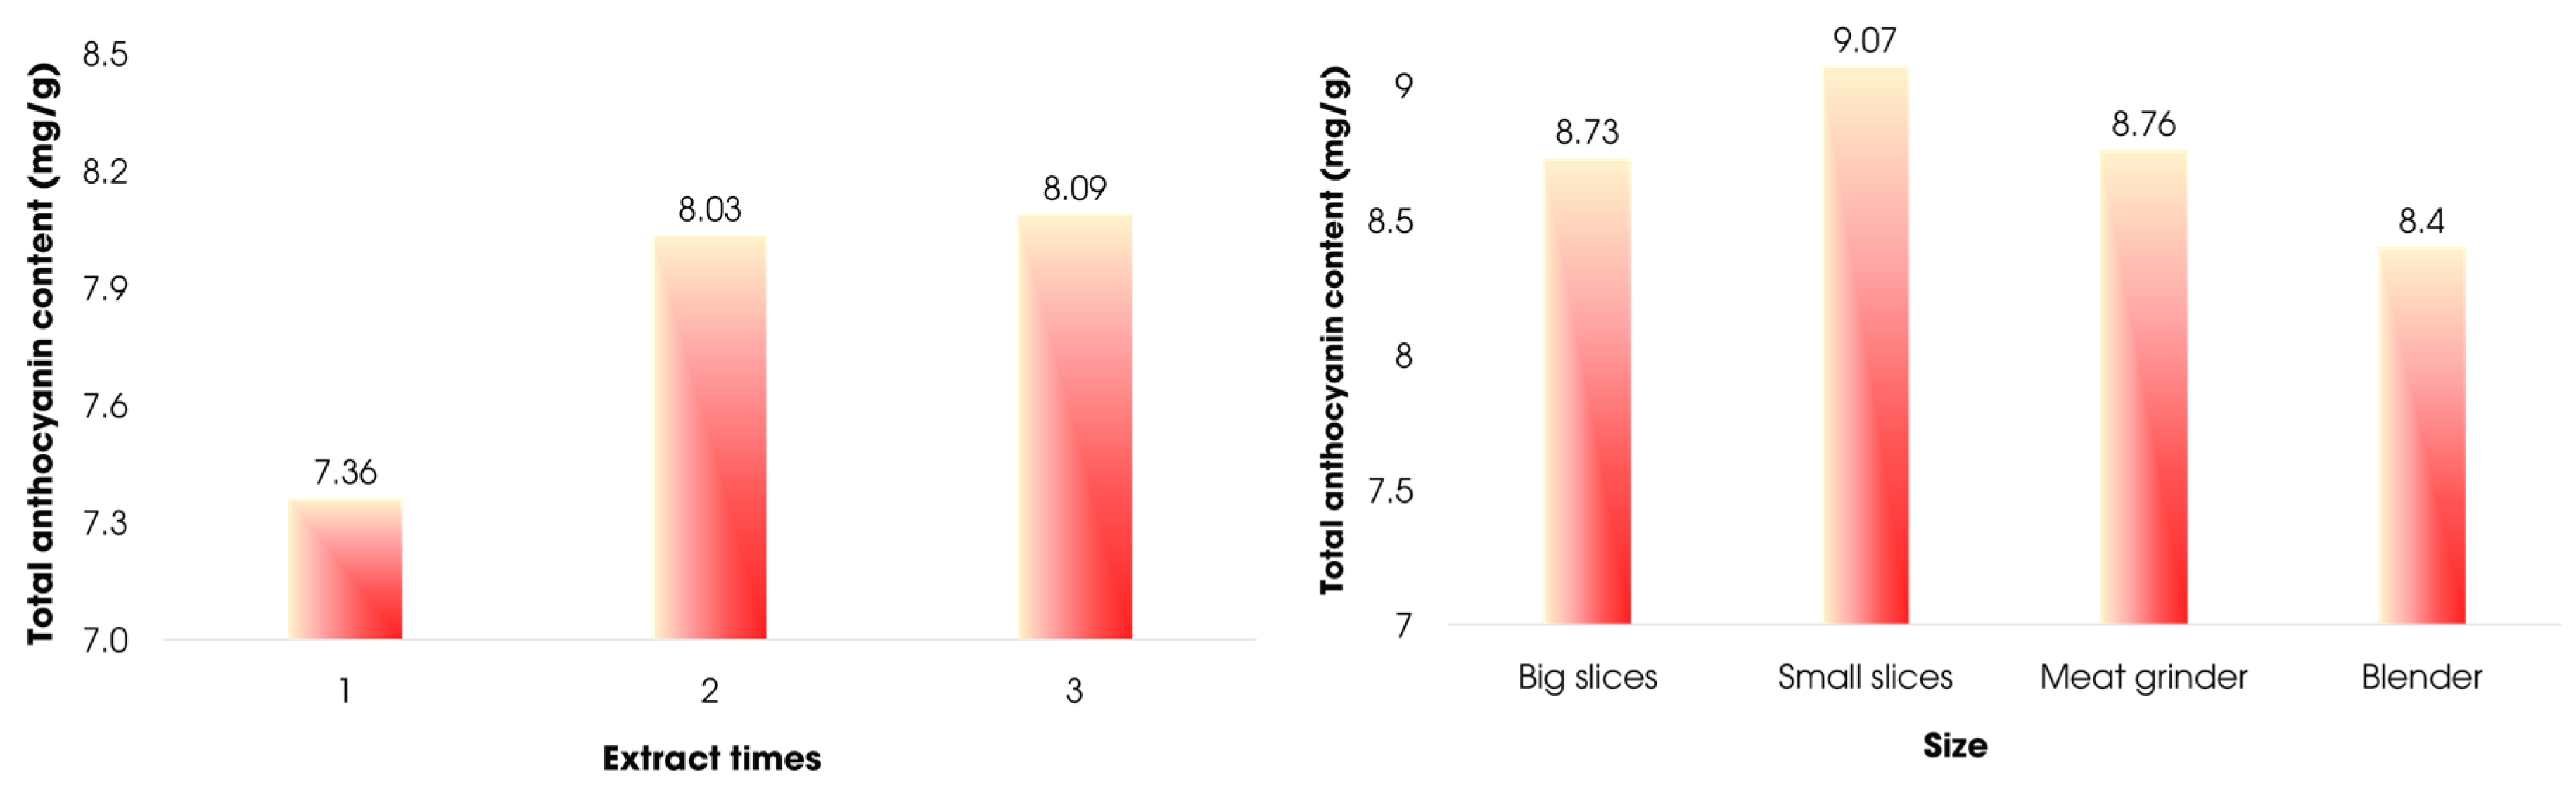
3.3.6. Effect of Extraction Cycle and Material Size

Figure 7 shows changes in anthocyanin content based on extraction cycle and size of raw materials after treatment. After one extraction cycle, it was found that the amount of anthocyanin content has not been completely extracted, demonstrated by lower anthocyanin content (7.36 mg/g) in comparison with results after the second and the third extraction cycle. The materials, after being extracted in two and three cycles, showed almost identical the anthocyanin contents (8.03 and 8.09 mg/g. Therefore, the best extraction cycle is selected as two cycles.
Regarding the effect of material size, Figure 7 showed anthocyanin contents corresponding to different material sizes including sliced pieces of 1–1.5 mm, sliced pieces of 2–2.5 mm, ground, and blended. The anthocyanin content peaked (9.07 mg/g) at material sliced at small size of 2–2.5 mm and reached the lowest content when the material is blended. Clearly, in comparison with material of thicker slices, thinly sliced materials have larger surface area and are in turn susceptible to greater solvent penetration into cells, effectively yielding more pigments. However, as the material is more coarsely ground, the quality of the extract could be impaired as fruit tissues are broken and resultant pigments could be encapsulated and retained by the resin and mucus. In addition, ground materials are difficult to filter due to the presence of mucus, which may cause anthocyanin loss and decomposition.
The optimized conditions yielded the product with total anthocyanin content of 9.33 mg/g (dry fruit weight). This corresponds to anthocyanin content of 277.2 mg/L. Following experiments aim to evaluate the color stability, anthocyanin and polymeric anthocyanin content in the aqueous solution of the Carissa carandas fruit extract and the dried extract.

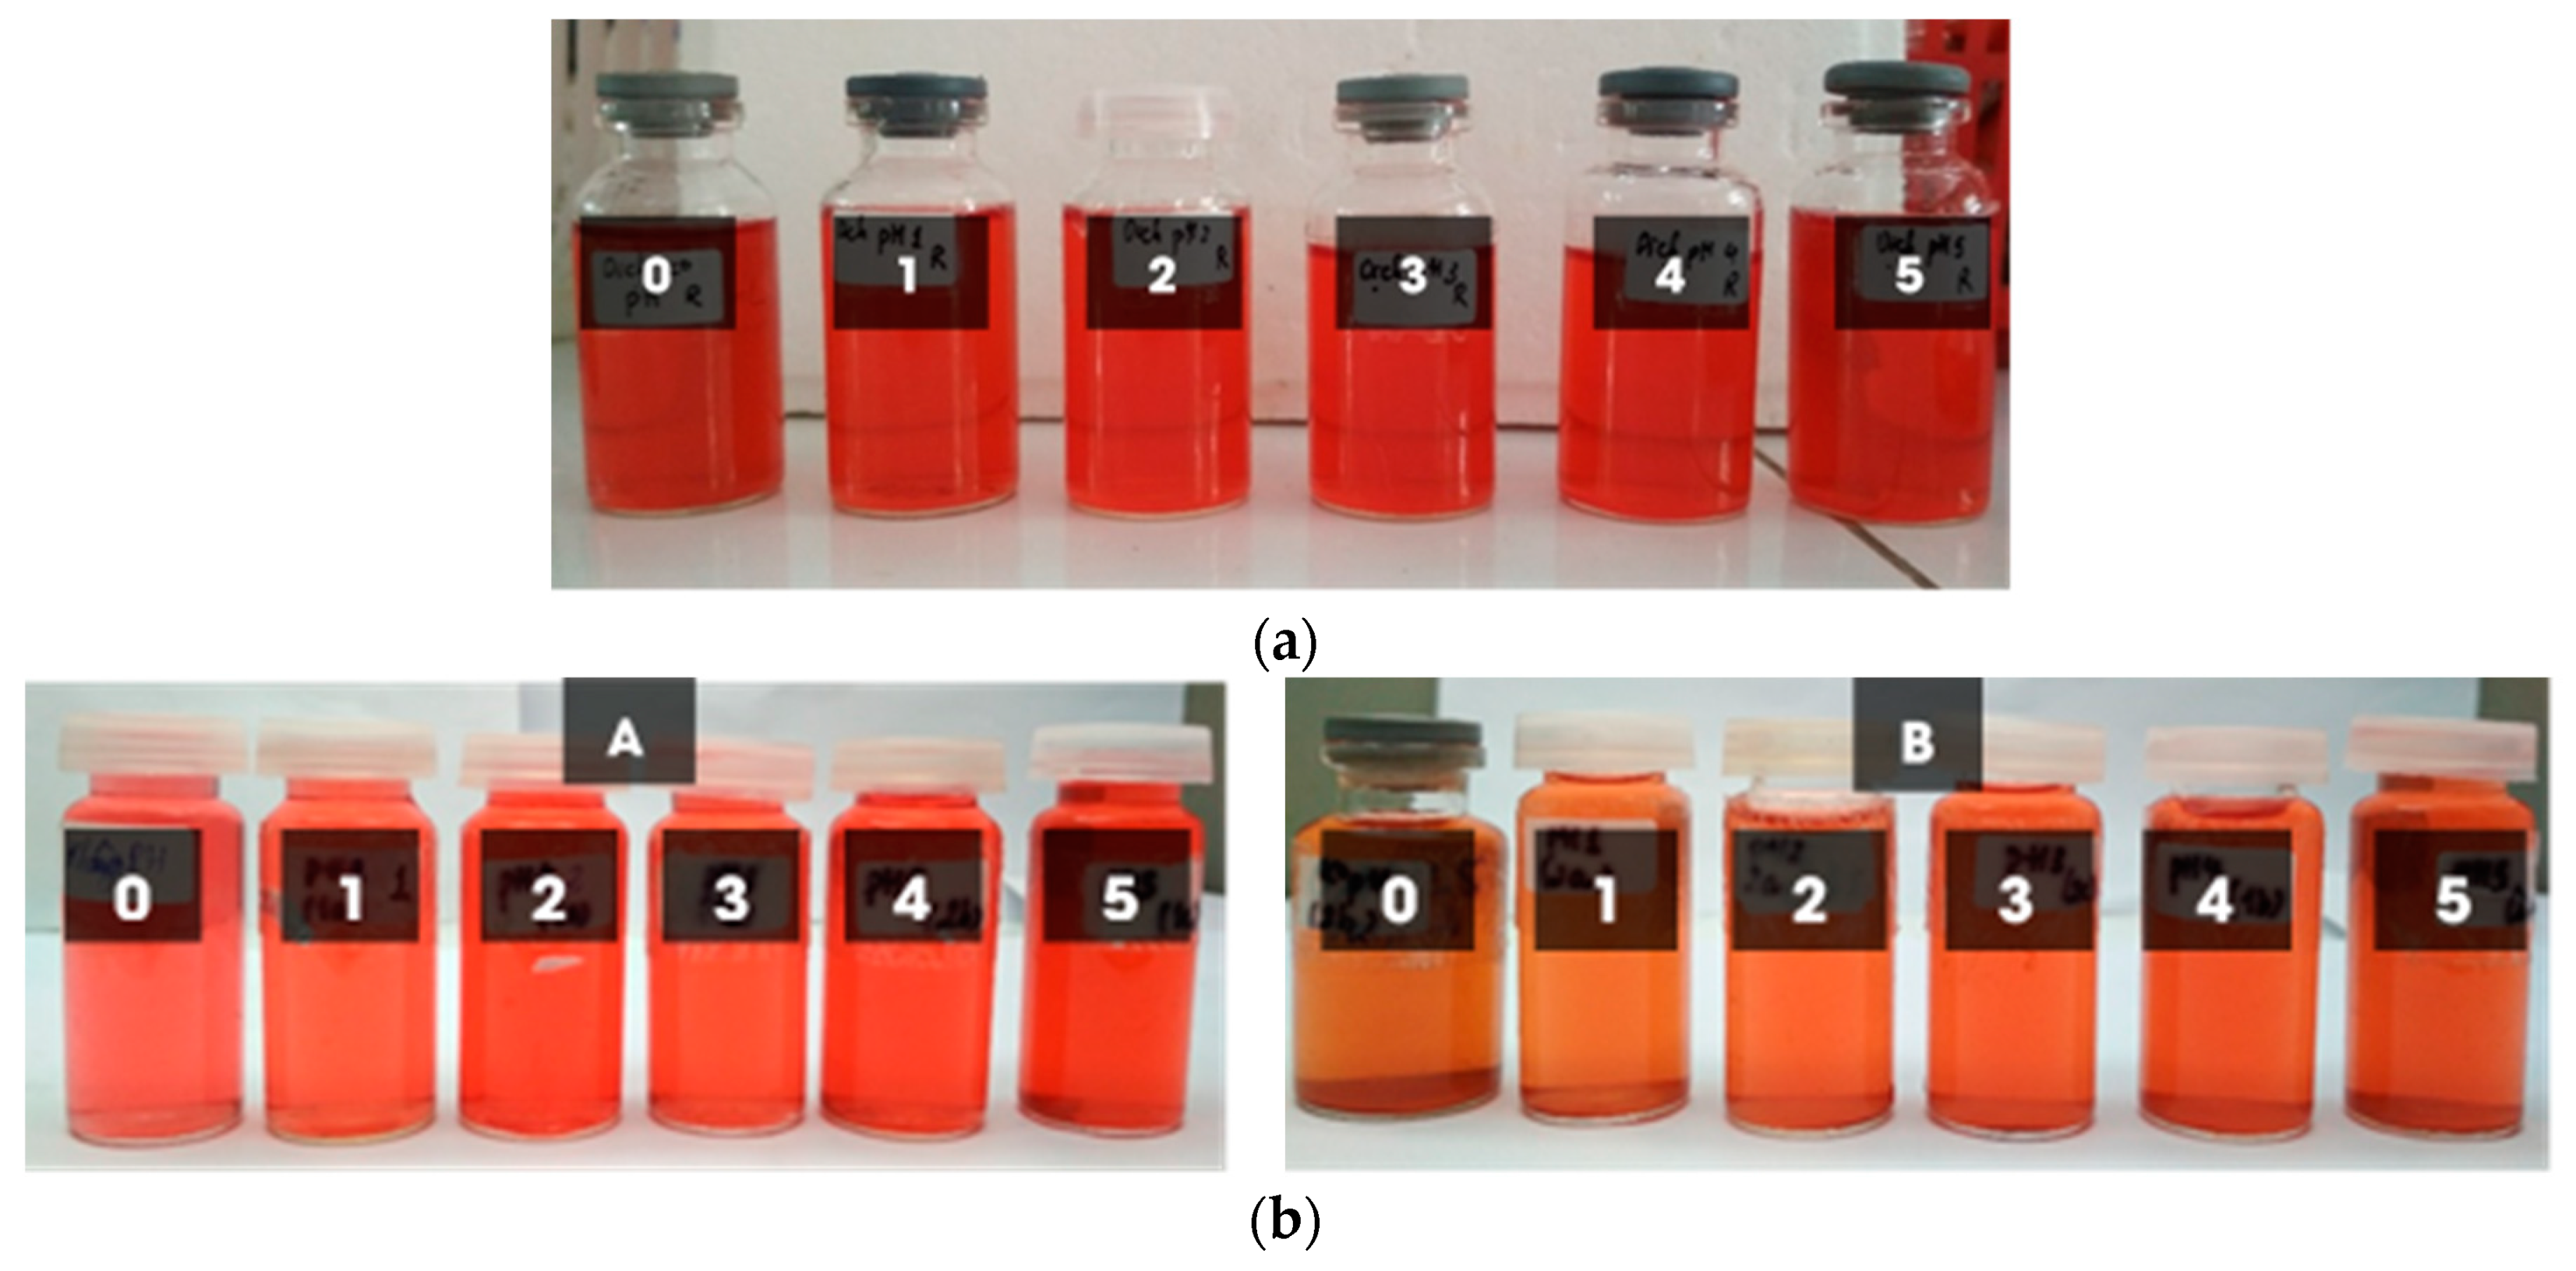
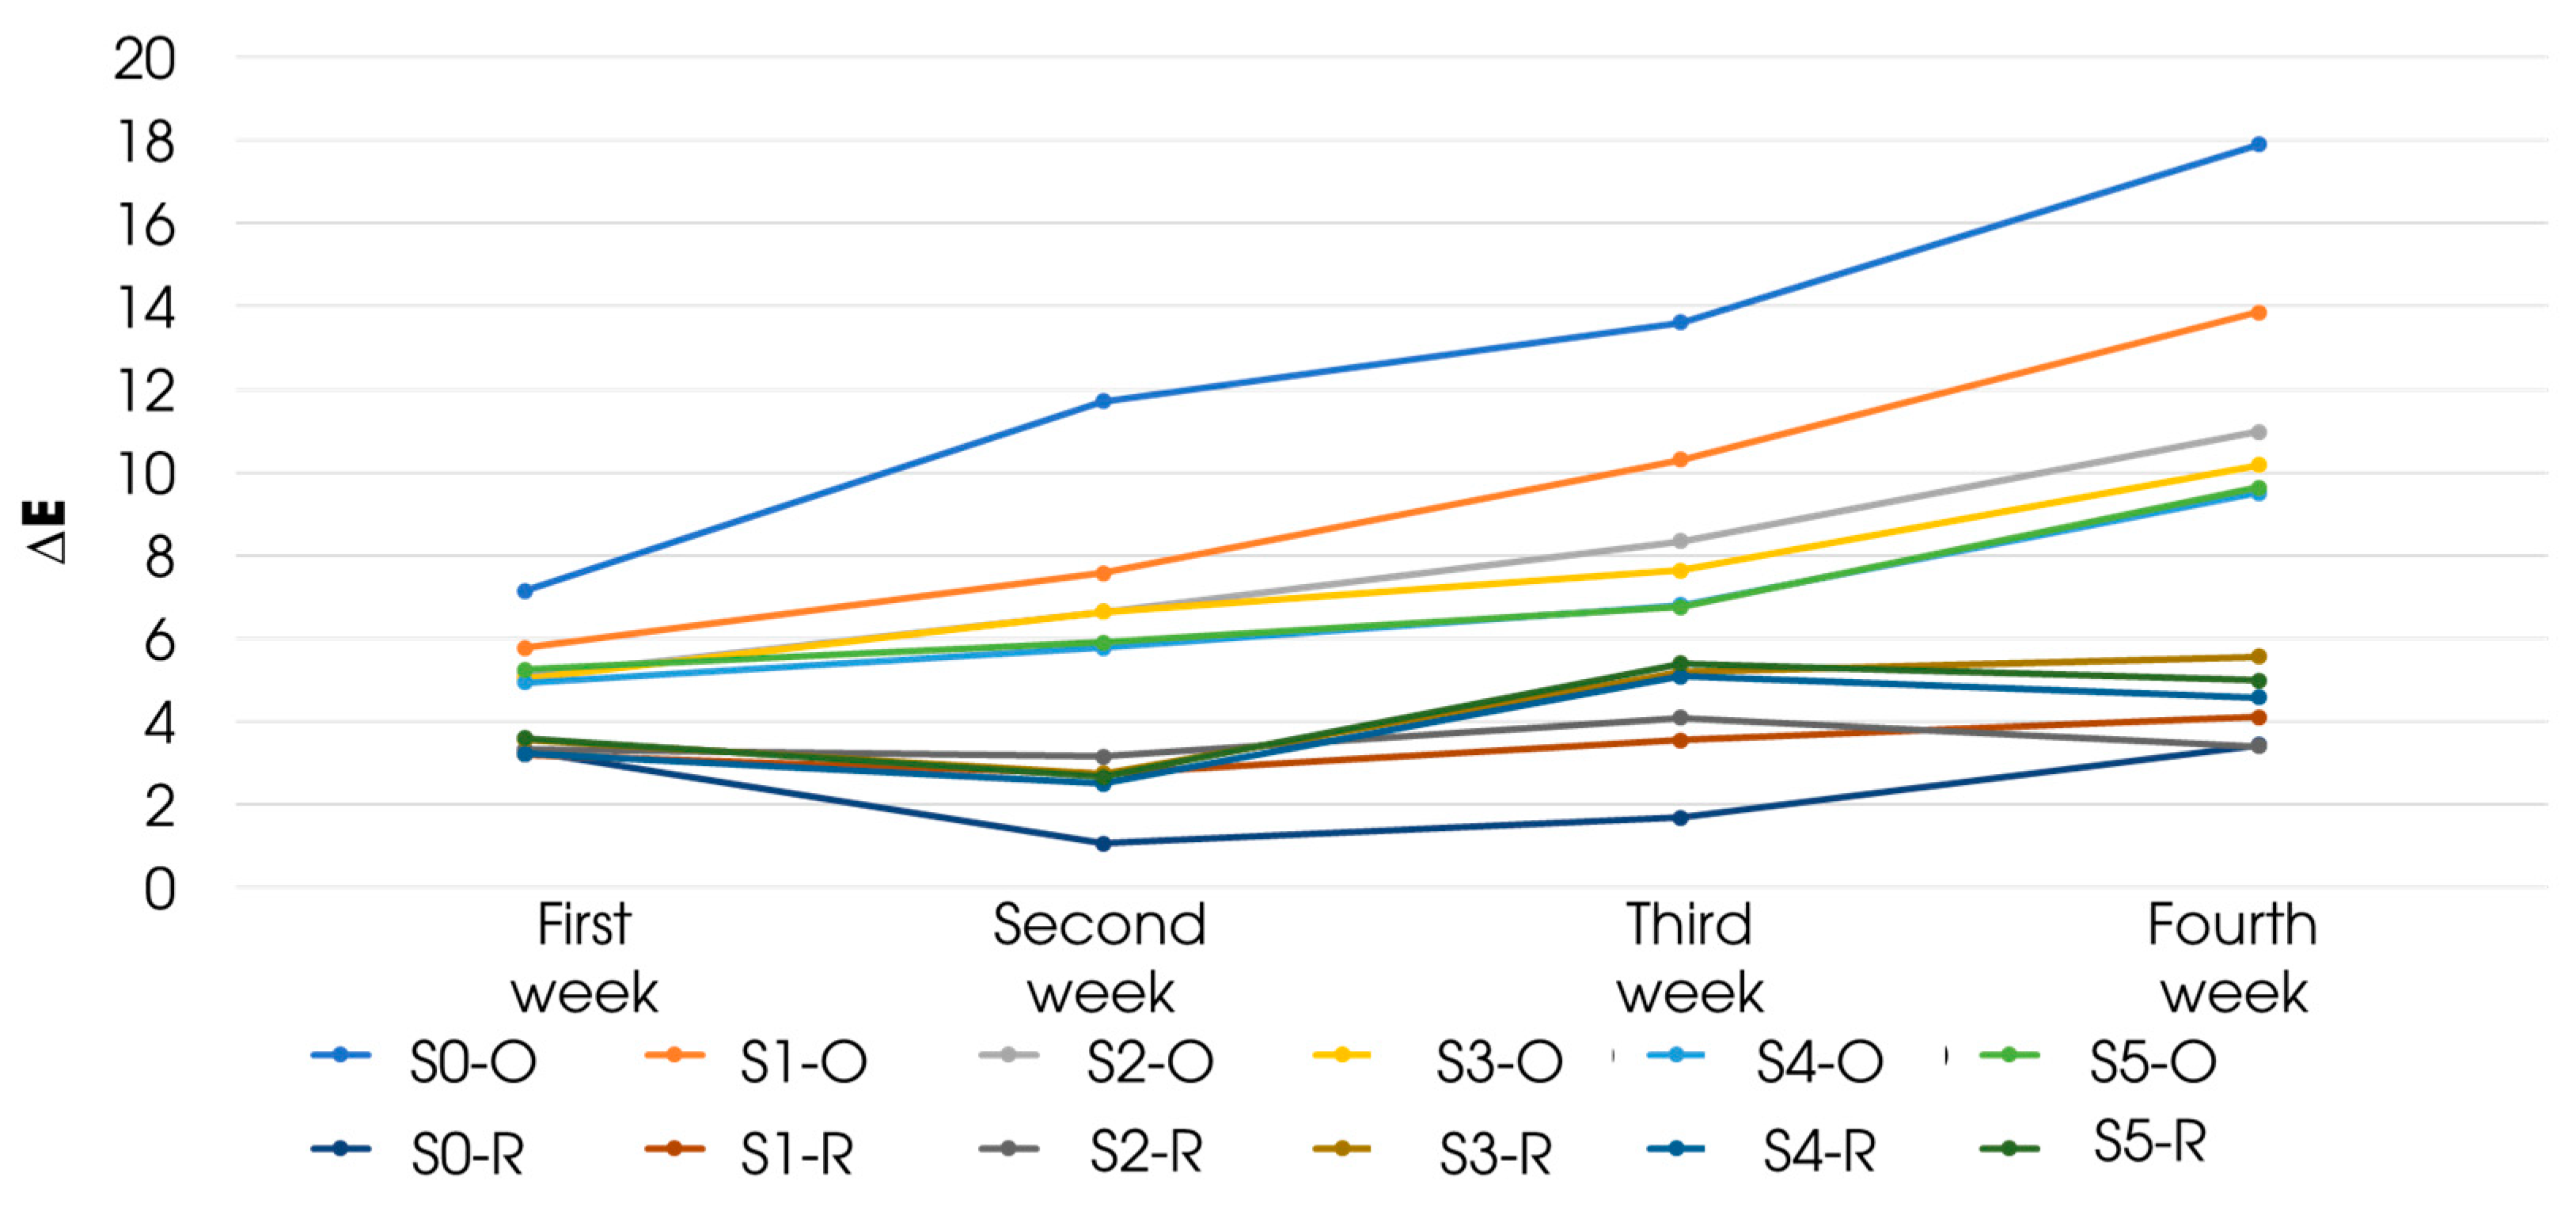
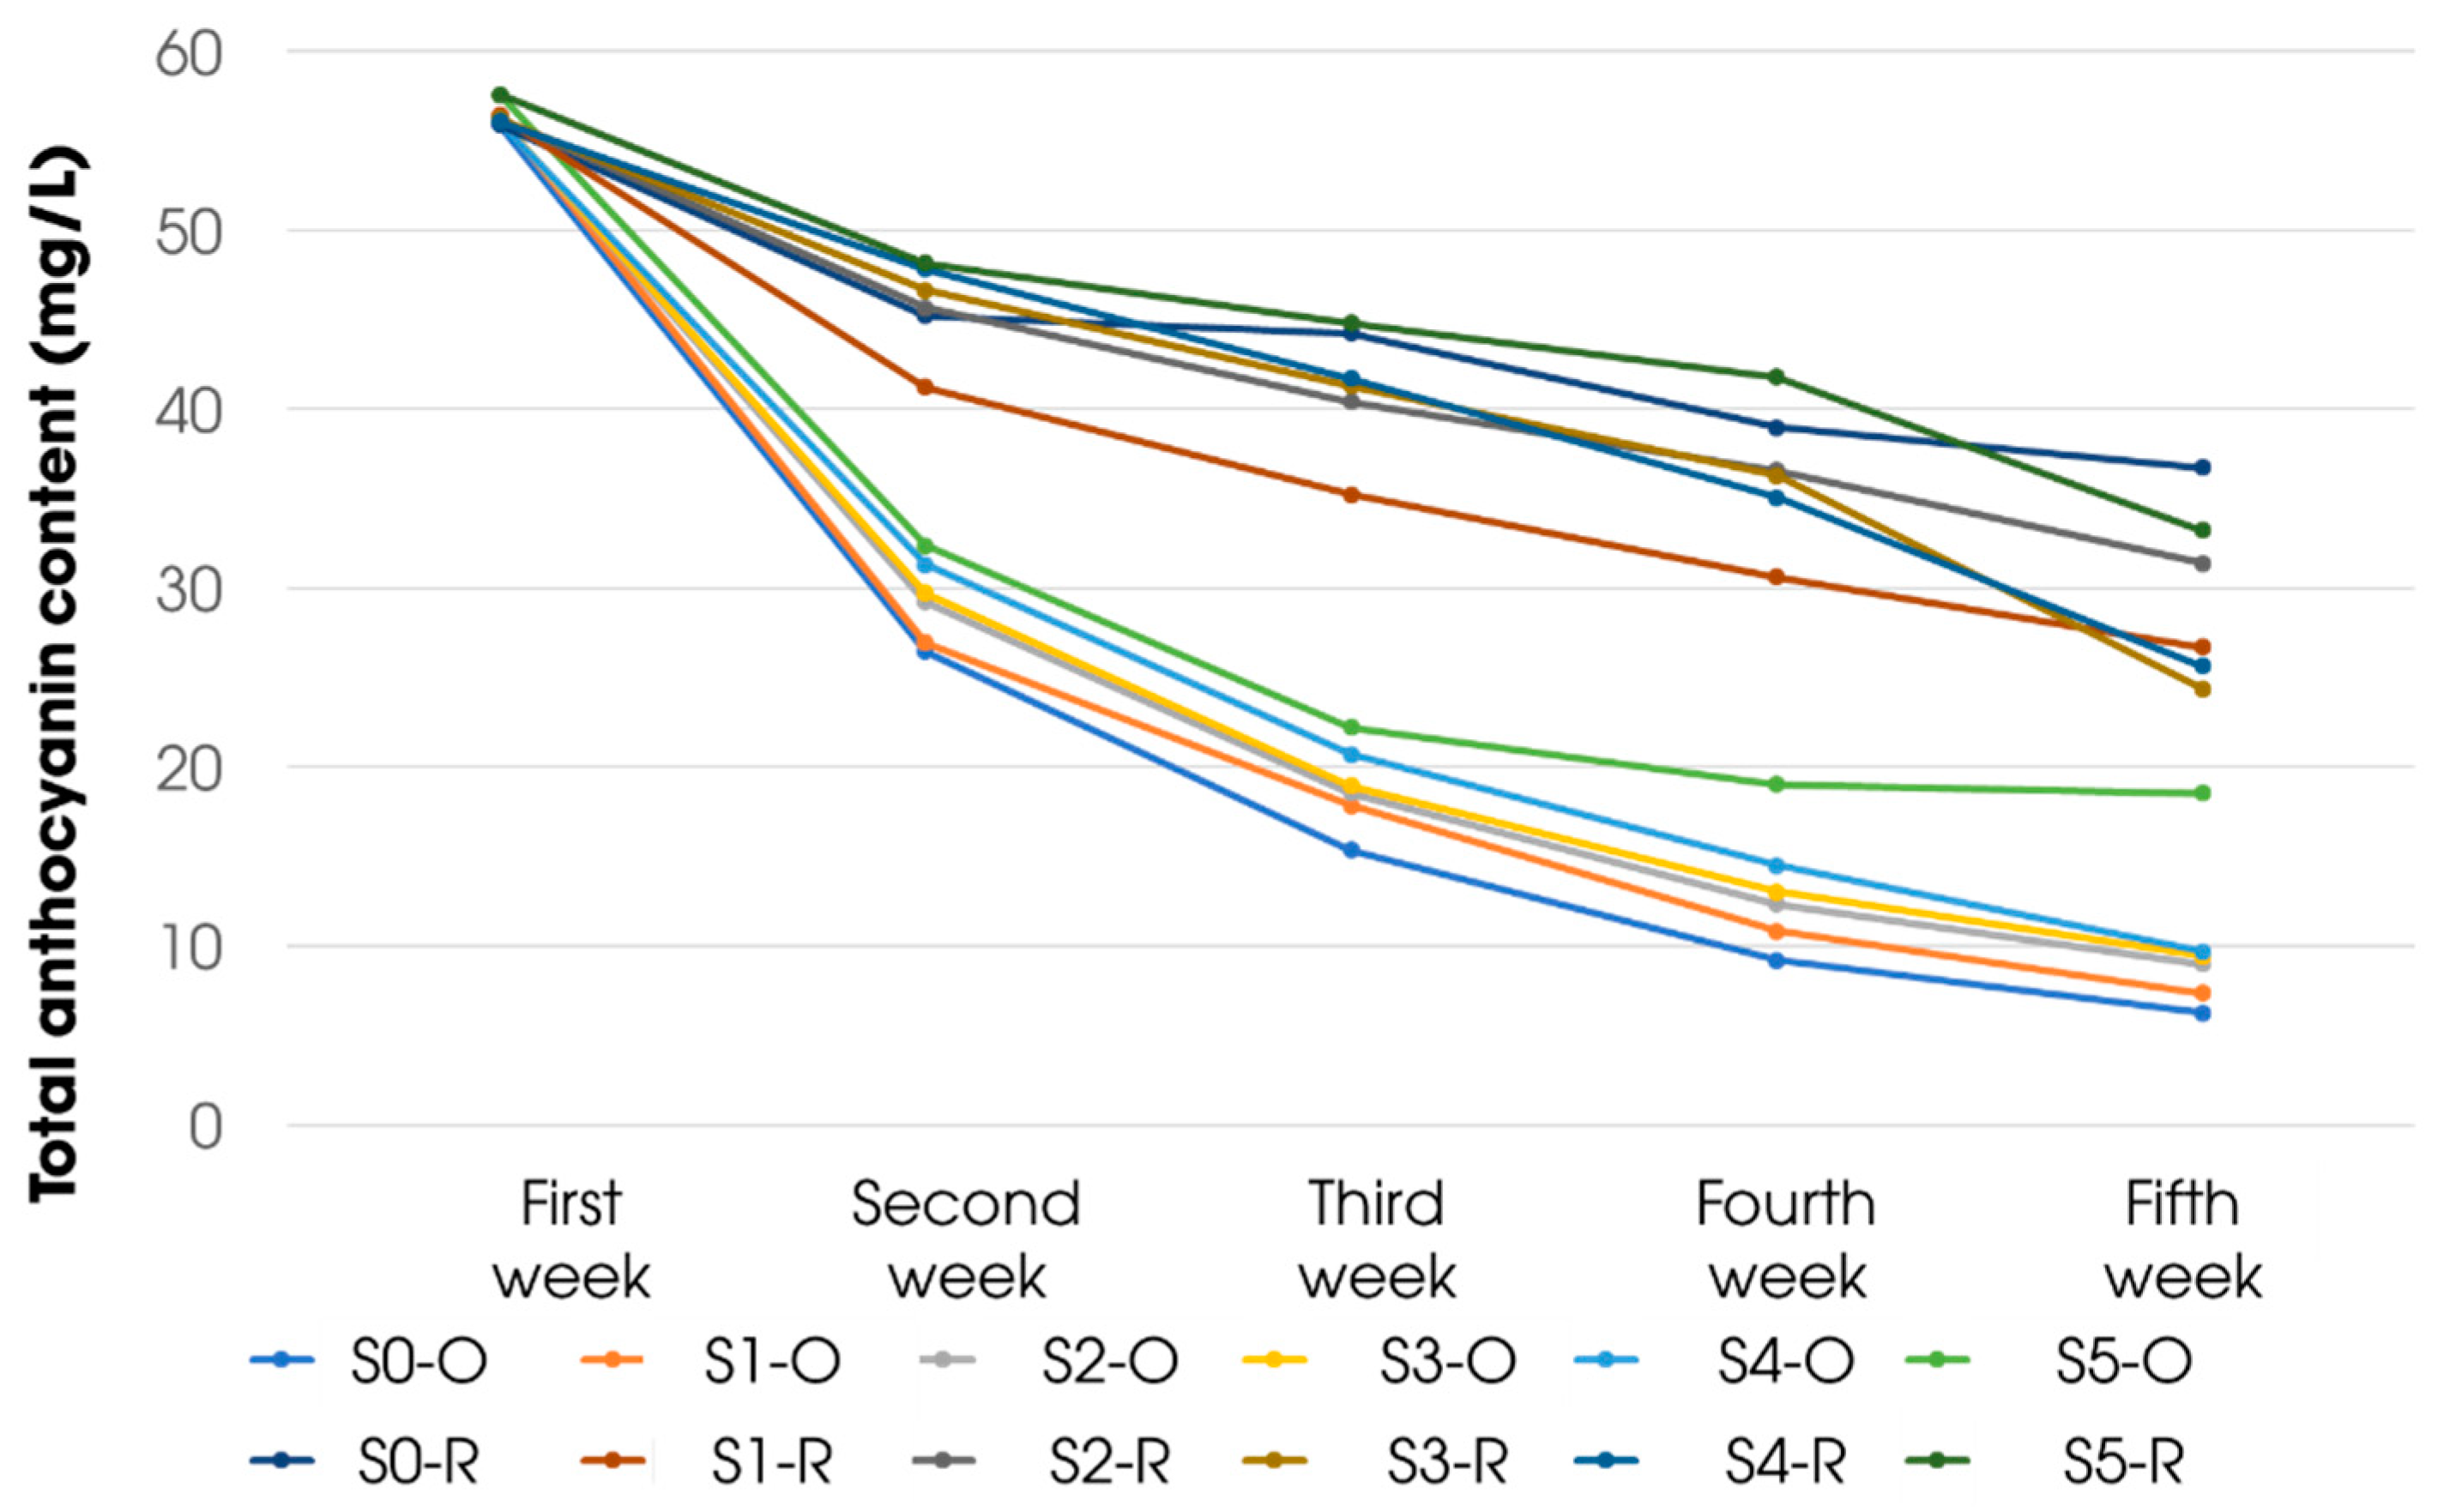
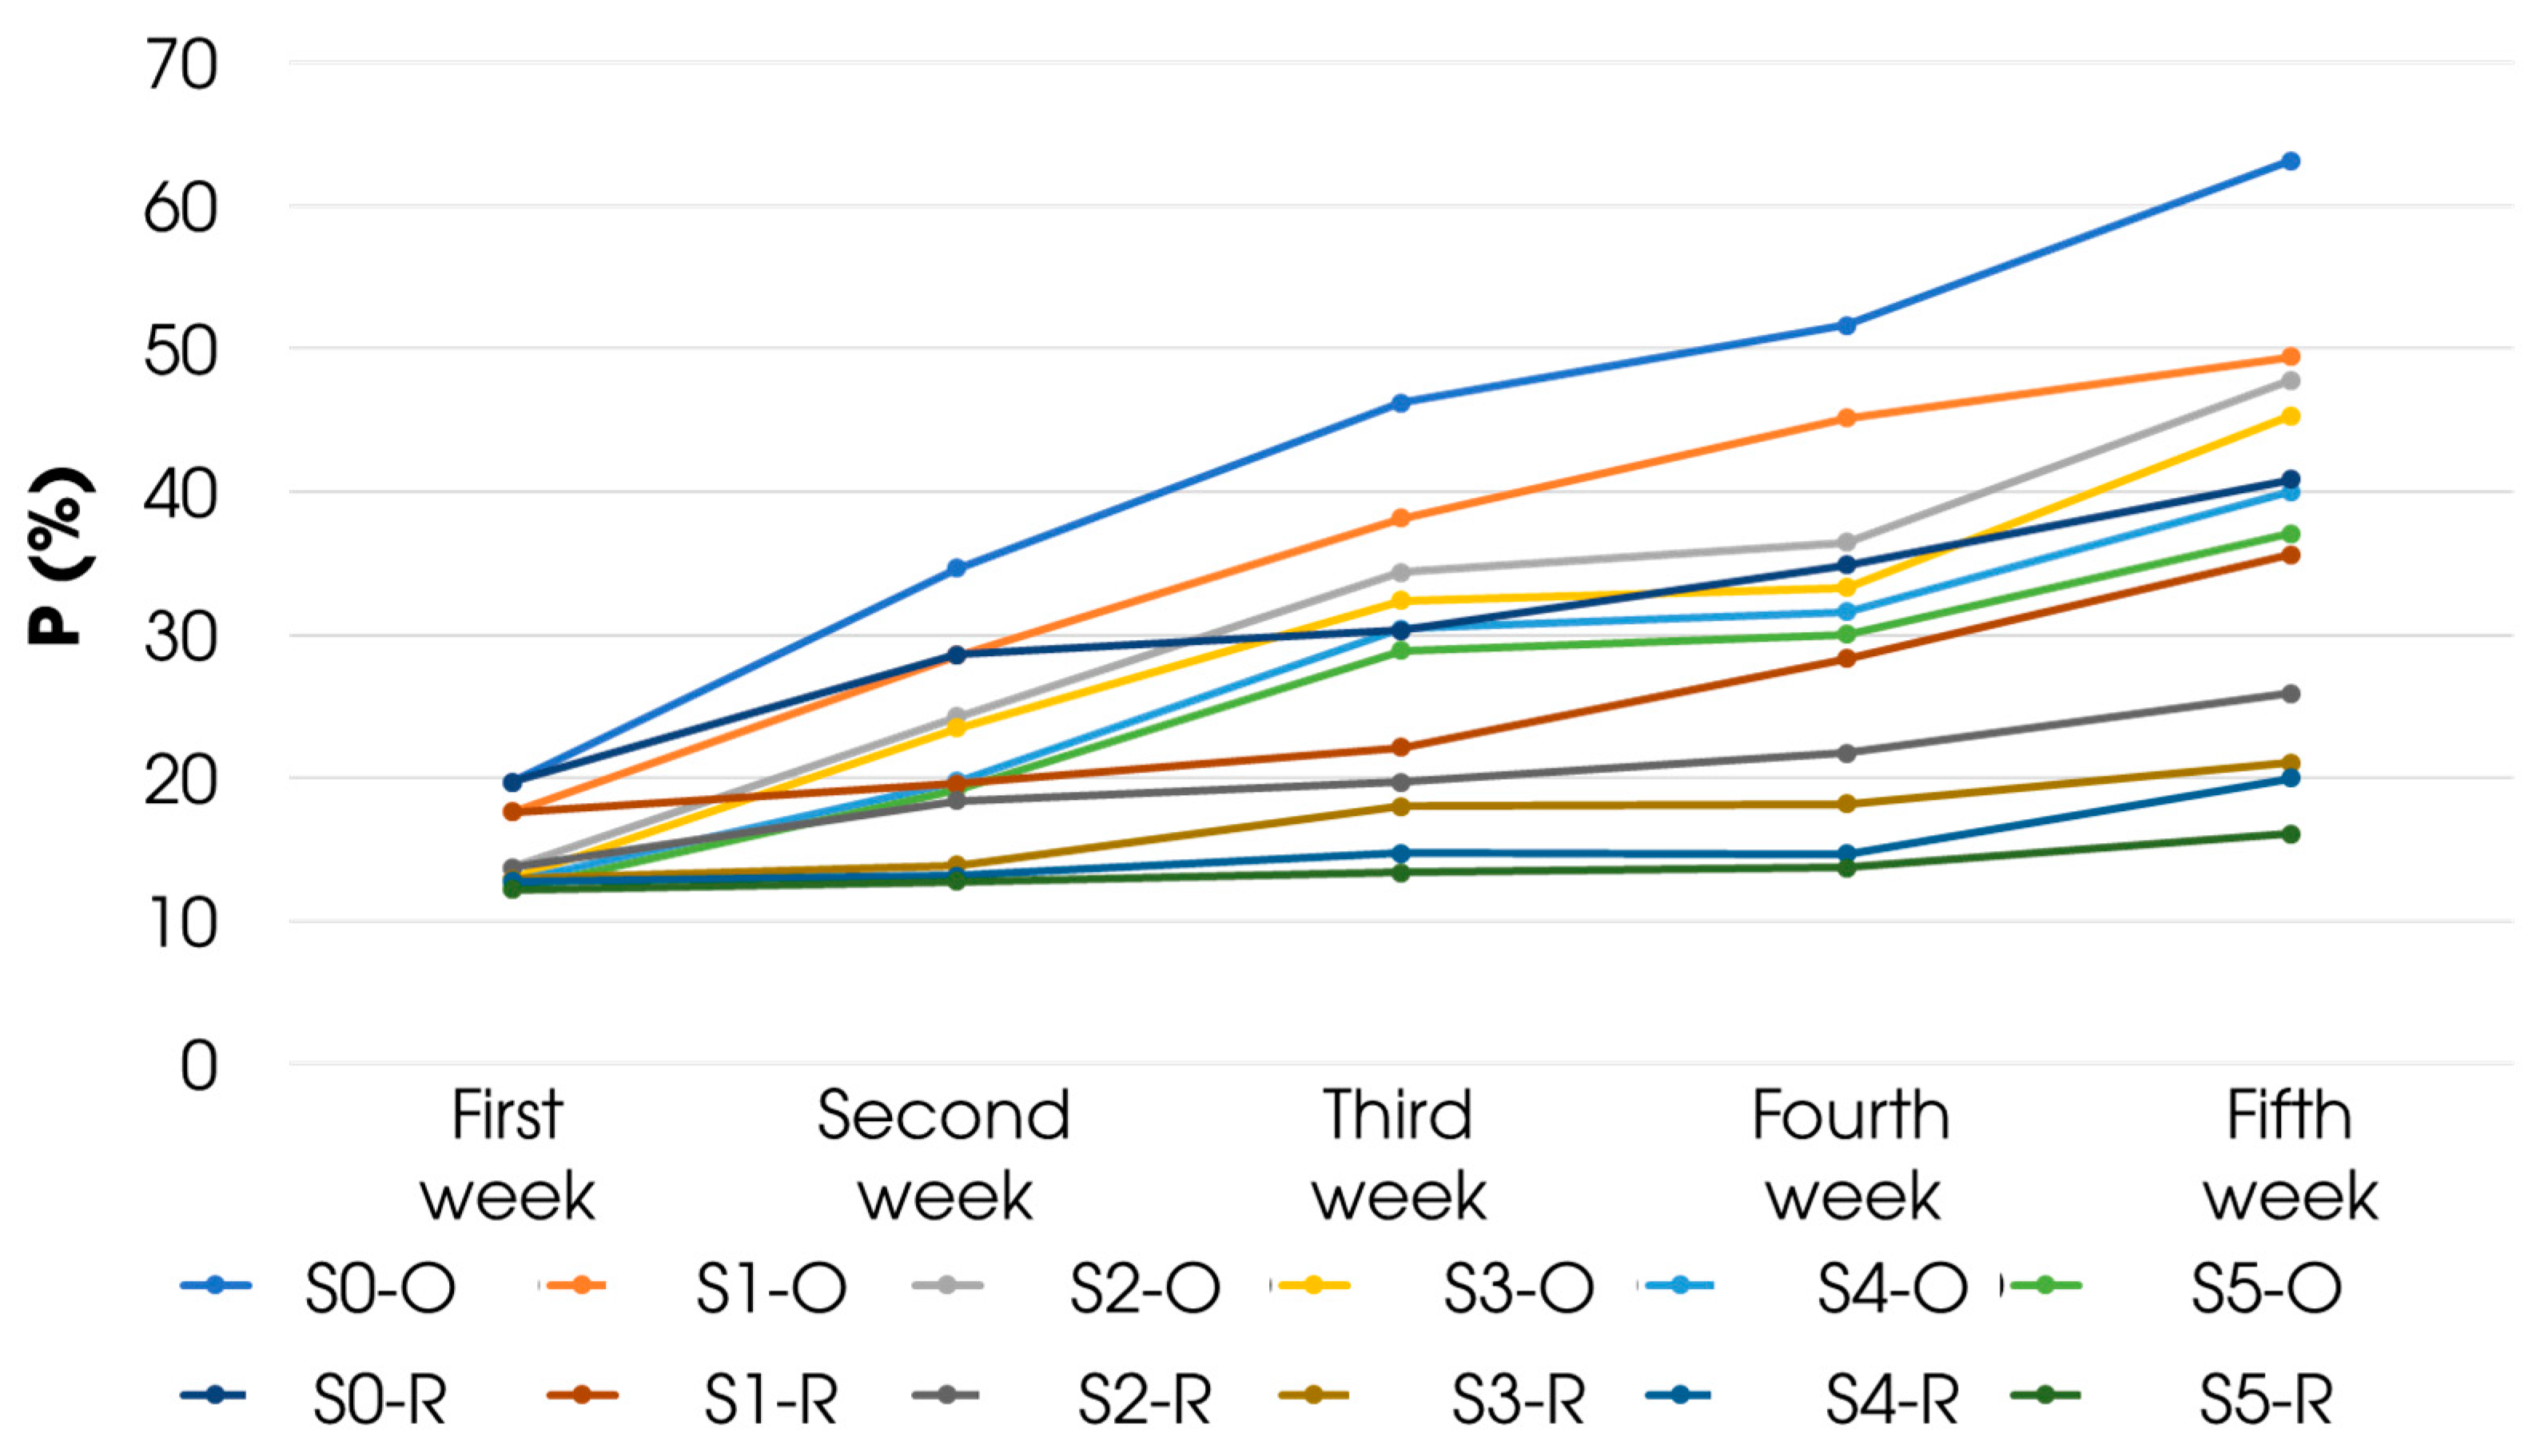
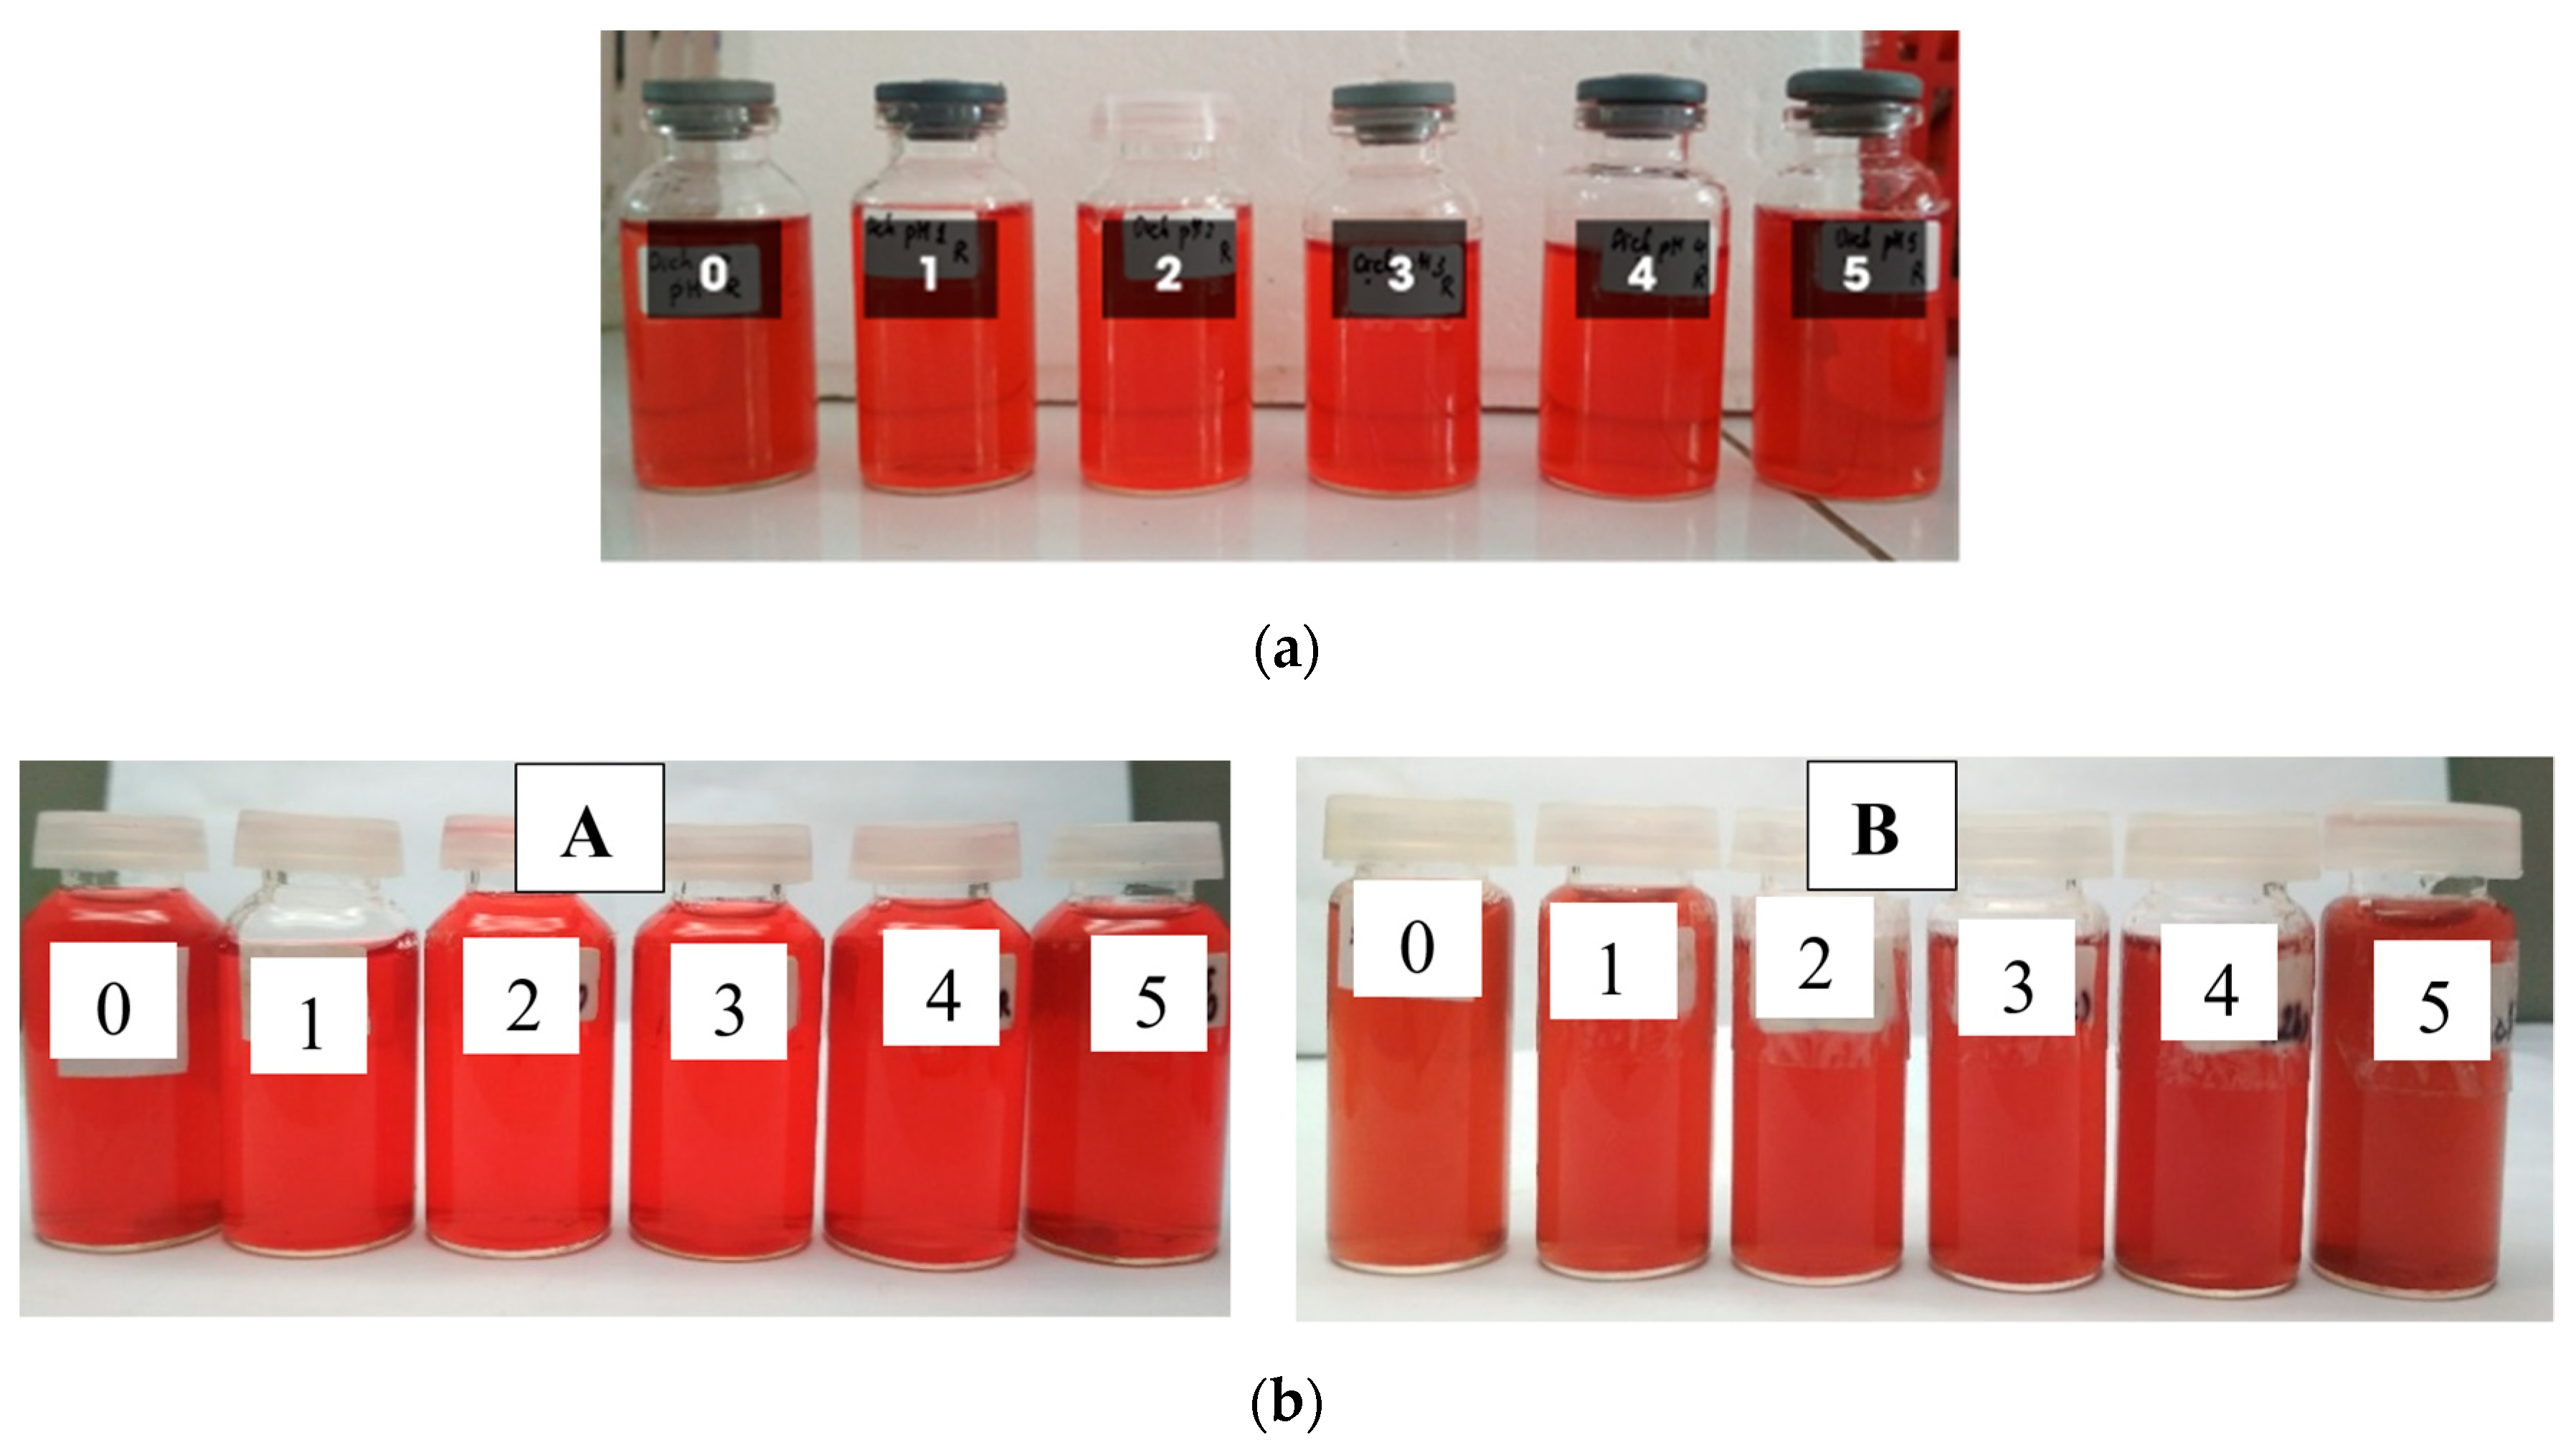
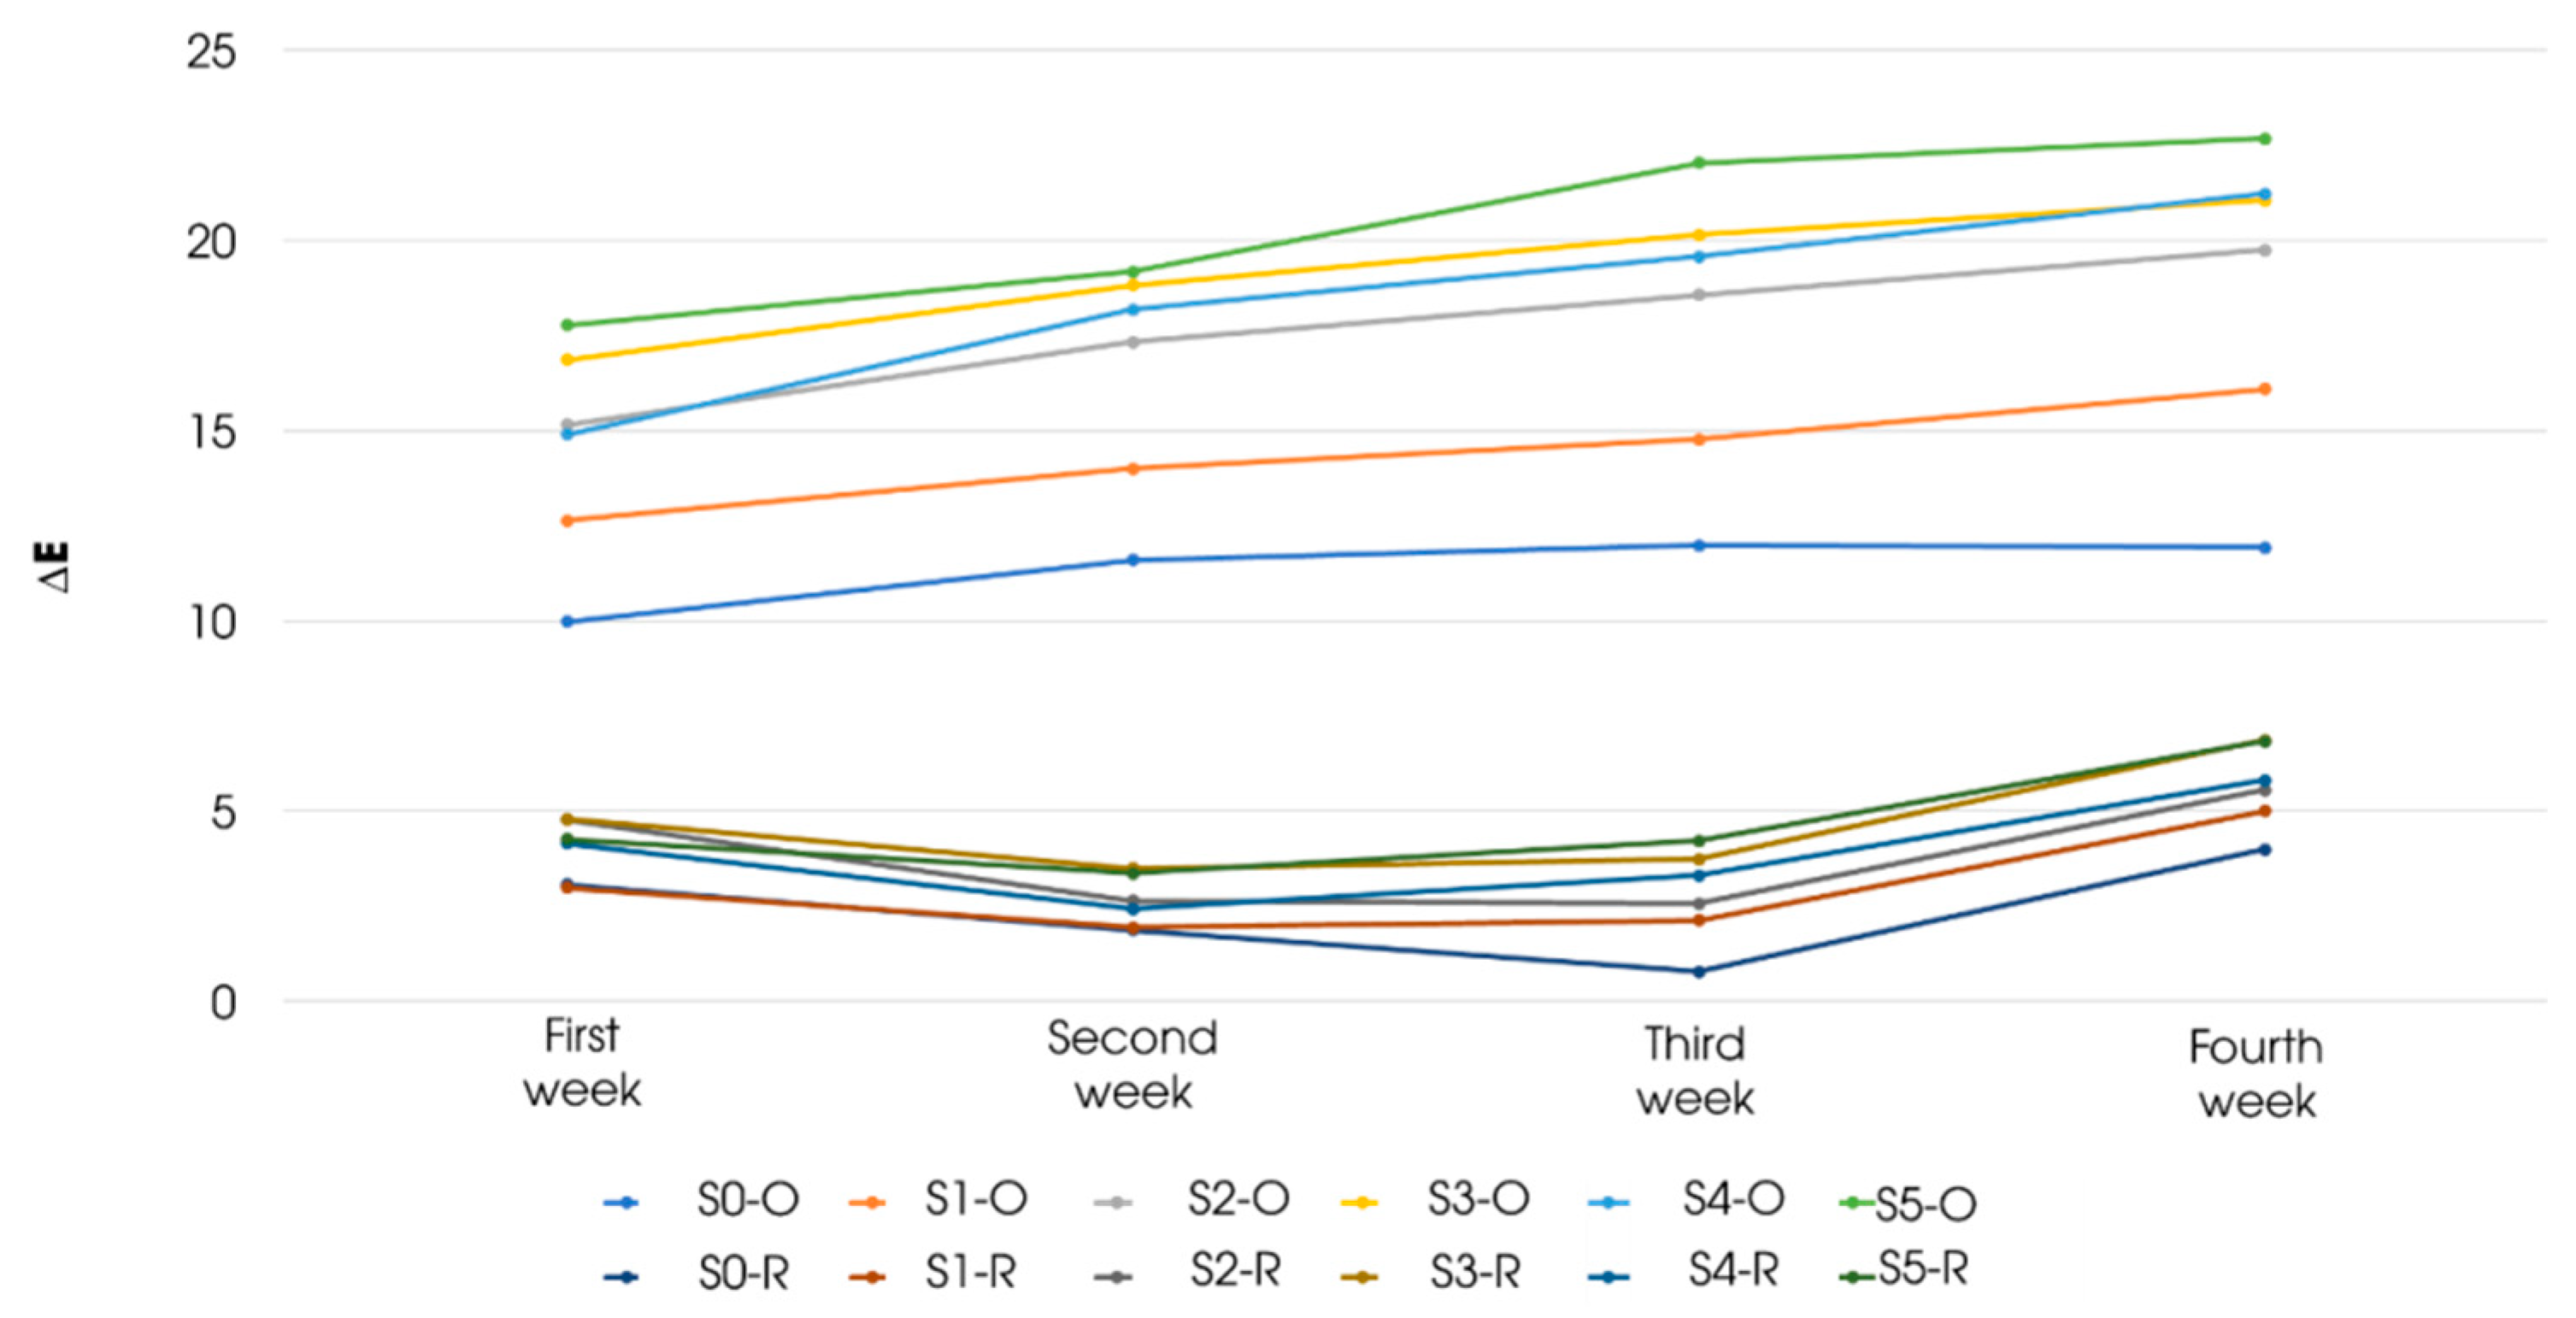
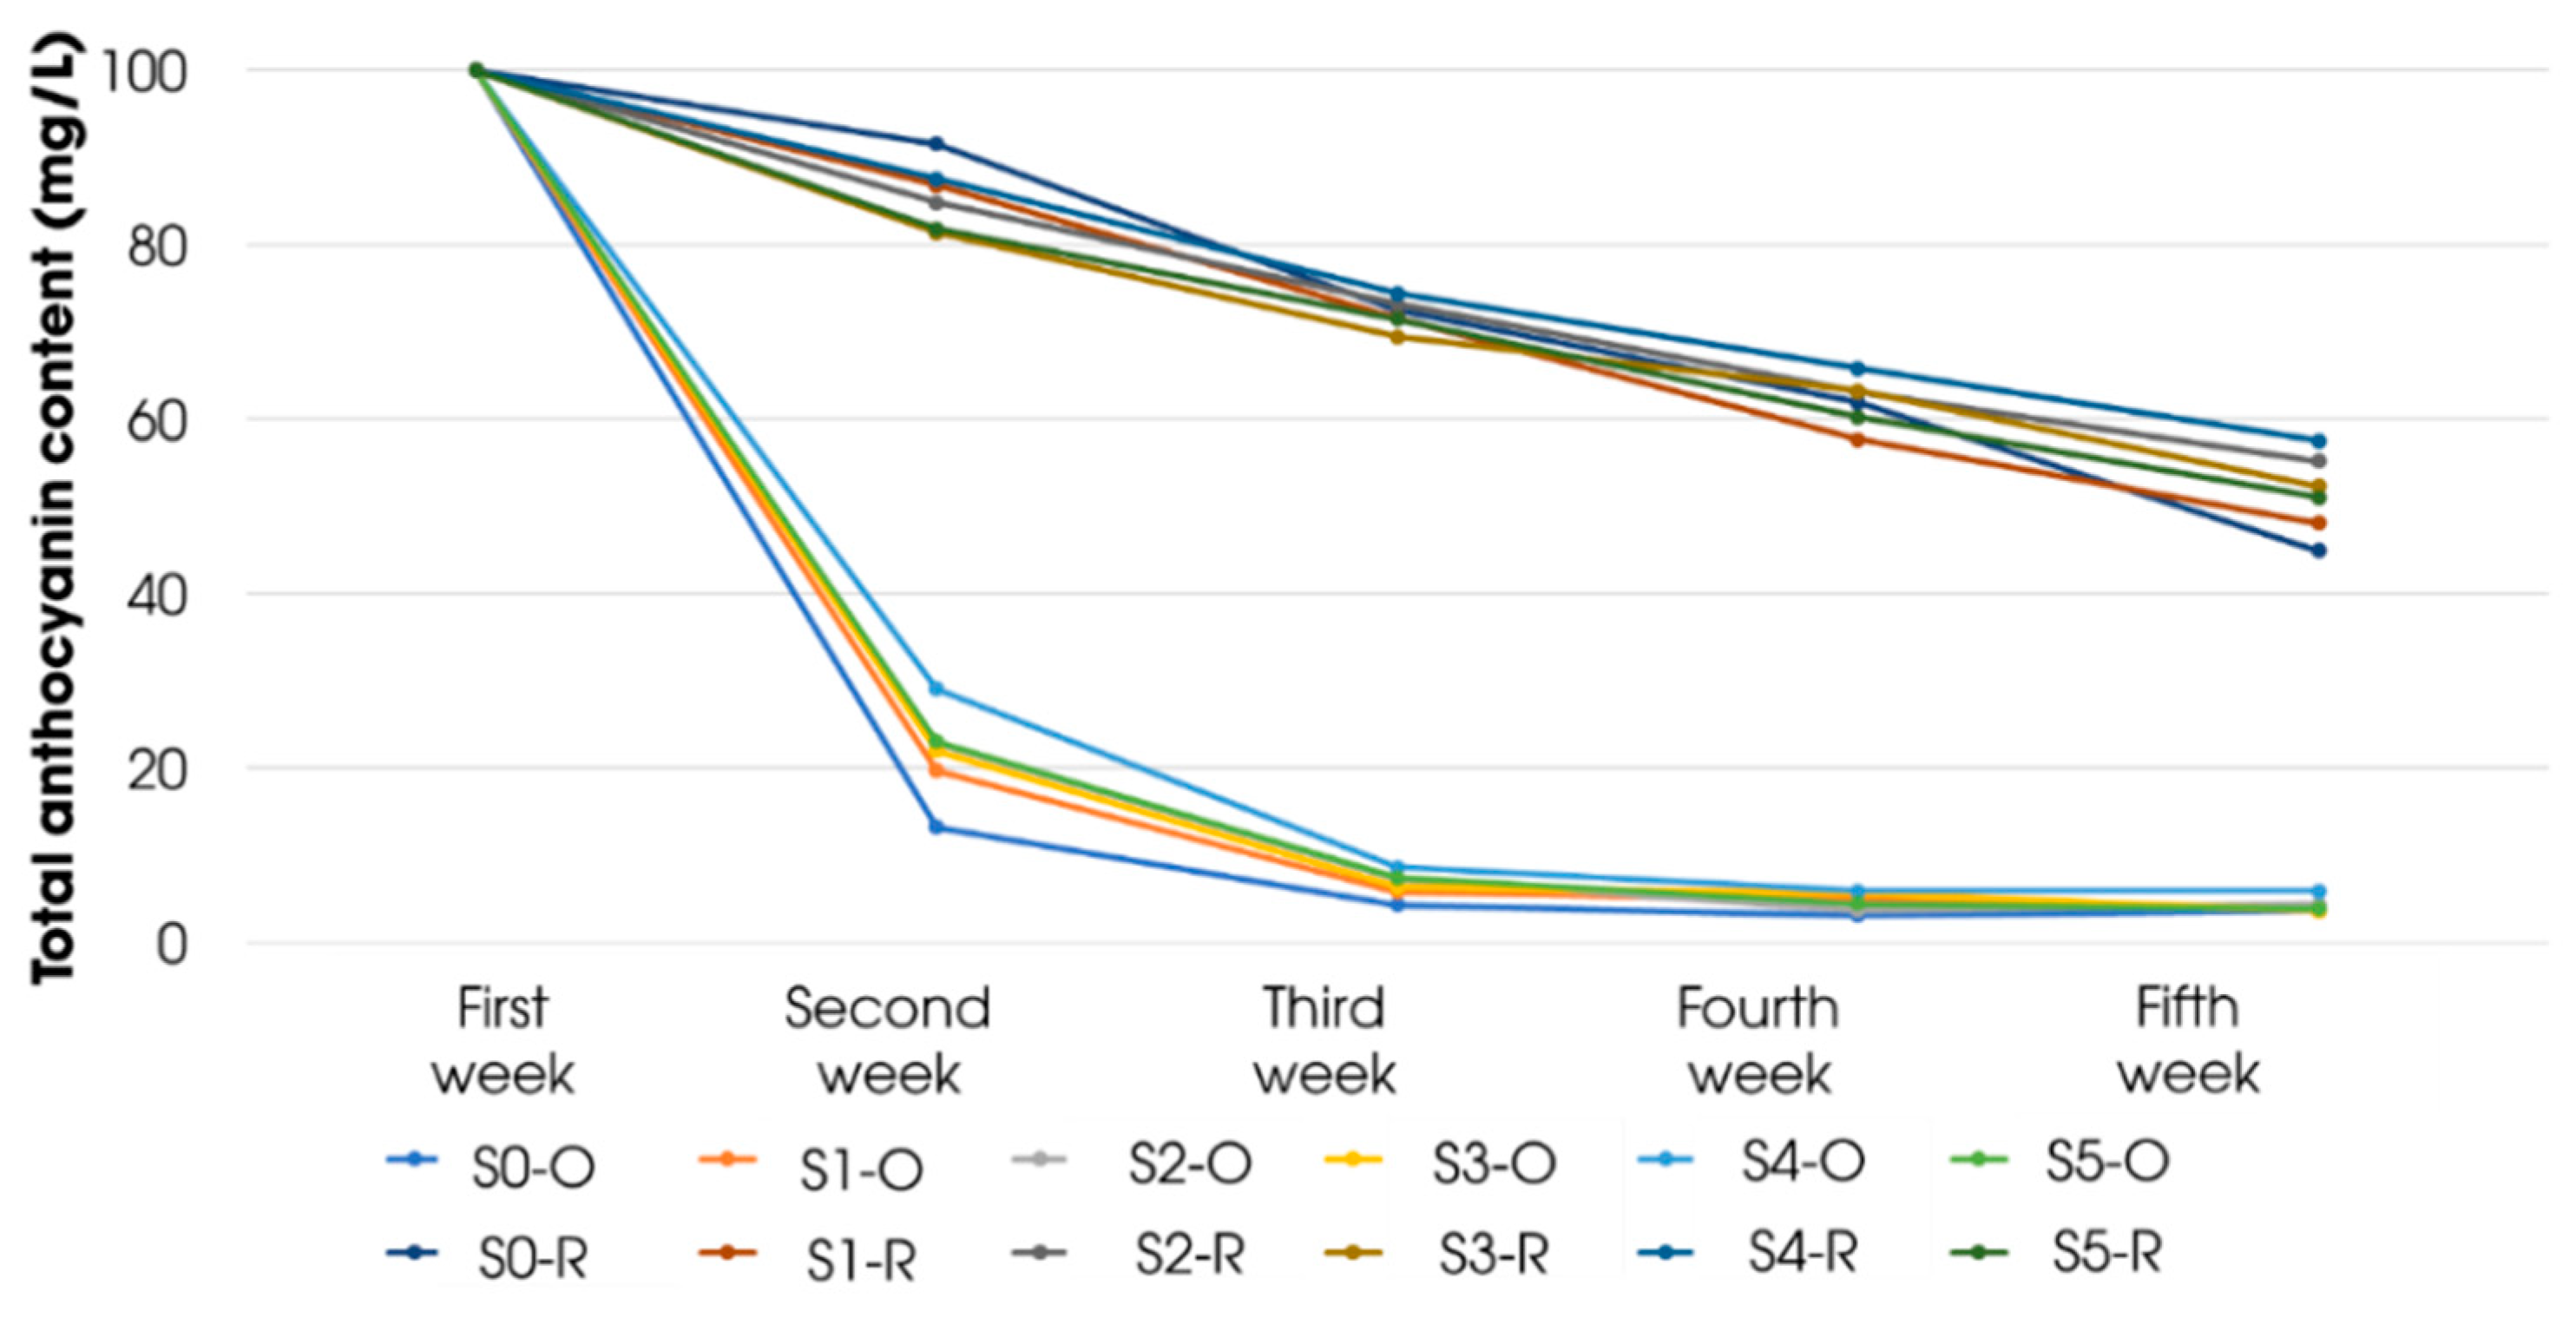
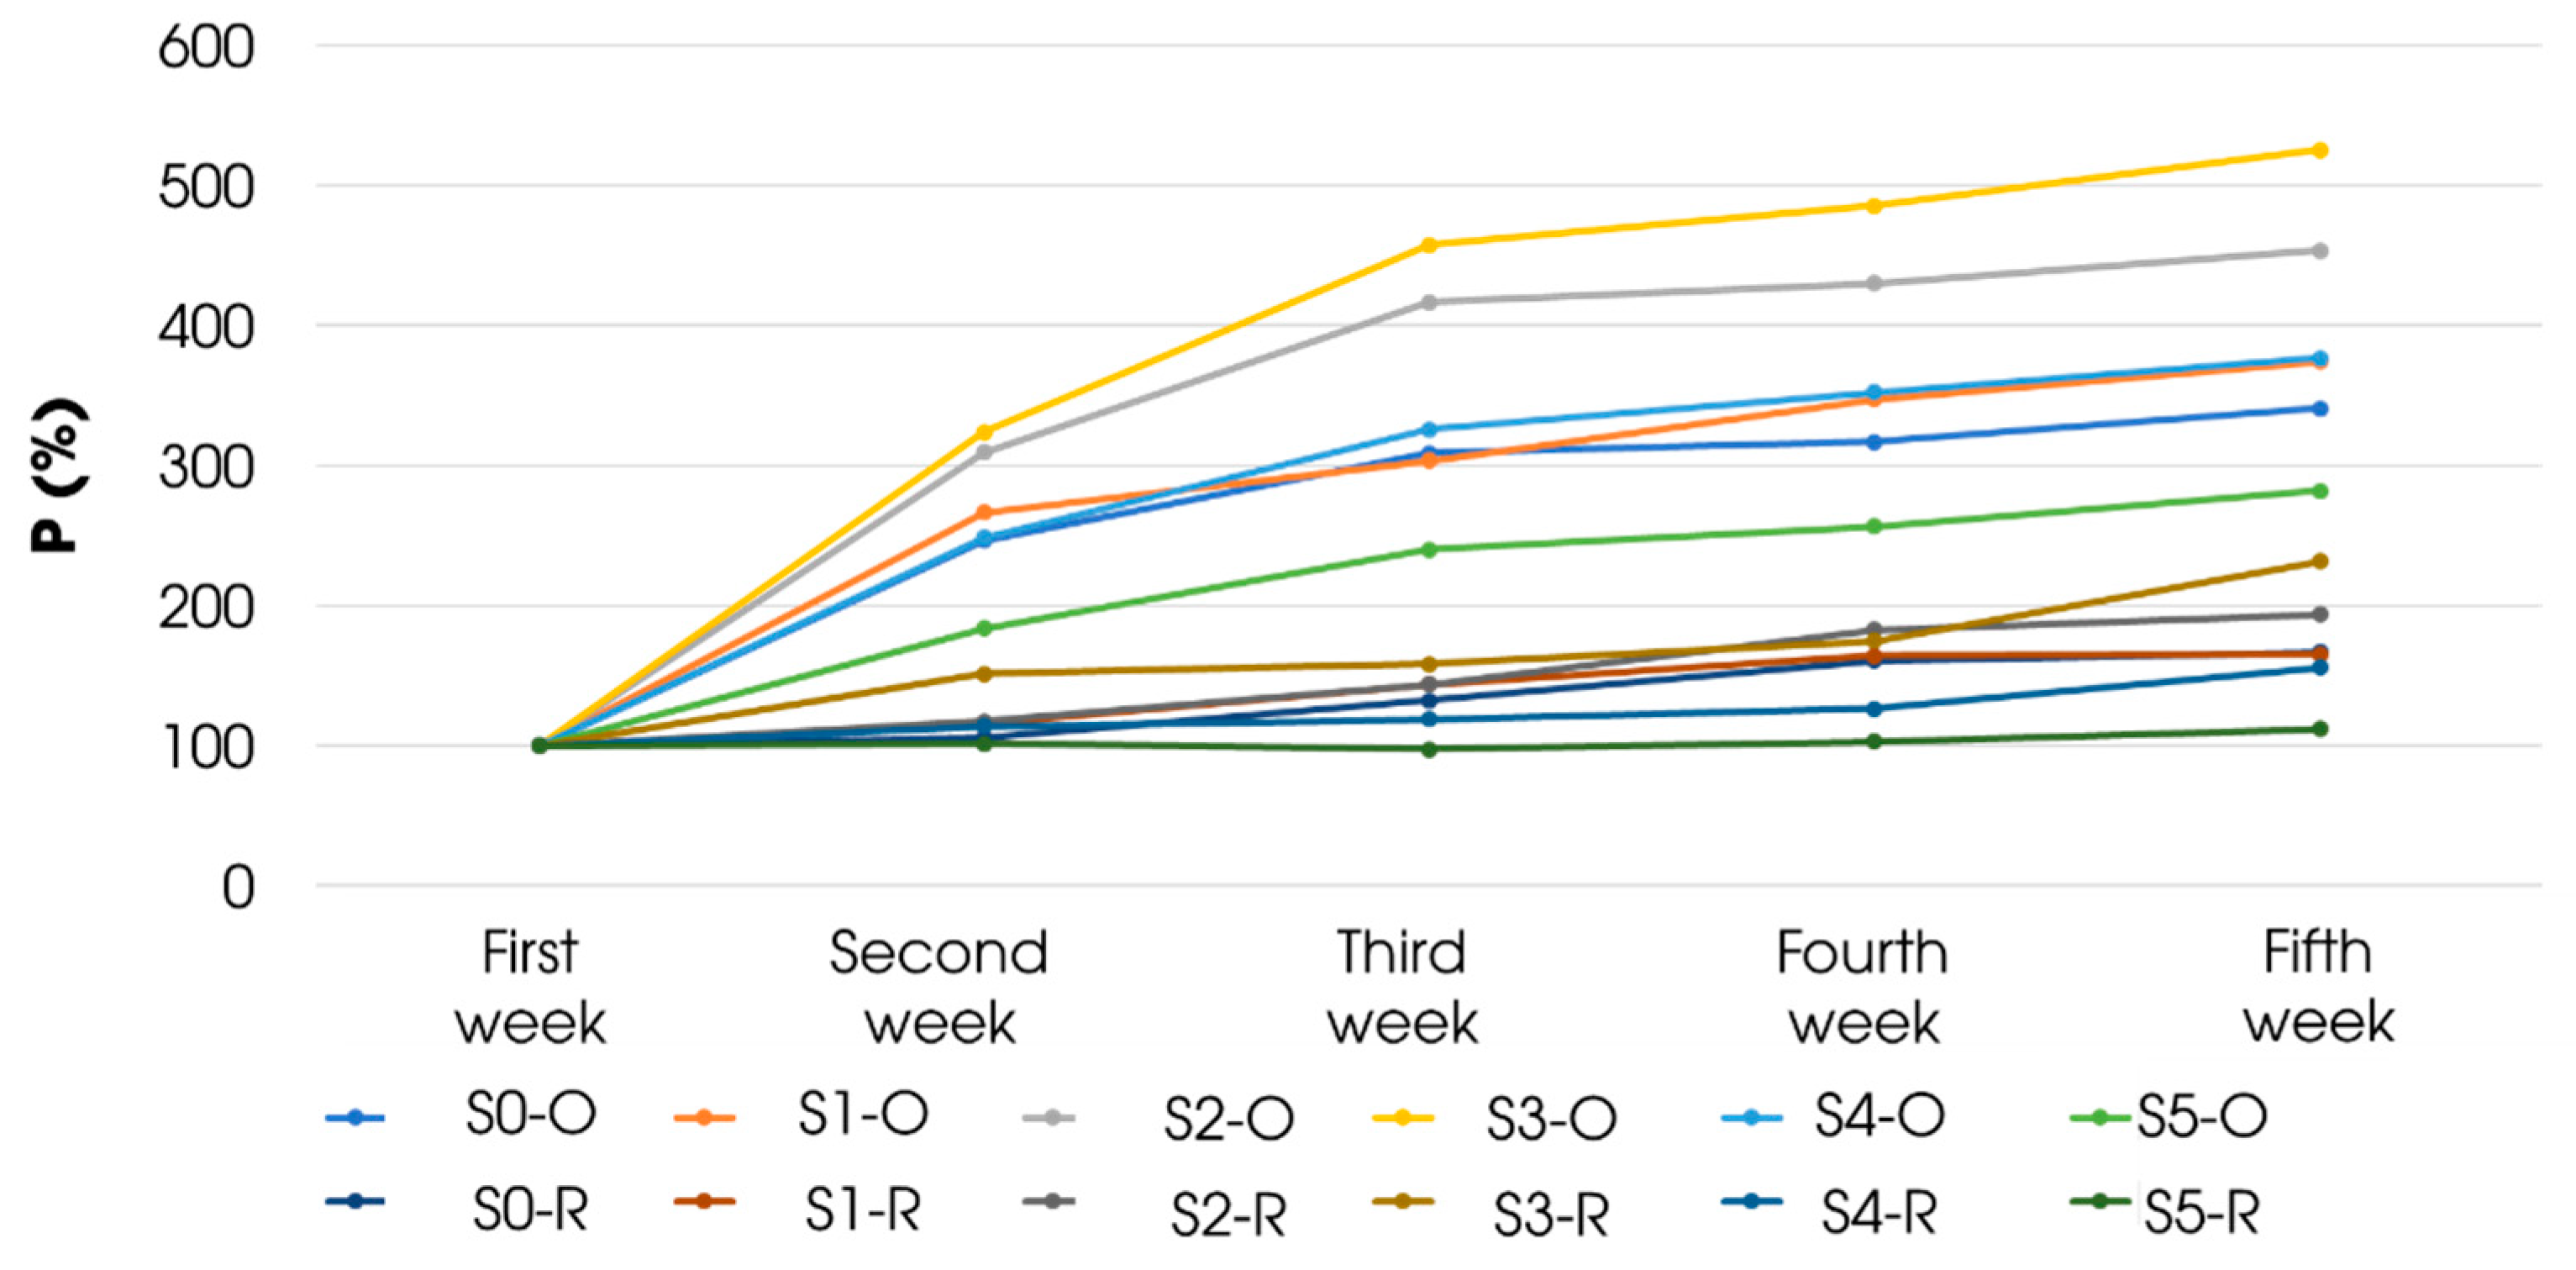
3.4. Stability Evaluation of Aqueous Solutions of Extract from Carissa Carandas Fruit

The crude extract obtained under optimized conditions was first subject to rotary evaporation under vacuum to obtain the dried extract. Afterwards, 0.05 g of dried extract was then added with a 10 mL of water and an appropriate amount of citric acid to produce different aqueous solutions as follows (Table 1).
As can be seen from Table 1, the introduction of citric acid at increasing concentration tended to reduce the pH of the extract solution from 3.25 to 2.39. However, since citric acid is a weak acid [13], it is impossible to adjust the pH of the extract to a lower level. Obtained aqueous solutions were stored under two conditions including room (R) temperature (30 ± 2 °C) and warm (O) temperature (45 ± 1 °C). To avoid the effects of light, the samples are covered with aluminum foil and stored in dark place. Figure 8 visually depicts the aqueous samples at the initial stage and after 4 weeks.
With regard to color change in CIE-LCh color space, aqueous solutions of the fruit extract were stored and evaluated over time for 4 weeks. As shown in Figure 9, in comparison with aqueous solutions stored at the room temperature, aqueous solutions stored in the warm cabinet witnessed a faster change in ∆E after 4 weeks. This indicates that the storage at higher temperature may cause the discoloration to occur at a faster pace. After 2 weeks, fermentation and microbial contamination began to take place, contributing to the pH decline and the structural transformation of the anthocyanin to flavylium. However, the decomposition of these at the fourth week resulted in reduced color deviations. The sample O, stored at warm temperature and absent of citric acid, exhibited the fastest discoloration in comparison with other aqueous solutions added with citric acid. At low pH, anthocyanins maintained the stable form of flavylium. In addition, a large amount of added citric acid caused the process to occur copigmentation between this anthocyanin and organic acid, which contributes to the color stability.
With regard to anthocyanin content change, the anthocyanin contents in the aqueous solution of extracts after four weeks of storage at two different temperatures were visualized in Figure 10. Overall, the anthocyanin loss of aqueous solutions stored at warm temperature was more substantial than that of aqueous solutions stored at room temperature. In addition, it was found that increasing introduction of citric acid contributed to the stability of anthocyanin in aqueous solutions stored at warm temperature. To be specific, at the fifth week, all samples stored at warm temperature showed anthocyanin contents positively correlated with citric acid concentration. Particularly, the sample 5, which was added with 5 g/L citric acid, was the exceptional case with the highest anthocyanin retention.
Figure 11 shows the anthocyanin polymerization degree of the aqueous solutions of extracts during 4 weeks at room temperature and at 45 °C. It was indicated that aqueous solutions stored at warm temperature had a faster polymerization rate in comparison with samples stored at room temperature [20]. In addition, citric acid was found to be influential to the polymerization. To be specific, aqueous solutions in absence of citric acid had the fastest polymerization. In contrast, samples 3, 4, and 5 with low pH had the slowest polymerization at room temperature. The results suggest that both citric acid and temperature played a key role in the polymerization of anthocyanin.

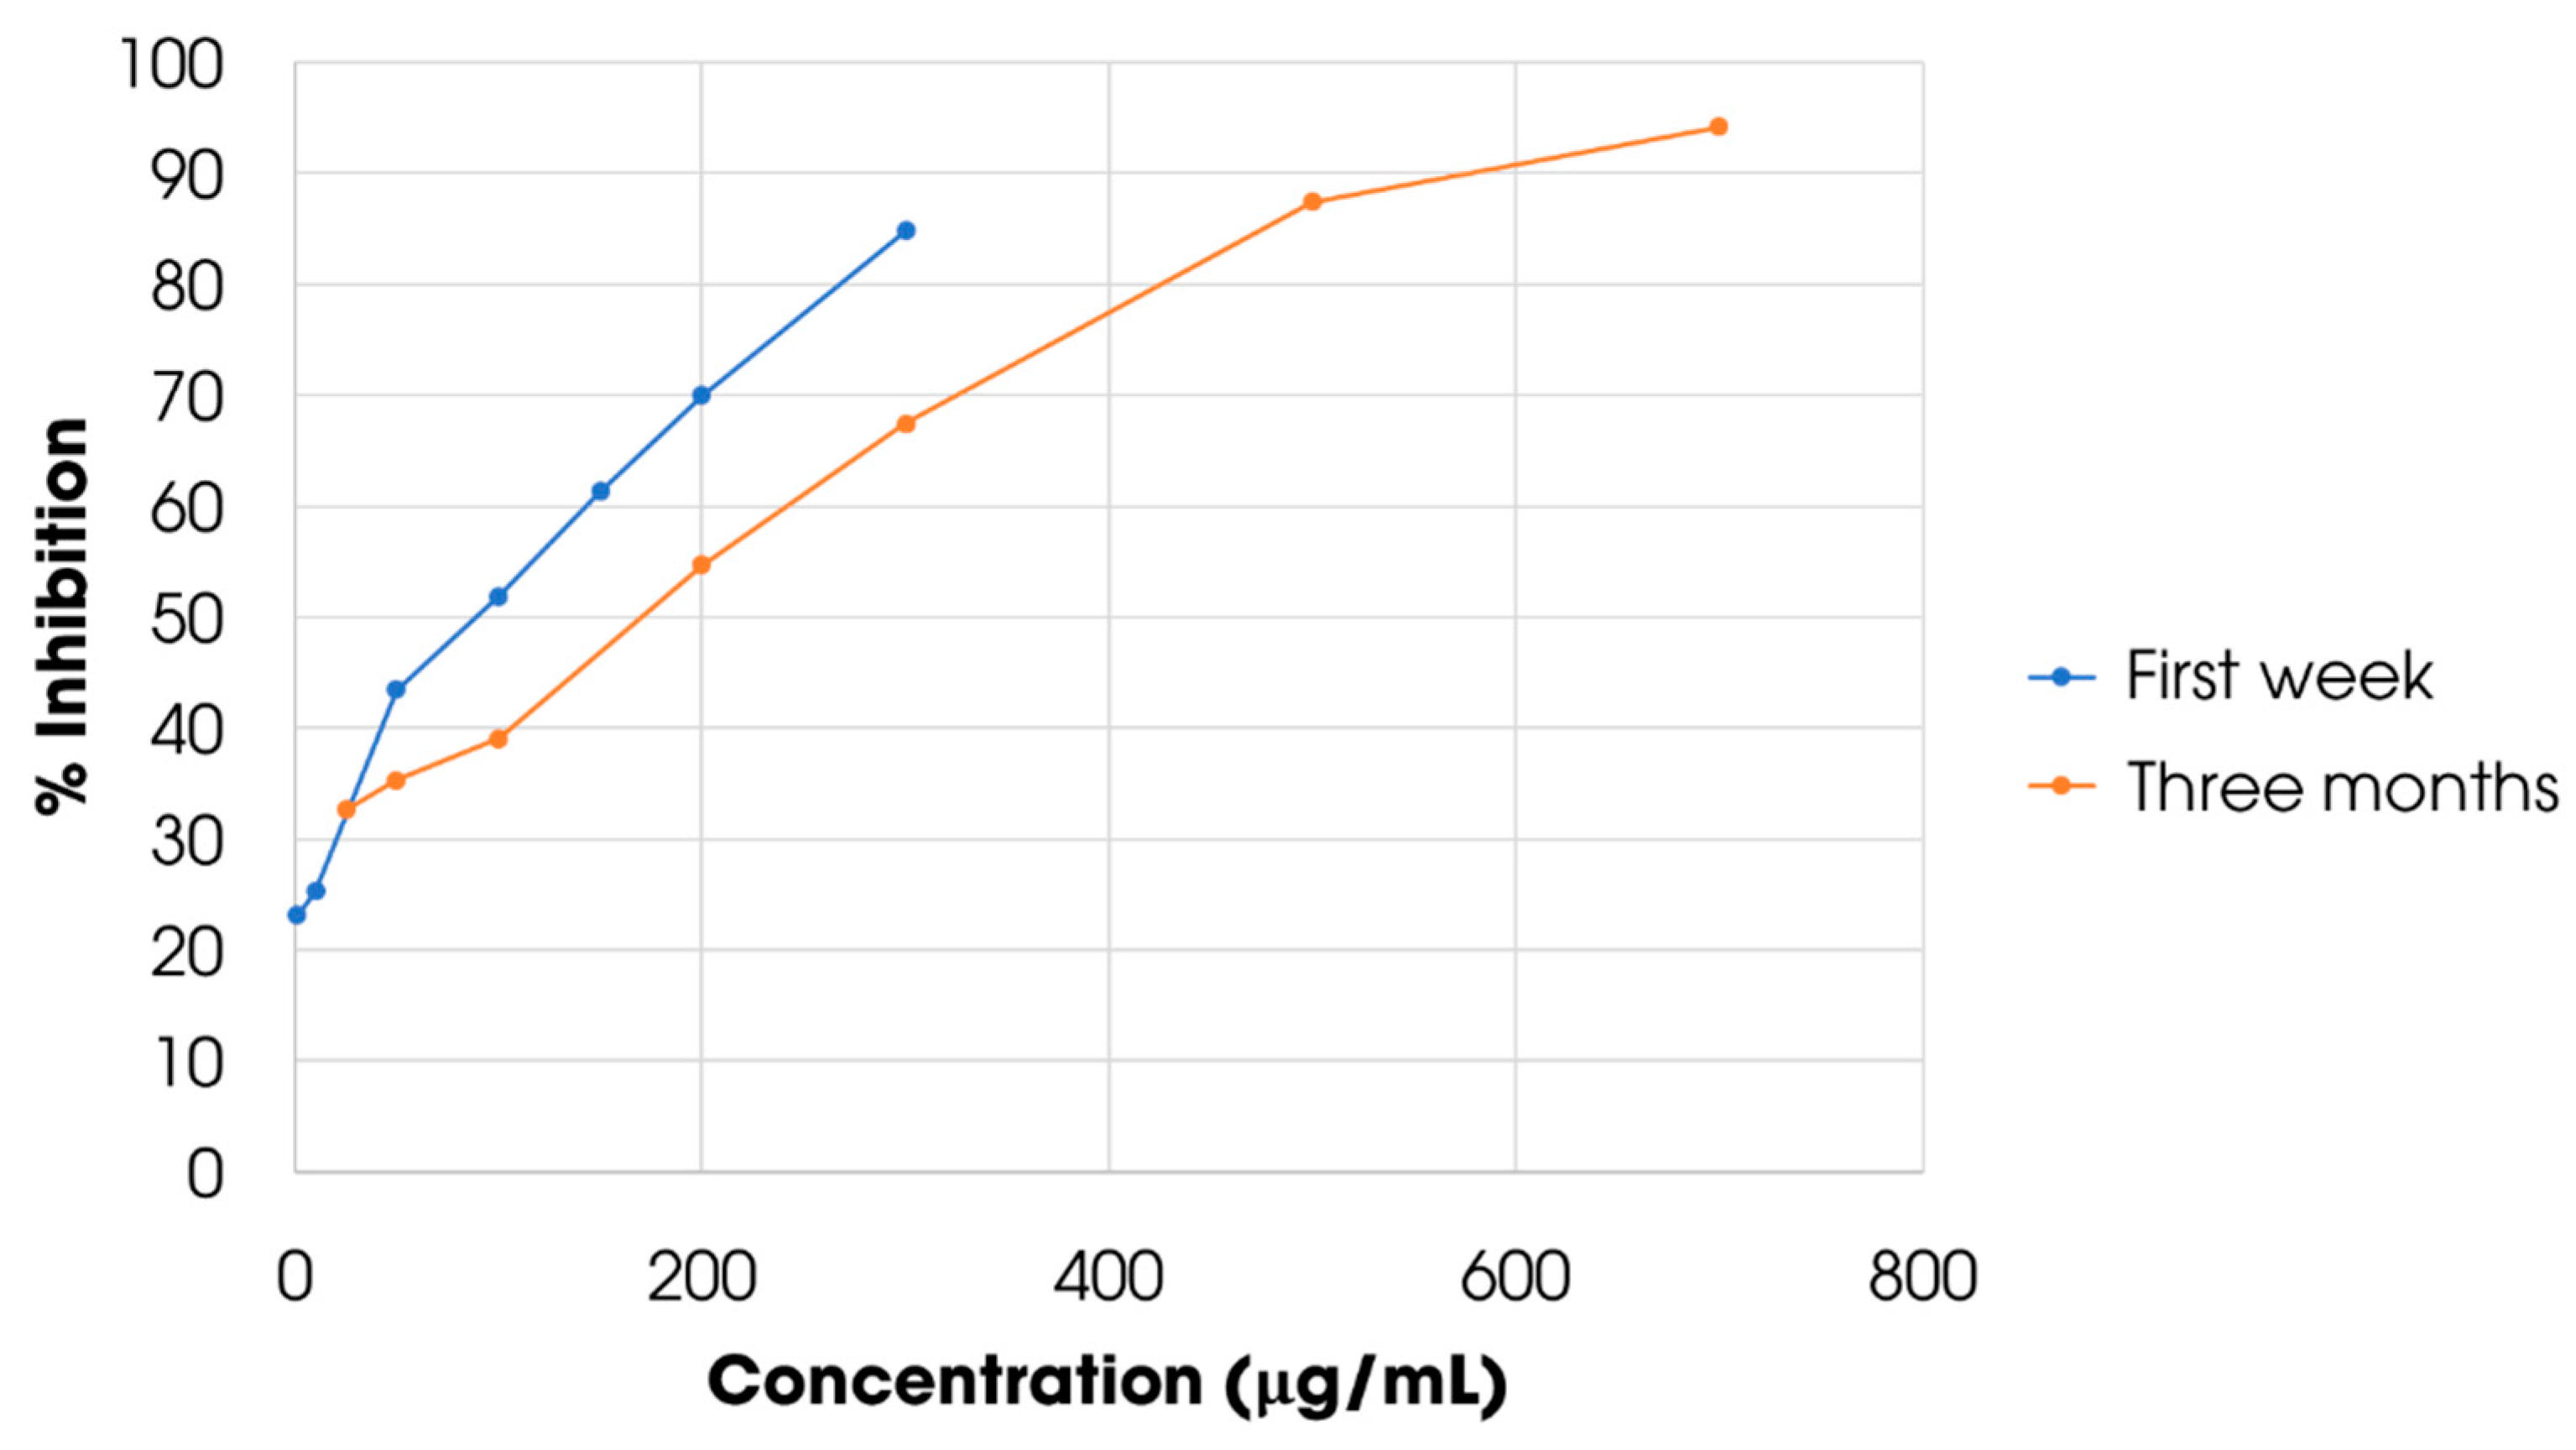
3.5. Stability and Antioxidant Evaluation of the Dried Extract from Carissa Carandas Fruit

To evaluate the color stability, anthocyanin content and polymerization of the dried extract over time, the aqueous extract obtained under optimized conditions was first stabilized with an appropriate amount of citric acid (Table 2). Following that, rotary evaporation took place under vacuum to yield the dried extract. Dried extracts were stored at room temperature (30 ± 2 °C) and warming condition (45 ± 1 °C). Before analysis, 0.05 g of dried extract was diluted with 10 mL of water. Since extract has high sugar content, it was difficult to completely dry the diluted extract. Therefore, contents of anthocyanin and polymeric anthocyanin in the initial week were standardized to 100% for comparison with the results of following weeks.
Figure 12 illustrated the visual change of the dried extracts and Figure 13 showed changes in ∆E. The extract at room temperature exhibited a negligible change in color over time. However, the color tends to be darker than the original. At 45 °C, all dried extracts showed considerable color change over the period. In addition, the degree of color change seemed to be proportional to citric acid concentration in samples in warm condition, as evidenced by higher ∆E of samples with high acid addition. In general, this experiment further confirmed the role of temperature and citric acid in preservation of color of the extract from Carissa carandas fruit.
Figure 14 demonstrated the rate of anthocyanin degradation over five weeks in dried extracts. It can be seen that rate of decomposition of anthocyanins of samples at 45 °C was significantly faster than samples in room temperature. In addition, the introduction of citric acid seemed to induce minimal changes in anthocyanin content.
In terms of polymeric anthocyanin content, after 4 weeks, dried extracts stored at room temperature were polymerized approximately 5 times faster than the dried extracts stored at 45 °C (Figure 15). In addition, it was revealed that polymerization percentages of dried extracts stored at warm temperature were higher than those of dried extracts at room temperature, suggesting that high temperature accelerated the polymerization of the extracts in accordance with van ’t Hoff laws and Arrheneus equation [21]. From the graph, it was also indicated that the effect of citric acid concentration was more striking in dried extracts stored at 45 °C than samples stored at room temperature.
Figure 16 shows DPPH inhibitory activity of dried extracts at the first week and after three months. At DPPH concentration of 1 μg/mL, the inhibition percentage was 23.16% for the extract at the first week. Further calculation from the data showed that the IC50 of the dried extract at the first week was 87.56 μg/mL. In comparison with IC50 of vitamin C (3 μg/mL) calculated from the same conditions and instruments, IC50 of the dried extract is approximately 29 times higher. After 3 months of storage at −18 °C, the dried extract exhibited an IC50 of 173.67 μg/mL, which is approximately 1.98 times higher than the IC50 measured at the at the first week. However, storage period of longer than 3 months did not induce any negligible change in IC50.

4. Conclusions

This study has attempted the solid–liquid extraction of anthocyanins from Carissa carandas fruits and evaluated the effect of different parameters on the total anthocyanin content via single-factor investigations. We found that the optimal total anthocyanin content was achieved with the following conditions; solvent of ethanol and water (ethanol/H2O) at the rate of 50/50, extraction temperature of 50 °C, extraction duration of 45 min, and solid/liquid ratio of 1:3 g/mL; the material of sliced, ripe fruits underwent two extraction cycles. These conditions corresponded to anthocyanin content of 277.2 mg/L, or 9.33 mg anthocyanin per gram of dry materials.
Both temperature and citric acid are contributing factors to color stability and total anthocyanin contents, albeit to different extents depending on the temperature and the type of the extract. At room temperature, the introduction of citric acid with the dose from 0 to 5 g/L into both aqueous solutions of the extract and dried extracts apparently induced no clear changes in color stability and anthocyanin content. However, for aqueous solutions of the extract stored at 45 °C, the addition of citric acid reduced discoloration and anthocyanin loss. Conversely, the addition of citric acid into dried extracts stored at 45 °C seemed to accelerate discoloration and induced no observable changes in anthocyanin content.
Regarding anthocyanin polymerization, while temperature obviously accelerated the polymerization, the addition of citric acid seemed to significantly diminish this impact. As a result, the addition of citric acid at 5 g/L into dried extracts and solutions of extracts stored at low temperature kept the polymeric anthocyanin content almost constant over 4 weeks. The dried extract obtained at optimum conditions also exhibited significant antioxidant activity (IC50 = 87.56 μg/mL) which persisted after three months of storage (IC50 = 173.67 μg/mL). In addition to implications to food industry in manufacture of natural pigments, the study results are expected to provide useful data for further development of storage techniques for anthocyanin preservation of agricultural products.

Author Contributions

Investigation, X.T.L., M.T.H., T.N.P., V.T.T., T.Q.T., and N.Q.T.; Supervision, L.G.B.; Writing—original draft, X.T.L.

Funding

This research received no external funding.

Acknowledgments

This research was funded by Nguyen Tat Thanh University, Ho Chi Minh City, Vietnam.

Conflicts of Interest

The authors declare no conflict of interest.

References

  1. Francisco, D.V.; Octavio, P.L. Natural colorants for food and nutraceutical uses, 1st ed.; CRC Press: Boca Raton, FL, USA, 2002. [Google Scholar]
  2. Gould, K.; Davies, K.M.; Winefield, C. Anthocyanins Biosynthesis, Functions, and Applications; Springer: New York, NY, USA, 2009. [Google Scholar]
  3. Hubbermann, E.M.; Heins, A.; Stockmann, H.; Schwarz, K. Influence of acids, salt, sugars and hydrocolloids on the colour stability of anthocyanin rich black currant and elderberry concentrates. Eur. Food Res. Technol. 2006, 223, 83–90. [Google Scholar] [CrossRef]
  4. Singh, A.; Uppal, G.K. A review on Carissa carandas: Phytochemistry, ethno-pharmacology, and micropropagation as conservation strategy. Asian. J. Pharm. Clin. Res. 2015, 8, 26–30. [Google Scholar]
  5. Ozela, E.F.; Stringheta, P.C.; Chauca, M.C. Stability of anthocyanin in spinach vine (Basella rubra A.) fruits. Cien. Inv. Agr. 2007, 34, 115–120. [Google Scholar]
  6. Francis, F.J. A new group of food colorants. Trends. Food Sci. Technol. 1992, 3, 27–30. [Google Scholar] [CrossRef]
  7. Chai, X.F.; Ding, P. Postharvest Quality and Antioxidant Activity of Karanda (Carissa carandas) Fruit. Acta. Hortic. 2013, 1012, 177–182. [Google Scholar] [CrossRef]
  8. Weerawatanakorn, M.; Pan, M.H. Phytochemical components of Carissa carandas and the inhibitory effects of fruit juice on inducible nitric oxide synthase and cyclooxygenase-2. J. Food Biochem. 2017, 41. [Google Scholar] [CrossRef]
  9. Djilali, A.B.; Besombes, C.; Allaf, K.; Nabiev, M. Technological aptitudes and pharmaceutical applications of schinus terebinthifolius raddi leaf and seed oil and fruit powders of Ziziphus jujuba mill. Phytothérapie 2018. [Google Scholar] [CrossRef]
  10. Egbuna, C.; Ifemeje, J.C.; Maduako, M.C.; Tijjani, H.; Udedi, S.C.; Nwaka, A.C.; Ifemeje, M.O. Phytochemical test methods: Qualitative, quantitative and proximate analysis. In Phytochemistry: Volume 1: Fundamentals, Modern Techniques, and Applications, 1st ed.; Egbuna, C., Ifemeje, J.C., Udedi, S.C., Kumar, S., Eds.; Apple Academic Press: New York, NY, USA, 2018. [Google Scholar]
  11. Zou, T.B.; Wang, M.; Gan, R.Y.; Ling, W.H. Optimization of ultrasound-assisted extraction of anthocyanins from mulberry, using response surface methodology. Int. J. Mol. Sci. 2011, 12, 3006–3017. [Google Scholar] [CrossRef] [PubMed]
  12. Maran, J.P.; Sivakumar, V.; Thirugnanasambandham, K.; Sridhar, R. Extraction of natural anthocyanin and colors from pulp of jamun fruit. J. Food Sci. Technol. 2014, 52, 3617–3626. [Google Scholar] [CrossRef] [PubMed]
  13. Yang, L.; Cao, Y.L.; Jiang, J.G.; Lin, Q.S.; Chen, J.; Zhu, L. Response surface optimization of ultrasound-assisted flavonoids extraction from the flower of Citrus aurantium L. var. amara Engl. J. Sep. Sci. 2010, 33, 1349–1355. [Google Scholar] [PubMed]
  14. Anuar, N.; Mohd, A.F.A.; Saat, N.; Aziz, N.; Mat, R.T. Optimization of extraction parameters by using response surface methodology, purification, and identification of anthocyanin pigments in melastoma malabathricum fruit. Sci. World J. 2013, 2013. [Google Scholar] [CrossRef] [PubMed]
  15. Barbour, M.E.; Parker, D.M.; Allen, G.C.; Jandt, K.D. Human enamel dissolution in citric acid as a function of pH in the range 2.30 ≤ pH ≤ 6.30—A nanoindentation study. Eur. J. Oral. Sci. 2003, 111, 258–262. [Google Scholar] [CrossRef] [PubMed]
  16. Braca, A.; Sortino, C.; Politi, M.; Morelli, I.; Mendez, J. Antioxidant activity of flavonoids from Licania licaniaeflora. J. Ethnopharmacol. 2002, 79, 379–381. [Google Scholar] [CrossRef]
  17. Wrolstad, R.E.; Durst, R.W.; Lee, J. Tracking color and pigment changes in anthocyanin products. Trends Food Sci. Technol. 2005, 16, 423–428. [Google Scholar] [CrossRef]
  18. Giusti, M.M.; Wrolstad, R.E. Characterization and measurement of anthocyanins by UV-visible spectroscopy. Curr. Protoc. Food Anal. Chem. 2001, 00, F1.2.1–F1.2.13. [Google Scholar] [CrossRef]
  19. Harborne, J.B. Spectral methods of characterizing anthocyanins. Biochem. J. 1958, 70, 22–28. [Google Scholar] [CrossRef] [PubMed]
  20. He, F.; Liang, N.N.; Mu, L.; Pan, Q.H.; Wang, J.; Reeves, M.J.; Duan, C.Q. Anthocyanins and their variation in red wines ii. anthocyanin derived pigments and their color evolution. Molecules 2012, 17, 1483–1519. [Google Scholar] [CrossRef] [PubMed]
  21. Danışman, G.; Arslan, E.; Toklucu, A.K. Kinetic analysis of anthocyanin degradation and polymeric colour formation in grape juice during heating. Czech. J. Food Sci. 2016, 33, 103–108. [Google Scholar] [CrossRef] [Green Version]
Figure 1. Maximum absorption wavelength in different pH environments.
Processes 07 00468 g001
Figure 2. Extraction yields under different solvent concentrations.
Processes 07 00468 g002
Figure 3. Extraction yields under different solid–liquid ratios.
Processes 07 00468 g003
Figure 4. Extraction yields under different temperatures.
Processes 07 00468 g004
Figure 5. Extraction yields under different extraction durations.
Processes 07 00468 g005
Figure 6. Visual color of the Carissa carandas fruit at different ripeness levels and extraction yields.
Processes 07 00468 g006
Figure 7. Extraction yields of fruits with relation to extraction cycles and material sizes.
Processes 07 00468 g007
Figure 8. The transformation of color of the five aqueous solutions of the fruit extract in different conditions over time: (a) at initial stage, (b) after 4 weeks at room temperature (A), and after 4 weeks at 45 °C (B).
Processes 07 00468 g008
Figure 9. The time-varying color of aqueous solutions of the extract at room temperature and at 45 °C.
Processes 07 00468 g009
Figure 10. Anthocyanin content of aqueous solutions of extracts over time of color at room temperature and at 45 °C.
Processes 07 00468 g010
Figure 11. The polymeric anthocyanin content was at room temperature and at 45 °C.
Processes 07 00468 g011
Figure 12. The change of color of the dried extract from Carissa carandas fruit (a) at the initial week, (b) after 4 weeks at room temperature (A), and after 4 weeks at 45 °C (B).
Processes 07 00468 g012
Figure 13. The change of color of the different dried extracts at room temperature and at 45 °C.
Processes 07 00468 g013
Figure 14. The change of anthocyanin content of the different dried extracts at room temperature and at 45 °C.
Processes 07 00468 g014
Figure 15. The rate of polymerization of the different dried extracts at room temperature and at 45 °C.
Processes 07 00468 g015
Figure 16. Inhibitory activity to DPPH oxidation of the dried extracts.
Processes 07 00468 g016
Table 1. pH of the aqueous solutions of the Carissa carandas extract stabilized by citric acid.
SampleSample 0Sample 1Sample 2Sample 3Sample 4Sample 5
m Citric acid (g/L)012345
pH3.252.832.662.572.442.39
Table 2. pH level of the extraction without solvent is stabilized by citric acid.
SampleSample 0Sample 1Sample 2Sample 3Sample 4Sample 5
m Citric acid (g/L)012345
pH3.913.713.63.523.43.31

