Article

Online Operation Risk Assessment of the Wind Power System of the Convolution Neural Network (CNN) Considering Multiple Random Factors

School of Electrical Engineering and Automation, Wuhan University, Wuhan 430072, China
*
Author to whom correspondence should be addressed.
Processes 2019, 7(7), 464; https://doi.org/10.3390/pr7070464
Submission received: 15 June 2019 / Revised: 15 July 2019 / Accepted: 16 July 2019 / Published: 19 July 2019
(This article belongs to the Special Issue Neural Computation and Applications for Sustainable Energy Systems)

Abstract

:
In order to solve the problem of the inaccuracy of the traditional online operation risk assessment model based on a physical mechanism and the inability to adapt to the actual operation of massive online operation monitoring data, this paper proposes an online operation risk assessment of the wind power system of the convolution neural network (CNN) considering multiple random factors. This paper analyzes multiple random factors of the wind power system, including uncertain wind power output, load fluctuations, frequent changes in operation patterns, and the electrical equipment failure rate, and generates the sample data based on multi-random factors. It uses the CNN algorithm network, offline training to obtain the risk assessment model, and online application to obtain the real-time online operation risk state of the wind power system. Finally, the online operation risk assessment model is verified by simulation using the standard network of 39 nodes of 10 machines New England system. The results prove that the risk assessment model presented in this paper is more rapid and suitable for online application.

1. Introduction

With the development of wind power and the pace of power grid construction, the scale of the power grid is constantly expanding, the structure of the power grid is becoming increasingly complex, and various kinds of uncertainties and their influences on the power grid are constantly expanding. At present, China’s power grid is under a heavy load, new energy generation is diversified, and the operation system will face greater potential risks, especially new challenges in scheduling, operation, and overhaul. It is of great theoretical and practical significance to formulate an efficient and fast online wind power system risk assessment method.
The wind power system recognizes the importance of assessing risks in online operations of the power system [1,2]. A series of online monitoring systems are installed in the modern wind power system to collect the corresponding equipment online data for the power grid dispatching operators to master the real-time state of the power system and assess the real-time risk of the system. Through experience of the online operation risk assessment of wind power system, it has been found that the current online operation risk assessment method has the following outstanding deficiencies:
(1)
The online operation risk assessment model of the wind power system is relatively simple and less random factors are considered, which makes the online operation risk assessment results inaccurate. Some online operation risk assessment models of the wind power system take into account many factors, but because of the complex structure of the actual wind power system, it is extremely difficult to establish a physical model for online operation risk assessment. Even if the online operation risk assessment model is successfully established, the physical model is extremely ineffective in the actual online operation risk assessment application due to the simplified processing during the model establishment process and this reduces the accuracy of the model. How to consider the multi-random factors in the evaluation model and adapt to the online application without simplification has become a research difficulty in the online operation risk assessment of wind power systems;
(2)
The online running risk assessment requires a large amount of calculation and a slow calculation speed, which does not meet the requirements of online running in real-time. The main reason for this result is the huge dimension of the risk assessment calculation model established using online monitoring data, resulting in a surge in calculations and “data dimension explosion”. It takes a lot of time to calculate the risk assessment results. Until the risk assessment results, the system, and the next scheduling cycle are calculated, the risk assessment results lose their significance in terms of time.
Some scholars and experts have conducted research in this area, such as [3], in which Feng et al. propose an online risk index of power-system static voltage security. However, the disadvantage is the low accuracy of calculation. In [4], Zhang put forward a control strategy and method to improve the safety and reliability of the distribution network operation. The risk value corresponding to the current operating state of the transmission line directly affects the safe operating level of the entire system [5,6]. Risk assessment studies are mostly focused on the construction of physical models, but inherent shortcomings of physical models still exist. In [7,8,9], Wang, Khan, and Du et al. present a real-time video face recognition method based on the convolution neural network (CNN) and a large number of typical fault case descriptive text data accumulated in the information work of power grid companies have been extracted from the fault case by means of text mining technology. Lv’s study [10] adopts the target detection model based on the deep learning method in the built intelligent detection system to prevent external force damage, improves the network structure, increases the number of network layers, and enhances the ability to identify targets. In Niu and Cui’s work [11,12], historical wind power data from wind farms and numerical weather forecast data such as wind speed and wind direction are used as the input, and the convolution neural network (CNN) is integrated on the basis of the traditional gate controlled circulation unit neural network to improve the ability to extract raw data and reduce the dimensions. Introduction of the dropout calculation is also employed to reduce the phenomenon of over fitting. In [13,14], Shi and Wang et al. describe the use of the CNN algorithm in the detection of unmanned aerial vehicle (UAV) power line inspection image components, and verify the approach with the actual sampled power component inspection data. In [15], Huang et al. introduce and compare the deep learning models of the regional convolution neural network, fast regional neural network, and faster neural network 3 for target recognition. CNN’s advantages are obvious. It has begun to be widely used in forecasting, model identification, and fault identification in power systems, but it is also relatively less used for the online risk assessment of wind power systems.
In response to the above problems, this paper proposes the convolution neural network (CNN) online operation risk assessment model considering multiple random factors in the wind power system. This article makes the following contributions:
(1)
The online operation risk assessment model of the wind power system takes multiple random factors into account, such as uncertain wind power output, load fluctuations, frequent changes in operation patterns, and failure rates. These random factors did not use simplified processing in the establishment of the evaluation model, but used the collected data to ensure the accuracy of the online application of the operation risk assessment model;
(2)
The online operation risk assessment model of the wind power system uses convolution neural networks (CNN) for training implementation. The establishment of this assessment model is implemented in a data-driven manner instead of the traditional physical assessment model, thus avoiding the process of establishing a complex physical assessment model and avoiding the simplification of multiple random factors. The original information of multiple random factors is preserved to ensure the accuracy of the model. The online operation risk assessment model of the wind power system presented in this paper adopts the CNN method, offline training sample data, and an online application training model, which greatly reduces the time of online operation risk assessment of the wind power system and makes the online application of the model more adaptable.
The rest of this paper is organized as follows: In Section 2, we analyze four random factors of the online operation risk assessment wind system and expected targets of online operation risk assessment, for which the four random factors are uncertain wind power output, load fluctuations, frequent changes in operation patterns, and electrical equipment time-varying failure rate. In Section 3, we discuss the deep convolutional neural network (CNN) methodology. In Section 4, we discuss the online operation risk assessment of the wind power system of the CNN considering multiple random factors. The principles and details from the overall assessment of the block diagram to the composition of the block diagram are described in Section 4. In Section 5, we give the online operation risk assessment process. In Section 6, we introduce the case study results. Finally, in Section 7, we present our conclusions and future work.

2. Analysis of Multiple Random Factors of Online Risk Assessment of the Wind Power System

The online operation risk assessment of the wind power system studied in this paper belongs to the risk assessment of a steady state category and does not involve the risk assessment of a transient category. In the wind power system, there are many factors that affect the online operation risk assessment. The main ones are the following four random factors: Uncertain wind power output, load fluctuations, frequent changes in operation patterns, and electrical equipment time-varying failure rate. The specific analysis of each random factor in multiple random factors is as follows.

2.1. Uncertain Wind Power Output

Uncertainty of the wind power output is one of the main reasons causing the online operation risk of the wind power system. Following this, a wind farm output curve connected to the power system is analyzed, and the uncertainty of the wind power output is observed and analyzed. The wind farm output curve is shown in Figure 1.
Figure 1 shows the wind power output curve of 24 h for one day of a wind farm. It can be seen from the figure that there is no fixed law of output at each dispatch time, and the wind power output changes frequently between dispatch times. The wind power output shows obvious uncertainty characteristics. The size of the wind power output is related to the effective wind energy captured by the fan. The effective wind energy determines the size of the wind power output, the variability of the wind speed and direction, the diversity of the location of the wind generator installation, and the influence of the landform on wind energy. These factors cause uncertainty of effective wind energy, and thus of the wind power output. Therefore, the online operation risk assessment of the wind power system must consider the uncertainty of the wind power output.

2.2. Load Fluctuations

Load fluctuation is an important variable that affects the state of the power system and is also one of the important random factors in the online operation risk assessment of the wind power system. Following this, the load output curve of a load node is analyzed, and fluctuation of the load output is observed and analyzed. The load output curve is shown in Figure 2.
Figure 2 shows the load output curve of 96 dispatch points on one day of a load node. It can be seen from the figure that the load output curve is not smooth, and the load output changes many times, indicating that the load output fluctuation of the load node is frequent and obvious. There are many reasons for load fluctuations, including residents’ living habits, industrial power hours, motor starting and stopping methods, air-conditioning/heating use, and other reasons that directly affect the load output and result in fluctuations of the load output. Fluctuation of the load requires adjustment of the power supply output to keep it balanced. The power supply includes the power supply of the conventional unit and the power supply of the wind unit. Therefore, load fluctuation is also a random factor that cannot be ignored in the online operation risk assessment of wind power systems.

2.3. Frequent Changes in Operation Patterns

The frequent changes in operation patterns refer to frequent changes in the topology of wind power systems. This section only analyzes the topology changes caused by planned maintenance and the topology changes caused by unplanned failures in the next section of electrical equipment time-varying failure rate. The following analysis of the grid network topology of a wind power system is shown in Figure 3.
In Figure 3, the circle represents the injected power nodes. The injected power node includes the power access node and the load access node. The power value of the power access node is positive and the power value of the load access node is negative. The straight line represents the branch road in the grid structure, the solid straight line represents the actual branch line, and the virtual straight line represents the branch road of the planned maintenance, which means that the branch road that needs to be disconnected from the wind power system causes the topology of the grid to change. In the wind power system, there are many planned maintenance events, the number of branch strips for each planned maintenance event is different, and the branch positions for maintenance are different, resulting in frequent changes in the topology of the grid and frequent changes in the operation patterns of the wind power system. Unplanned electrical equipment failure can also cause fault branches to be disconnected from the wind power system, which in turn changes the topology of the wind power system grid. This situation is analyzed in the following section. When the operation pattern is changing, the virtual straight line will disconnect from the network and the structure of the network topology will be changed.

2.4. Electrical Equipment Time-Varying Failure Rate

In this paper, the electrical equipment fault is considered to be the branch where the electrical equipment is located due to the fault and is disconnected from the system network. The fault of electrical equipment leads to a change of the network structure of the wind power system. Meanwhile, the time-varying failure rate of electrical equipment also affects the probability of risk events in the online operation risk assessment, especially for outdoor electrical equipment, where it is more obvious. The working environment of outdoor electrical equipment is exposed to air. In severe weather conditions such as storms, heavy rain, lightning, and blizzards, the failure rate of electrical equipment is significantly higher, and in normal weather conditions, the failure rate of electrical equipment is not high. The real-time change of the working environment of electrical equipment directly affects the time variability of the equipment failure rate. Electrical equipment time-varying failure rate is an important random factor that affects the online operation risk assessment of the wind power system.

2.5. Expected Targets of Online Operation Risk Assessment

In this paper, the risk assessment of the online operation mainly evaluates the risk of the loss of load, whilst other operation risk events are not within the scope of this study. The risk assessment of online operation has three important parameters: Risk event probability, risk event severity, and risk event risk value. These three parameters are described in detail below.
(1) Risk Event Probability
The risk event of the loss of load is considered in the online operation risk assessment of the article. Calculating the probability of risk events requires information about both electrical equipment failure and the power system grid structure. The topology of the power network is constantly changing, and the change of power network topology is the main reason for the change of the load of loss probability.
The main reasons for the change of the topology structure of the power network are scheduled maintenance and unplanned electrical equipment failure. Both planned maintenance and unplanned electrical equipment failure can cause transmission lines to be disconnected. Therefore, once the lines for maintenance and electrical equipment failure are determined, the failure rate of the corresponding lines is always 1 (indicating that the corresponding line must be disconnected during maintenance and electrical equipment failure). The specific mathematical expressions are as follows.
The branch failure rate r is:
r = [ r 1 , , r k , , r b ] 1 × b ,
where rk is the failure rate of electric equipment in the kth branch and b represents the number of branches.
If the ith branch is scheduled for planned maintenance and the jth branch is scheduled for unplanned electrical equipment failure, the corresponding branch failure rate is:
{ r i = 1 P l a n n e d M a int e n a n c e r j = 1 U n p l a n n e d    F a i l u r e .
After determining the maintenance branch and the electrical equipment fault branch, the failure rate of load loss is:
Pr i = j i r i j ,
where Pri is the probability of ith node load loss; rij is the electrical equipment failure rate in the branch between node i and node j; and ji indicates that node j is directly connected to node i.
(2) Risk Event Severity
The severity of the load loss risk event in this paper is the difference between the input power of the connecting wind power unit, the conventional unit, and the load power received by the node. The difference is greater than 0, which means that the node loses power; a difference of less than 0 means that the node loses its load.
The severity of the load loss risk event can be expressed as:
S i = P w i + P G i P L i { S i > 0 L o s s o f P o w e r S i < 0 L o s s o f L o a d
where Si is the severity of the ith node load loss event; Pwi is the wind farm output of the ith node; PGi is the access generator (including wind power units and conventional units) capacity of the ith node; and PLi is the access load capacity of the ith node.
(3) Risk Event Risk Value
The risk value of the load loss risk event can be expressed as:
R i s k i = P r i × S i ,
where Riski is the risk value of the ith node load loss event; Pri is the probability of the ith node load loss event; and Si is the severity of the ith node load loss event.
In order to intuitively reflect the online operation risk, it is customary to convert the assessed risk value into a risk level, and the risk level is more convenient for online operation risk assessment applications. In order to establish the evaluation standard of a load-loss risk event in online operation risk, the load-loss rate of the node is introduced.
The node load-loss rate is defined as:
{ S i > 0 K i = R i s k i P w i + P G i S i < 0 K i = | R i s k i | P L i ,
where Ki is the ith node load loss ratio.
The online operation risk rating standard refers to the “Classification Standard for Power Safety Accidents” and is specifically divided into the groups presented in Table 1.

3. Deep Convolutional Neural Network (CNN) Methodology

The deep convolution neural network (CNN) is a special deep learning artificial neural network consisting of an input layer (l), a convolution layer (C), a sampling layer (S), a fully connected layer (F), and an output layer (O). The convolution layer and the sampling layer alternate, and the output of the upper layer are the input of the next layer, finally forming the one-dimensional fully connected network [16]. The CNN structure is shown in Figure 4.

3.1. Convolution Layer

The convolution layer can be composed of multiple feature maps. The input is connected to the previous layer through the convolution core. Each neuron is partially connected to multiple characteristic charts of the upper layer. The convolution core corresponding to each neuron is different, ensuring that the feature is fully extracted [17]. Its output is:
U o l = f ( i M X i l 1 K i l + B l ) ,
where Uol is the output of the convolution layer l; Xil−1 is the input of the convolution layer l; Kil is the corresponding convolution core; M is the input subset of the convolution layer l; f(.) is an activation function; Bl is plus offset; and “*” is the convolution symbol.

3.2. Sampling Layer

Each feature matrix of the S layer of the sampling layer corresponds to the C layer of the convolution layer one by one. Using local correlation, the characteristic diagram of the convolution layer is sampled and reduced in dimension. It can reduce the amount of data processing while retaining useful information [18]. The output is:
U o l = f ( β l f d o w n ( X i l 1 ) + B l ) ,
where Uol is the output of the sampling layer l; f(.) is an activation function; βl is the weight coefficient of the sampling layer S; fdown(.) represents a sampling function; Xil−1 represents the input feature diagram of the sampling layer l; and Bl is the bias of the sampling layer.

3.3. Fully Connected Layer

The neurons of the fully connected F layer in the CNN are all connected to the neurons of the upper layer. The two-dimensional feature diagram is spliced into a one-dimensional feature as the input of the fully connected network. The output is:
U o l = f ( w l X i l 1 + B l ) ,
where Uol is the output of the fully connected layer; wl is the weight coefficient; and Bl is the layer bias.

3.4. Output Layer

The output layer consists of the Euclidean radial basis function (ERBF) unit. The farther the input is from the parameter vector, the larger the ERBF output can be understood as a penalty item [19] that measures the degree of match between the input mode and a model associated with the ERBF class.
The loss function in the CNN is used to measure our dissatisfaction with the results. It can be expressed as a cross-entropy function:
H = 1 N i = 1 N y i log 2 ( y i ^ ) ,
where yi is the actual value of the first label corresponding to the training set and y i ^ is the predicted value of the first label corresponding to the CNN training set.
CNN reverse propagation is based on the gradient descent method, so that the initial network parameters are adjusted in the direction of small error, and the accuracy of the classification is continuously improved.

4. Online Operation Risk Assessment of the Wind Power System of the CNN

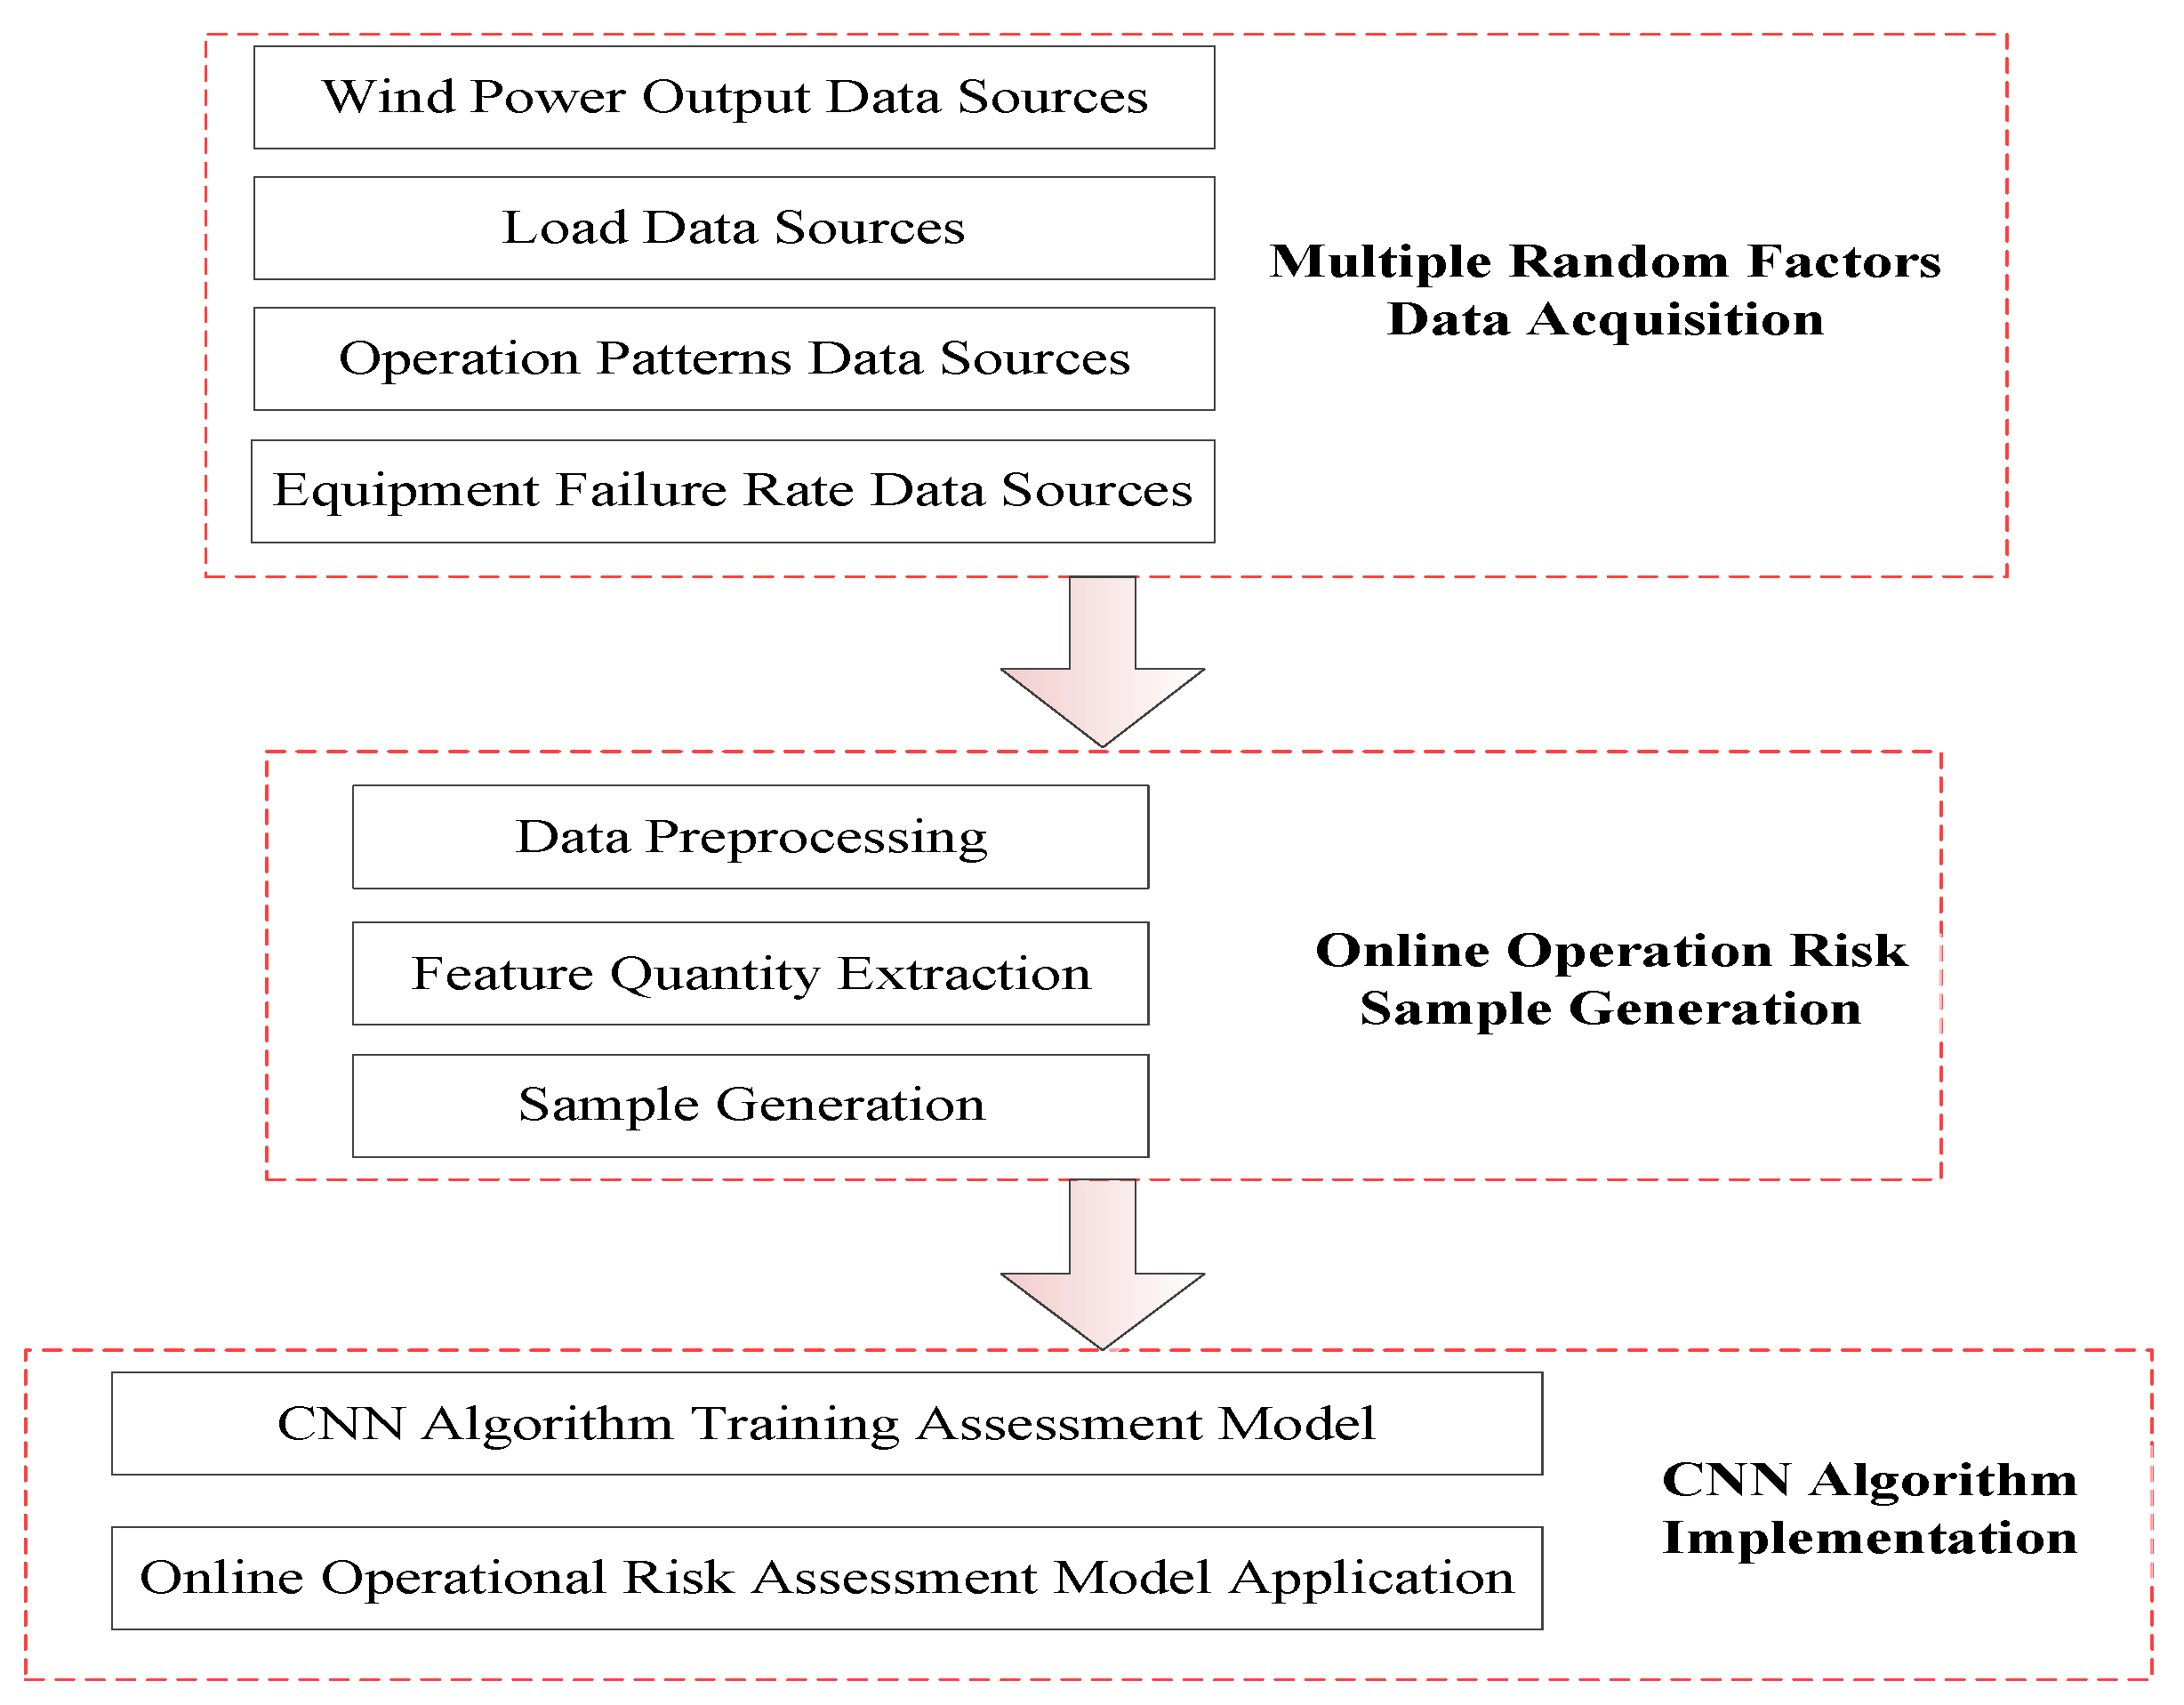
In this section, we discuss the whole process of the online operation risk assessment of the wind power system of the CNN considering multiple random factors in detail. The core of the methodological model proposed in this paper is the training simulation and application of the convolution neural network. Therefore, the whole process of online operation risk assessment of the wind power system is introduced by reference to the entire process of the training simulation and application of the CNN. Firstly, we introduce the general framework process of online operation risk assessment. Then, the substructure of the general framework is described and constructed in detail. The specific details are as follows.

4.1. General Framework Process

The general framework process of the online operation risk assessment of wind power systems of the convolution neural network considering multiple random factors is shown in Figure 4.
In Figure 5, from the general framework process, it can be seen that the process of the online operation risk assessment of the wind power system of the CNN is mainly divided into three processes: (1) Multiple random factors data acquisition, which is conducted by obtaining the corresponding massive data from the online operation database of multiple random factors, such as wind power output data, load data, operation pattern data, and equipment failure rate data. These acquired data form data drivers. (2) Online operation risk sample generation, in which, after obtaining the data, the data are simply preprocessed, and the characteristic amount is extracted. Finally, according to the principle of online operation risk sample generation, the sample data that can be used for CNN training simulation is generated; and (3) the CNN algorithm is implemented. In this step, the network structure of the CNN algorithm is designed, and the online operation sample data is used for offline training simulation to obtain the best online operation risk assessment model of the wind power system. The risk assessment model of offline training is applied to real-time online data to realize a real-time evaluation of the online operation risk of the wind power system. The specific process is as follows.

4.2. Multiple Random Factors Data Acquisition

The multiple random factors data acquisition of this paper employed for the online operation risk assessment of wind power systems mainly comes from the following three databases: Online Wind Power System, SCADA System, and Electrical Equipment History Fault Information Database, as shown in Figure 6.
In Figure 6, online operation of the wind power system database can obtain the real-time wind power output. The SCADA system database can obtain (1) real-time power supply output data on the power supply side, (2) real-time load fluctuation data on the load side, and (3) network grid structure and telemetry data, and (4) other switching equipment operation data. The data of the component level failure rate of electrical equipment can be obtained by the historical fault information database of electrical equipment. The data obtained is shown in the “Data Display”, for which the data is the online operation risk assessment of the wind power system. The above data constructs the data driver source for the online operation risk assessment.

4.3. Online Operation Risk Sample Generation

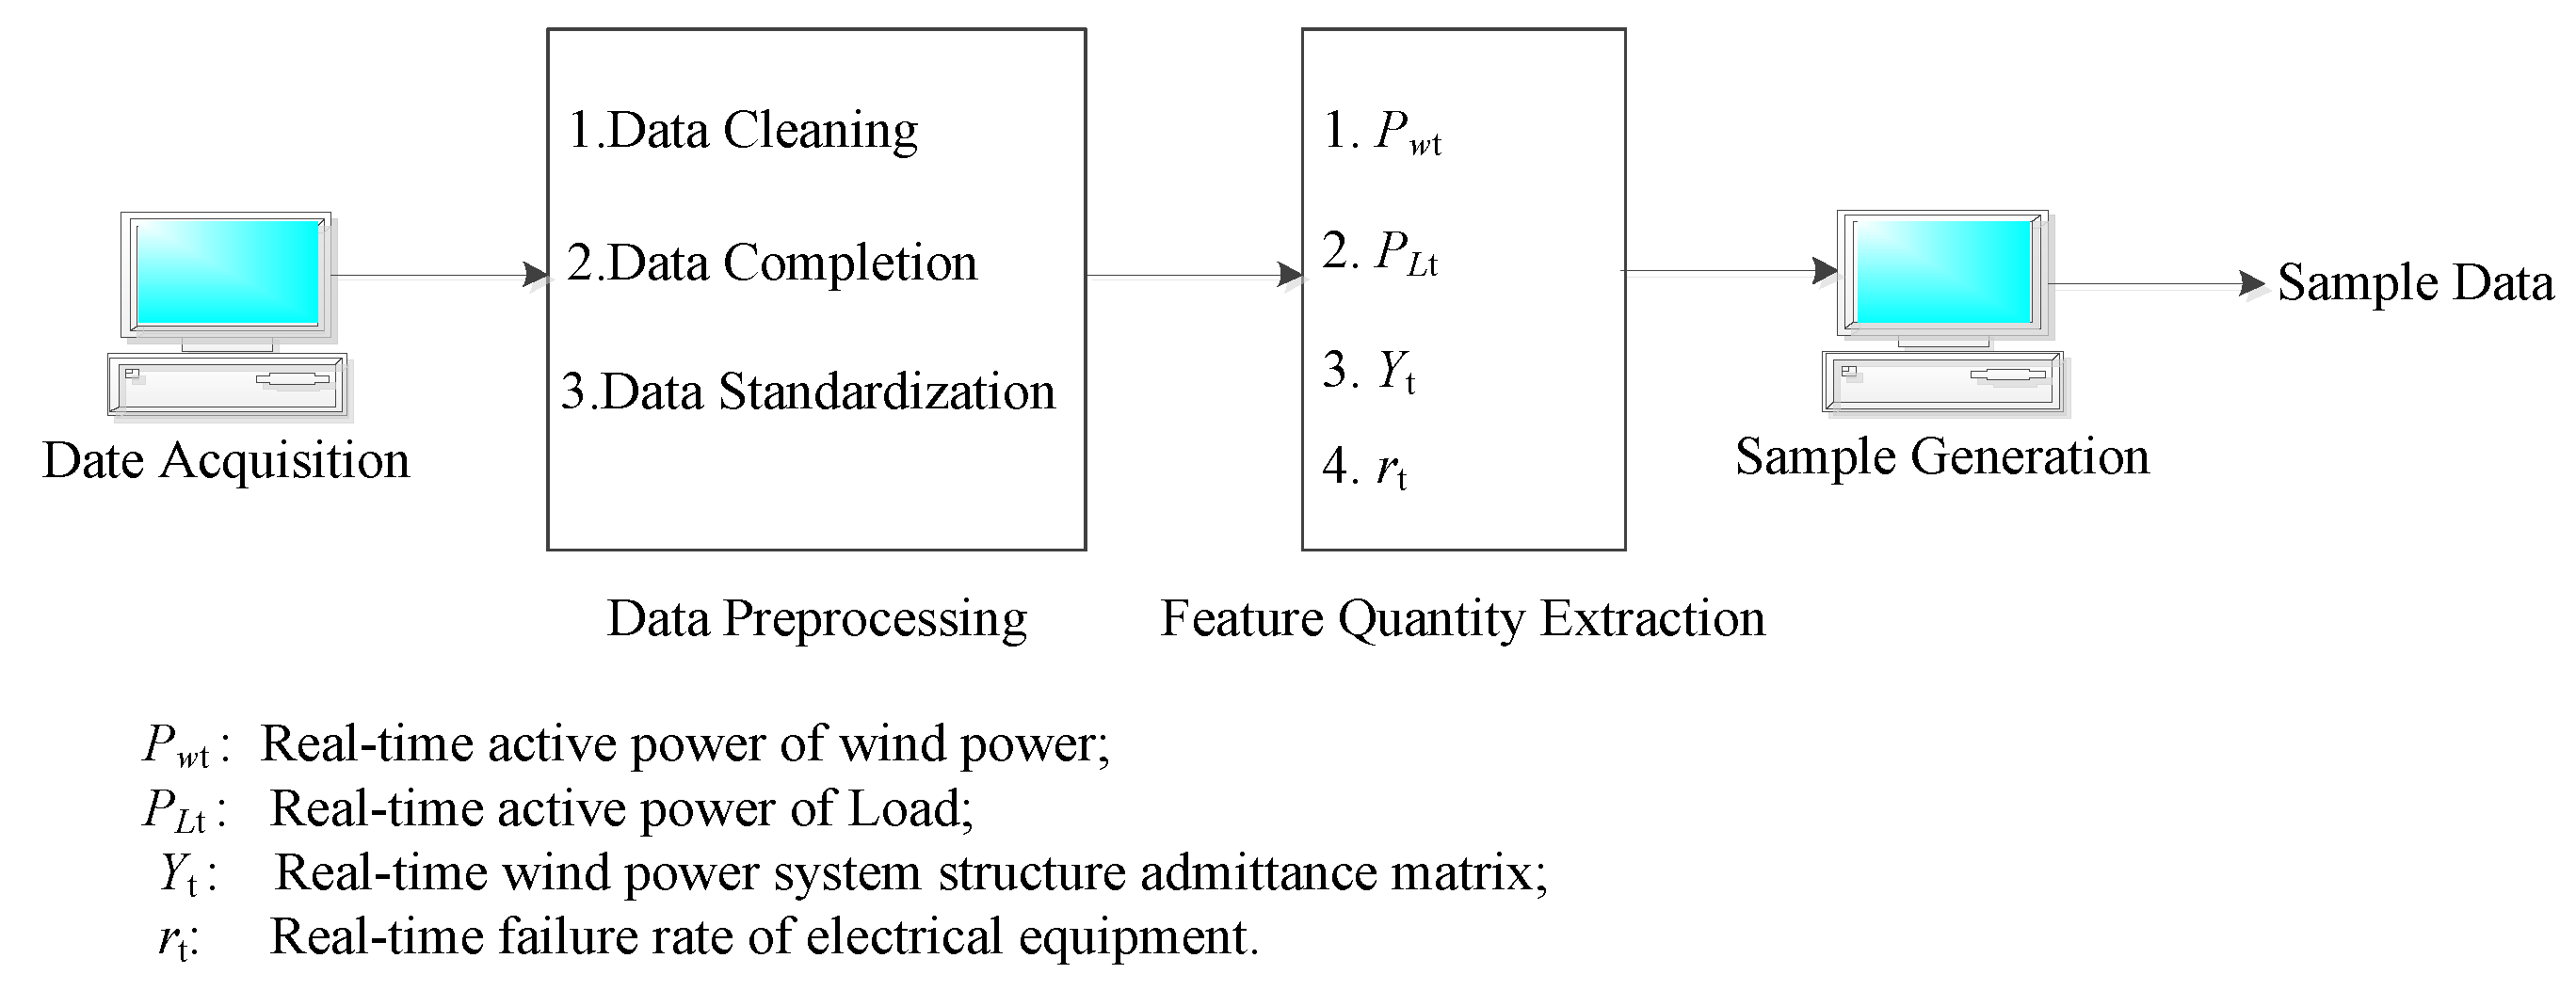
For the data obtained from the data, two steps are used to generate sample data through data preprocessing and feature extraction. The details are shown in Figure 6.
In Figure 7, data preprocessing includes three main steps: (1) Data cleaning, in, which the acquired data is cleaned, and some obviously erroneous data are removed. For example, the data are displayed as “# # # #” and washed directly. (2) Data are made complementary data. In order to ensure the consistency of data dimensions, data that are not monitored or lost need to be supplemented. This paper adopts the mean complement method, that is, the average value of the sum of the previous moment data and the latter moment data, as the method of data at this moment. If the data is xt-1 at the first moment and xt+1 at the last moment, the data at the moment is xt = 0.5*(xt−1 + xt+1). (3) Data are standardized. In order to unify the electrical equipment with a different capacity and to unify the electrical quantity, all electrical quantity is treated by a standard unit value.
In 
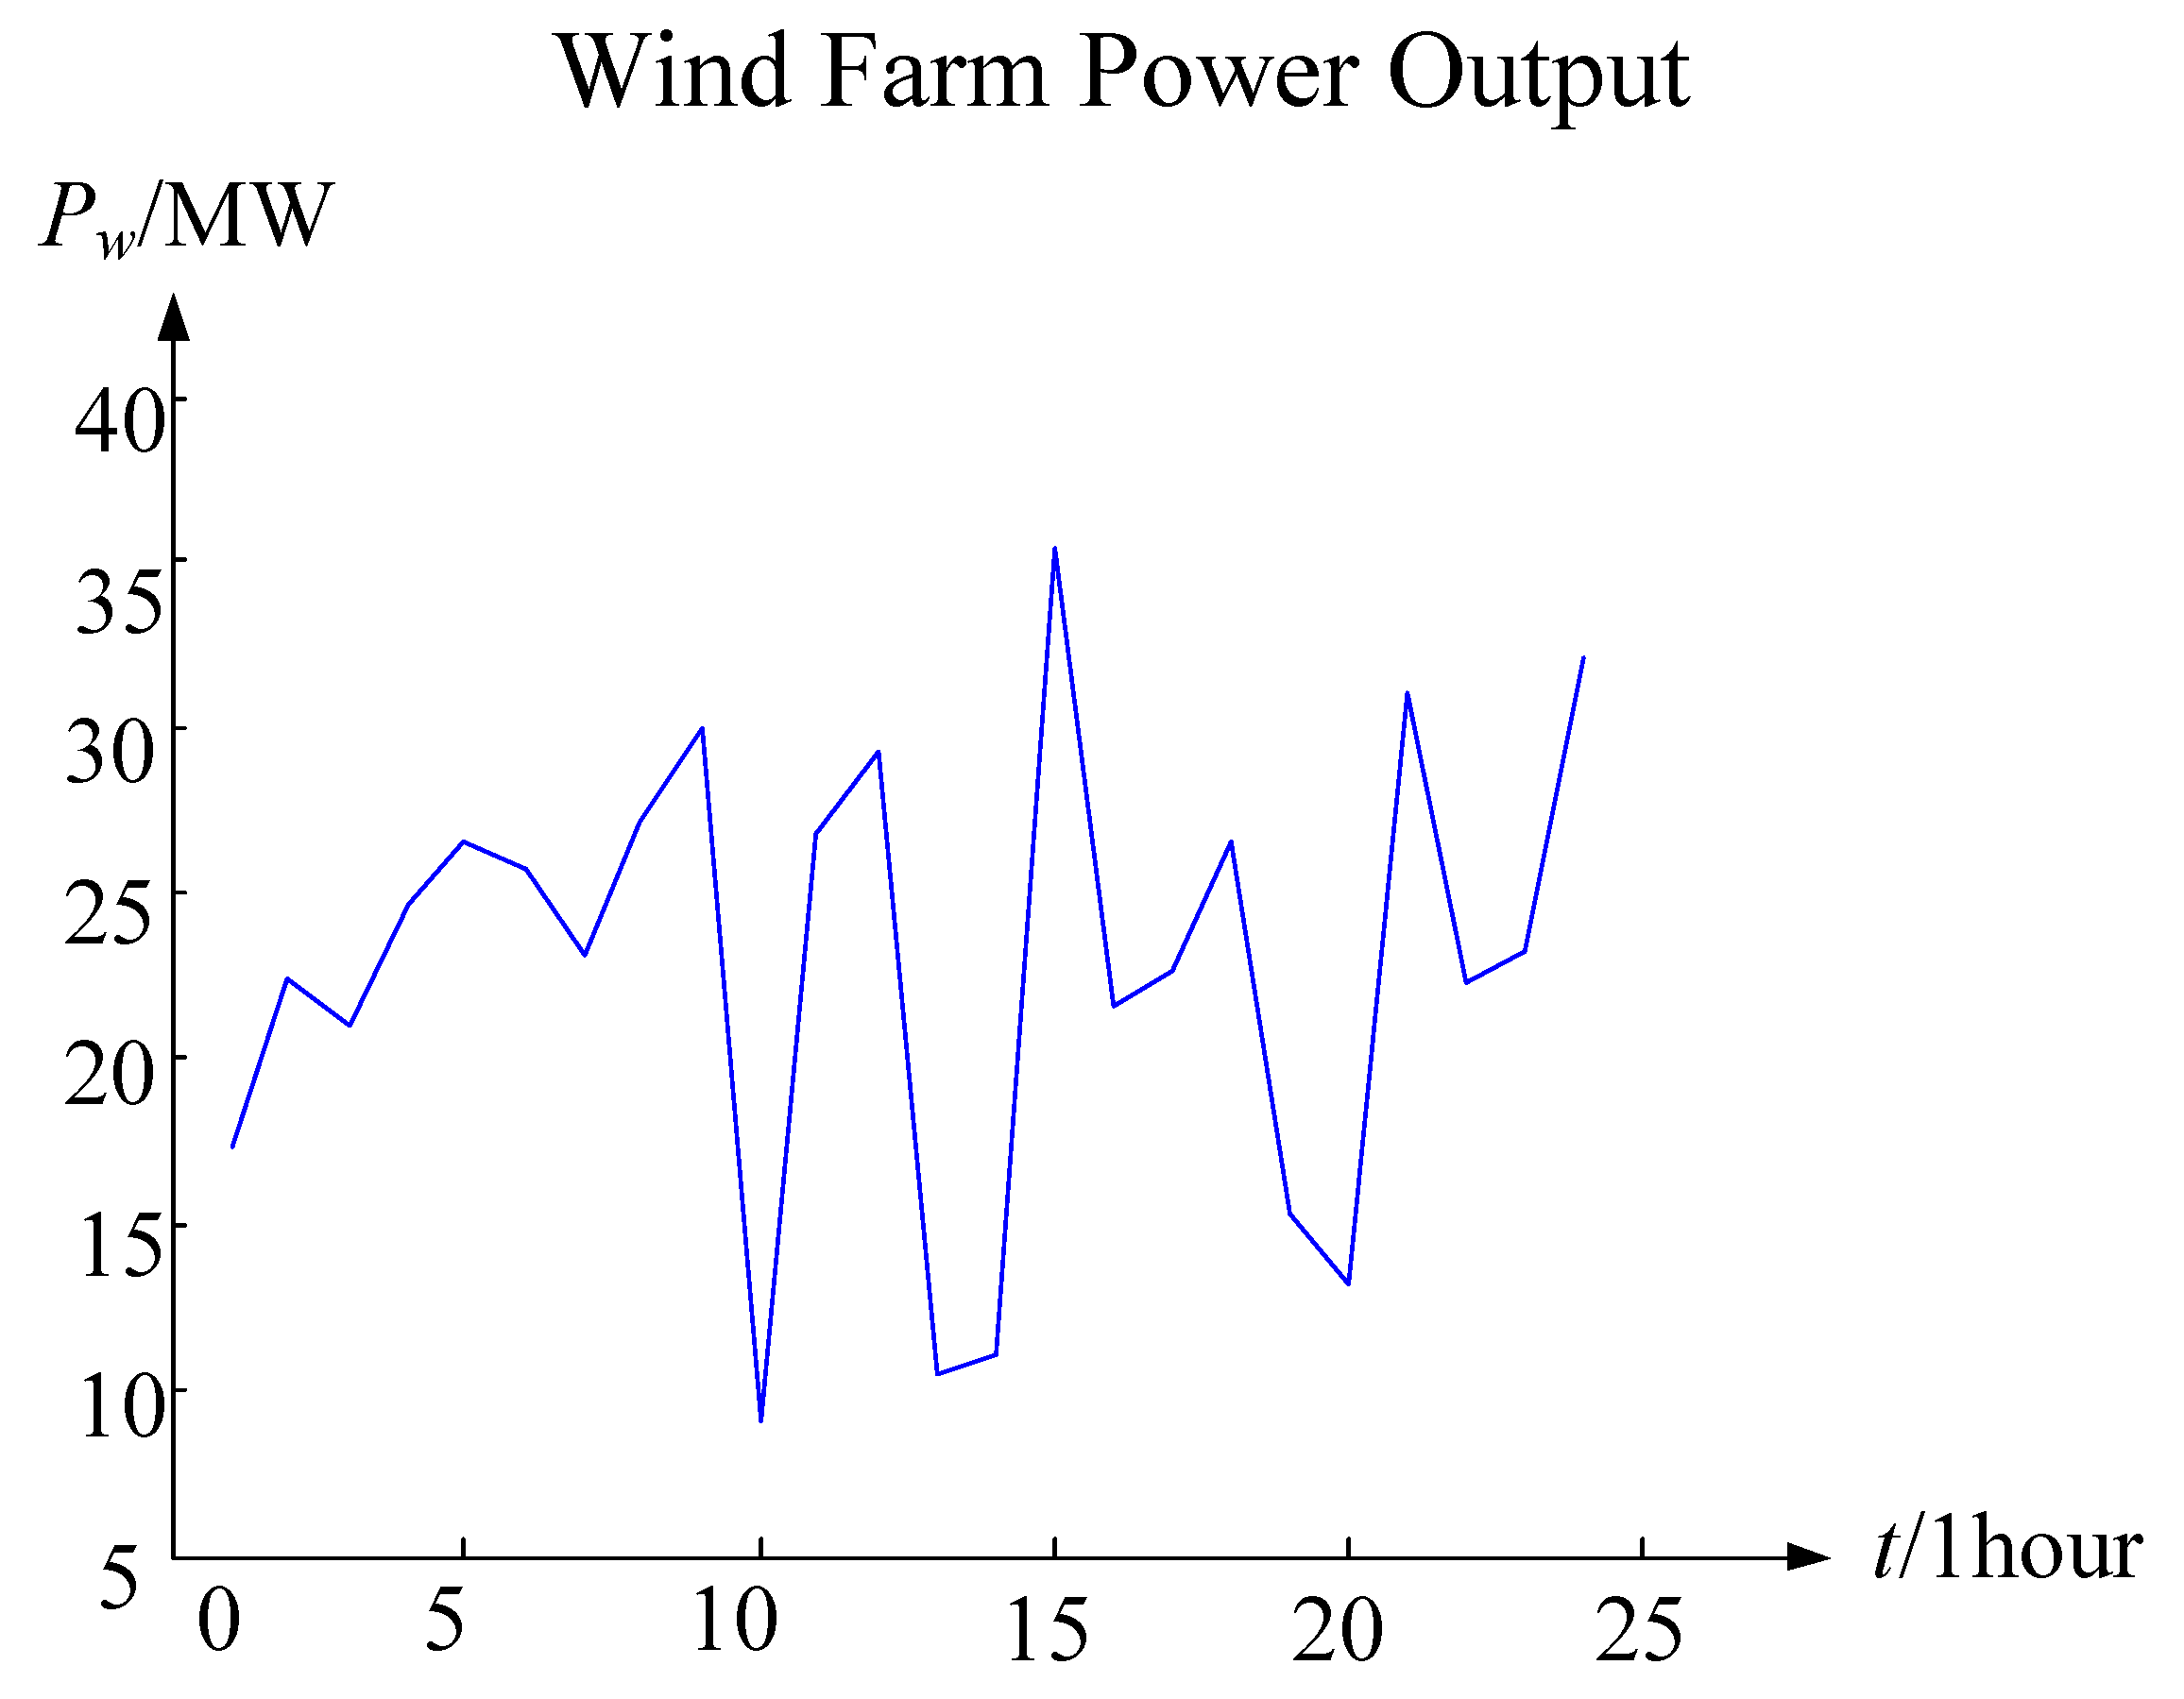
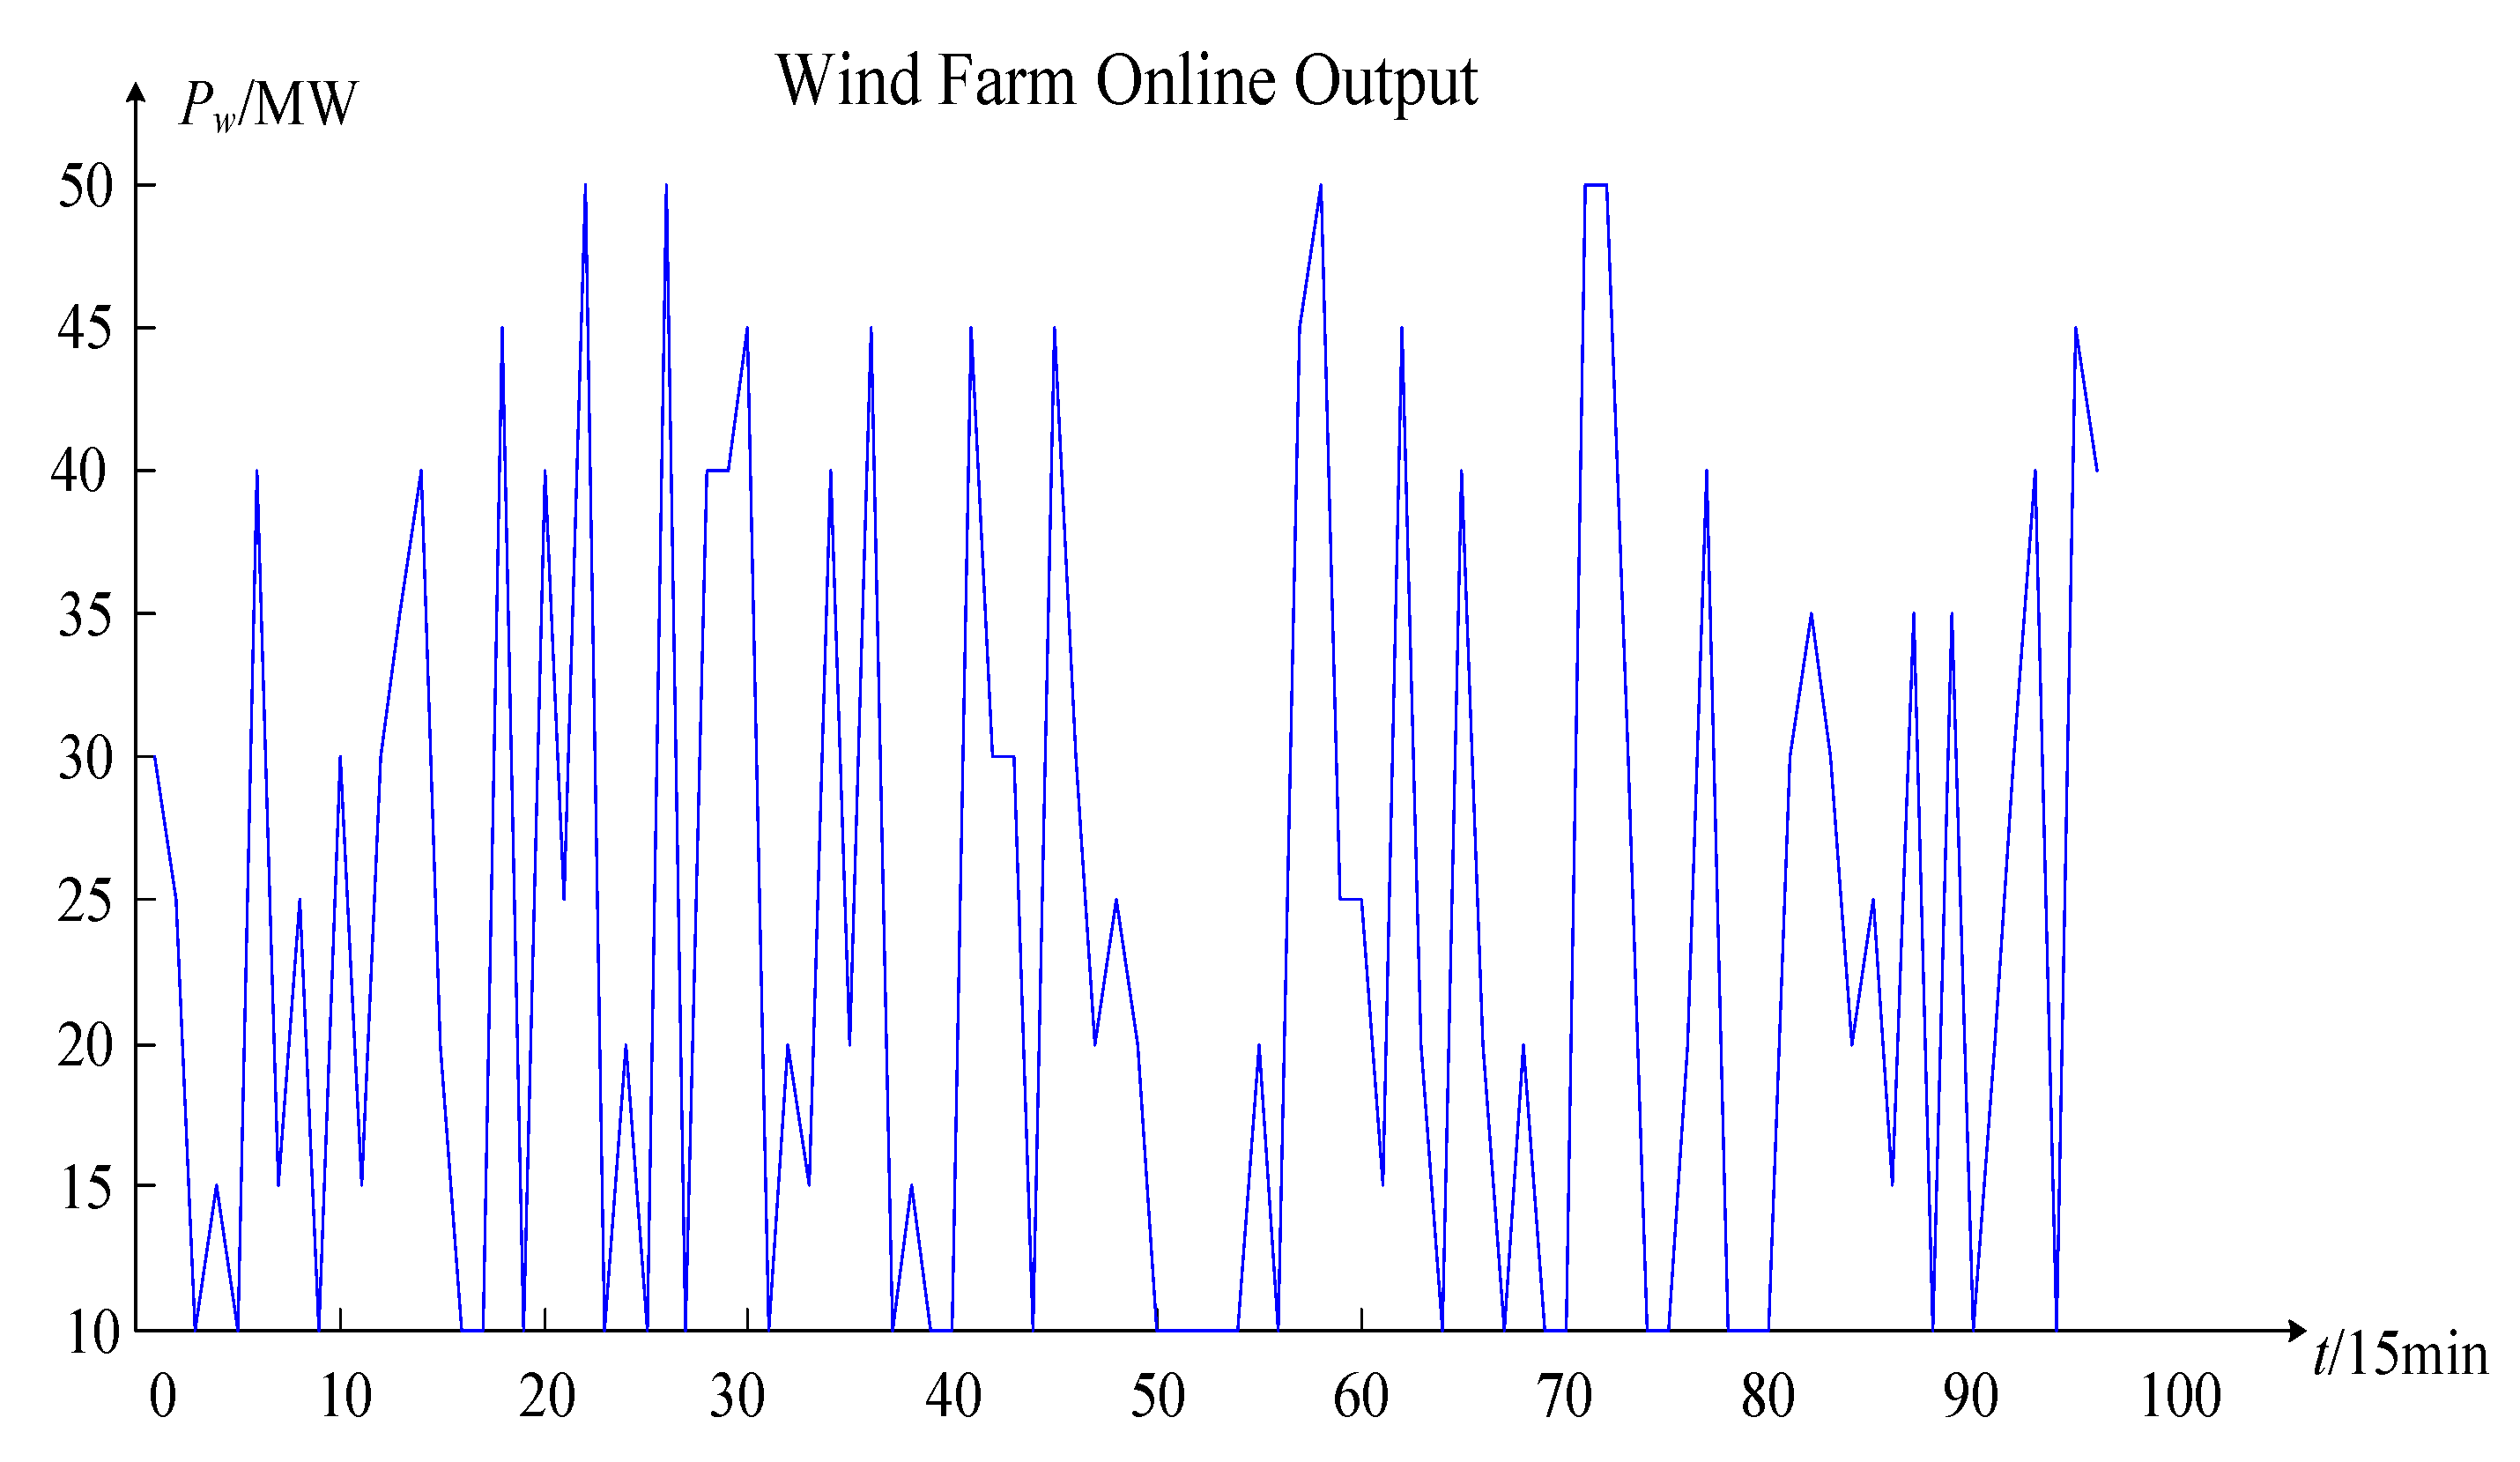
Figure 7, the features extracted from the online operation risk assessment of the wind power system in this paper include real-time wind power active power 
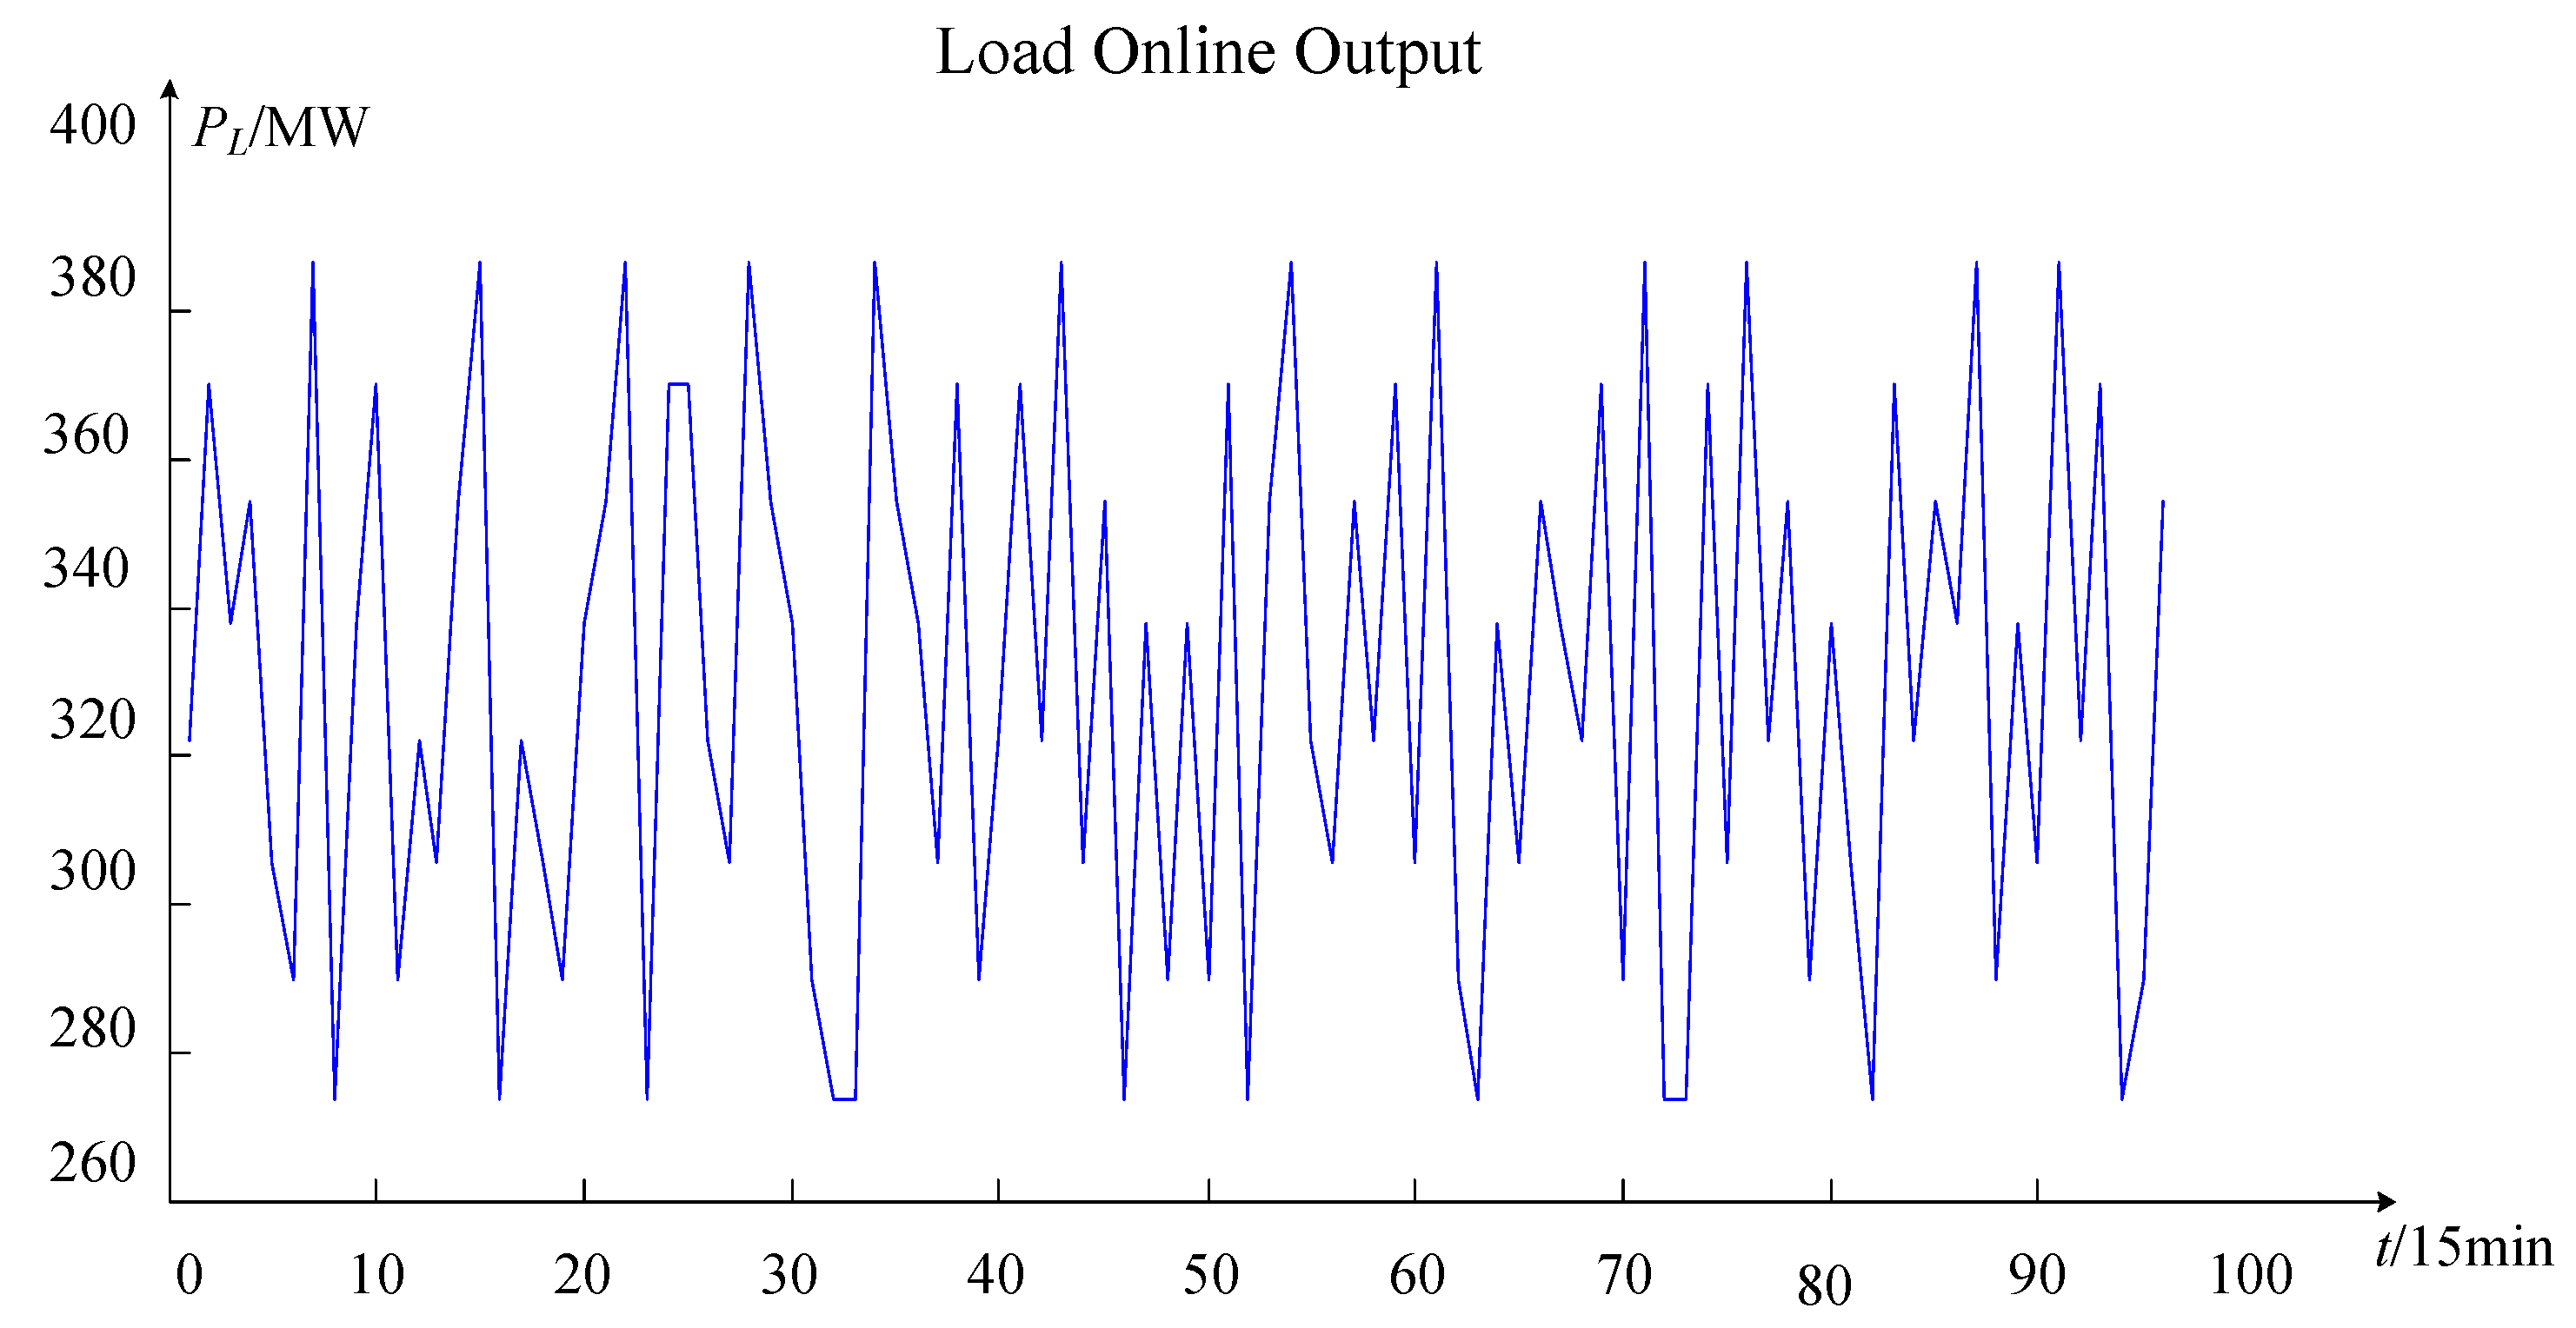
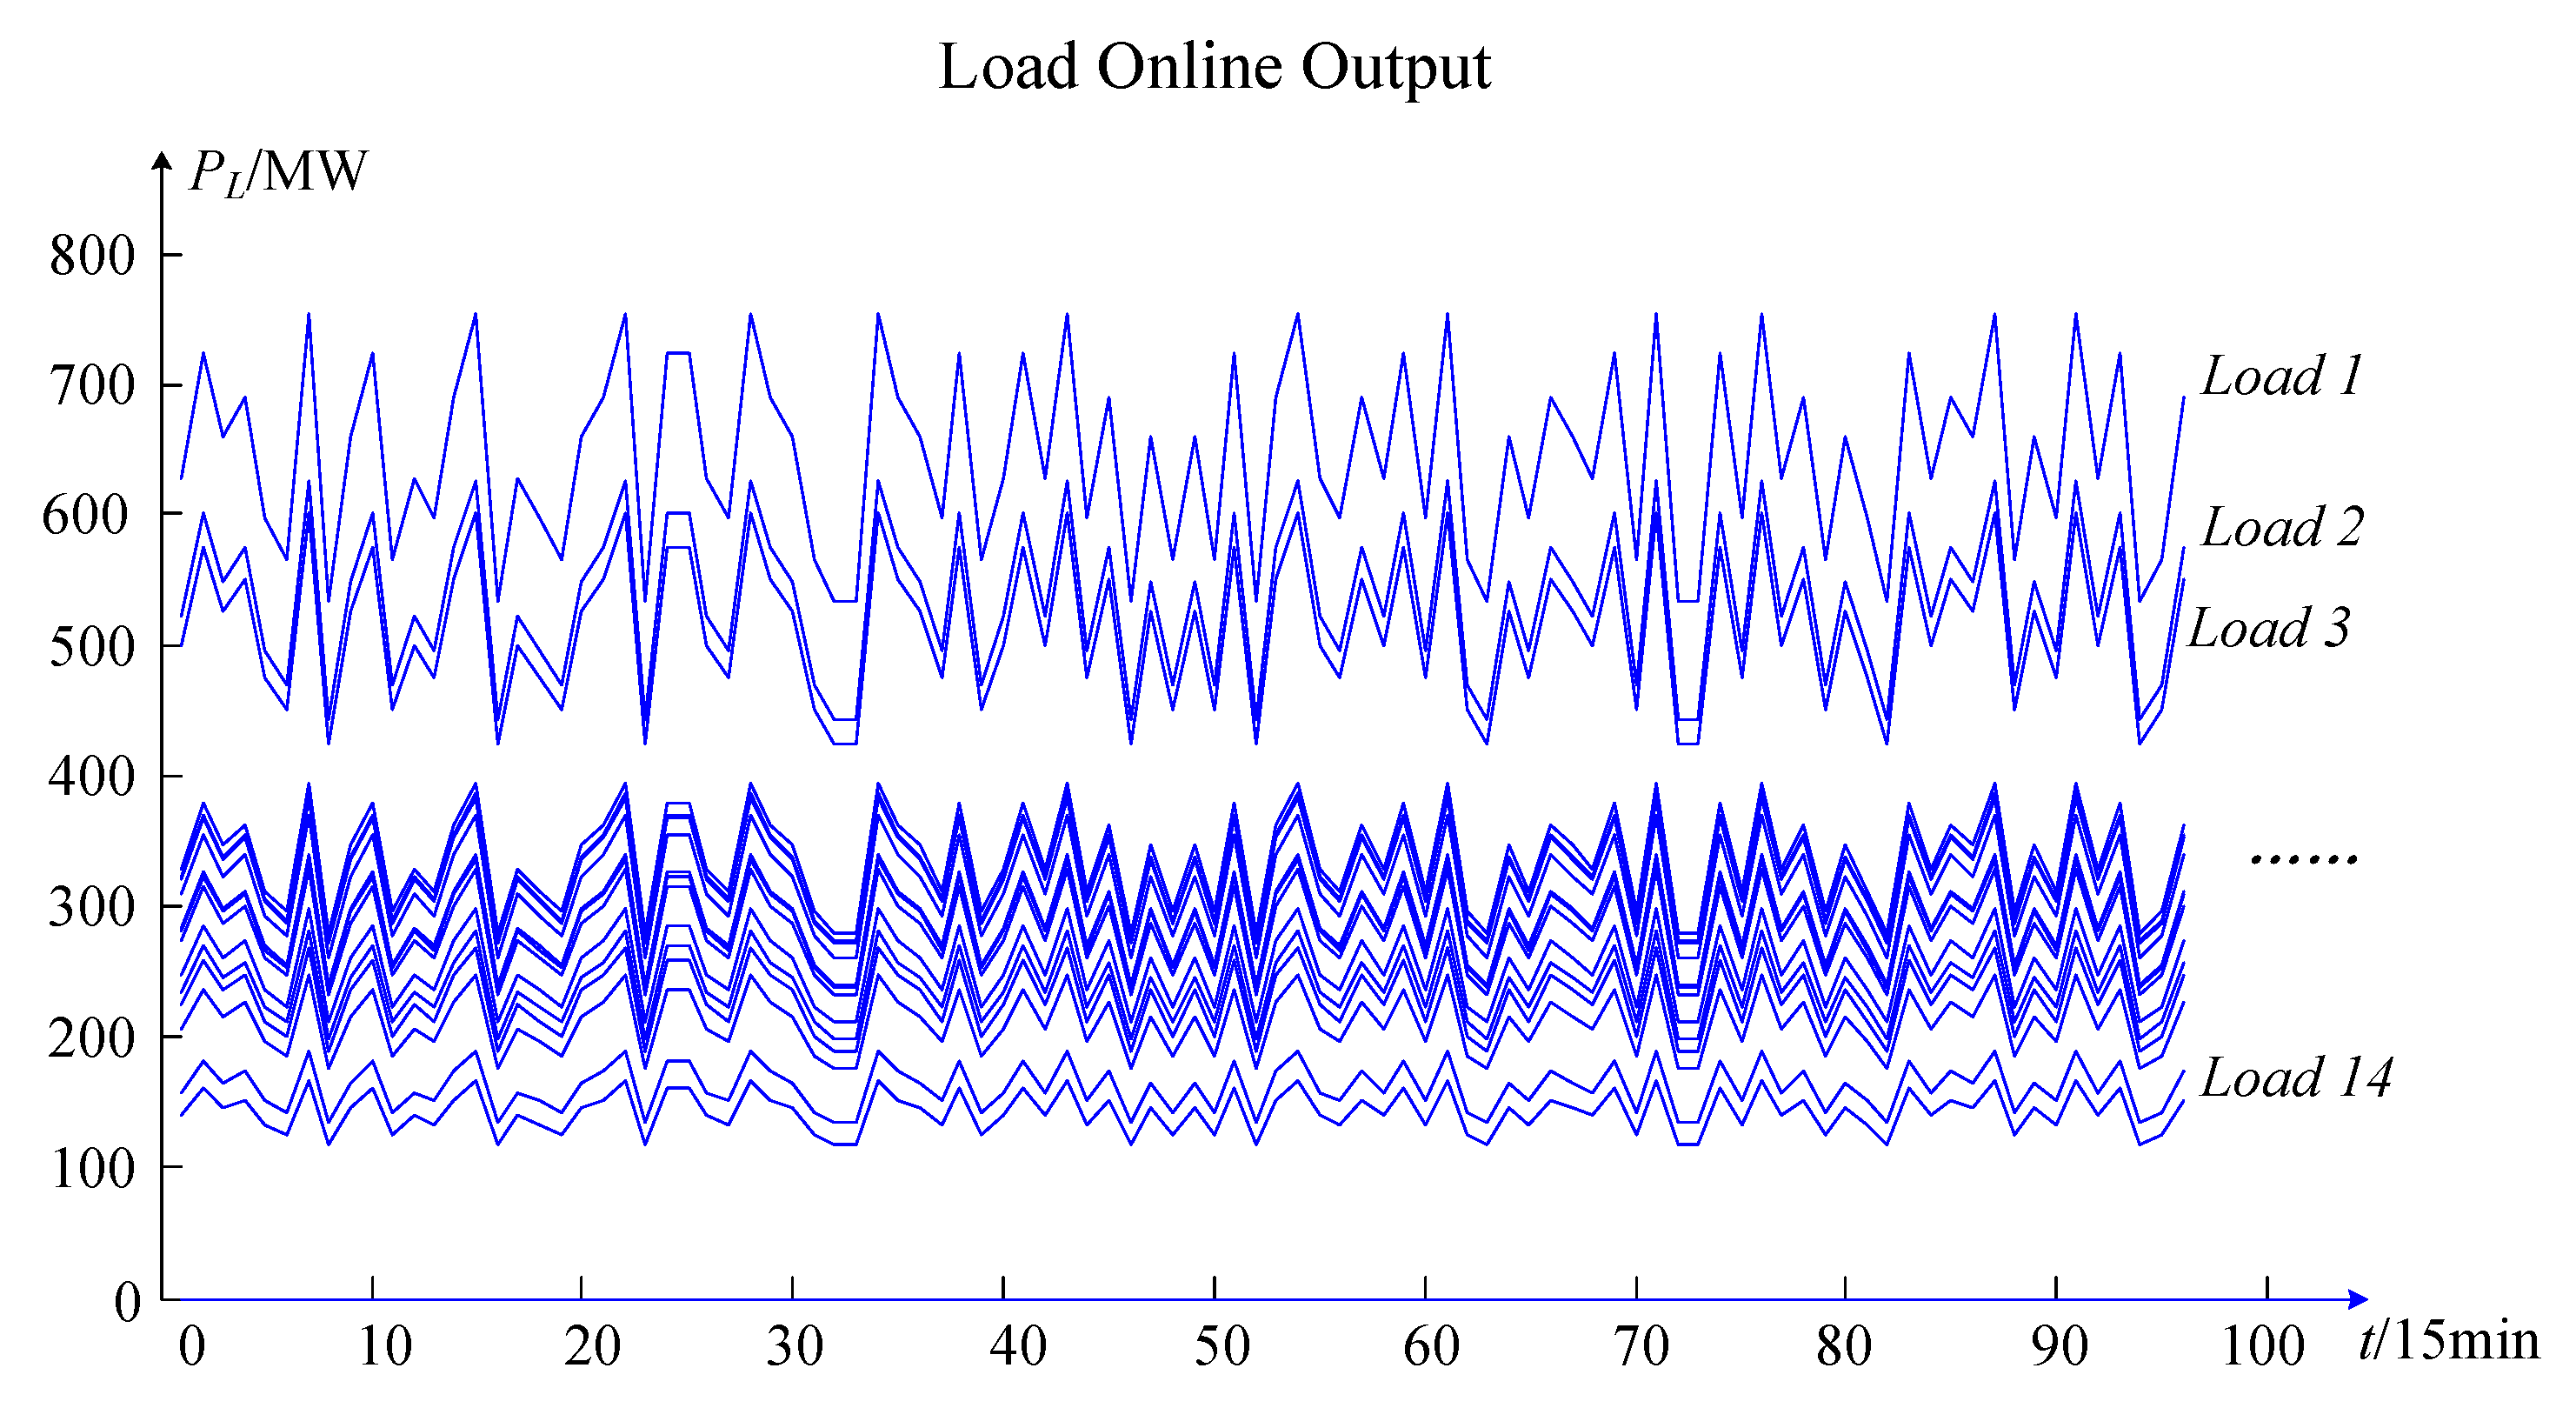
Pwt, real-time active power 
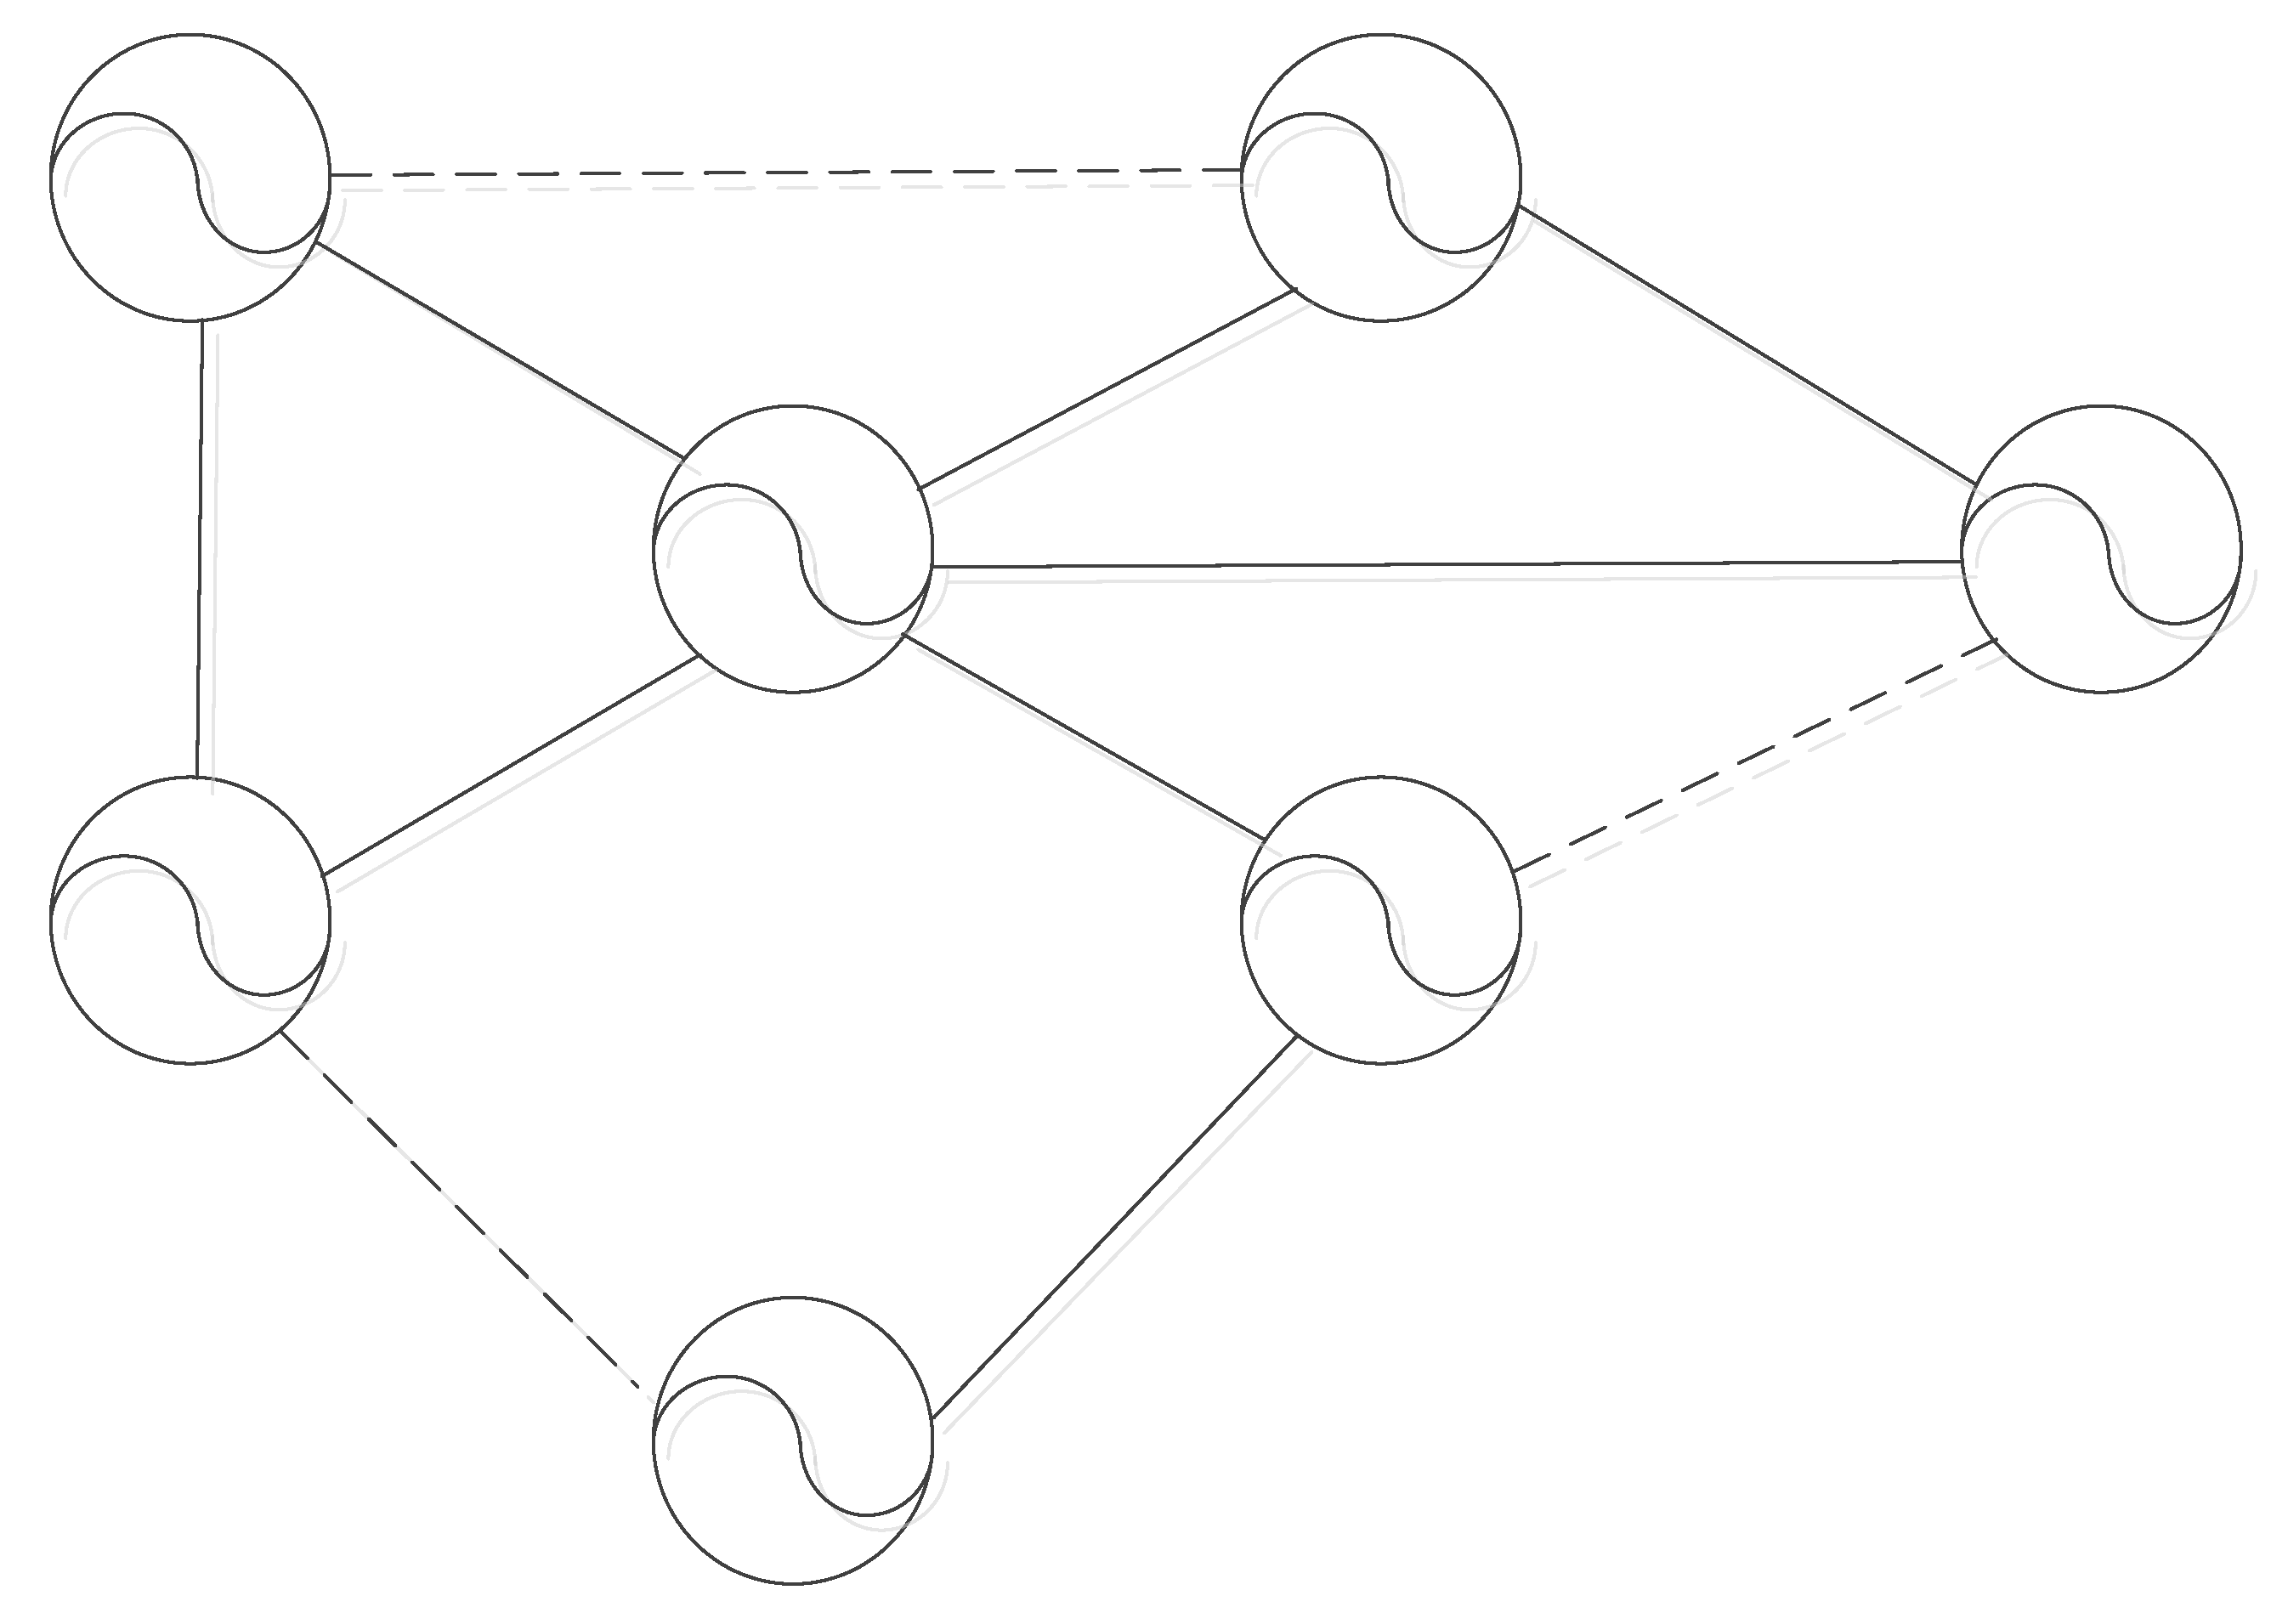
PLt, the real-time grid structure admittance matrix Yt, and the real-time electrical equipment failure rate 
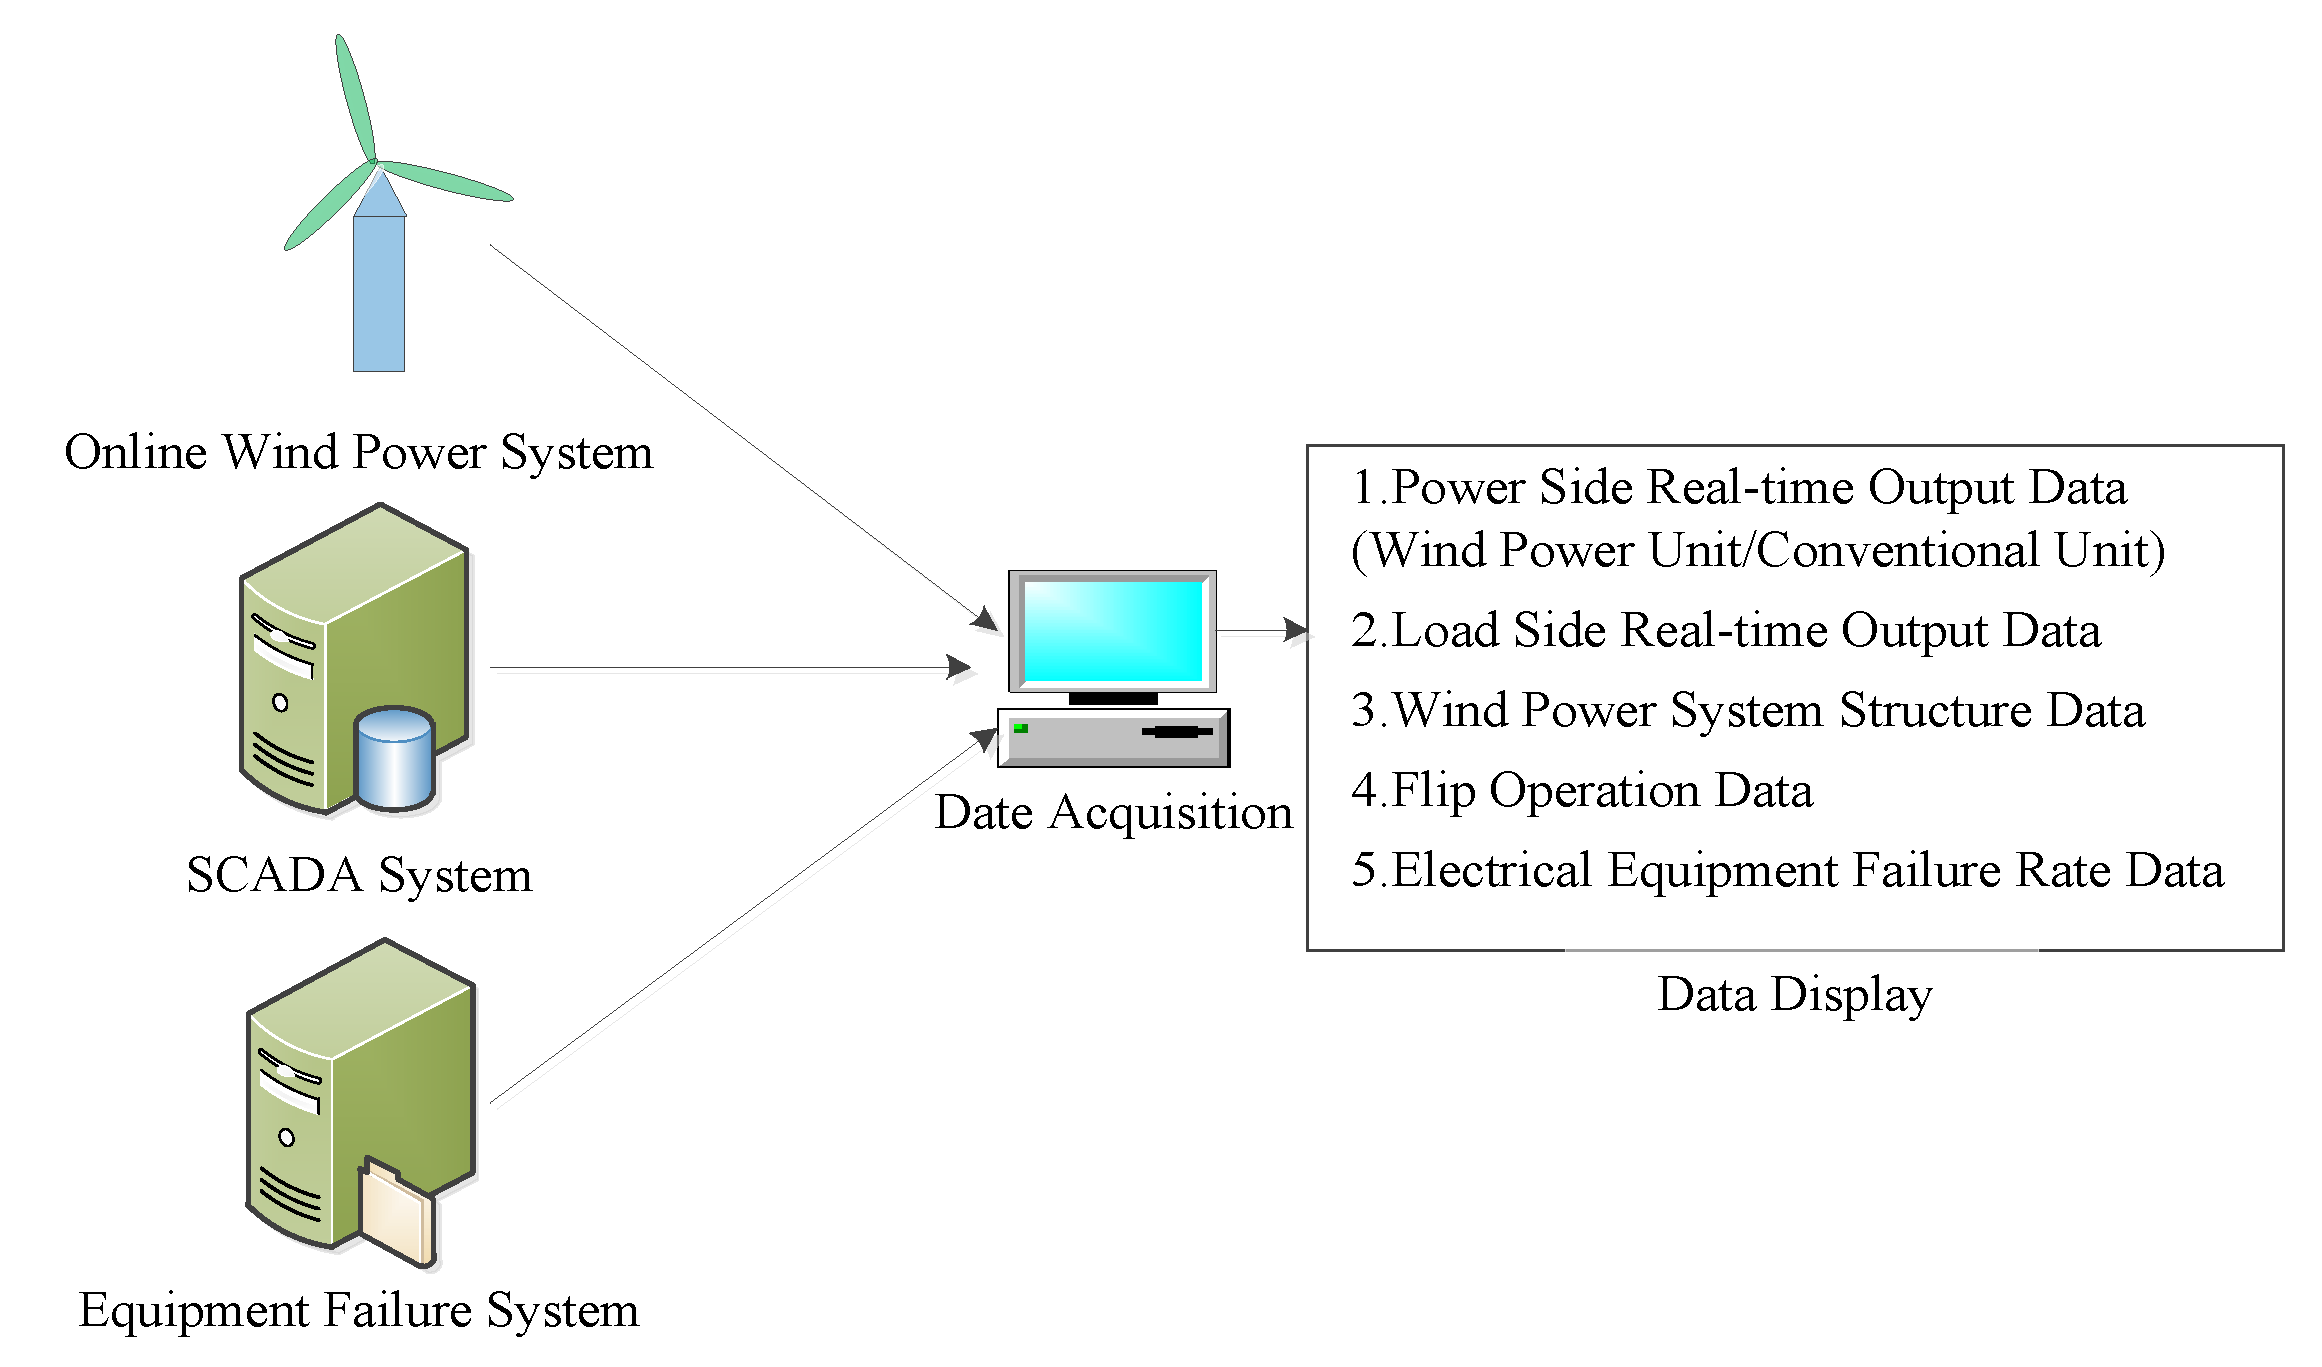
rt. The real-time wind farm and the active power of the load can be directly extracted from the online wind power system and the SCADA system database. The failure rate of electric equipment can be extracted directly from the database of the electrical equipment fault system. However, the real-time admittance matrix cannot be extracted directly from the SCADA system. It is necessary to determine the admittance matrix of the real-time grid structure together with planned maintenance and electrical equipment fault information.
After the above processing, the data required for CNN training simulation were obtained. However, these cannot be used directly for the CNN training simulation and it is necessary to generate standard sample data from these data. The principles for generating sample data for online operation risk assessments are shown in Figure 8.
In 
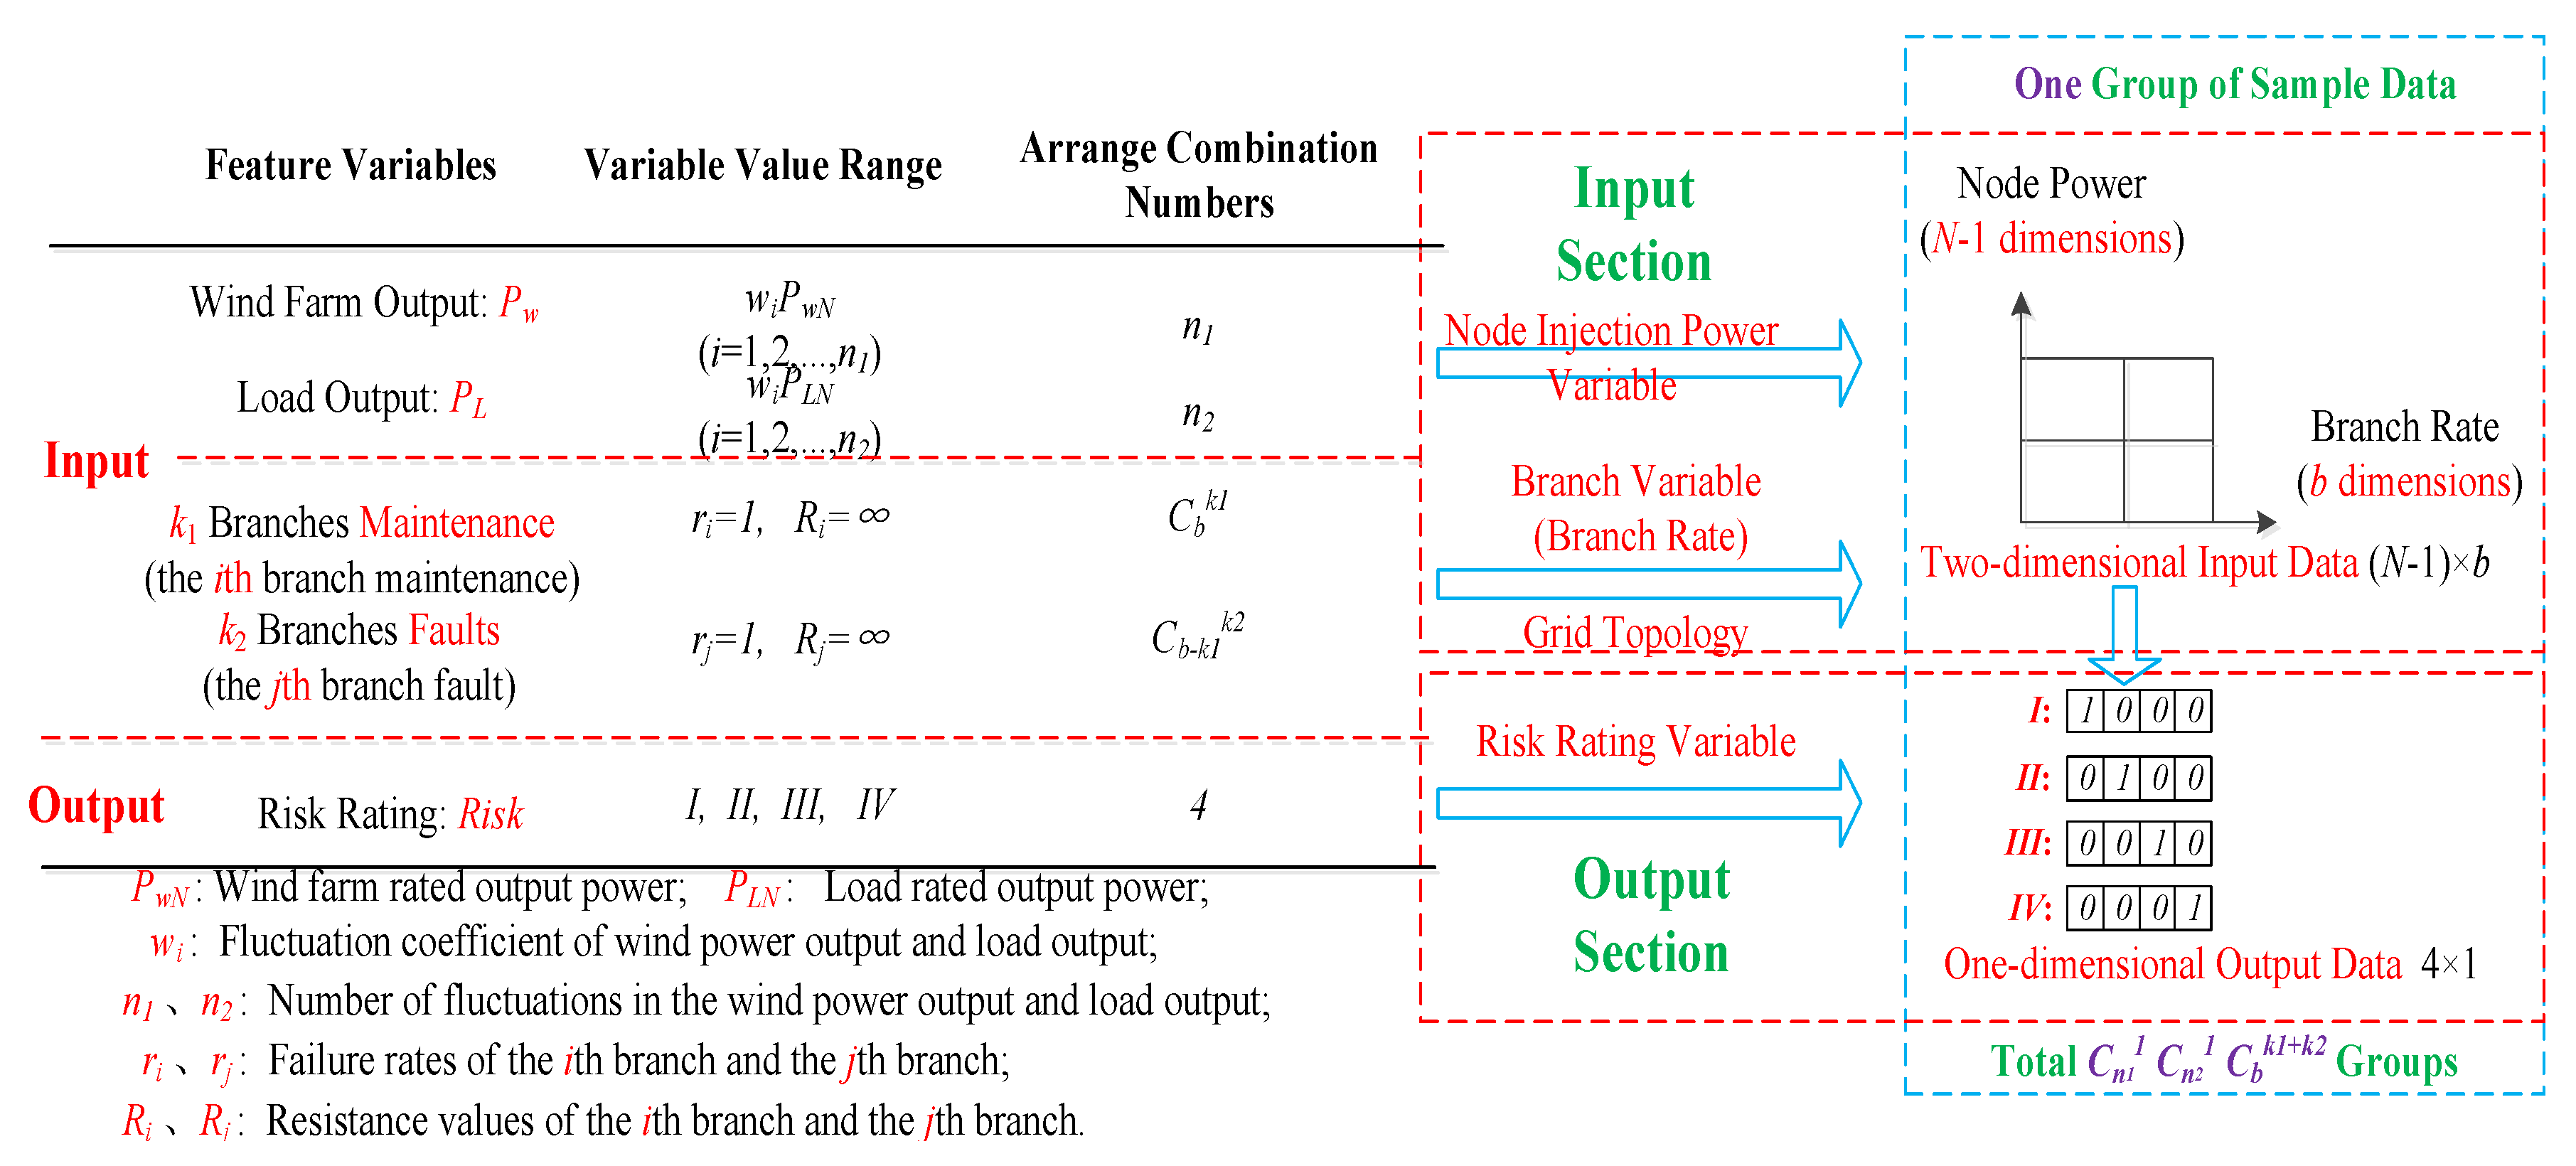
Figure 8, from left to right, the sample data generation principle diagram is mainly divided into two parts: The left part is the original data part and the right part is the standard sample data part.
The original data part includes project contents such as feature variables, the variable value range, and the arranged combination numbers. From top to bottom, the original data part is divided into the input part and output part. The input part feature variables are the wind farm output (Pw), load output (
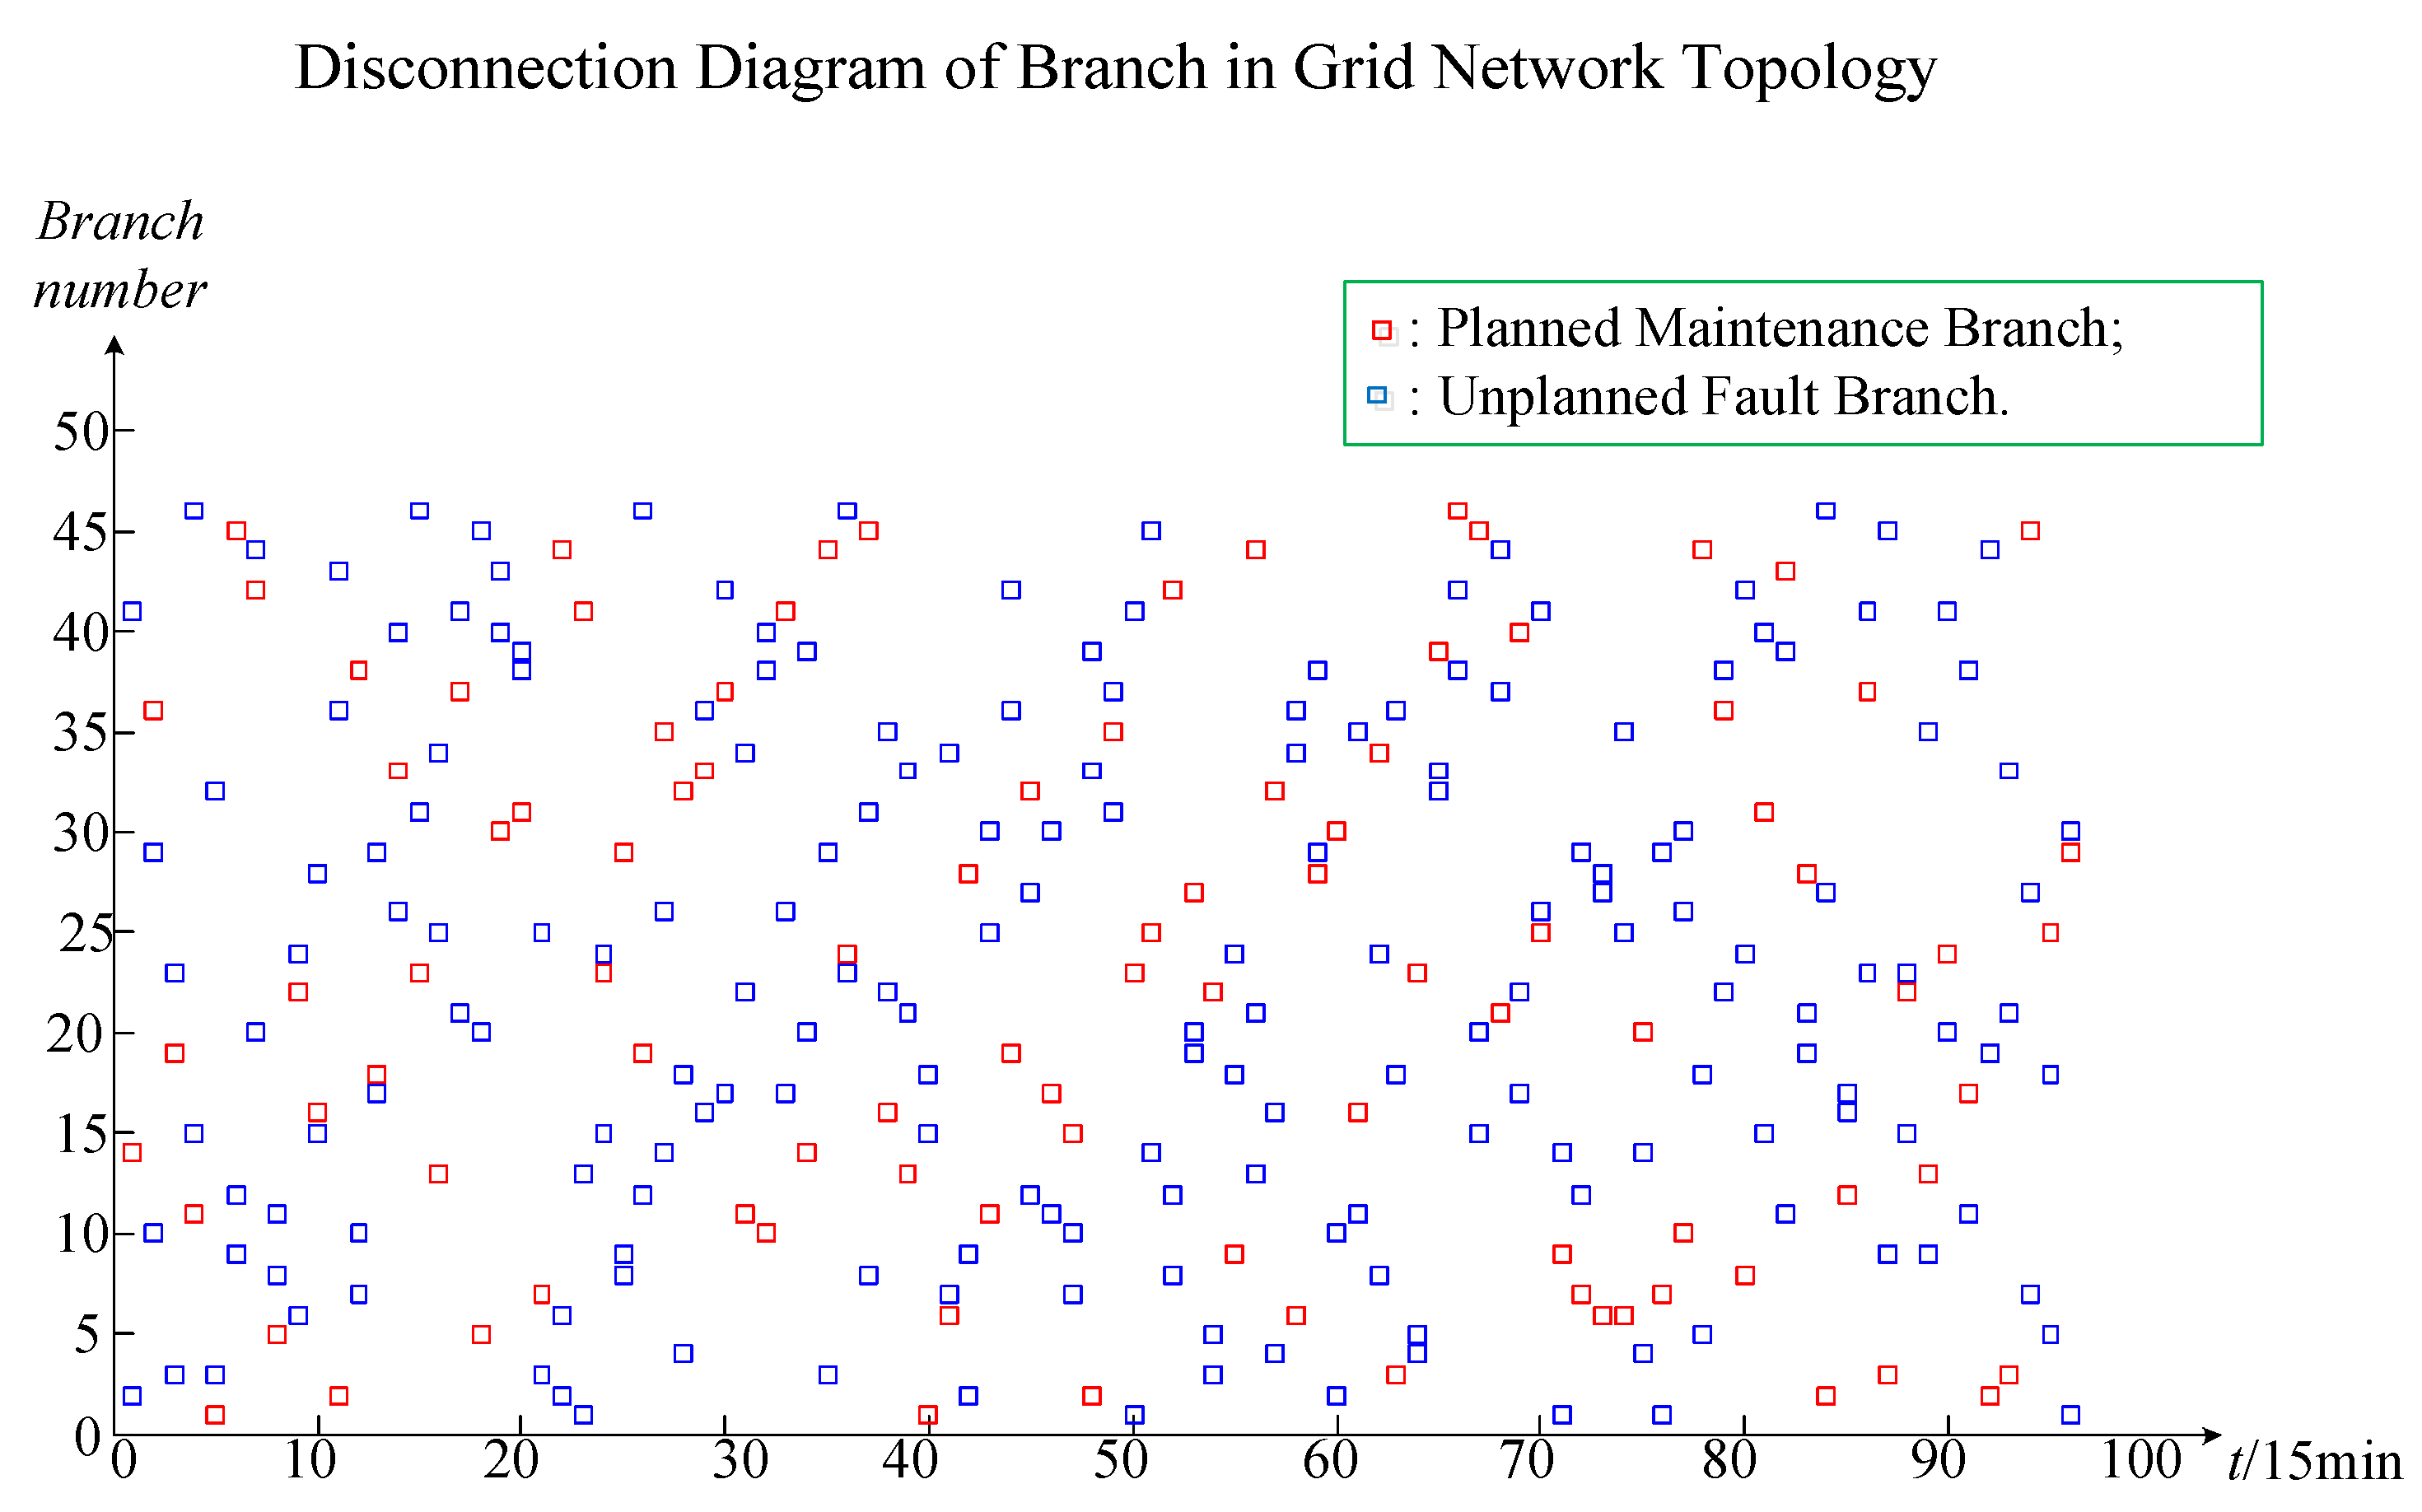
PL), planned maintenance branches (k1), and unplanned fault branches (k2). The wind farm output and load output are classified into one category, which is called the node injection power variable. Since the wind farm access point and the load access point represent all nodes in the system grid network topology, when the wind farm output and load output change, it will only change the power of the injected node and will not change the structure of the system grid topology. Therefore, this type of variable is called a node injection power variable. The planned maintenance branch and the unplanned fault branch are classified into one category, which is called the branch variable. After the planned maintenance branch and the unplanned fault branch are determined, the corresponding branch will be disconnected from the system, thereby changing the structure of the system grid network topology. The branch break can be expressed by the mathematical formula as a failure rate 1 or the branch resistance is always infinite, so this type of variable is called a branch variable. The node injection power variable value range is the product of the proportional coefficient and the rated capacity. The arranged combination numbers are the proportional coefficient numbers. For example, Pw = wi × PwN, PL = wj × PLN, wi and wj are the proportional coefficient of the wind farm output and load output. PwN and PLN are the rated capacity of the wind farm output and load output. The number of wi and wj are n1 and n2, respectively. Therefore, the arranged combination numbers are n1 and n2, respectively. The branch variable value range is a constant value (failure rate is 1 and resistance is infinite). The arranged combination numbers are Cbk1+k2. k1 and k2 are the numbers of planned maintenance branches and unplanned fault branches. b is the sum number of wind power system branches. The output part represents the expected targets of online operation risk assessment, such as Section 2.5 in this paper. The output part feature variable is the risk rating (Riski). The output part variable value ranges are I, II, III, and IV. Referring to Table 1, I indicate that the risk rating is a general accident, II indicates that the risk rating is a larger accident, III indicates that the risk rating is a major accident, and IV indicates that the risk rating is a particularly significant accident. The arranged combination number of the output part is four. This means that there are only four levels of the online operation risk rating.
The standard sample data part is the standard data that can be directly entered into the CNN algorithm for training simulation. From top to bottom, the standard sample data part is divided into the input part and output part. The input and output parts of the standard sample data correspond to the input and output parts of the original data. In the standard data part, the input part is a two-dimensional matrix data. In the two-dimensional data, the x-axis data represents the branch electrical equipment failure rate data, and y-axis data represents the node injection power data. The x-axis data reflects the failure rate of electrical equipment in all branches. The failure rate of planned maintenance branches and unplanned fault branches are constant at 1, and the failure rate of the remaining branches is the failure rate of equipment on the corresponding branch roads. The y-axis data reflects the injected power data of all nodes. The node injection power is the power supply output minus the load output, in which the power supply output includes the output of the conventional unit and the output of the wind farm. The two-dimensional matrix data of the input part of the standard sample data can be expressed as (N − 1) × b. N is the number of nodes of the wind power system and b is the number of branches of the wind power system. In the power flow calculation, a node is required to balance the power and serve as a reference point for the node voltage. This node is called a balance node, and the balance node does not participate in the power flow calculation. For a wind system with N nodes, the injection power of up to N − 1 nodes can be adjusted, so the input part data is expressed as (N − 1) × b instead of N × b. The output part is one-dimensional matrix data. There are only four possible output data in the output part, namely I, II, III, and IV. Among them, I is denoted as 1000, II is denoted as 0100, III is denoted as 0010, and IV is denoted as 0001. The input two-dimensional matrix data and output one-dimensional matrix data form a set of online operation risk standard sample data. A set of sample data represents the scene of an online operation risk assessment of the wind power system. The number of sample data groups is equal to the number of scenes. The number is related to the arranged combination number of multiple random factors. The total number of standard sample data groups is Cn11 Cn21Cbk1 + k2. n1 and n2 are the arranged combination number of the wind farm output and load output, respectively; k1 and k2 are the numbers of planned maintenance branches and unplanned fault branches, respectively; and b is the sum number of wind power system branches.
In summary, according to this sample data generation principle diagram, the standard sample data of the online operation risk assessment of the wind power system can be obtained, and the next step of the CNN algorithm is then implemented.

4.4. CNN Algorithm Implementation

CNN algorithm implementation is mainly divided into two steps. The first step is to construct the optimal CNN algorithm network structure. The second step is to apply the CNN training model. The first step is to build a variety of CNN algorithm network structures. Through the online operation sample data for offline training simulation, the optimal CNN algorithm network structure, that is, the online operation risk assessment model of the wind power system, can be found. The second step uses the evaluation model completed by CNN offline training, adopts online data, and applies the CNN training model online to provide the operator with the real-time online wind power system risk status.
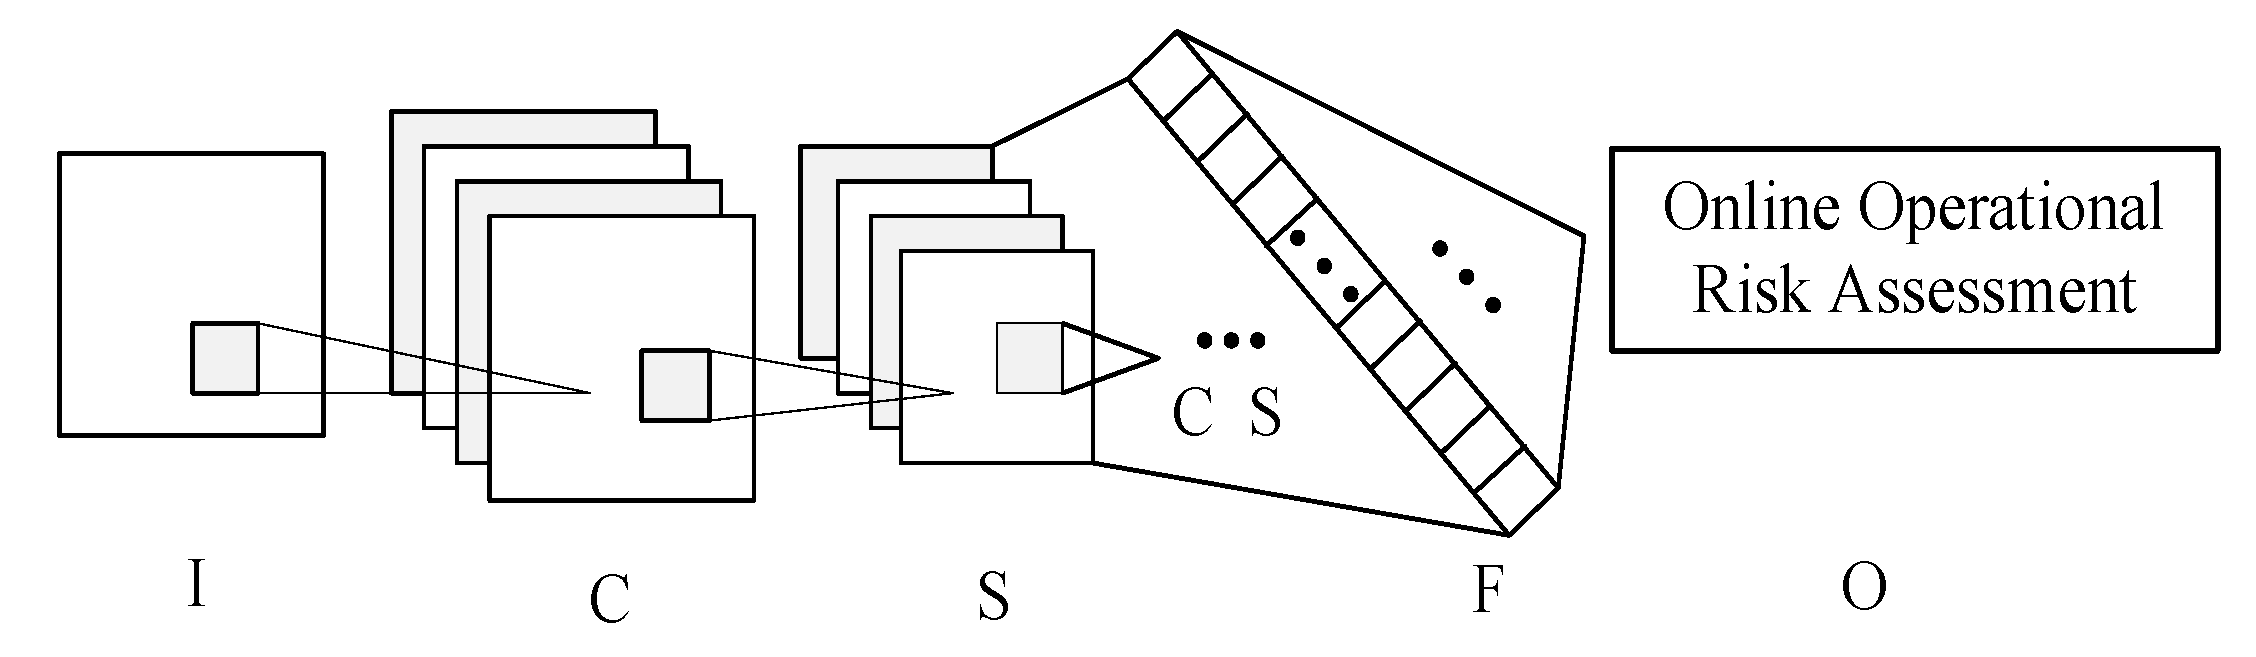
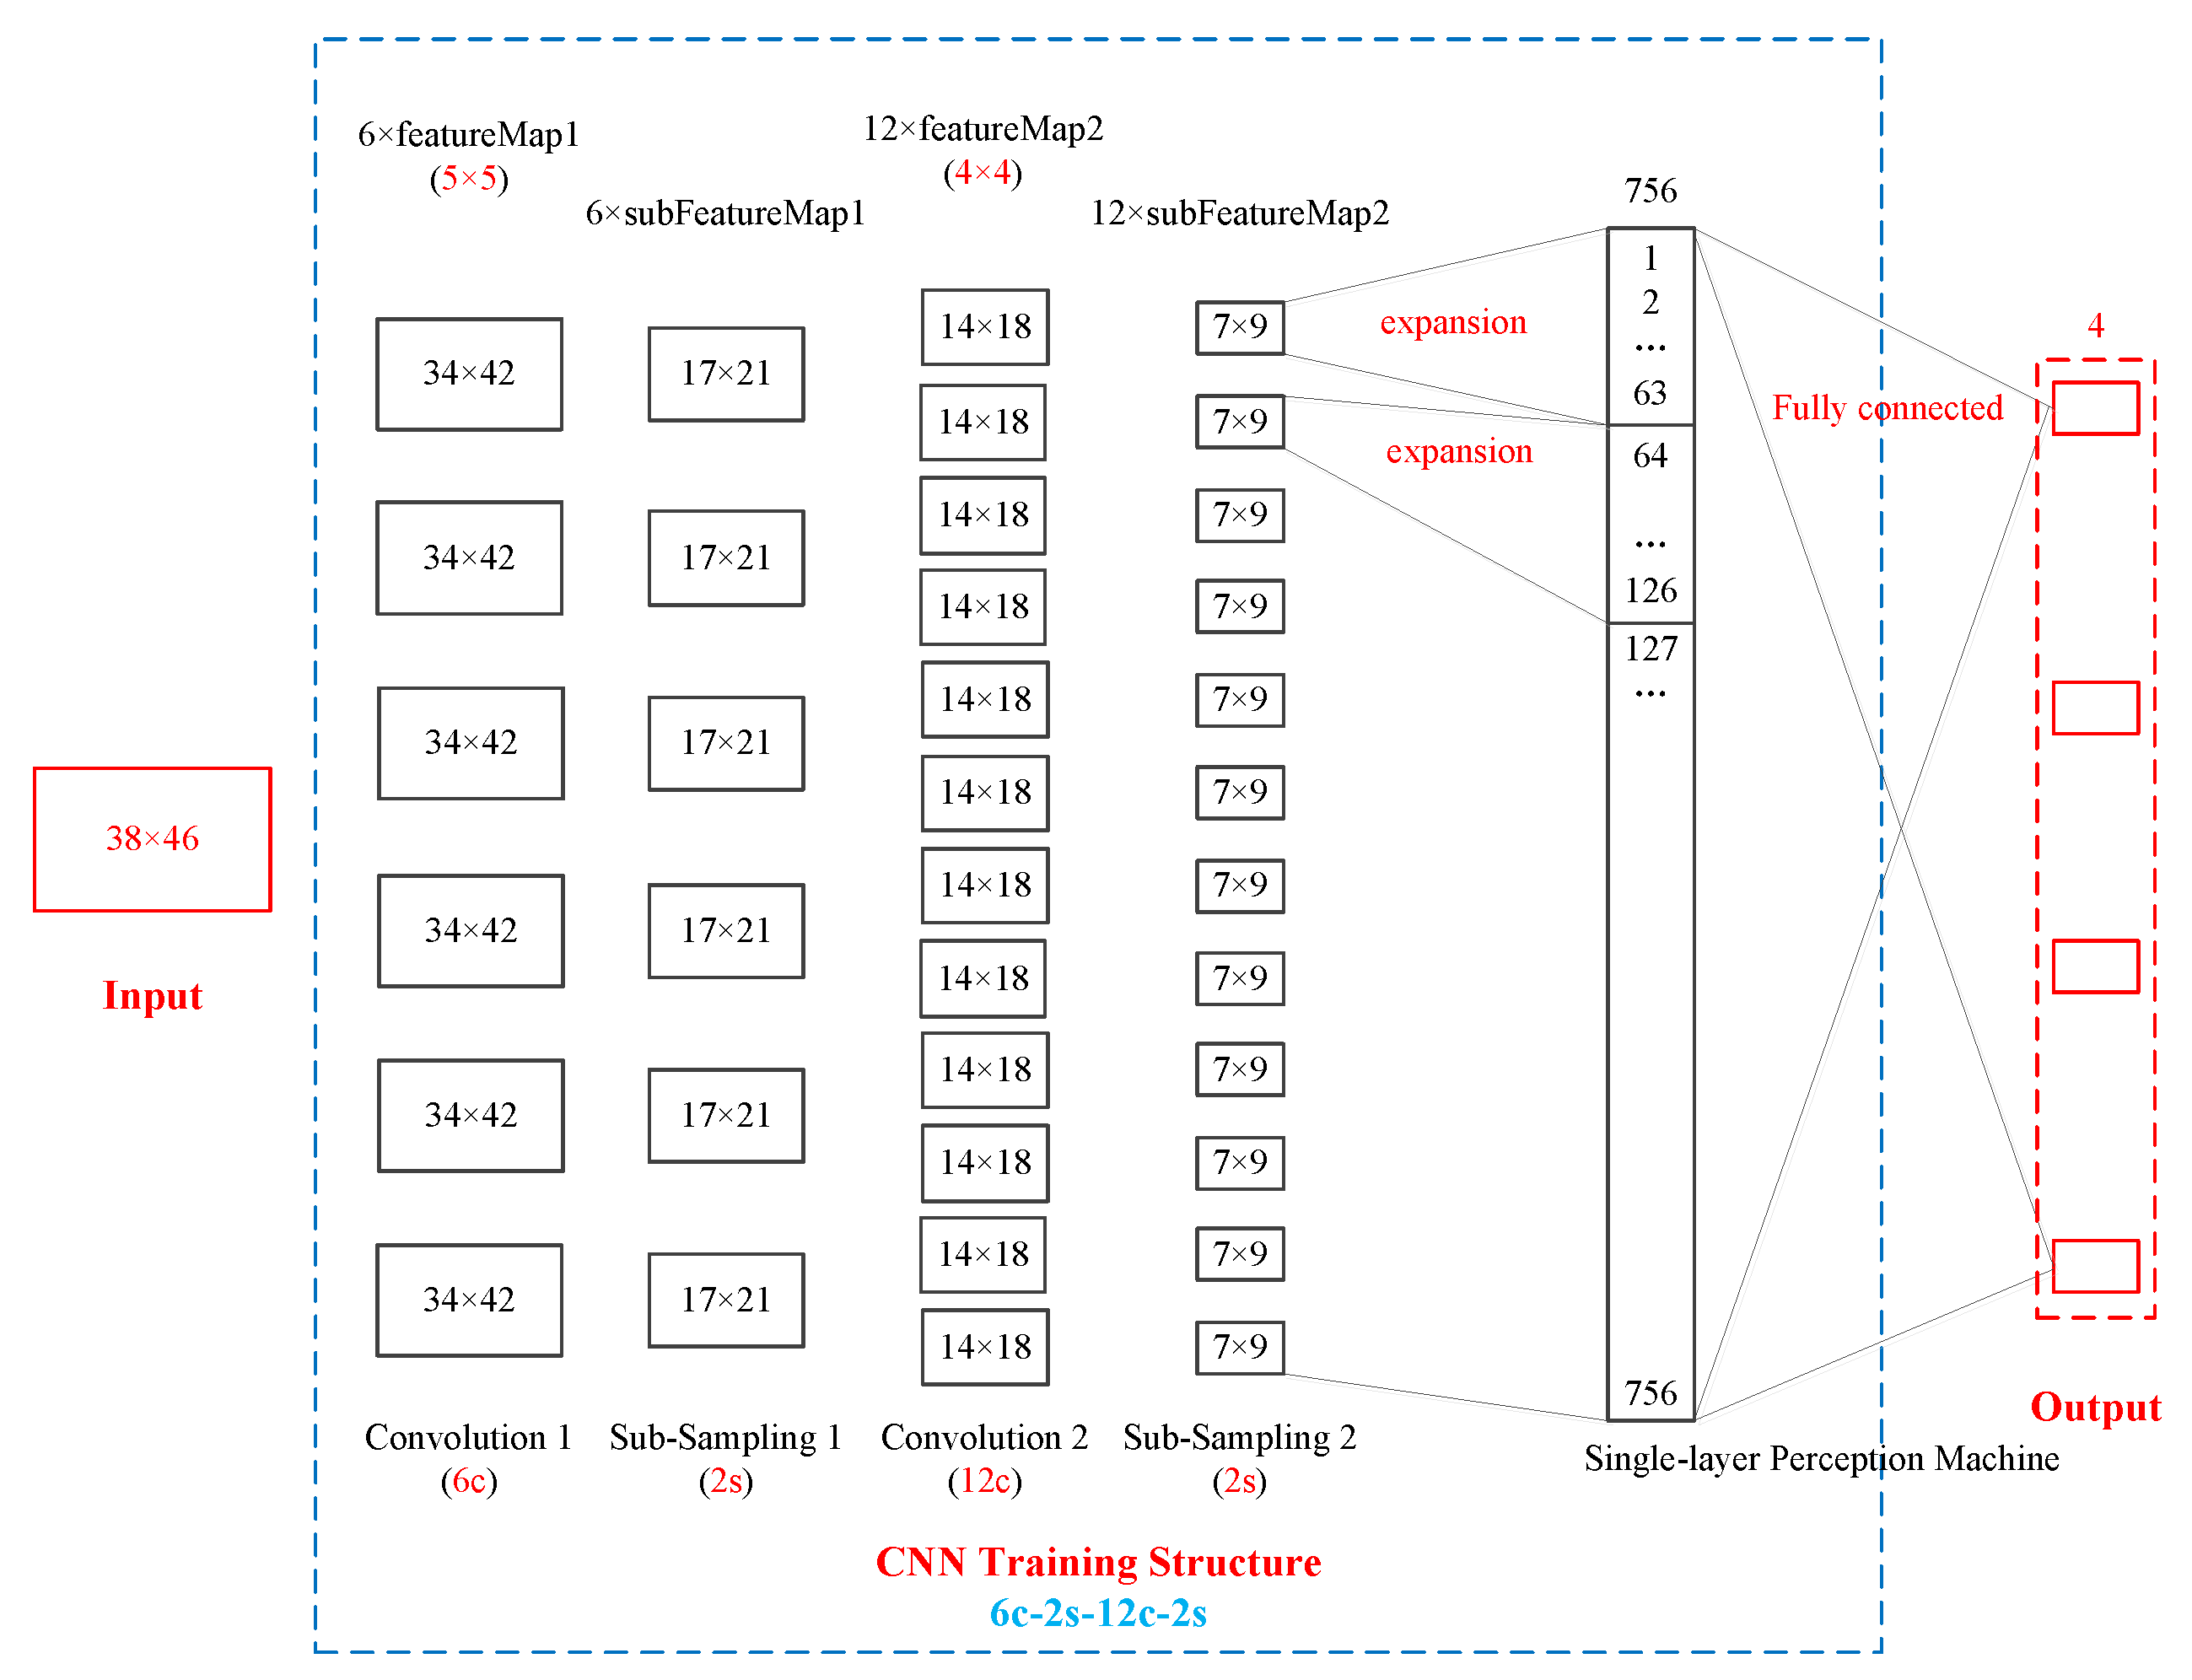
The key to the first step is how to construct the CNN algorithm network structure. The CNN algorithm network structure includes four layers: The input layer, convolution layer, sampling layer, and output layer. The English 10-machine 39 node systems are used to explain how to construct the CNN algorithm network structure. An optimal CNN algorithm network structure is shown in Figure 9.
In 
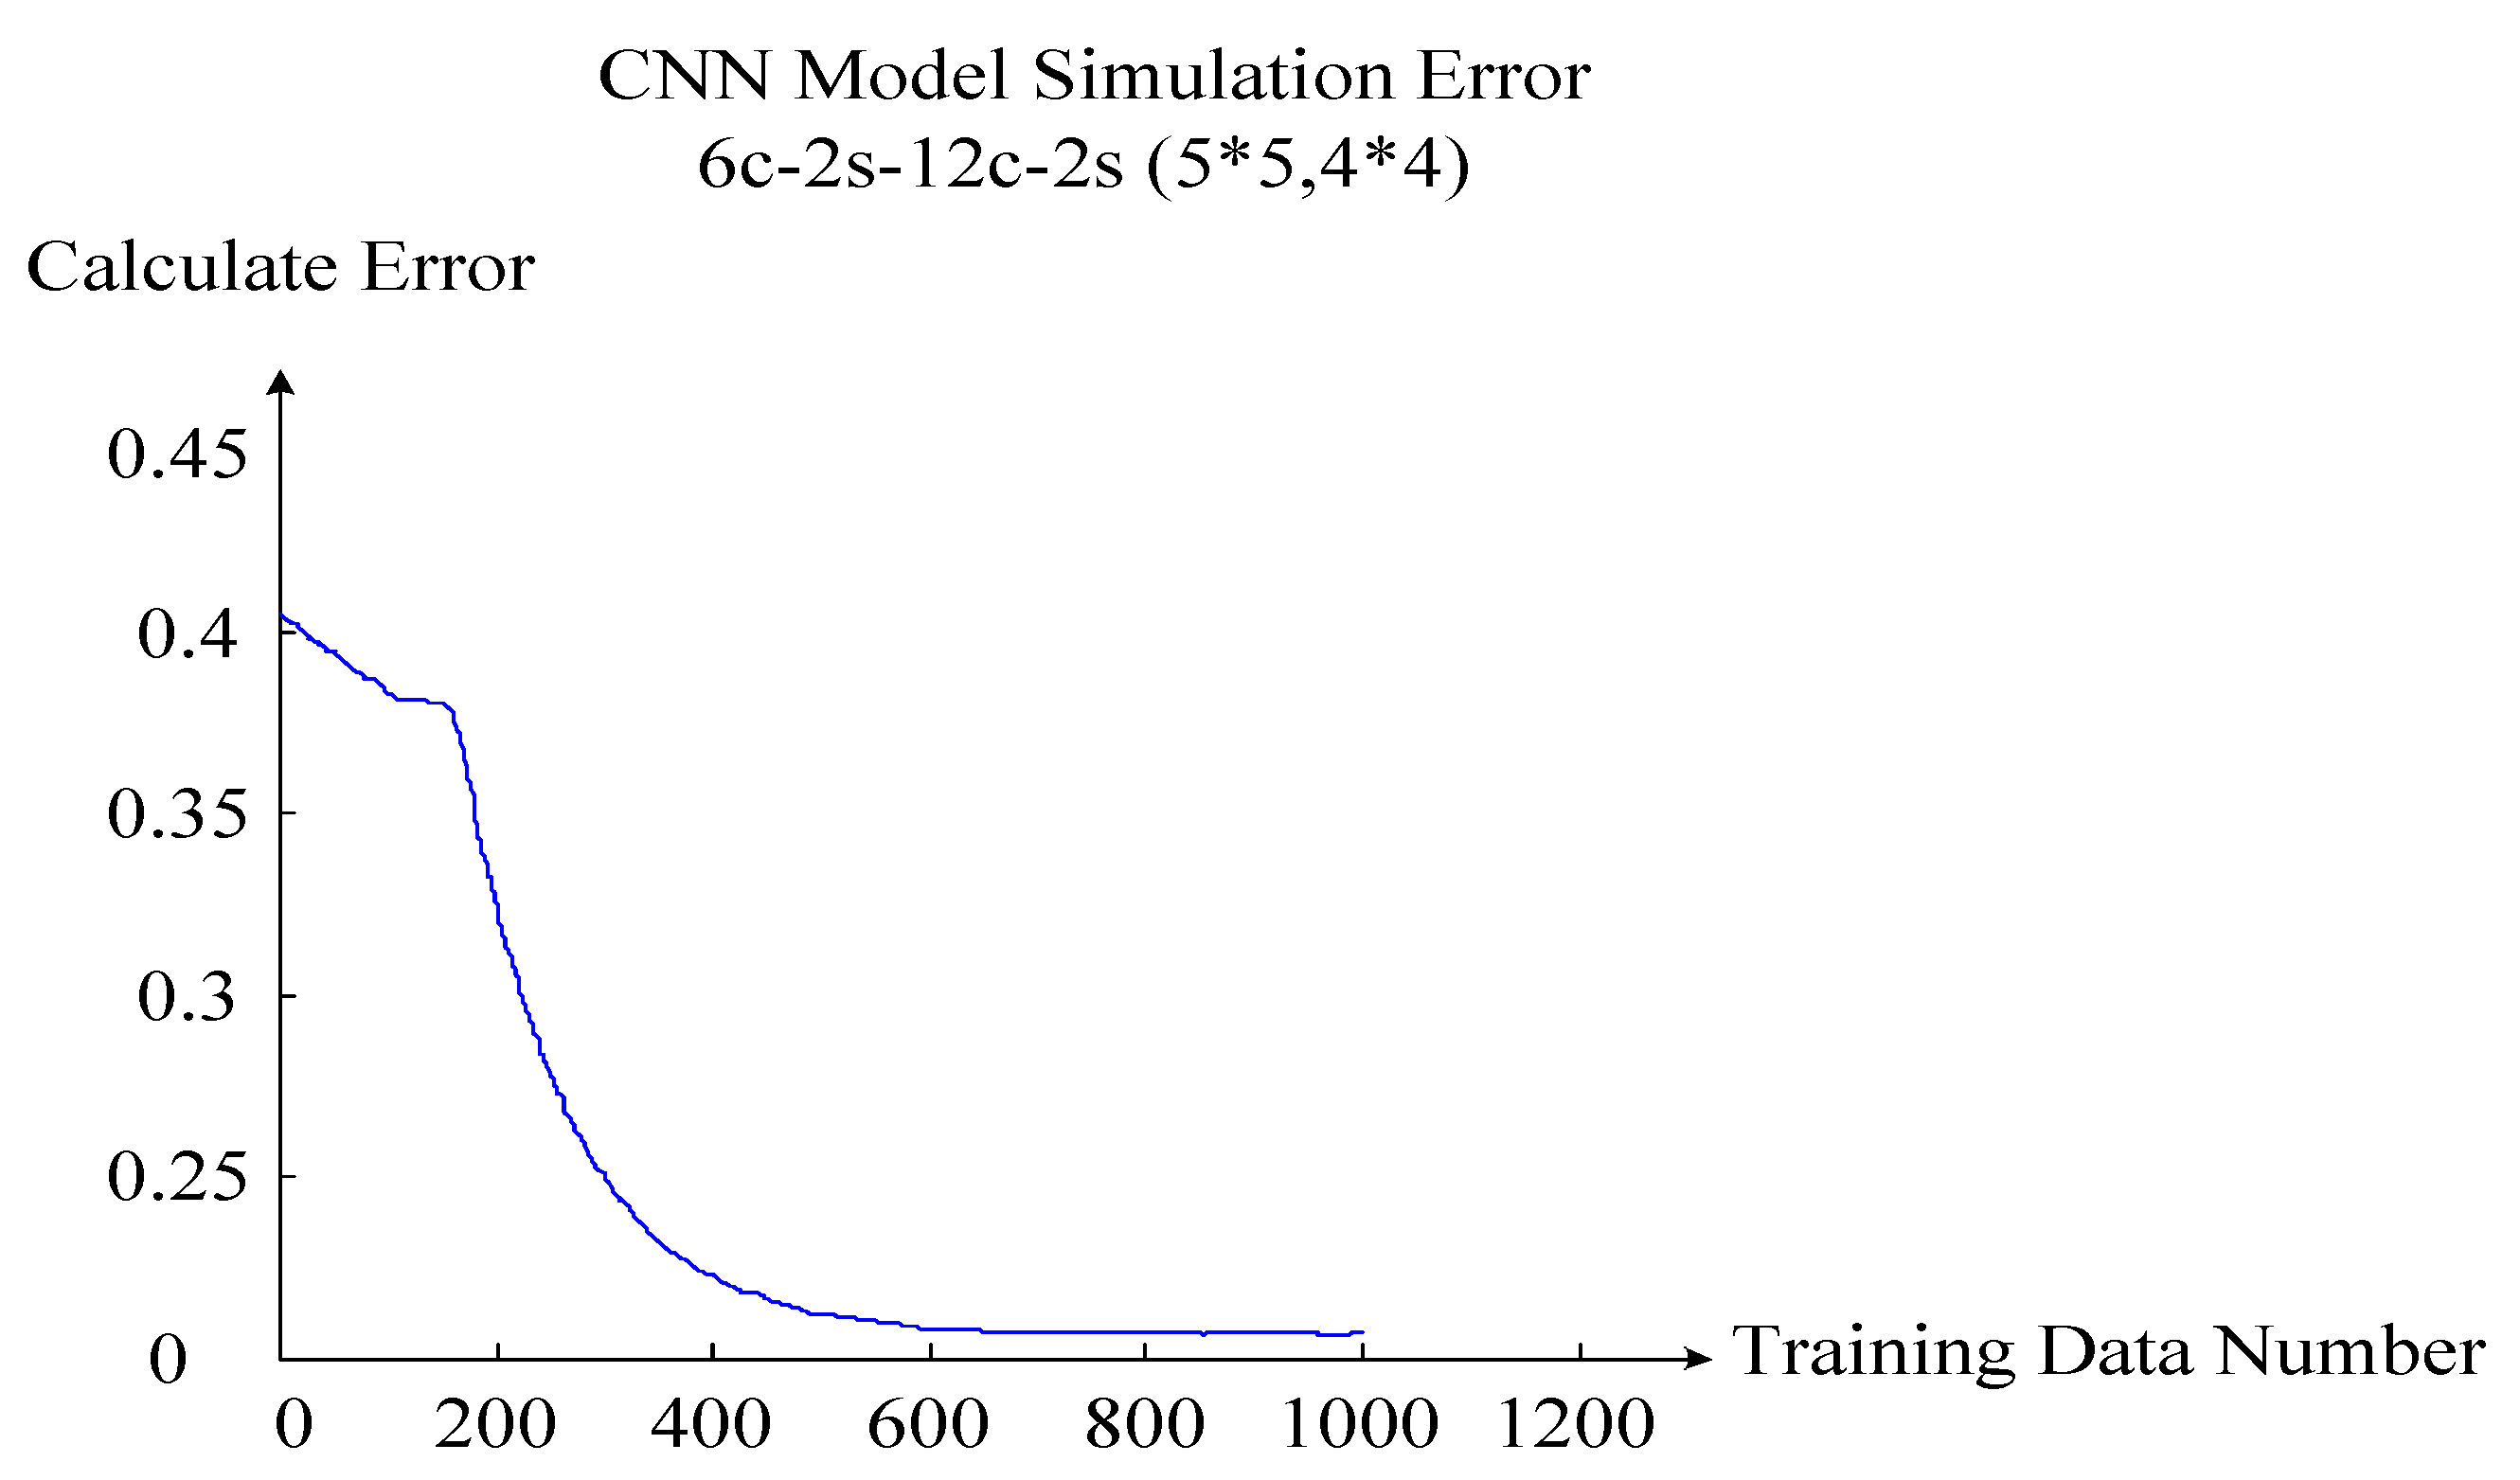
Figure 9, the red box parts on the left and right represent the input layer and the output layer, and the blue box parts in the middle represent the convolution layer and the sampling layer. Judging from the overall structure of the CNN network, there is only one input layer and one output layer, but there can be many convolution layers and sampling layers. In the English 10-machine 39 node system, there are 39 nodes and 46 branches. Therefore, the input data structure is 38 × 46, and the output data structure is 1 × 4. In this CNN network structure, there are two convolution layers and two sampling layers that appear in pairs. The CNN network structure is 6c-2s-12c-2s. 6c indicates that the first convolution layer has six layers. 2s represents the first sub-sampling layer, and the sub-sampling layer and the convolution layer appear in pairs, so the first sub-sampling layer also has six layers, and the first sub-sampling layer data scale is 1/2 of the first convolution layer. 12c indicates that the second convolution layer has 12 layers. 2s represents the second sub-sampling layer, and the sub-sampling layer and the convolution layer appear in pairs, so the second sub-sampling layer also has 12 layers, and the second sub-sampling layer data scale is 1/2 of the second convolution layer.
Taking the English 10-machine 39 node system data as an example, the variation of data from the input layer to output layer is introduced. The input data structure is 38 × 46. After the first convolution layer with a feature structure of 5 × 5, the data structure becomes 34 × 42. The law of data structure change is as follows: 34 = 38 − 5 + 1; 42 = 46 − 5 + 1. After the first sub-sampling layer with a 2s structure, the data structure becomes 17 × 21. The law of data structure change is as follows: 17 = 34/2; 21 = 42/2. After the second convolution layer with a feature structure of 4 × 4, the data structure becomes 14 × 18. The law of data structure change is as follows: 14 = 17 − 4 + 1; 18 = 21 − 4 + 1. After the second sub-sampling layer with a 2s structure, the data structure becomes 7 × 9. The law of data structure change is as follows: 7 = 14/2; 9 = 18/2. Next, the 12-layer sampling layer two-dimensional matrix data is expanded to single one-dimensional data of the single-layer perception machine. The law of data structure expansion is as follows: 1st 7 × 9 → 1, 2, …, 63; 2nd 7 × 9 → 64, 65, …, 126; …; 12th 7 × 9 → 694, 695, …, 756. Finally, full connection between the 756 sets of data in the single-layer perception machine and the four sets of data in the output layer is established. Here, using the CNN algorithm, a set of sample data from the input layer to the output layer of the entire process of a CNN training simulation can be obtained. Multiple sets of sample data constantly repeat this training simulation process. The optimal CNN algorithm network structure is found by changing the structural parameters of the convolution layers and the sub-sampling layers. In summary, the first step is to complete and obtain the optimal CNN algorithm network structure through offline training. The optimal CNN algorithm network structure model is the online operation risk assessment model of the wind power system.
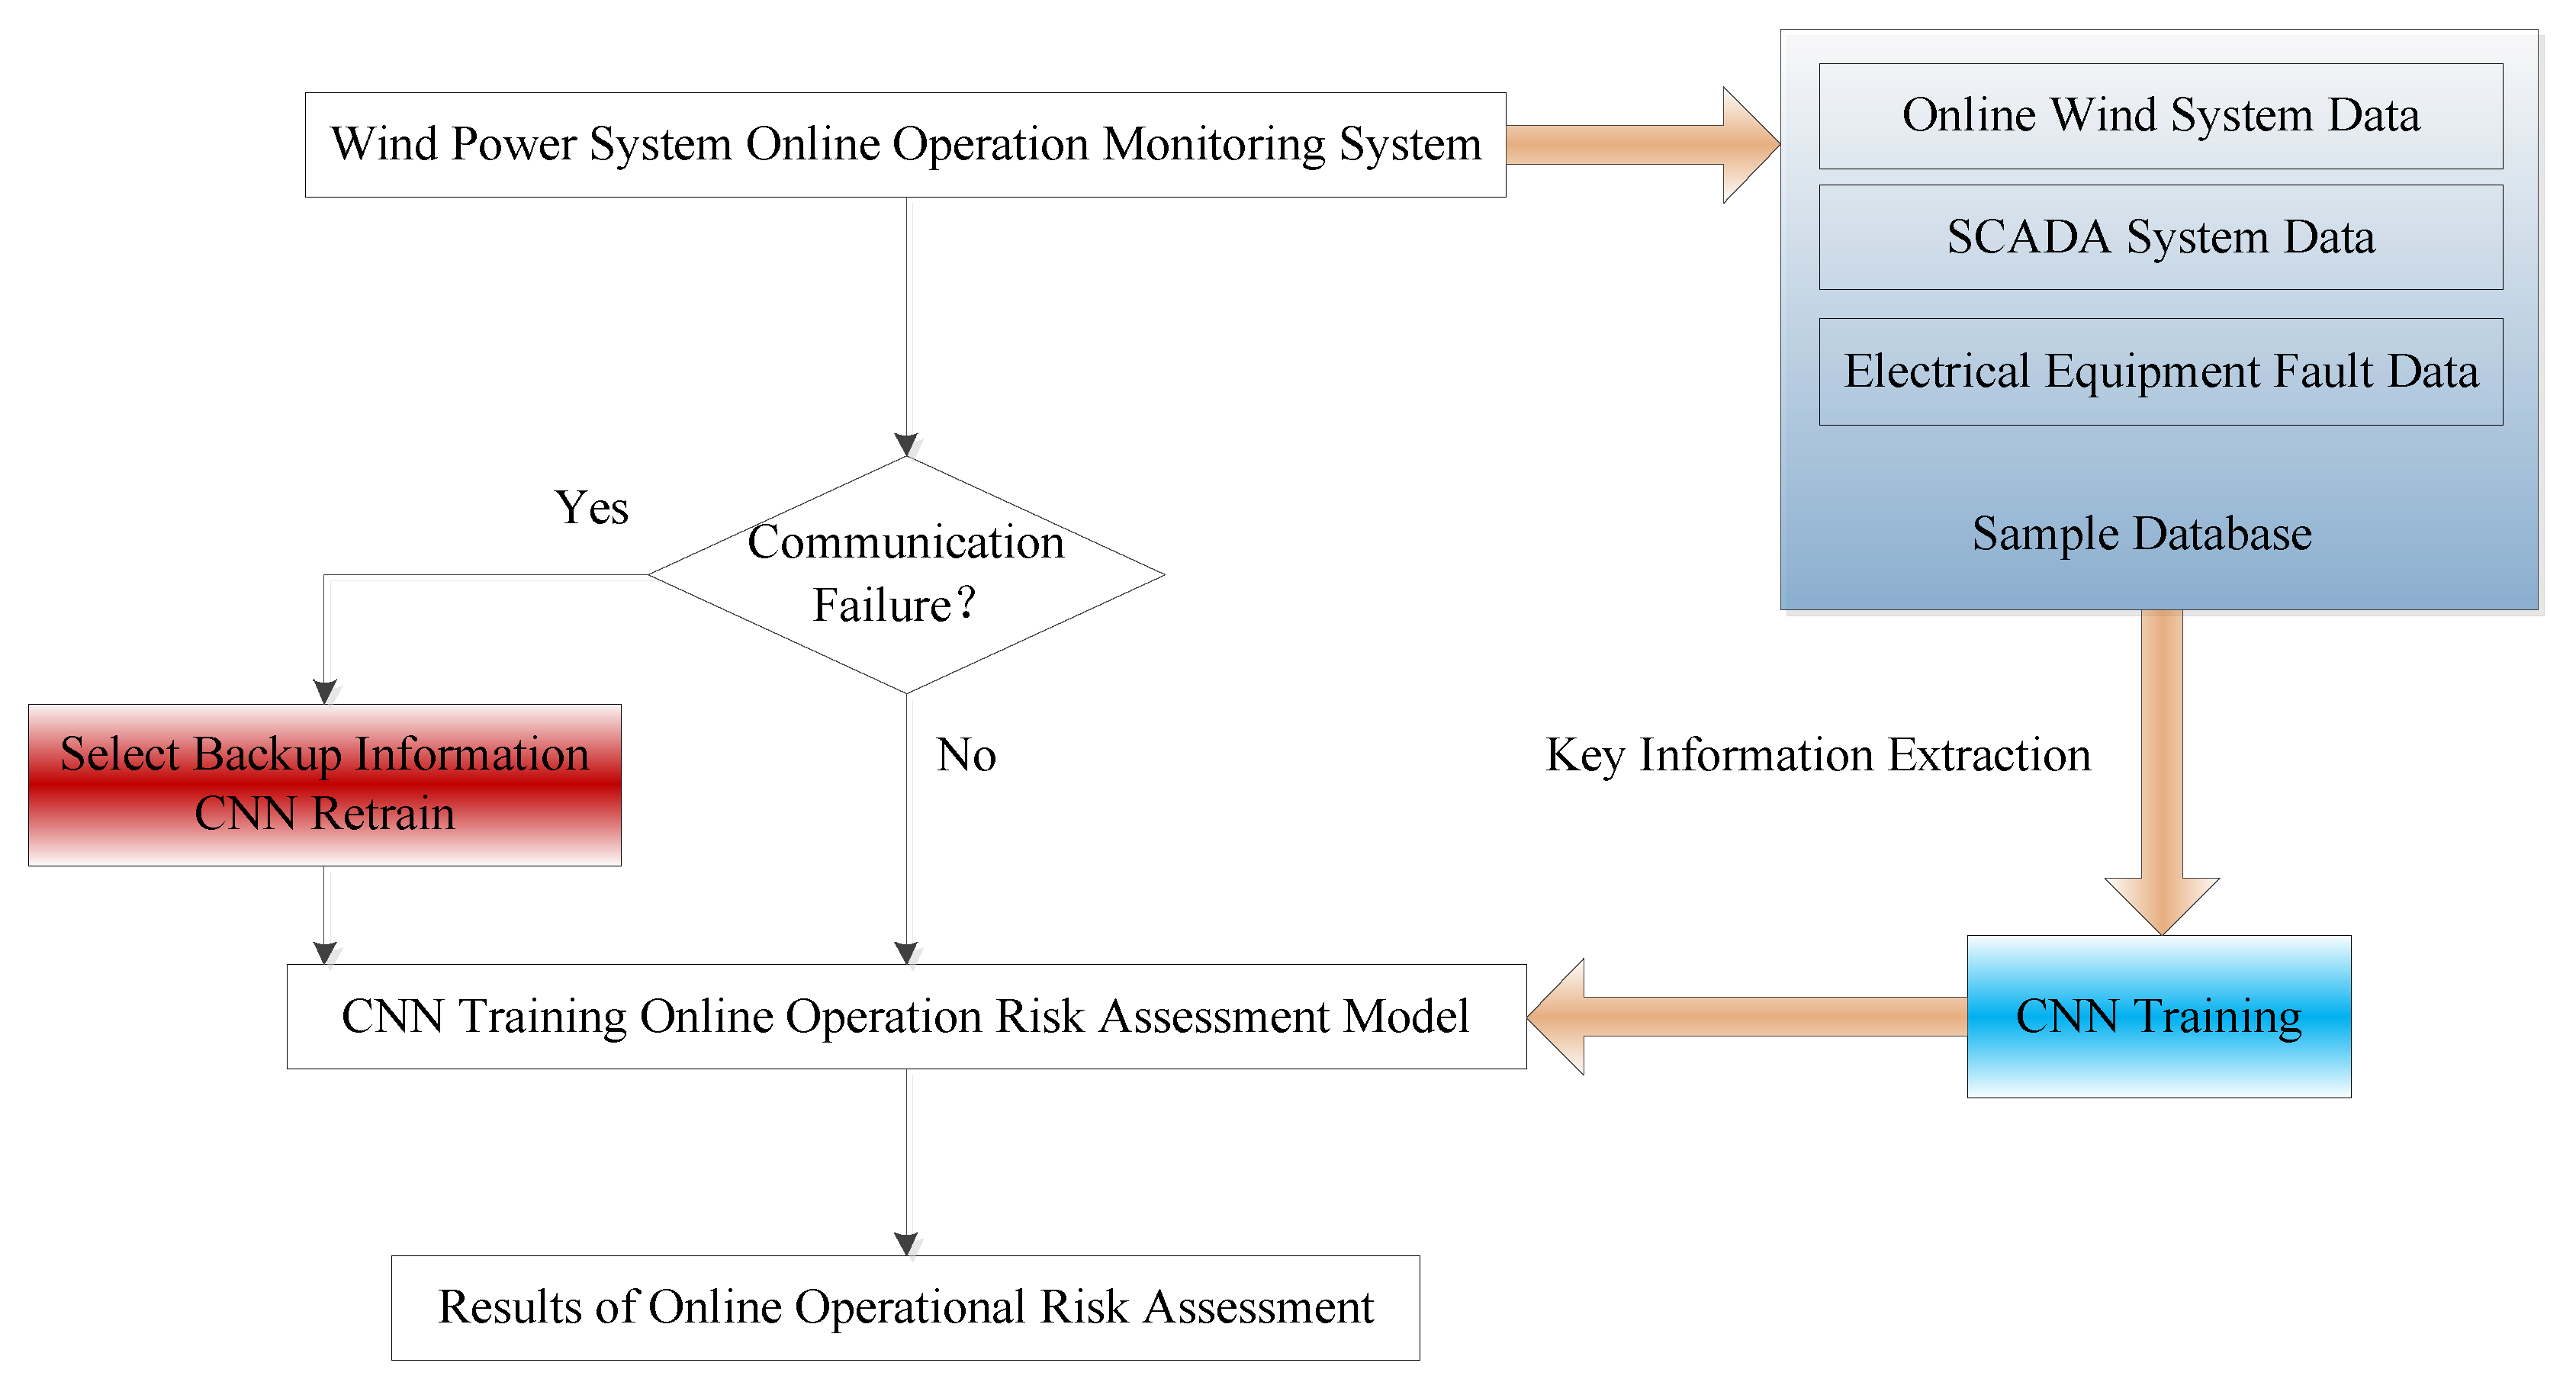
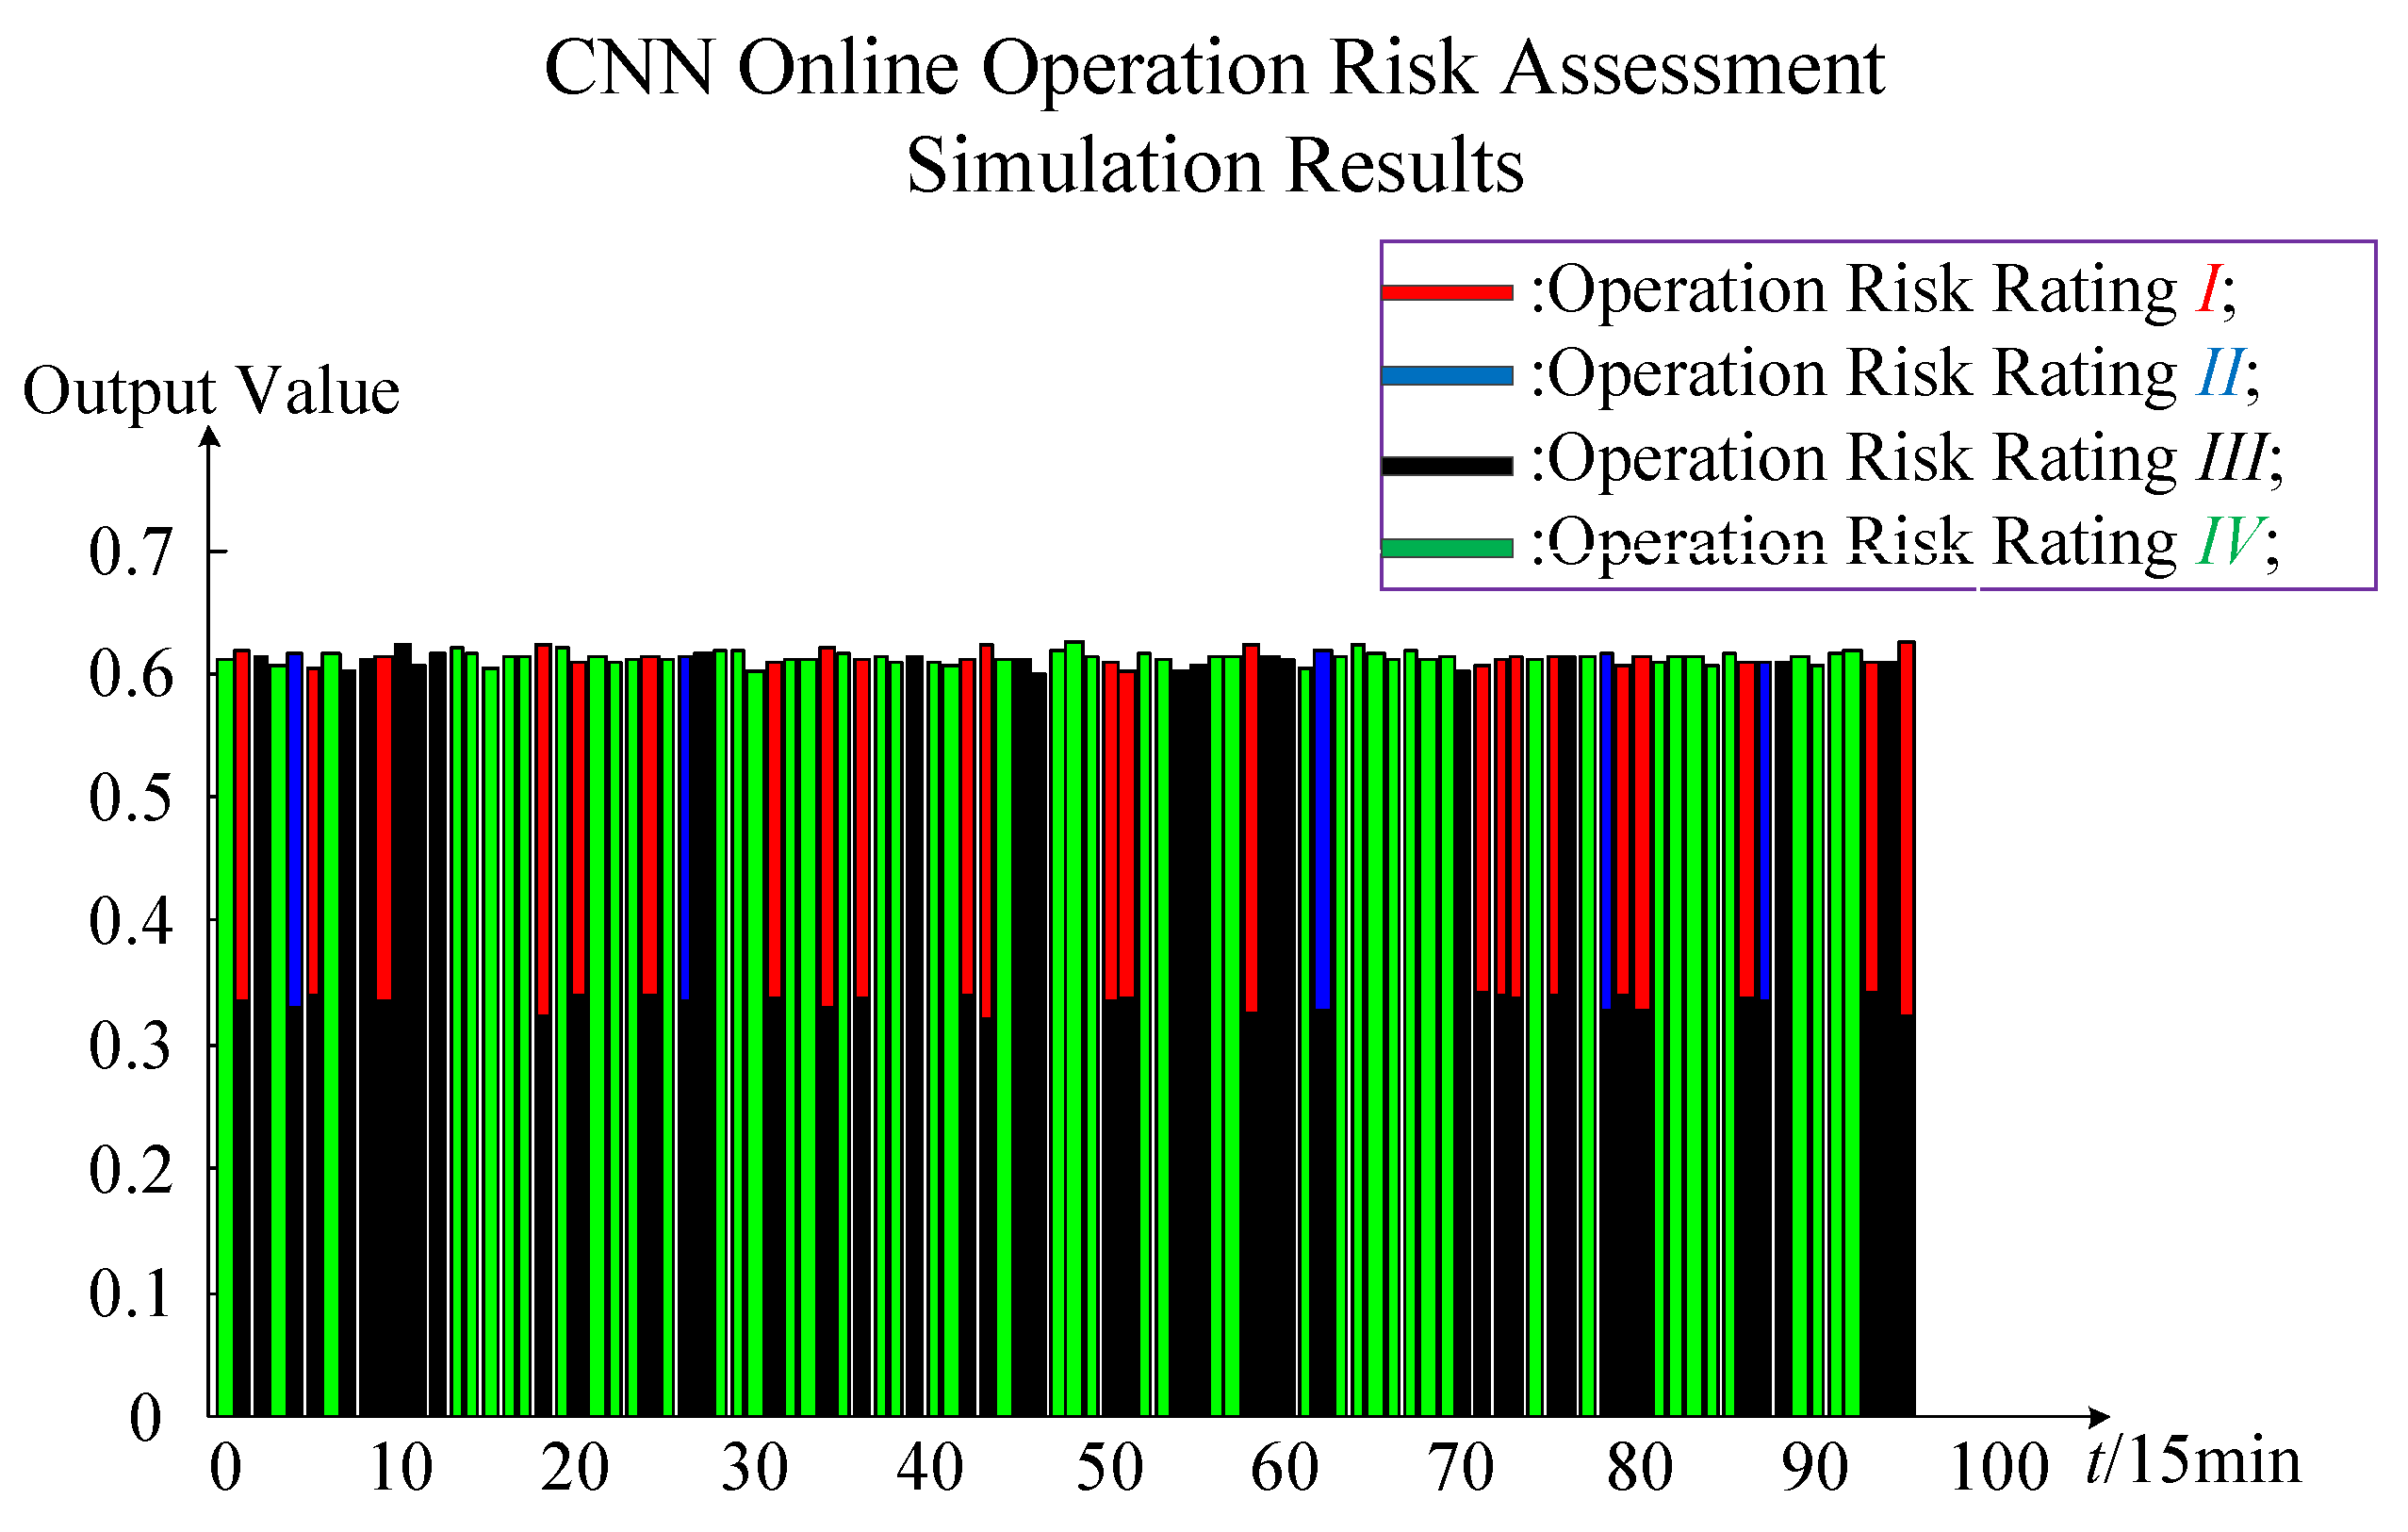
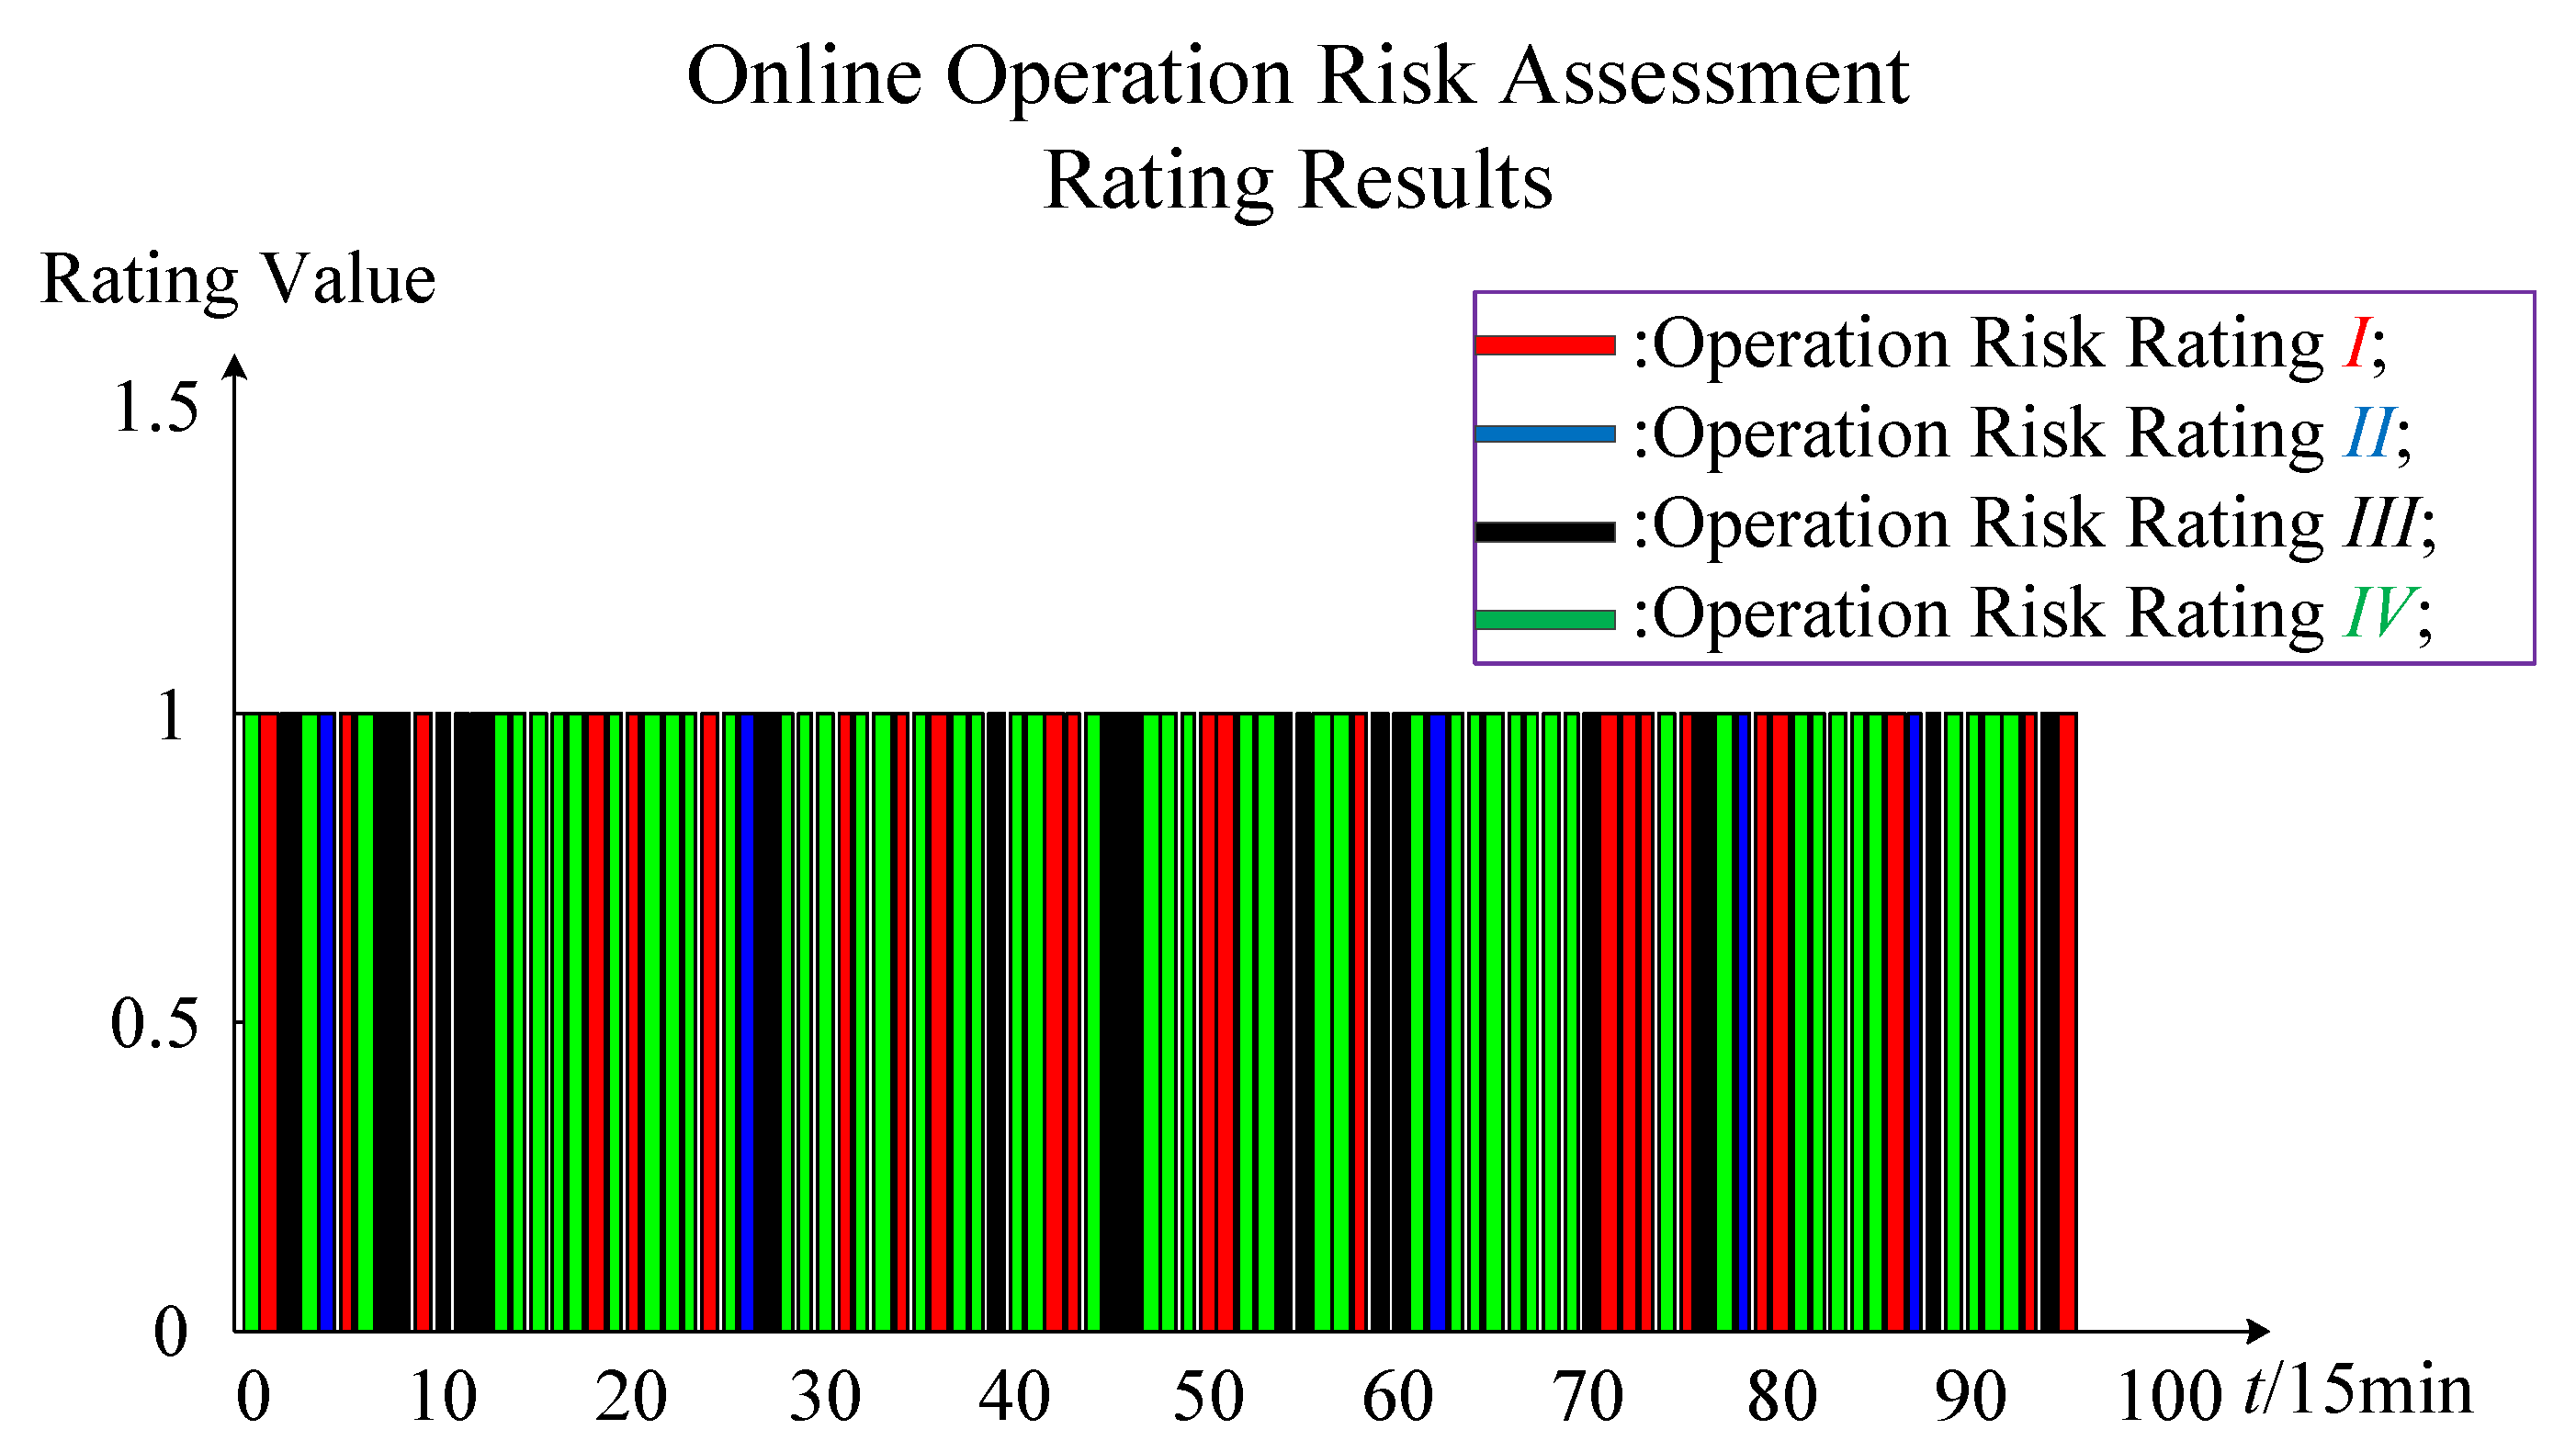
After obtaining the online operation risk assessment model, the second step is to apply the CNN training risk assessment model. The application of the CNN training model in the online operation risk assessment of wind power systems is shown in Figure 10.
In Figure 10, the application of the CNN training model consists of three main parts: Real-time data input for wind power system online monitoring data, the CNN training risk assessment model, and the results of online operation risk assessment. The real-time data input is real-time data with multiple random factors. Real-time data includes the wind farm output, load output, operation pattern, and electrical equipment failure rate. The CNN training risk assessment model is the optimal online operation risk assessment model for the completion of previous offline training. The results of online operation risk assessment are four calculated values in positions 1, 2, 3, and 4, respectively. For the maximum value in the first position, the risk rating is I; for the maximum value in the second position, the risk rating is II; for the maximum value in the third position, the risk rating is III; and for the maximum value in the fourth position, the risk rating is IV. In this way, it can reflect the online operation risk assessment of wind power system in real time.
In addition, after considering multiple random factors to ensure the accuracy of the risk assessment model, in the implementation of the CNN algorithm, the online operation risk assessment model of the wind power system is offline training, and the online application assessment model evaluates the operational risk in real time. Due to the direct application of offline training models in online applications and maintenance of the risk assessment model during the evaluation process, the time required for online running of the risk assessment is greatly shortened, which is conducive to the online application of the model.

5. Online Operation Risk Assessment Process

According to the method of online operation risk assessment of the wind power system of the convolution neural network considering multiple random factors presented in this paper, the evaluation process is shown in Figure 11. The specific assessment steps are as follows:
Step 1: The sample data of the online operation risk assessment is established based on the online wind power system, SCADA system, and the electrical equipment fault system;
Step 2: CNN training using sample data is conducted and a risk assessment model is established for the online operation of wind power systems;
Step 3: According to the real-time data of the online operation monitoring system of the wind power system, it is judged whether there is a communication failure in the system. If it does not exist, the online operation risk assessment model is applied to evaluate the current system status; otherwise, it is necessary to choose the backup data information to re-run the online CNN training risk assessment model, and then use the evaluation model to evaluate the current system status;
Step 4: The results of the online operation risk assessment of wind power systems are presented.

6. Case Study

In this paper, a typical power system with 39 nodes in 10 New England machines was used for simulation. The simulation system had 10 generators, 39 buses, 46 AC lines, 10 unit nodes, and 18 load nodes. Two wind farms with a capacity of 50 MW were connected to node 34 and node 37, respectively. The geographical location of the two wind farms was relatively close. In this paper, it was assumed that the output of the two wind farms fluctuated in the same proportion. At the same time, it was assumed that 18 loads also fluctuated proportionately. In this simulation experiment, it was assumed that only one branch road planned overhaul and two branch road unplanned pieces of equipment failed in an evaluation cycle.

6.1. Sample Data Composition for CNN Training

For the simulation test, the sample data for CNN training were established. The results of establishing the sample data were shown in the following table.
In Table 2, this test could produce C91C91C461 + 2 = 9 × 9 × 46 × 45 × 44/3 × 2 × 1 = 1,229,580 sample data. In order to take an integer, 120,000 sample data were considered here. Due to the large size of the data, the simulation system could not be stored at once, so it was divided into 20 storage sessions. Each time 60,000 sets of data were stored, 50,000 sets of sample data were training data and 10,000 sets of sample data were test data. See Table 3 for details.

6.2. CNN Training Wind System Online Operation Risk Assessment Model

The test platform parameters tested in this paper are shown in Table 4.
The 20 stored sample data were simulated with the same CNN network structure. The simulation results are shown in Figure 12 and Figure 13.
Figure 12 and Figure 13 gave 20 data sets for the calculated error and simulation times for training under the same CNN network structure, respectively. As can be seen from Figure 12, the seventh storage of data event by calculated error was the smallest. As can be seen from Figure 13, the simulation time of the sixth storage of data event was the smallest. When the CNN network training model was used, the accuracy rate was more important than the simulation time index, so the seventh storage of data event should be chosen for the next CNN training simulation.
The seventh storage of data event was trained and simulated under different CNN network structures. The simulation results are shown in Table 5.
In Table 5, the second column is the network structure of the CNN, the third is the convolution core, the fourth is the batch number, the fifth is the training time, the sixth is the calculation error rate, and the seventh is the CNN training simulation time. Through the online operation risk assessment model of the wind power system trained by the CNN network, the first concern is the calculation error rate in model training; the lower the calculation error rate, the more accurate the model. Then, there is a focus on the training simulation time. From the table, it can be seen that the structural design of the volume layer and sampling layer, the selection of volume core, batch data processing, and the training times had an impact on the accuracy and simulation time of the CNN training model. Combined with the above reasons, it can be seen that the 6c-2s-12c-2s (5 * 5, 4 * 4) CNN network model has the lowest calculation error rate. As shown in Figure 14, the calculation error rate of this model is within the acceptable range. Therefore, a CNN network model of 6c-2s-12c-2s (5 * 5, 4 * 4) was selected to train the wind power system to run online risk assessment data. The trained CNN model can be considered as the online operation risk assessment model of the system; that is, the wind power system can be used as real-time data online running risk assessment.
In Figure 14, with the increase of sample data, the calculation error rate was continuously reduced, and it finally tended to reach a stable calculation error rate value. The steady calculation error rate of the 6c-2s-12c-2s CNN model tended to be 0, which proves the accuracy of the online operation risk assessment model of the wind power system completed by CNN training.

6.3. CNN Evaluation Model Application

The online performance assessment model of the trained CNN wind system was applied to the real-time data system, as shown below. The wind power output obtained from the online monitoring system is shown in Figure 15 and the load output is shown in Figure 16. The topology of the grid frame changes is shown in Figure 17.
The wind power output, load output, and network structure topology in the online monitoring system were input into the online wind power system risk model completed by CNN training for evaluation simulation. The simulation results are as follows.
In Figure 18, the evaluation results of the online operation risk of the wind power system based on the CNN are given. Of the 96 scheduling times, the CNN model outputs four values at each time, and the first value represents the value of the run risk rating of I, which is expressed in a red box; the second value represents the value classified as operation risk II and is expressed in a blue box; the third value represents the value of the operation risk classification of III, which is expressed in a black box; and the fourth value represents the value of the risk of operation classified as IV and is expressed in a green box. At each scheduling time, four output values are represented at the same time. The maximum value of the four output values represents the running risk value of the moment, and the corresponding color represents the risk classification. As shown in the figure, the first scheduling time is a green box, indicating that the risk of operation is classified as level IV. By analogy, the graph shows the online run risk rating results of the CNN model simulation at 96 scheduling times.
In Figure 19, for the same wind power system, under the same wind power output, load output, and system operation mode, the online operation risk assessment results given by the conventional evaluation model were used. Of the 96 scheduling moments, there are four possible outputs at each point, corresponding to the run risk ratings of I, II, III, and IV, as shown in the same figure, in red, blue, black, and green, respectively. After the risk rating results are determined at each scheduling time, the corresponding time rating value is 1, which is expressed in the corresponding color box. For example, the first scheduling time is green, which means that the running risk is graded as level IV, and so on. The online running risk rating results of 96 scheduling times of the conventional evaluation model are given.
Comparing Figure 18 and Figure 19, it can be seen that the values output in Figure 18 and Figure 19 were different at the same scheduling time, but the results of the characterization of online running risk ratings were the same. As shown in Figure 18, the output value of the first scheduling time was 0.6104, and the online operation risk was rated as IV; in Figure 19, the output value of the first scheduling time was 1, and the online running risk was graded as level IV. It indicates that the online risk assessment results of the CNN model simulation were the same as the results of the conventional evaluation model. By analogy, it can be proved that the online operation risk assessment of the wind power system using the CNN model is correct.
In Table 6, the simulation time when using the CNN model and conventional evaluation model to evaluate the online operation risk of the wind power system is given. As can be seen from Table 6, the application of the CNN model simulation time is very short, being far less than the simulation time of the conventional evaluation model, indicating that the CNN model is more suitable for application in online operation risk assessment.

7. Conclusions

In this paper, the CNN was introduced into the online operation risk assessment of power systems, and an online operation risk assessment of the wind power system of the convolution neural network considering multiple random factors was proposed. By analyzing multiple random factors of online risk assessment of the wind power system, and extracting uncertain wind power output data, load fluctuations data, frequent changes in operation patterns, and electrical equipment failure rate data, combined with the expected target of online operation risk assessment, we built sample data for CNN training. After the CNN algorithm was used for offline training, the optimal online operation risk assessment model of the wind power system was obtained. Finally, the trained evaluation model was applied to the online real-time monitoring system data, and the results of the rapid and accurate online operation risk assessment were obtained. The model presented in this paper was verified by simulation by the standard network of 39 nodes of 10 machines of the New England system. The online risk assessment results of the CNN model simulation were the same as the results of the conventional evaluation model. For example, for the first dispatch time, the CNN model risk assessment value was 0.6104, which means the risk rating was IV and the conventional model value was 1, which means that the risk rating was IV; the application of the CNN model simulation time was 0.181 s, which is very short, and far less than the simulation time of the conventional evaluation model, for which the time was 297.315 s. The case studies indicate the following: (1) The CNN model was more accurate when considering multiple random factors, such as the wind power output uncertainty, load fluctuation, operation pattern change, and the electrical equipment failure rate, when compared to considering a single factor causing the operation risk model; (2) the online operation risk assessment model of the wind power system used the CNN for training implementation. The establishment of this assessment model was implemented in a data-driven manner instead of using the traditional physical assessment model, thus avoiding the process of establishing a complex physical assessment model and avoiding the simplification of multiple random factors. The original information of multiple random factors was preserved to ensure the accuracy of the model. The online operation risk assessment model of the wind power system presented in this paper adopts the CNN method, offline training sample data, and an online application training model. It was proved that the online operation risk assessment model is more rapid and suitable for online application.
In this paper, the evaluation model was more accurate and faster than the traditional online risk assessment model, but the application of the CNN in other aspects and the deeper algorithm of the CNN need to be studied further.

Author Contributions

Formal analysis, S.T.; investigation, Q.G., Y.B., and L.W.; methodology, S.T.; resources, Q.G., D.L. and H.Q.; supervision, Q.G., D.L. and H.Q.; writing-original draft, S.T.; writing-review and editing, S.T. All authors read and approved the final version of the manuscript.

Funding

This research received no external funding.

Acknowledgments

This work is supported by the National Key R & D Program of China (Technology and application of wind power/photovoltaic power prediction for promoting renewable energy consumption, 2018YFB0904200) and the eponymous Complement S & T Program of State Grid Corporation of China (SGLNDKOOKJJS1800266).

Conflicts of Interest

The authors declare no conflicts of interest.

References

  1. Wang, Y.L.; Tian, Y.H.X. NI Online Operation Risk Assessment of Power System Transmission Network Based on Line Parameter Measurement. J. Hubei Electr. Power 2018, 42, 6–11. [Google Scholar]
  2. Li, S.H. Comments on Online Risk Assessment of Grid Operation. J. Shandong Ind. Technol. 2018, 8, 177–178. [Google Scholar]
  3. Feng, Y.; Yun, Z.H.; Zhou, Q.; Sun, J.W. Online Risk Assessment and Preventive Control Considering Wind-power integration. J. Electr. Power Autom. Equip. 2017, 37, 61–68. [Google Scholar]
  4. Zhang, Y.G. The Research on Risk Assessment of Distribution Equipment Based on Condition Monitoring D; North China Electric Power University: Beijing, China, 2016. [Google Scholar]
  5. Liu, S.; Li, L.F.; Shi, X.Q. The Power Transmission System Reliability Evaluation System and Application Research. J. Hubei Elect. Power 2016, 40, 13–18. [Google Scholar]
  6. Liao, Y.F.; Yang, G.J.; Gao, W. Recognition Technology of Internal Overvoltage in Distribution Network Based on AD-CNN. J. High Volt. Eng. 2018, 12, 9–15. [Google Scholar]
  7. Wang, Z.H. Research and Realization of Intelligent Video Analysis Technology in Unmanned Substation D; School of Electric and Electronic Engineering: Beijing, China, 2017. [Google Scholar]
  8. Han, D.K. Deep Learning Based Power Switch Detection and State Recognition D; University of Electronic Science and Technology of China: Chengdu, China, 2018. [Google Scholar]
  9. Du, X.M.; Qin, J.F.; Guo, S.Y. Text Mining of Typical Defects in Power Equipment. J. High Volt. Eng. 2018, 44, 1078–1084. [Google Scholar]
  10. Lv, N. Research on the Surveillance System of Preventing from External Damage for Transmission Line Based on Deep Learning D; Harbin Engineering University: Harbin, China, 2018. [Google Scholar]
  11. Niu, Z.W.; Yu, Z.Y.; Li, B. Short-term Wind Power Forecasting Model Based on Deep Gated Recurrent Unit Neural Network. J. Electr. Power Autom. Equip. 2018, 38, 36–42. [Google Scholar]
  12. Cui, S.J. Research on Power Load Forecast and Dispatch Based on Neural Networks D; Qiqihar University: Qiqihar, China, 2015. [Google Scholar]
  13. Shi, W.F. Learning Algorithm for CNN Generator Modeling. J. Electr. Power Autom. Equip. 2007, 27, 9–13. [Google Scholar]
  14. Wang, W.G.; Tian, B.; Liu, Y. Study on the Electrical Devices Detection in UAV Images Based on Region Based Convolutional Neural Networks. J. Geo-inf. Sci. 2017, 19, 256–263. [Google Scholar]
  15. Huang, W.Q.; Zhang, F.Z.; Li, P. Exploration and Application on Faster R-CNN Based Insulator Recognition. J. South. Power Syst. Technol. 2018, 12, 22–27. [Google Scholar]
  16. Platt, J.C. Convolutional networks for speech detection C INTERSPEECH 2004 ICSLP. In Proceedings of the 8th International Conference on Spoken Language Processing, Jeju, Korea, 4–8 October 2004. [Google Scholar]
  17. Chen, Y.N.; Han, C.C.; Wang, C.T. A CNN-based face detector with a simple feature map and a coarse-to-fine classifier Withdrawn. J. IEEE Trans. Pattern Anal. Machine Int. 2007, 99, 1. [Google Scholar] [CrossRef]
  18. Wu, Z.G. Application of Convolutional Neural Networks in Image Classification D; University of Electronic Science and Technology of China: Chengdu, China, 2015. [Google Scholar]
  19. Qu, J.Y.; Sun, X.; Gao, X. High-resolution remote sensing image target recognition based on CNN model. Foreign Electr. Meas. Technol. 2016, 6, 845–850. [Google Scholar]
Figure 1. Power output curve.
Processes 07 00464 g001
Figure 2. Load power curve.
Processes 07 00464 g002
Figure 3. Network topology.
Processes 07 00464 g003
Figure 4. Convolutional neural network (CNN) structure.
Processes 07 00464 g004
Figure 5. Framework process of the online operation risk assessment.
Processes 07 00464 g005
Figure 6. Acquisition process block diagram.
Processes 07 00464 g006
Figure 7. Generation process block diagram.
Processes 07 00464 g007
Figure 8. Operation risk sample data generation principle diagram.
Processes 07 00464 g008
Figure 9. Training structures diagram.
Processes 07 00464 g009
Figure 10. Application of the convolution neural network (CNN) training model.
Processes 07 00464 g010
Figure 11. Method of the online operation risk assessment.
Processes 07 00464 g011
Figure 12. Error of each data number.
Processes 07 00464 g012
Figure 13. Time of each data number.
Processes 07 00464 g013
Figure 14. Model simulation calculated error.
Processes 07 00464 g014
Figure 15. Wind farm online output.
Processes 07 00464 g015
Figure 16. Load online output.
Processes 07 00464 g016
Figure 17. Diagram of the grid network topology.
Processes 07 00464 g017
Figure 18. Online operation risk assessment simulation results.
Processes 07 00464 g018
Figure 19. Operation risk assessment rating results.
Processes 07 00464 g019
Table 1. Operation risk rating.
Risk RatingGeneral AccidentsLarger AccidentsMajor AccidentsParticularly Significant Accidents
Ki Range<7%7–10%10–30%>30%
SymbolIIIIIIIV
Table 2. Sample data generation.
Feature VariablesVariable Value RangeArranged Combination Numbers
Wind Farm Output Pw(0.2/0.3/0.4/0.5/0.6/0.7/0.8/0.9/1.0) * 50 MW9 kinds
Load Output PL(0.8/0.85/0.9/0.95/1.0/1.05/1.1/1.15/1.2) * PLN9 kinds
Planned Maintenanceri1 = 1, Ri1 = ∞ΩC461 = 46 kinds
Unplanned Equipment Failurerj1 = 1, Rj1 = ∞Ω; rj2 = 1, Rj2 = ∞ΩC452 = 990 kinds
Risk RatingI, II, III, IV4 kinds
Table 3. The sample data.
Input/GroupsOutput/Groups
Training Data38 × 46 × 50,0004 × 50,000
Test Data38 × 46 × 10,0004 × 10,000
Table 4. The test platform.
ProjectParameter
System VersionWindows 10 Pro. 64-bit
CPUIntel(R) Core (TM) i5-6200U
Processing Speed2.40 GHz
RAM8 GB
Table 5. The different CNN network simulations.
No.Network StructureConvolution CoreBatch NumberTraining TimeCalculate Error RateTraining Time/s
16c-1s-12c-1s3 * 3, 3 * 35020.6776471.331
26c-1s-12c-1s5 * 5, 5 *55020.3402661.027
36c-1s-12c-1s7 * 7, 7 * 75020.6776967.433
46c-1s-12c-1s4 * 4, 5 * 55020.0402661.670
56c-1s-12c-2s4* 4, 4 * 45020.3402440.17
66c-1s-12c-2s5 * 5, 5 * 55020.6776608.454
76c-2s-12c-1s5* 5, 5 * 55020.3402248.144
86c-2s-12c-1s5 * 5, 4 * 45020.3204202.517
96c-2s-12c-2s5* 5, 4 * 45020.0016197.475
106c-2s-12c-2s7 * 7, 5* 55020.0502278.023
111c-1s-1c-1s1 * 1, 1 * 15020.320510.395
126c-1s-12c-1s4 * 4, 4 * 410020.3402575.209
136c-1s-12c-1s4* 4, 4 * 450020.3102580.214
146c-1s-12c-1s4* 4, 4 * 450100.3402296.052
156c-2s-12c-2s5 * 5, 4 * 450100.0010287.563
166c-2s-12c-2s5 * 5, 4 * 4500100.0021190.264
Table 6. Operation risk assessment elapsed time.
Elapsed Time
Apply CNN Model0.181 s
Regular Assessment Model297.315 s

