Article

Energy Storage Deployment and Benefits in the Chinese Electricity Market Considering Renewable Energy Uncertainty and Energy Storage Life Cycle Costs

1
School of Economics and Management, Changsha University of Science and Technology, Changsha 410076, China
2
Faculty of Economics, M.V. Lomonosov Moscow State University, 119991 Moscow, Russia
*
Author to whom correspondence should be addressed.
Processes 2024, 12(1), 130; https://doi.org/10.3390/pr12010130
Submission received: 15 November 2023 / Revised: 27 December 2023 / Accepted: 29 December 2023 / Published: 3 January 2024

Abstract

:
The construction and development of energy storage are crucial areas in the reform of China’s power system. However, one of the key issues hindering energy storage investments is the ambiguity of revenue sources and the inaccurate estimation of returns. In order to facilitate investors’ understanding of revenue sources and returns on investment of energy storage in the existing electricity market, this study has established multiple relevant revenue quantification models. The research methodology employed in this paper consists of three main components: Firstly, we established a revenue model and a cost model for energy storage participation in the electricity market. These models focus on arbitrage revenue, subsidy revenue, auxiliary services revenue, investment cost, operational and maintenance cost, and auxiliary service cost of energy storage. Subsequently, we utilized an enhanced Grey Wolf Optimizer algorithm to solve the optimization problem and maximize revenue, thus obtaining the optimal capacity and revenue scale of energy storage in the electricity market. Finally, we compared the whole-lifecycle ROI of different energy storage options in various scenarios. The evaluation results demonstrate that the difference between peak and off-peak loads impacts the investment demand and charging/discharging depth of energy storage. In addition, the discrepancy between peak and off-peak prices affects the arbitrage return of energy storage. These two factors can serve as criteria for energy storage investors to assess their return expectations. When solely considering economic returns and disregarding technical factors, pumped storage energy storage emerges as the most suitable mechanical energy storage option requiring investment. The main contribution of this study lies in the estimation of the lifecycle investment returns for various energy storage technologies in the Chinese electricity market, thus providing valuable insights for the investment and operational practices of market participants.

1. Introduction

In recent years, the global power sector has witnessed rapid development in energy storage technologies, with energy storage being widely applied across multiple aspects of the power system [1]. Currently, China primarily employs energy storage technology to ensure equilibrium and growth in the electric power industry. The returns that energy storage can obtain come from three domains: capitalizing on the price differentials during peak and off-peak periods, participating in the auxiliary services market, and obtaining policy subsidies [2]. However, it is worth noting that China’s power auxiliary services market is still in its early stage of development, and the subsidy policies for energy storage are subject to periodic variations and regional differences. Existing research predominantly focuses on assessing the revenue derived from arbitrage and subsidy mechanisms associated with energy storage. Few studies have comprehensively appraised the overall revenue and return on investment for different energy storage types in the power market. Moreover, limited attention has been given to analyzing revenue fluctuations across various power markets during different seasons. These factors not only serve as crucial decision-making factors for energy storage investors, but also act as key incentives for promoting investments in energy storage.

1.1. Literature Review

Numerous studies have been conducted regarding energy storage configurations. Li et al. posited that different energy storage technologies possess their own set of advantages and disadvantages, contingent upon their characteristics, applicable scenarios, and performance [3]. They provided an overview of the development of different energy storage technologies in China and their application in the electricity market, highlighting the need to consider factors such as the uncertainty of wind and solar power output when selecting energy storage options, but without presenting specific models for selection or revenue estimation. Wang et al. analyzed the operational characteristics of energy storage systems in peak and frequency regulation scenarios [4]. They constructed a comprehensive energy system optimization model with the objective of minimizing daily operational costs and utilized mixed-integer linear programming methods for the solution. Their study revealed that the lithium iron phosphate battery exhibited superior performance, followed by the lithium titanate battery. However, this study only investigated the overall cost changes resulting from energy storage participation in the power system, without conducting accurate assessments of the costs and benefits specific to energy storage itself. Ma et al. formulated an optimization allocation method for capacity, utilizing the optimal annual average comprehensive cost of a hybrid energy storage system as the objective function [5]. They employed a genetic algorithm to determine the capacity allocation ratio of the battery energy storage system. This study focused on determining the energy storage capacity in the selection process, with the objective of maximizing the profitability of photovoltaic power plants as the objective function. It specifically considered how energy storage could smooth the power curve of photovoltaic generation, without treating energy storage as an independent operating entity. Li et al. employed a quantum center of gravity inverse variational particle swarm algorithm to resolve the capacity allocation scheme for a community hybrid BESS, comprising retired power batteries and supercapacitors [6]. They only addressed the capacity estimation of known energy storage types and did not analyze the selection of energy storage types. Xiong et al. appraised the optimal allocation problem of battery energy storage from a cost analysis perspective, considering investment costs, tariff revenues, policy subsidies, and additional benefits of energy storage [7]. By constructing an investment return model for battery storage, with the objective of maximizing the net benefit in the distribution network system, they compared and analyzed various configuration schemes for battery energy storage and their corresponding investment returns. Their study aligned with the direction of this paper, but its limitations lay in the analysis being limited to arbitrage benefits and subsidy benefits of energy storage, without considering the ancillary service benefits of energy storage. Additionally, the calculation process was overly simplistic and did not account for the practical constraints of the power system. Mohammad et al. developed a battery energy storage planning model that accounted for capacity degradation, utilizing the mixed integer linear programming (MILP) method [8]. They proposed a set of formulas to determine the size of the battery storage, the charging and discharging process, the depth of discharge, and the replacement year, with the aim of minimizing total dispatch costs and enhancing the accuracy and economic feasibility of the battery storage sizing method. They focused on the optimal capacity estimation of battery energy storage and did not address other emerging energy storage technologies. Furthermore, its profit function was not applicable to the Chinese electricity market. Sayfutdinov et al. studied the optimal siting of lithium-ion battery energy storage devices using mathematical planning methods [9]. Their research employed mathematical optimization techniques such as convex programming and mixed-integer programming. It specifically addressed the degradation challenges associated with battery energy storage, considering factors such as charging and discharging cycles and temperature. However, it simplified the description of revenue types and cost models related to energy storage. It focused solely on battery energy storage, neglecting other emerging storage technologies, and its profit function was not suitable for the Chinese electricity market. Li et al. proposed a hierarchical optimization scheduling scheme for the energy storage-assisted deep peak shaving of thermal power units, which includes upper, middle, and lower optimization models [10]. They considered the economics of energy storage peak shaving from multiple perspectives and demonstrated the compensation methods and scale of energy storage participating in peak shaving. They presented a profit model for energy storage participation in ancillary services in the power sector, while other revenue streams and storage costs were left unanalyzed. Ye et al. designed a scheduling strategy to maximize the economic benefits of a wind, solar, and thermal storage joint system [11]. They explored the impact of adding energy storage on the overall economic efficiency of the power system. The study indirectly highlighted the various economic benefits and service types that energy storage could provide in the electricity market, but it did not construct a detailed analytical model. Energy storage was considered merely as a balancing component within the power system. Li et al. studied the cost fluctuations of joint peak shaving of energy storage and thermal power units but did not fully measure the cost of the energy storage equipment itself [12]. Kim and Shin investigated a BESS management strategy based on deep reinforcement learning that considers depth of discharge and state of charge range while reducing the total operating cost [13]. The study considered the lifecycle cost of battery energy storage, but the research perspective focused on the operational management of energy storage rather than the selection of types and did not encompass the investment returns and economic viability of energy storage. Annu et al. proposed a techno-economic analysis to examine the energy savings resulting from integrating DGs and BESS in the DN [14]. They found that the power losses are further reduced by implementing network reconfiguration to reduce the dependency of energy on the grid. However, there was a lack of economic analysis from the perspective of energy storage investors. Ryutaka et al. undertook a comparative cradle-to-grave lifecycle assessment of lithium-ion batteries (LIB) and lead-acid battery systems for grid energy [15]. They suggested three measures to improve the overall environmental impact results. For example, they increased the contribution of renewable energy sources in the use phase electricity mix and developed the recycling process of LIB. Their study predominantly relied on the statistical analysis of historical data, focusing on the comparison of factors influencing the lifecycle of energy storage, without conducting simulation modeling. Hunter et al. analyzed the lifecycle costs of 14 energy storage or flexible generation technologies, and concluded that pumped hydro, compressed air, and batteries are the best suited for 12 h discharge [16]. The study compared the full lifecycle costs of 14 different energy storage technologies based on existing statistical data. However, simulation modeling was not employed for estimation, and the data used were international, meaning they may differ from the cost data specific to energy storage investments in China.
Considering the existing literature on energy storage selection and profitability dimensions, it is commonly observed that studies focus on power systems or microgrids as research subjects, and analyze the economic changes brought about by energy storage participation in power operations. These studies often construct objective functions based on minimizing system-wide costs or minimizing load fluctuations, which provides significant inspiration for this research. However, the existing literature primarily focuses on the analysis of historical data as regards the articles that primarily focus on energy storage, with fewer studies utilizing simulation modeling. Most articles emphasize the economic viability of battery energy storage, while there is a scarcity of articles that provide a unified comparison of the economic viability of different energy storage technologies. In the existing literature, the categorization of revenue sources related to energy storage primarily focuses on arbitrage revenue and subsidy revenue, with inadequate statistical analyses of revenue from power ancillary services, and this fails to reflect the current state of the Chinese electricity market. The analysis of revenue sources for energy storage is scant, and thereby fails to effectively align with China’s existing market policies and offer recommendations for market investors.

1.2. Aims and Contributions

This study proposes a model for the optimal allocation of multiple types of energy storage in the electricity market. This model takes into consideration the uncertainties associated with wind and solar power, as well as the entire lifecycle costs of energy storage. The model aims to quantify the investment scale and return levels of energy storage in diverse electricity markets. We hope that this study can provide valuable insights and practical guidance for energy storage investors in China regarding operational models and investment returns. Additionally, we aim to inspire other scholars to engage in collaborative discussions on the application areas and operational approaches of energy storage.
The contributions of this paper are as follows:
(1)
Compared to other existing studies, this study focuses on the comprehensive assessment of revenue generation throughout the entire lifecycle of different types of energy storage systems in the Chinese power market. The primary contribution of this paper is in undertaking decision-making simulations for energy storage investments in the Chinese power market, and providing valuable insights related to investment and the operational practices of market participants;
(2)
Compared to the existing literature, the energy storage revenue assessment model constructed in this paper encompasses the majority of revenue sources related to energy storage in the current Chinese power market, providing a comprehensive statistical comparison of indicators. Furthermore, the improved Grey Wolf Optimizer algorithm employed in this paper represents an extension and enrichment of methodologies applied to optimization problems in the power market;
(3)
This paper, in constructing scenarios of energy storage in the Chinese power market, takes into account dual dimensions of different market types and different seasons. It determines that the revenue assessment of energy storage in the power market should be undertaken in a specific way according to specific scenarios. The research findings of this paper enrich the design of energy storage application scenarios, promoting the integration of model construction and practical implementations.

2. Methods and Models

2.1. Comprehensive Revenue Modeling of Energy Storage in the Electricity Market

Before the auxiliary service market for power in China was established, the revenue sources for energy storage devices were primarily twofold: arbitrage activities involving charging during off-peak hours and discharging during peak hours, as well as subsidies provided by the government to support the development of energy storage [2]. With the development of the auxiliary service market in China’s power sector, the role of energy storage and its economic value have been demonstrated. Energy storage devices primarily serve the purpose of balancing the power supply and demand in the electricity system and fulfilling peak shaving and frequency regulation services. Additionally, based on the operational conditions of the auxiliary service market in various provinces of China, energy storage can also fulfil system reserve and voltage regulation functions [17,18]. However, the currently measurable revenue sources related to auxiliary services from energy storage devices only include peak shaving, frequency regulation, and system reserve services. Therefore, in this study, we have constructed a revenue model for energy storage based on the five revenue sources observed in the Chinese power market.
f ( R ) = max ( R 1 + R 2 + R 3 + R 4 + R 5 C 1 C 2 C 3 )
Here,  f ( R )  is the comprehensive return earned by the energy storage investor over the full lifecycle, and  R 1  is the arbitrage gain of energy storage over the operating period;  R 2  is the gain from policy subsidies for energy storage;  R 3  is the peak gain obtained by energy storage during peaking service;  R 4  is the frequency regulation gain derived from the participation of energy storage in frequency regulation service;  R 5  is the standby gain derived from the provision of a rotating standby service by energy storage. The cost of energy storage consists of three components. Firstly, there are conventional fixed costs, which are one-time costs incurred during the investment in energy storage. Secondly, there are operational and maintenance costs, which represent the continuous costs incurred throughout the entire lifespan of the energy storage system. Lastly, there are auxiliary service costs, which are the additional costs incurred by energy storage when providing auxiliary services. Only frequency regulation services result in additional costs, while other services do not incur any [19]. C1 is the fixed investment cost of energy storage; C2 is the operation and maintenance cost of energy storage; C3 is the cost of the auxiliary services of energy storage.

2.1.1. Revenue Modeling of Energy Storage Operations

(1)
Energy Storage Arbitrage Revenue Model
The arbitrage profit model of energy storage, characterized by low charging during periods of low electricity market prices and high discharging during periods of high electricity market prices, aims to capitalize on the price difference to generate profits. In China, there are currently two types of electricity markets: the medium- to long-term market and the spot market. The main difference between these two markets lies in the shape of the electricity price curve. With the fulfillment of technical constraints, energy storage systems have the flexibility to participate in transactions within both markets.
R 1 , n , i = t = 1 24 [ P d c ( t )   D U M d c ( t ) P c ( t )   D U M c ( t ) ] f ( μ t )
Here,  R 1 , n , i  is the arbitrage income derived from energy storage on day i of year n. The arbitrage income from energy storage on day i of year n.   P c ( t )  and  P d c ( t )  is the charging and discharging power variable of the energy storage.  D U M c ( t )  and  D U M d c ( t )  are the charging and discharging state dummy variables of the energy storage, which take the value of 0 or 1.  f ( μ t )  is the electricity price curve of the electricity spot market, and  μ t  is the real-time electricity price at each moment.
The total arbitrage revenue derived from energy storage over the entire lifecycle is then:
R 1 = n = 1 N t = 1 I R 1 , n , i ( 1 + I n R 1 + d ) n
N  is the entire lifecycle of the energy storage system;  I  is the number of days of operation of the energy storage system in a year; considering the long operating cycle of energy storage, the inflation rate  I n R  is introduced with a discounted rated, and in this paper is set as the increase in the commodity price index.
Additionally, it is necessary to adhere to the charge/discharge state logic constraints of the energy storage system.
{ D U M c ( t ) + D U M d c ( t ) = 1 D U M c ( t ) D U M d c ( t ) = 0
(2)
Energy storage subsidy revenue model
The existing energy storage subsidy policy primarily revolves around capacity compensation, tariff subsidies, and cost reduction. In most cases, the settlement methods are converted into unit power subsidies, which are disbursed based on the quantity of energy discharged by the storage system. This study seeks to construct an energy storage subsidy revenue model.
R 2 , n , i = t = 1 24 P d c ( t ) D U M d c ( t ) μ s u b
R 2 = n = 1 N t = 1 I R 2 , n , i ( 1 + I n R 1 + d ) n
R 2 , n , i  is the subsidized revenue derived from energy storage on day i of year n μ s u b  is the government-subsidized electricity price.
(3)
Energy Storage Peaking Revenue Modeling
The peaking revenue of energy storage can be classified into two types. Firstly, the system can charge during off-peak hours to fulfill its deep peaking requirements, and subsequently receive compensation for this service. Secondly, the system can discharge power during peak hours to achieve peak shaving and obtain revenue accordingly.
R 3 , n , i = t = 1 24 P c s ( t ) D U M c ( t ) μ c s + t = 1 24 P d c ( t ) D U M d c ( t ) ( μ d c Δ μ t ) D U M ( μ )
R 3 = n = 1 N t = 1 I R 3 , n , i ( 1 + I n R 1 + d ) n
Here,  R 3 , n , i  denotes the daily peaking revenue acquired by the energy storage system.  P c s ( t )  represents the charging power executed by the system in response to the dispatch peaking demand. μcs signifies the compensation received by the system for deep peaking charging. μdc denotes the price of peak shaving and peak shifting compensation for spike loads.  Δ μ t  represents the average clearing spread of the energy storage system during charging and discharging on a given day (or the peak-to-valley spread on the given day if traded on the medium- and long-term market). Finally,  D U M ( μ )  is a binary variable indicating whether or not peak shaving compensation is implemented, with a value of 1 denoting “yes” and 0 denoting “no”.
To measure the peaking gains of energy storage, certain constraints must be satisfied, as not all charging power derived from energy storage corresponds to deep peaking power, and not all discharging power serves the purpose of peak shaving and peaking power. These constraints are defined as follows:
P c s ( t ) = θ c s Q t U e s U c s
D U M ( μ ) = { 1 , μ t μ 0 0 , μ t < μ 0
where  θ c s  represents the share of deep peaking power in the system load at moment t, and  Q t  denotes the total load of the system at moment t. In addition,  U e s  denotes the installed capacity of the energy storage equipment, and  U c s  represents the total installed capacity of various types of units capable of fulfilling the deep peaking obligation, i.e., the deep peaking power of the entire system is allocated based on the capacity share of the energy storage equipment in the deep peaking units. Moreover,  μ 0  denotes the Peak Load Threshold Price. If the average clearing price during the peak hour on a given day exceeds this threshold, compensation for peak shaving will be provided to the energy storage equipment, and it will discharge power to receive an additional compensation charge.
(4)
Energy Storage Frequency Modulation Revenue Model
During the charging and discharging process, the energy storage equipment can also complete the FM task and obtain FM gains, which are compensated based on the capacity of the energy storage that provides the FM service. The execution of this compensation depends on the inertia response index and the inertia response monthly correct action rate of the energy storage device during its operational month. These two parameters are derived from the actual system’s operation values in each province, which typically range between 90% and 100%. For the purpose of calculation convenience, this paper assumes that the system’s inertia response index and inertia response monthly correct action rate are both 95%. Therefore, the annual FM gain of the energy storage can be expressed as follows:
R 4 , n = 95 % 90 % 100 % 90 % U e s μ s p f 12 + 95 % 90 % 100 % 90 % U e s μ b p f N b p f 12
R 4 = n = 1 N R 4 , n ( 1 + I n R 1 + d ) n
where μspf is the monthly compensation price for small disturbances in FM compensation,  μ b p f  is the monthly compensation price for large disturbances in FM compensation, and  N b p f  is the monthly number of large disturbances.
(5)
Energy Storage Rotating Standby Revenue Model
Energy storage systems have the option to provide rotating standby services during off-peak hours and discharge during peak hours. Alternatively, they can offer rotating standby services during periods of smaller price increases. Assuming that the energy storage system can provide spinning standby services through all non-discharge hours following the completion of charging, the revenue model for energy storage providing spinning standby services is as follows:
R 5 , n , i = t = 1 24 P s p r μ s p r [ 1 S U M c ( t ) ] [ 1 S U M d c ( t ) ] + t = 1 24 P s p r μ s p r [ 1 S U M c ( t ) ] [ 1 S U M d c ( t ) ]
where  P s p r  is the winning bid capacity of the storage spinning reserve;  μ s p r  is the winning bid price of the storage spinning reserve;  P s p r  is the actual called capacity of the storage spinning reserve, and  μ s p r  is the called price of the storage spinning reserve. Since the capacity of the energy storage that participates in the spinning reserve must be of a dischargeable capacity, it needs to satisfy the constraints:
P s p r η c P c ( t ) P s p r P s p r
where ηc is the energy storage charging loss factor, which varies according to the type of energy storage.

2.1.2. Energy Storage Cost Modeling

(1)
Fixed cost model for energy storage
The fixed cost of energy storage comprises two components, capacity cost and power cost, which are dependent on the system’s rated capacity and rated charge/discharge power. Therefore, the fixed investment cost of energy storage is formulated as:
C 1 = C p max P + C U U e s
C 1  is the fixed investment cost of energy storage;  C p  is the cost of energy storage unit charging/discharging power;  C U  is the cost per unit capacity of energy storage.
(2)
Energy storage O&M cost model
Energy storage O&M costs are related to the charging and discharging power.
C 2 = n = 1 N C m max P ( 1 + I n R 1 + d ) n
C 2  is the total operation and maintenance cost of energy storage; Cm is the annual O&M cost per unit of charge/discharge power of the energy storage system.
(3)
Energy storage ancillary services cost model
Energy storage does not incur separate costs for providing peaking services. However, when offering frequency modulation services, the cost of storage O&M increases due to the need to respond to frequency modulation commands. Therefore, this cost must be measured separately. The cost of energy storage frequency modulation can be expressed through a first-order equation:
d Δ f d t = 1 2 H s ( Δ P d c ( t ) Δ P L ( t ) )
C 3 = C f Δ f
Δ f  denotes the frequency deviation;  H s  denotes the system equivalent inertial time constant;  Δ P d c ( t )  and  Δ P L ( t )  denote the change in energy storage output and the change in load, respectively;  C 3  represents the frequency modulation cost per unit mileage.

2.1.3. Energy Storage Operating Losses and Constraint Reduction

(1)
Energy conservation constraint: Considering energy losses, the energy storage system, operating under the objective of recycling, must adhere to charge/discharge conservation constraints in a single charge/discharge cycle.
η c t = 1 24 P c ( t ) = η c t = 1 24 P d c ( t )
(2)
Power constraints: When charging and discharging the energy storage system, the maximum charging and discharging power, as well as power constraints, must be satisfied. Here, the formula begins to undergo changes.
{ 0 P c ( t ) max P 0 P d c ( t ) max P P d c ( t ) U e s
(3)
System load constraints: The equivalent load of the system, incorporating energy storage, should not exceed the maximum load after the peak shaving effect is generated.
P ( t ) P d c ( t ) + P c ( t ) ( 1 λ ) max P ( t )
Here,  P ( t )  is the load of the system at time t, and  max P ( t )  is the maximum load of the system.
(4)
Charging and discharging time constraints: Since the energy storage system cannot be charged and discharged simultaneously during the same time period, it must also satisfy the following constraints:
D U M d c ( t ) D U M c ( t ) = 0
(5)
Energy storage system load ratio constraints:
Q soc , t = Q t U e s
Q soc , min Q soc , t Q soc , max
Here,  Q t  denotes the remaining power of the energy storage system in time period t Q soc , t  denotes the charge ratio of the energy storage system in time period t Q soc , min  denotes the lower limit of the charge ratio of the energy storage system;  Q soc , max  denotes the upper limit of the charge ratio of the energy storage system.

2.2. The Method for Solving the Energy Storage Revenue Model

In 2014, Mirjalili et al. proposed the Grey Wolf Optimizer (GWO) algorithm. This algorithm simulates the social hierarchy mechanism and population hunting behavior of grey wolf packs, aiming to surround and capture prey. Through iterative updates, the GWO algorithm seeks to obtain the optimal solution [20]. Since then, the GWO algorithm has been widely applied to solve optimization problems involving nonlinear variables. This method has achieved significant accomplishments in various fields, including optimization of integrated energy system configurations, evaluation of wind energy device performance, unmanned aerial vehicle (UAV) cruising, and many others [21]. The GWO algorithm exhibits superior convergence speed and optimal search accuracy when addressing optimization problems. Thus, this study employs the GWO algorithm to solve the optimal allocation of energy storage. The GWO algorithm classifies wolves into four levels, namely, α-wolf, β-wolf, δ-wolf, and ω-wolf, in descending order of hierarchy. The wolves in the first three levels primarily determine the movement direction of ω-wolves. Subsequently, based on the feedback information derived from ω-wolves, α-wolves, β-wolves, and δ-wolves, we decide whether to update their positions. Upon completion of the algorithm’s iteration, the positions of α-wolf, β-wolf, and δ-wolf represent the three optimal solutions, while the position of ω-wolf serves as a candidate solution.
The search and encirclement behavior of the grey wolf in relation to its prey can be expressed as follows:
D = | A X P , t X t |
X t + 1 = X P , t B D
where D is the distance between the gray wolf and the prey; A and B are coefficient vectors; t is the current iteration number;  X P , t  is the position of the prey at the tth iteration;  X t  is the position of the gray wolf at the tth iteration.
The coefficient vectors A and B can be computed as
A = 2 r 1
B = μ ( 2 r 2 1 )
where the modulus of  γ 1  and  γ 2  is a random number in the range [0,1];  μ  is the convergence factor,  μ = 2 ( 1 t T ) , i.e.,  μ  decreases linearly from 2 to 0 as the number of iterations t increases  μ ; T is the maximum number of iterations.
During the feeding process, the ω-wolf updates its position using the positional information of α-wolf, β-wolf, and δ-wolf. This process can be represented using the following mathematical model:
{ D α = | A 1 X α X | D β = | A 2 X β X | D δ = | A 3 X δ X |
{ X 1 = | X α B 1 D α | X 2 = | X β B 2 D β | X 3 = | X δ B 3 D δ |
X t + 1 = 1 3 ( X 1 + X 2 + X 3 )
where  D α D β  and  D δ  are the distances of α-wolf, β-wolf and δ-wolf from other wolves, respectively;  X α X β , and  X δ  are the positions of α-wolf, β-wolf, and δ-wolf, respectively.

2.2.1. Improved Gray Wolf Optimization Algorithm

Despite the advantages of the GWO algorithm, such as its minimal adjustment parameters, low implementation difficulty, and high stability, it is susceptible to falling into local optimal solutions during the later stages of evolution. Therefore, this study adjusts the strategy for updating the convergence factor and displacement.
(1)
Nonlinear convergence factor adjustment strategy
In the traditional Grey Wolf Algorithm, the convergence factor decreases linearly as the number of iterations increases. However, linear methods often fail to achieve optimality. Therefore, this study proposes a quadratic variation of the convergence factor with respect to the number of iterations, which can be expressed as:
μ = 2 2 ( t T ) 2
(2)
Adaptive displacement strategy
In the GWO algorithm, if all three sets of solutions, namely, α-wolf, β-wolf, and δ-wolf, fall into local optima, it becomes challenging for the entire wolf pack to discover the global optimal solution. To clarify the roles of individuals and enhance the algorithm’s global search ability, this study designates β-wolf and δ-wolf as local variables. Therefore, the following adaptive displacement strategy is proposed:
X t + 1 = 1 3 ( X 1 + X 2 + X 3 ) ( 1 t T ) + X 1 t T

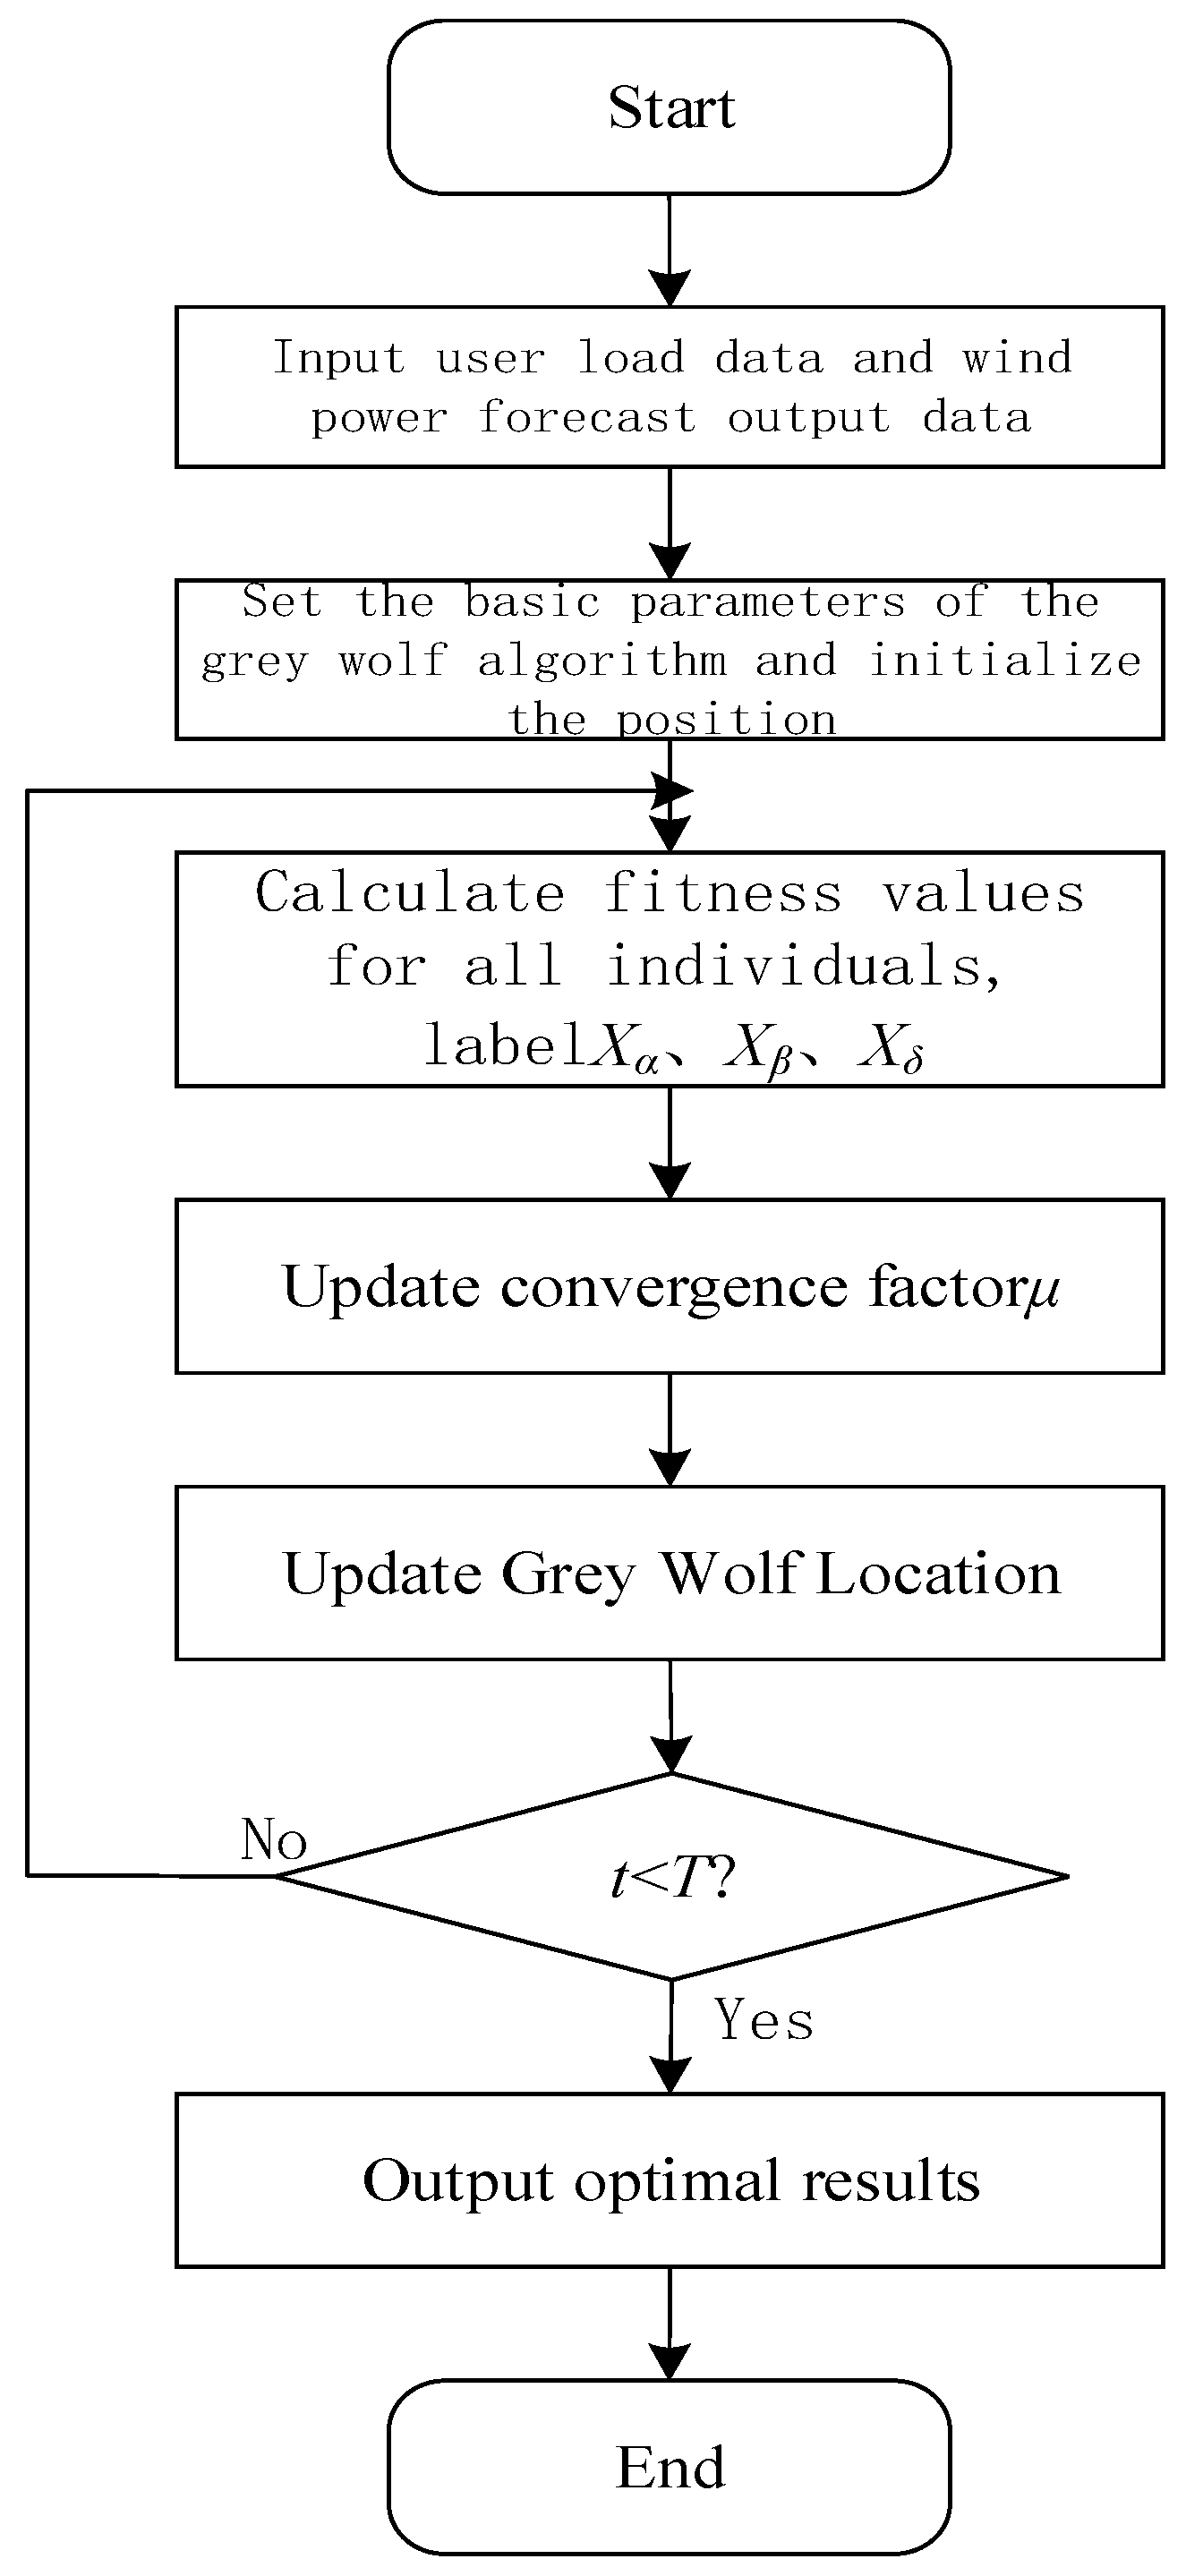
2.2.2. Steps to Improve the Gray Wolf Algorithm

The flow of the improved Gray Wolf Optimization algorithm proposed in this paper is shown in Figure 1.

3. Simulation Results and Discussion
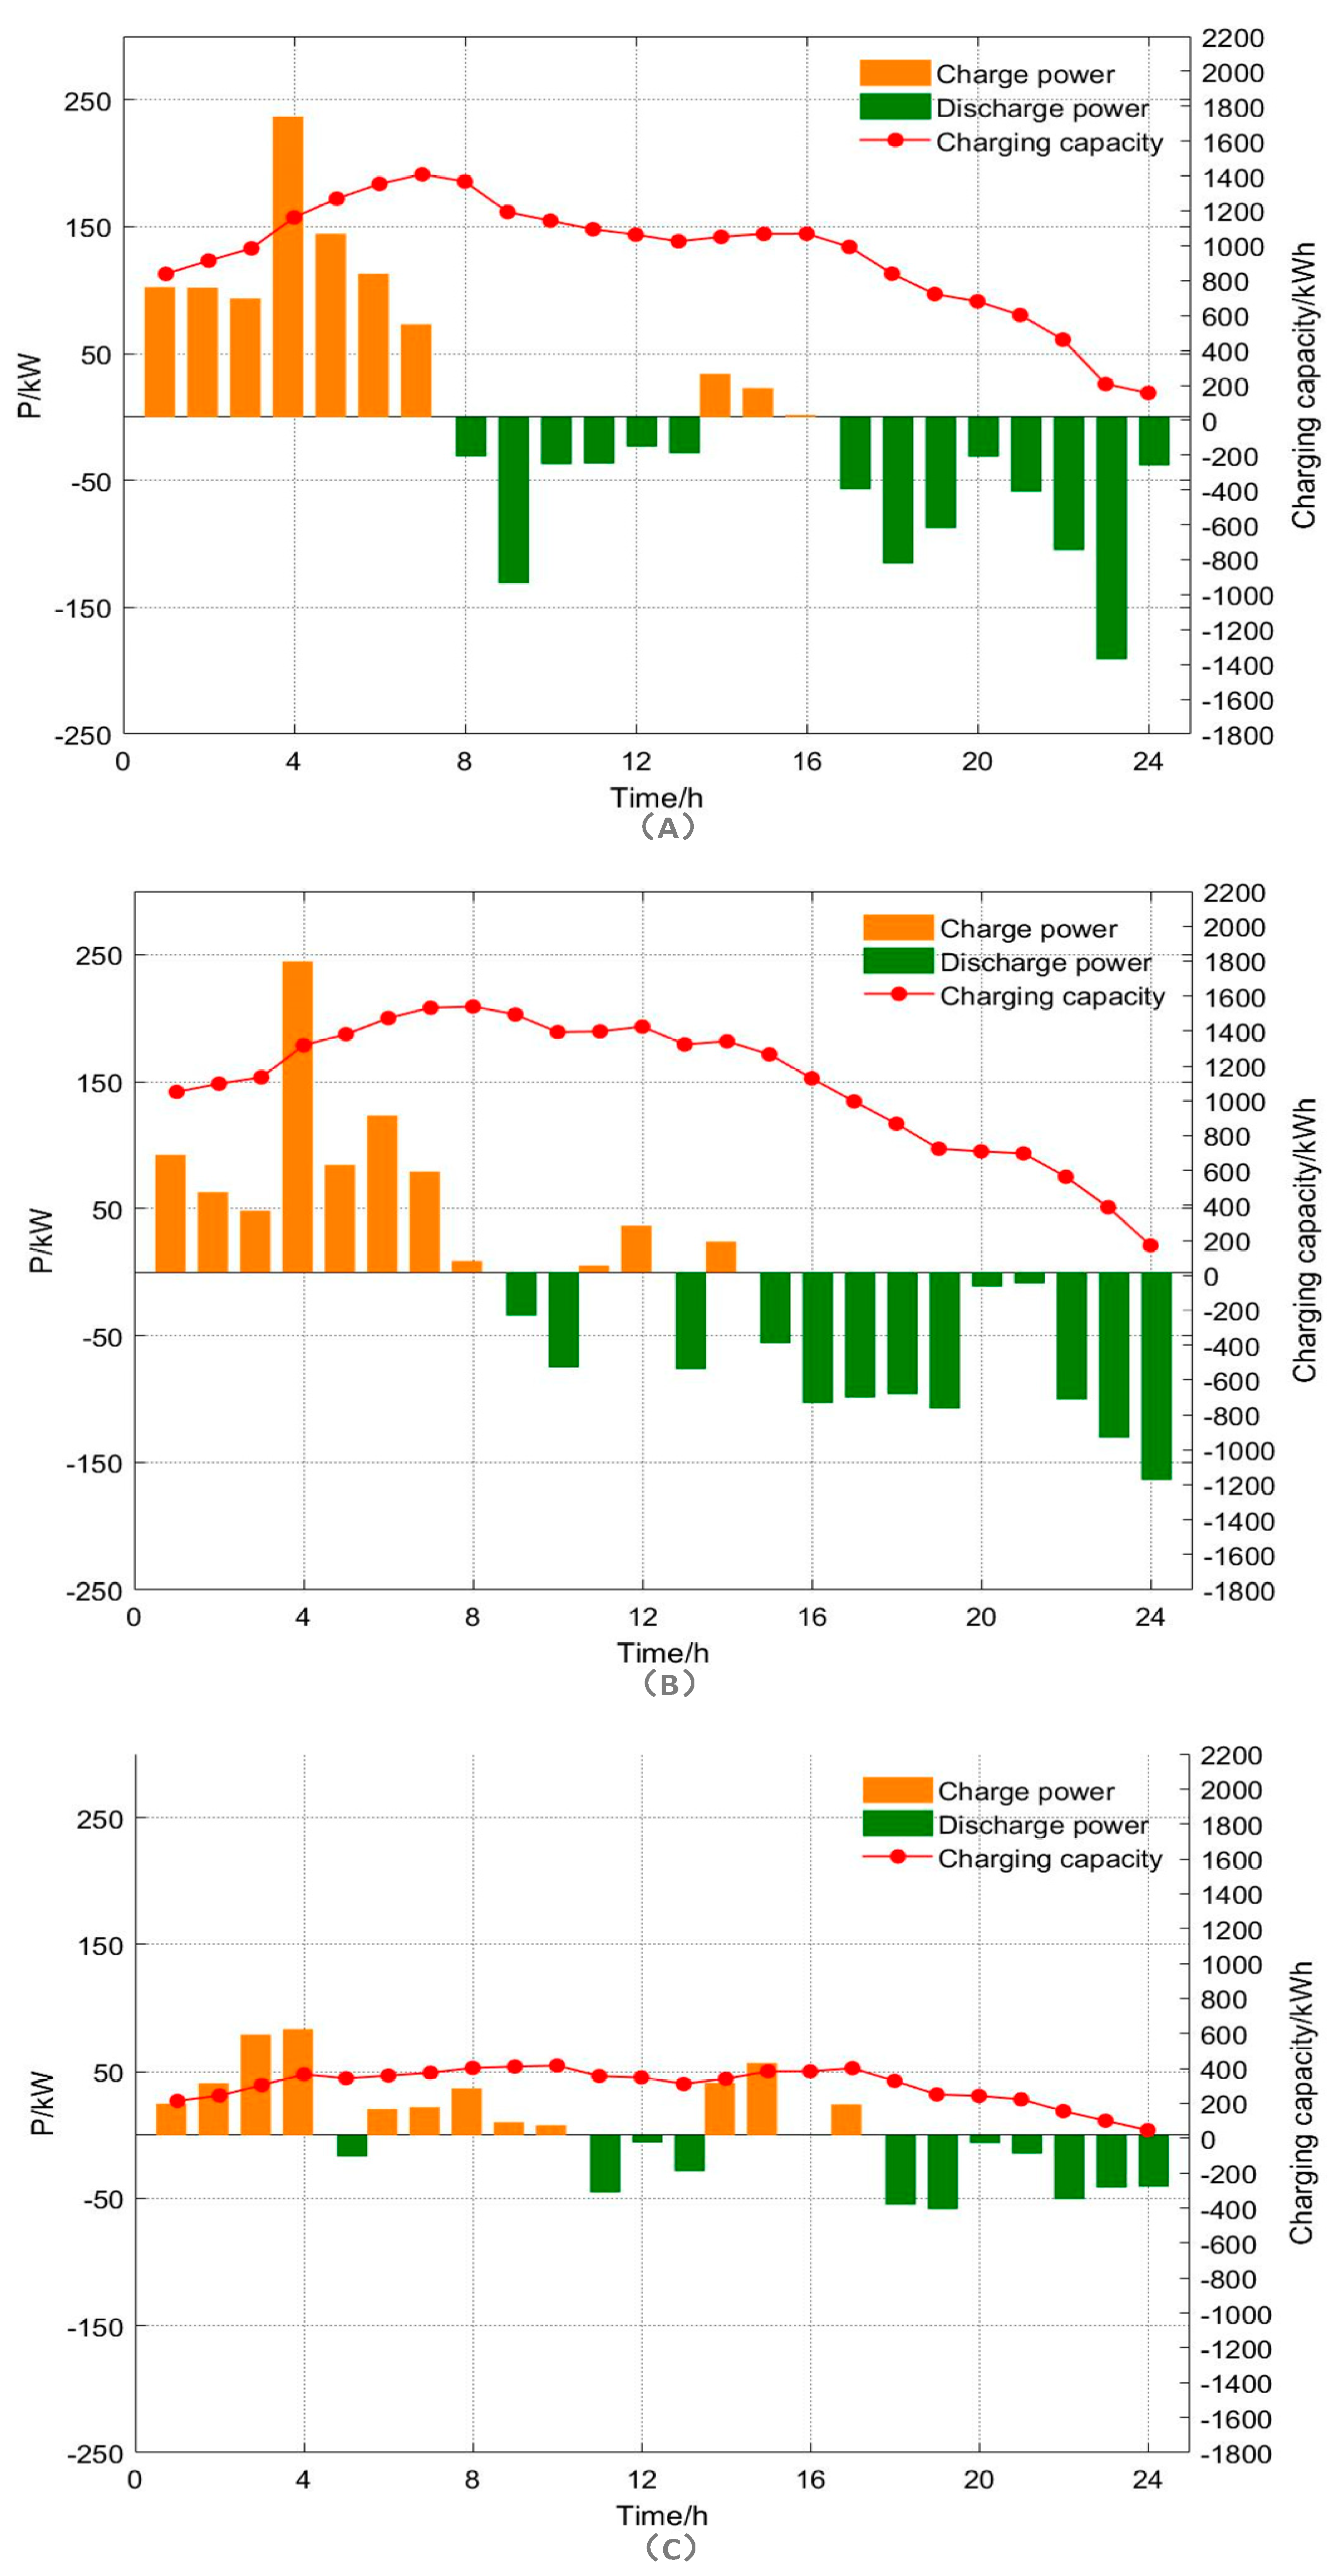
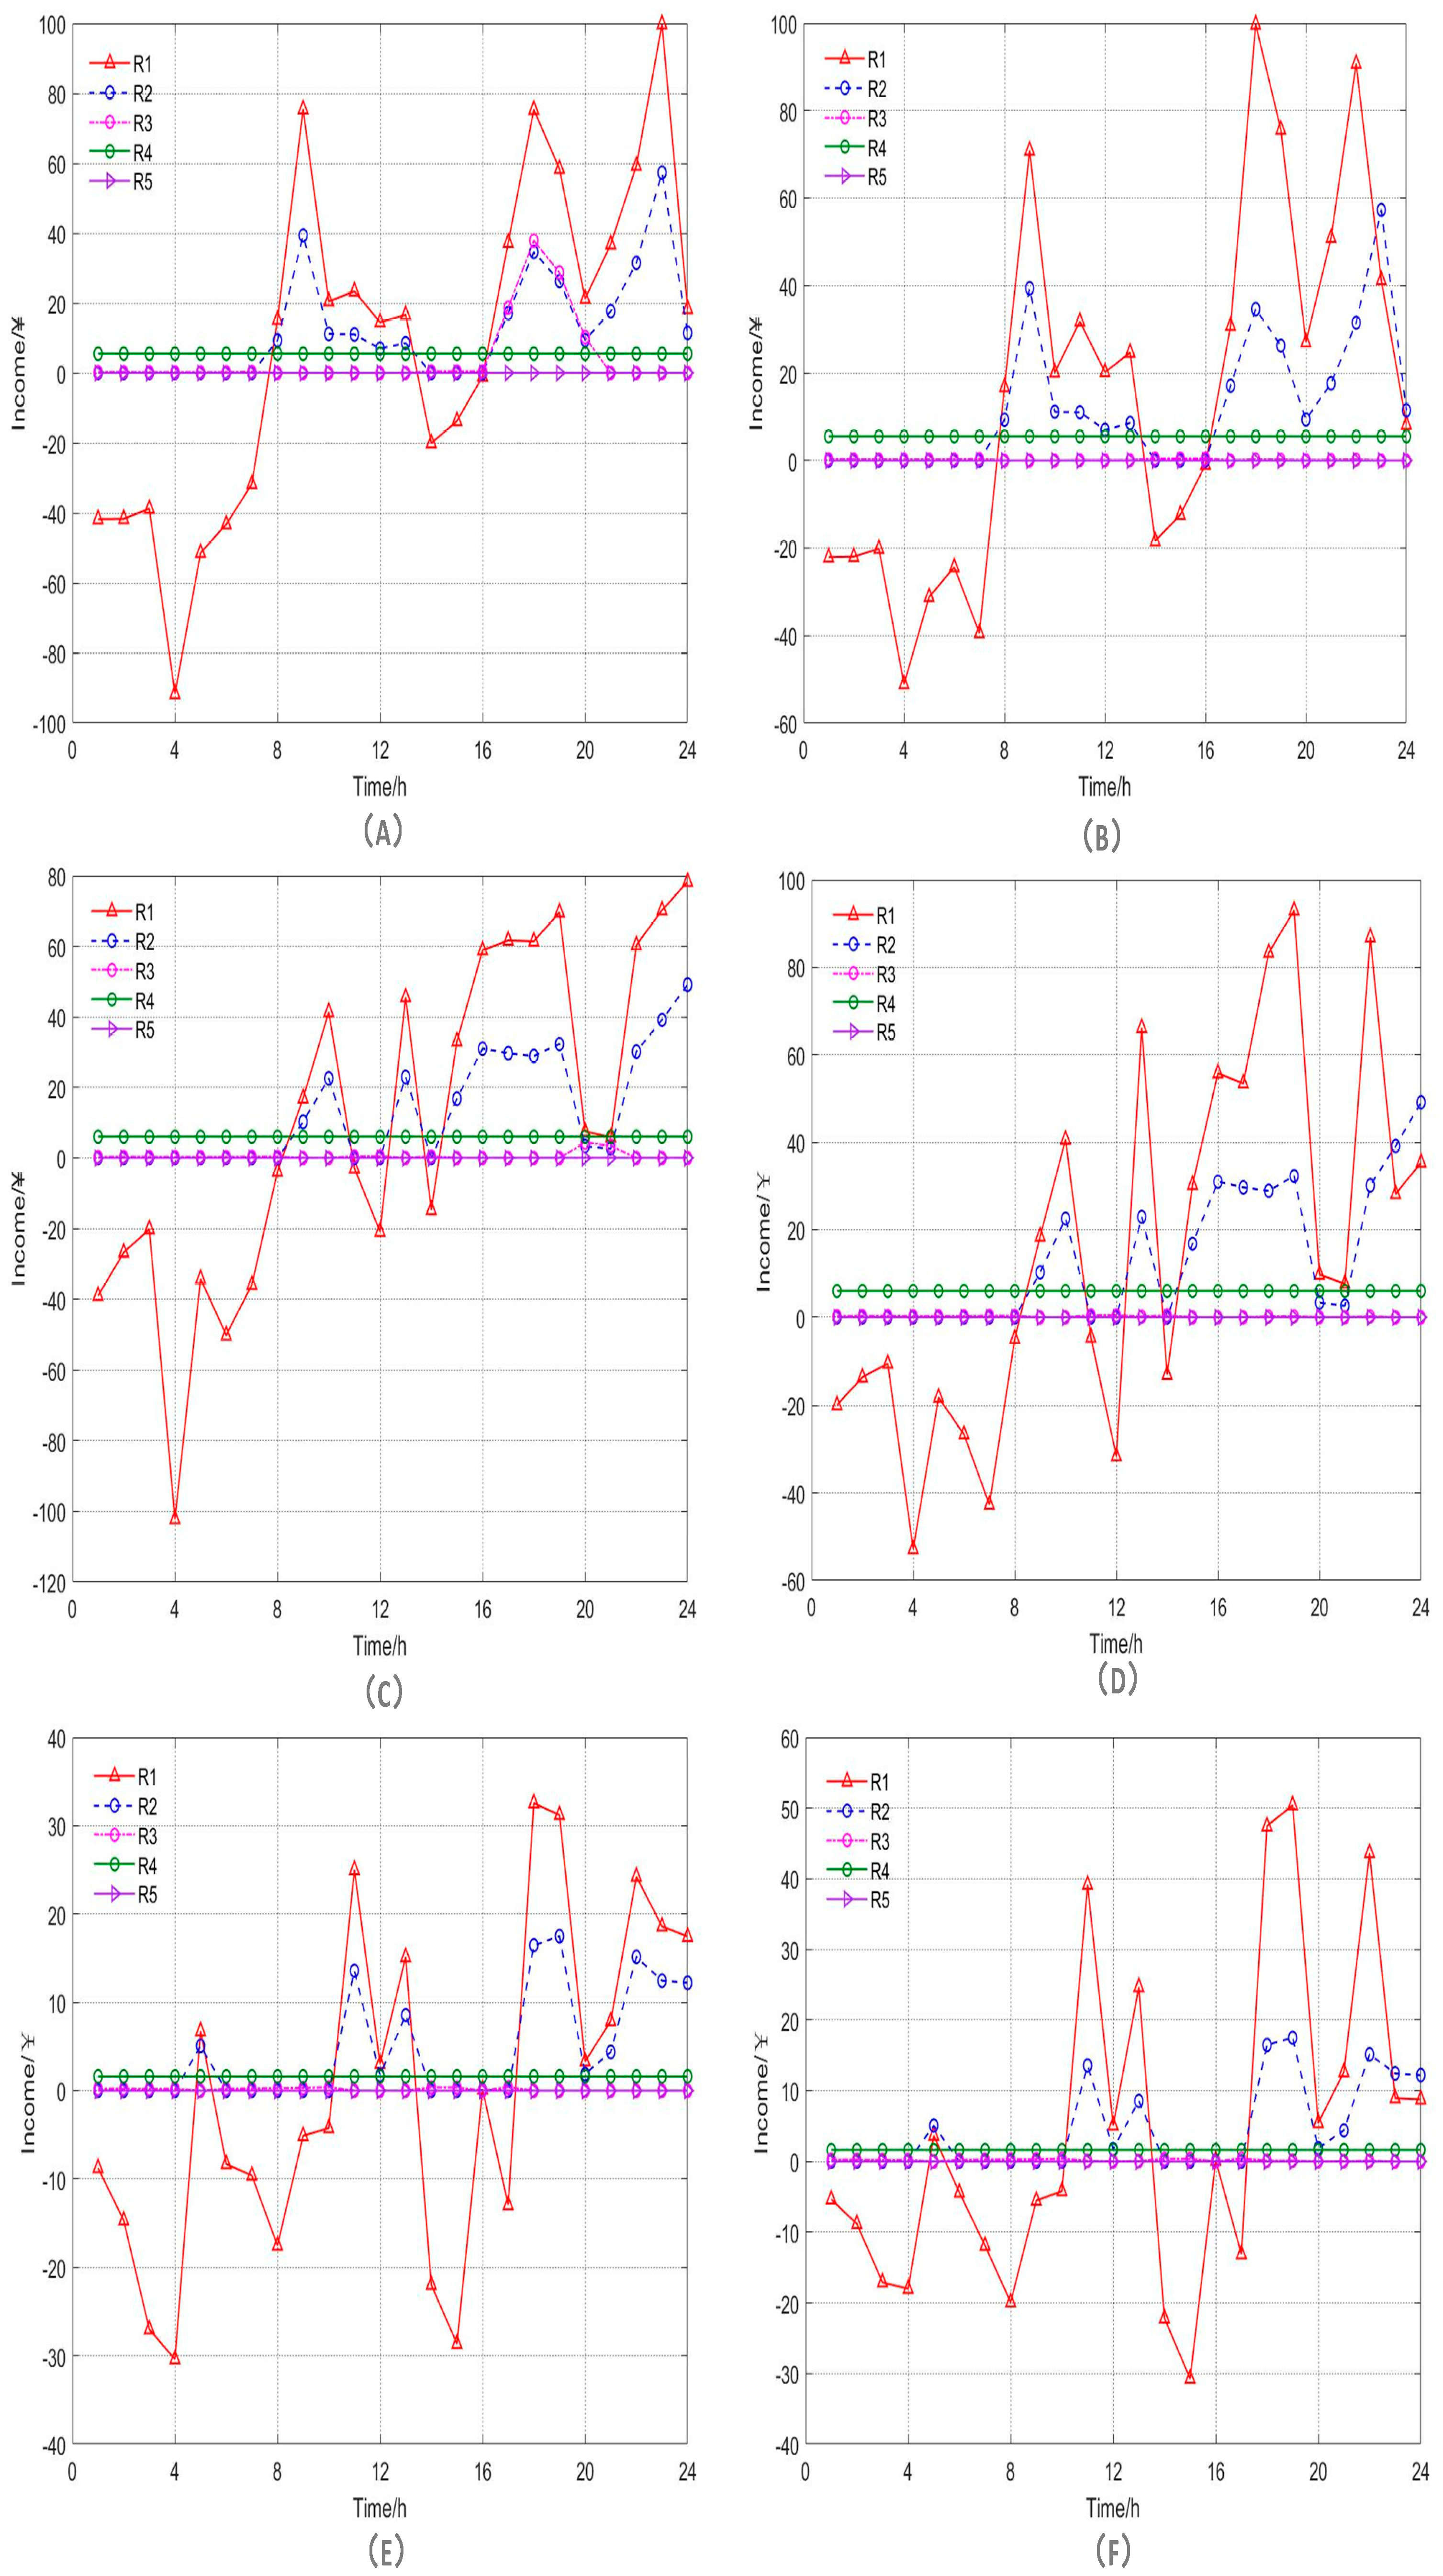
In this paper, eight types of energy storage system have been selected, namely, lead-acid batteries, lithium-ion batteries, sodium-sulfur batteries, liquid current batteries, super capacitors, compressed air, pumped storage, and flywheel energy storage. The operating parameters of various energy storage systems were obtained from publicly available network data [2,4,8]. Their corresponding parameters are presented in Table 1.
The relevant economic and price parameters are shown in Table 2.
This study divides the electricity market’s supply–demand fluctuations into three categories: summer peak, winter peak, and the remaining flat season. For measurement purposes, one representative day from each of the four seasons (April in spring, August in summer, and December in winter) has been selected as a typical scenario in X province. Autumn has not been included as a scenario due to the similarity between the supply–demand relationship and load characteristics of spring and autumn. The load and output curves, as well as the market price curves, for each typical day were provided by the grid company.
(1)
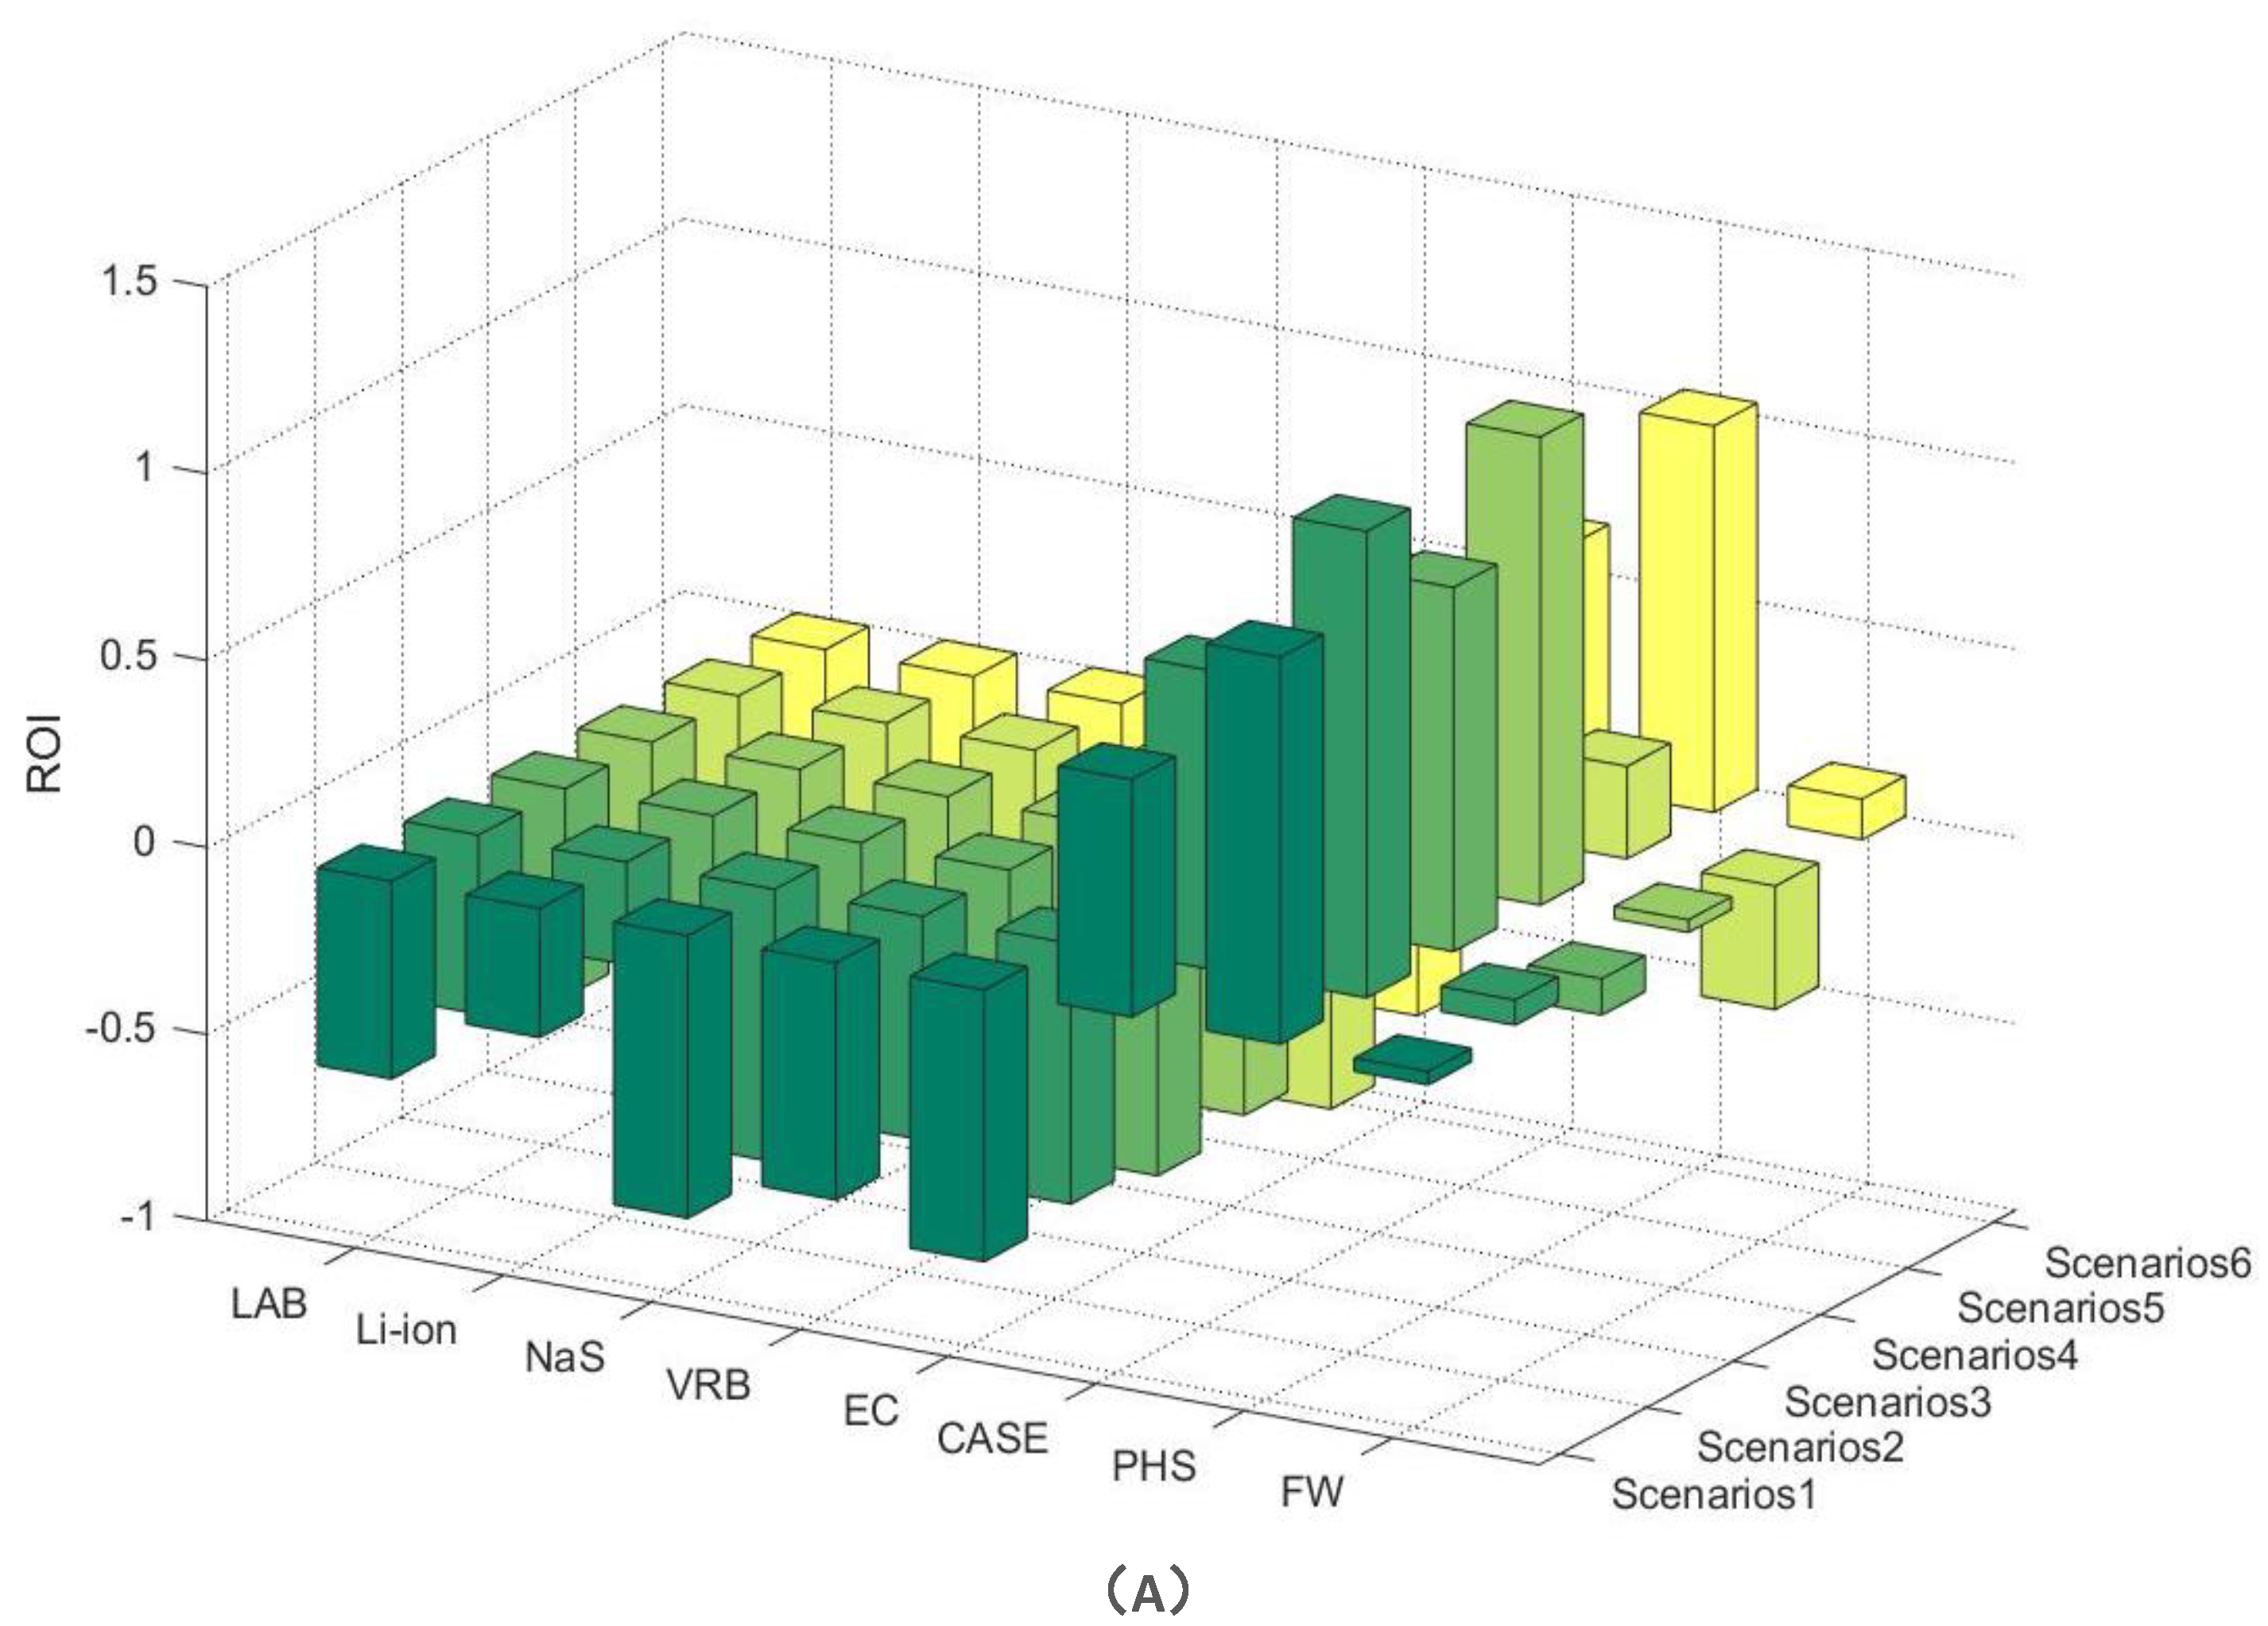
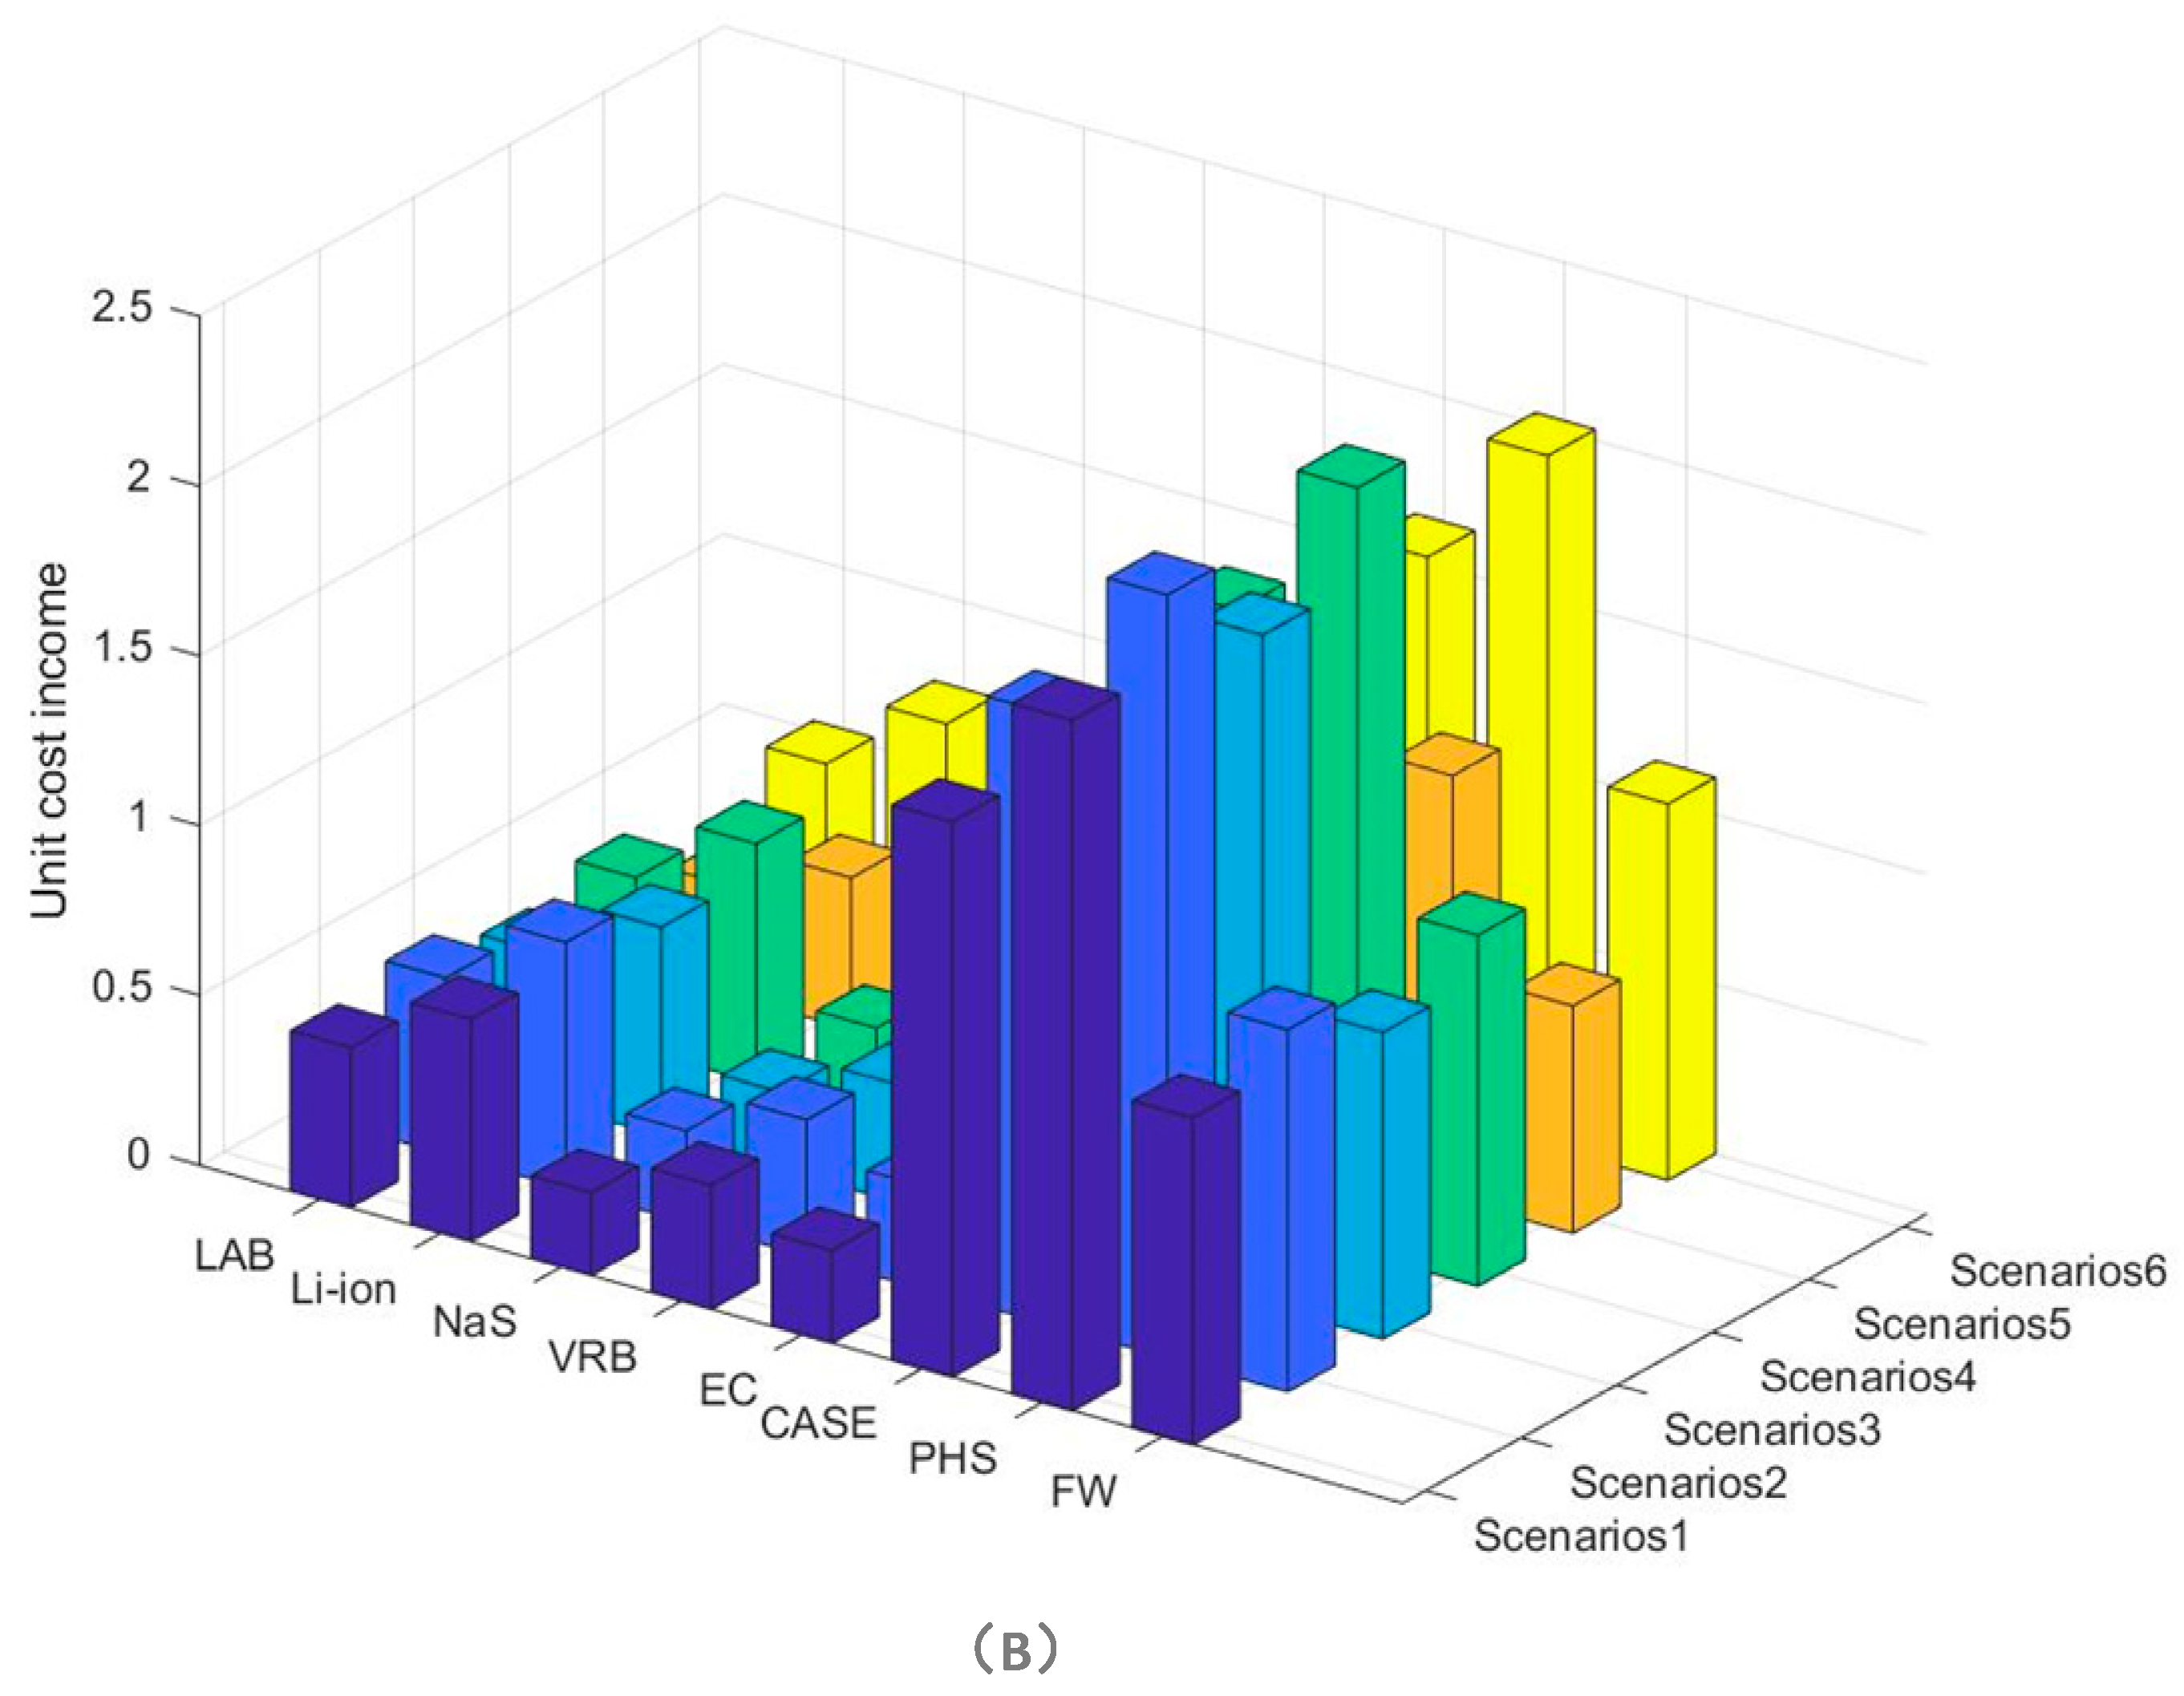
Measured direct benefits of energy storage investments under each scenario.
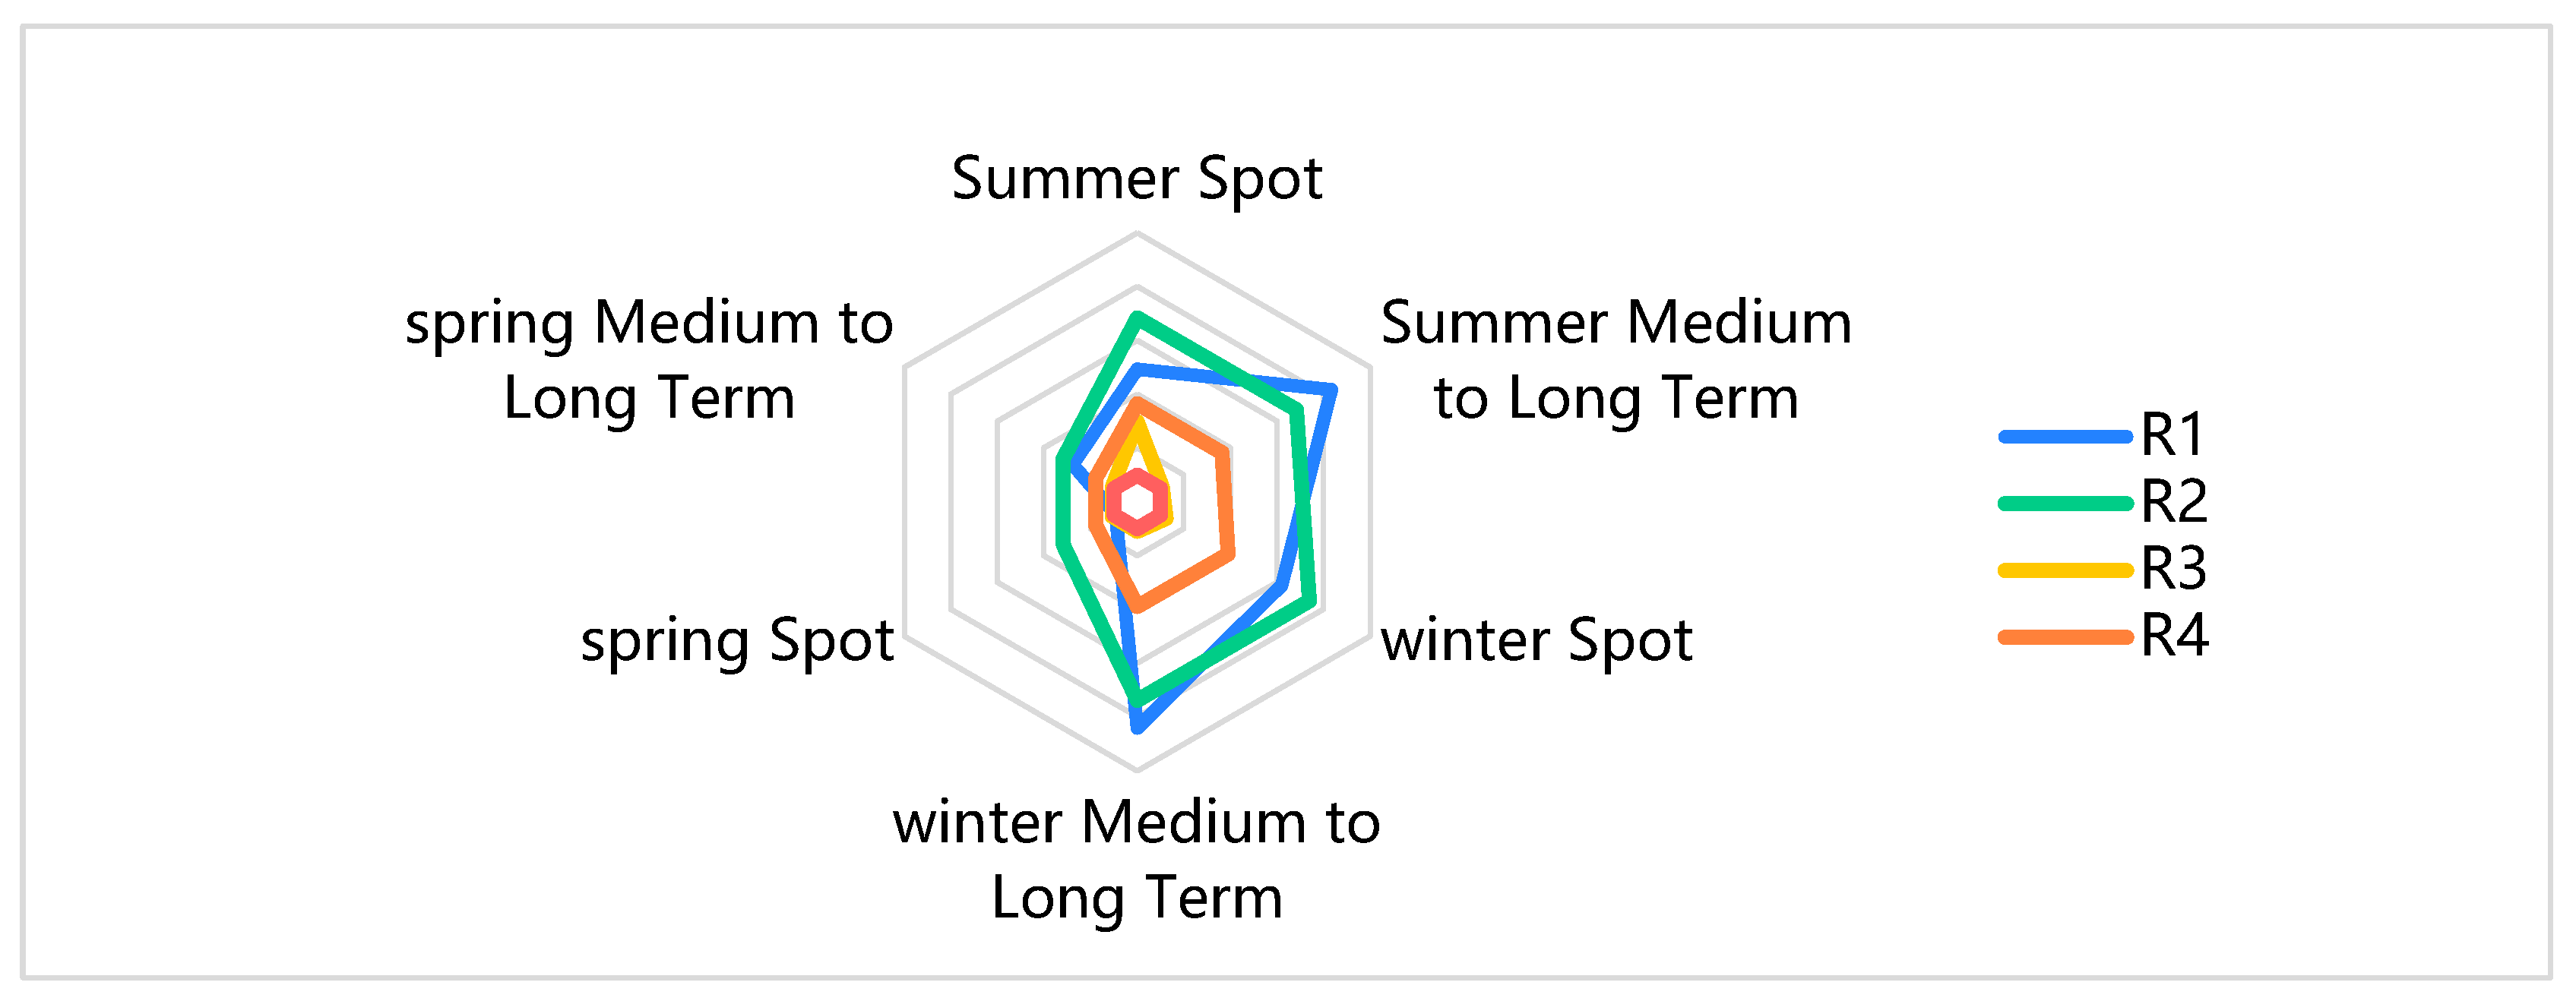
In the modeling process, energy storage is considered a participant in the system’s load balance, necessitating the fulfillment of peak shaving and valley filling obligations [1,3,10,11]. Therefore, the charging and discharging decisions made under each scenario are contingent upon the system’s load fluctuations, irrespective of the energy storage type. Simultaneously, the various revenue streams derived from energy storage are dependent on its charging and discharging capacity, as well as the services rendered [2,7,8,19]. As a result, the revenue curve remains constant under the predetermined scenarios. The specific results are presented in Table 3.
The present valuation of the aggregate cost pertaining to each variant of energy storage under an identical scenario exhibits significant differences due to gaps in charging and discharging efficiencies, as well as differences in the investment capacities required to satisfy the equivalent power equilibrium constraints. Ultracapacitors and compressed air storage necessitate the most exorbitant investment costs, surpassing those of conventional electrochemical and mechanical energy storage by a factor of approximately five, rendering them suboptimal investment choices within the confines of initial capital constraints [2,22]. Notably, the investment capacity, investment power, and present valuation of total costs for a given energy storage type diverge significantly across different scenarios, owing to dissimilar load levels and peak-to-valley differentials [16,17]. Specifically, the total investment cost for energy storage in winter and summer peak scenarios exceeds that of the spring flat section scenario by a factor of approximately 3.3. Therefore, employing winter and summer demand as the investment benchmark may engender excessive investment.
The investments made in energy storage capacity must adhere to the constraints imposed by the system’s power balance, thereby subjecting its maximum charging and discharging power, as well as its maximum storage power, to the influence of the system’s peak–valley differential and the fluctuation in wind power output. As depicted in Figure 2A–C, the system’s peak–valley differential is more pronounced during winter and summer seasons, resulting in a higher demand for energy storage. Conversely, during spring, the load curve exhibits a relatively smooth profile, leading to a lower requirement for energy storage. This observation highlights the positive correlation between the system’s demand for energy storage and the peak-to-valley differential of the load [12,13]. Therefore, basing investment decisions on the demand observed during winter and summer seasons can potentially impede cost recovery due to the excessive capacity during spring.
The daily return curves of energy storage in the electricity market under the three scenarios and two markets depicted in Figure 3A–F were compared. It was observed that the arbitrage returns of energy storage exhibited the highest level of fluctuation, which was directly influenced by the electricity price curve and the peak-to-valley difference. The subsidy gain, the primary source of energy storage gain, was relatively high. Conversely, the gains derived from peak and FM services were relatively low, indicating that there is still room for improvement in China’s power market regarding the development of peak and FM auxiliary services [1,19]. In the current scenario, there was no standby gain derived from energy storage, implying that the gain from full discharge surpassed the provision of standby services.
Disregarding technical constraints such as power density and response time, the revenue generated by an energy storage device in the electricity market is determined by the amount of power it charges and discharges, as well as the services it provides, irrespective of the type of energy storage. By comparing the various income levels of energy storage in each scenario, as illustrated in Figure 4, it is evident that subsidy income represents the most stable form of revenue, which is solely dependent on the amount of energy storage discharged. There is no significant difference between the medium- and long-term electricity market and the spot market in terms of subsidy income. Conversely, the difference in arbitrage return between different markets is conspicuous, with the medium- and long-term markets yielding significantly higher arbitrage returns than the spot market. The variance in arbitrage returns in the same quarter is associated with the price curve in the market. As energy storage devices are typically charged during off-peak periods and discharged during peak periods, the greater the difference between peak and valley prices, the higher the arbitrage return of energy storage.
(2)
Comparison of whole lifecycle benefits of various types of energy storage
Figure 5A,B present the measurements of unit cost-effectiveness and return on investment for each type of energy storage device, based on the present value of the total cost and the present value of the total benefit under each scenario.
It has been observed that the investment returns of energy storage in the medium- and long-term electricity markets surpass that of the electricity spot market. In addition, the investment return during winter and summer exceeds that of spring. Among the various energy storage types, only compressed air and pumped storage exhibit a consistent return on investment, with pumped storage yielding the highest return at an average of 96.5% over a 40-year lifespan. Conversely, all forms of electrochemical energy storage exhibit negative returns on investment, indicating a loss over their lifecycles. Notably, lithium-ion batteries demonstrate a relatively higher return on investment and a lower degree of loss, with an average investment reporting rate of −35.2%. Therefore, the optimal choice for energy storage investment is pumped storage equipment, while prioritizing investments in lithium-ion battery energy storage in electrochemical energy storage is encouraged. The calculated results of this study are approximate to the estimation results found in existing literature [2,15,16,18].
(3)
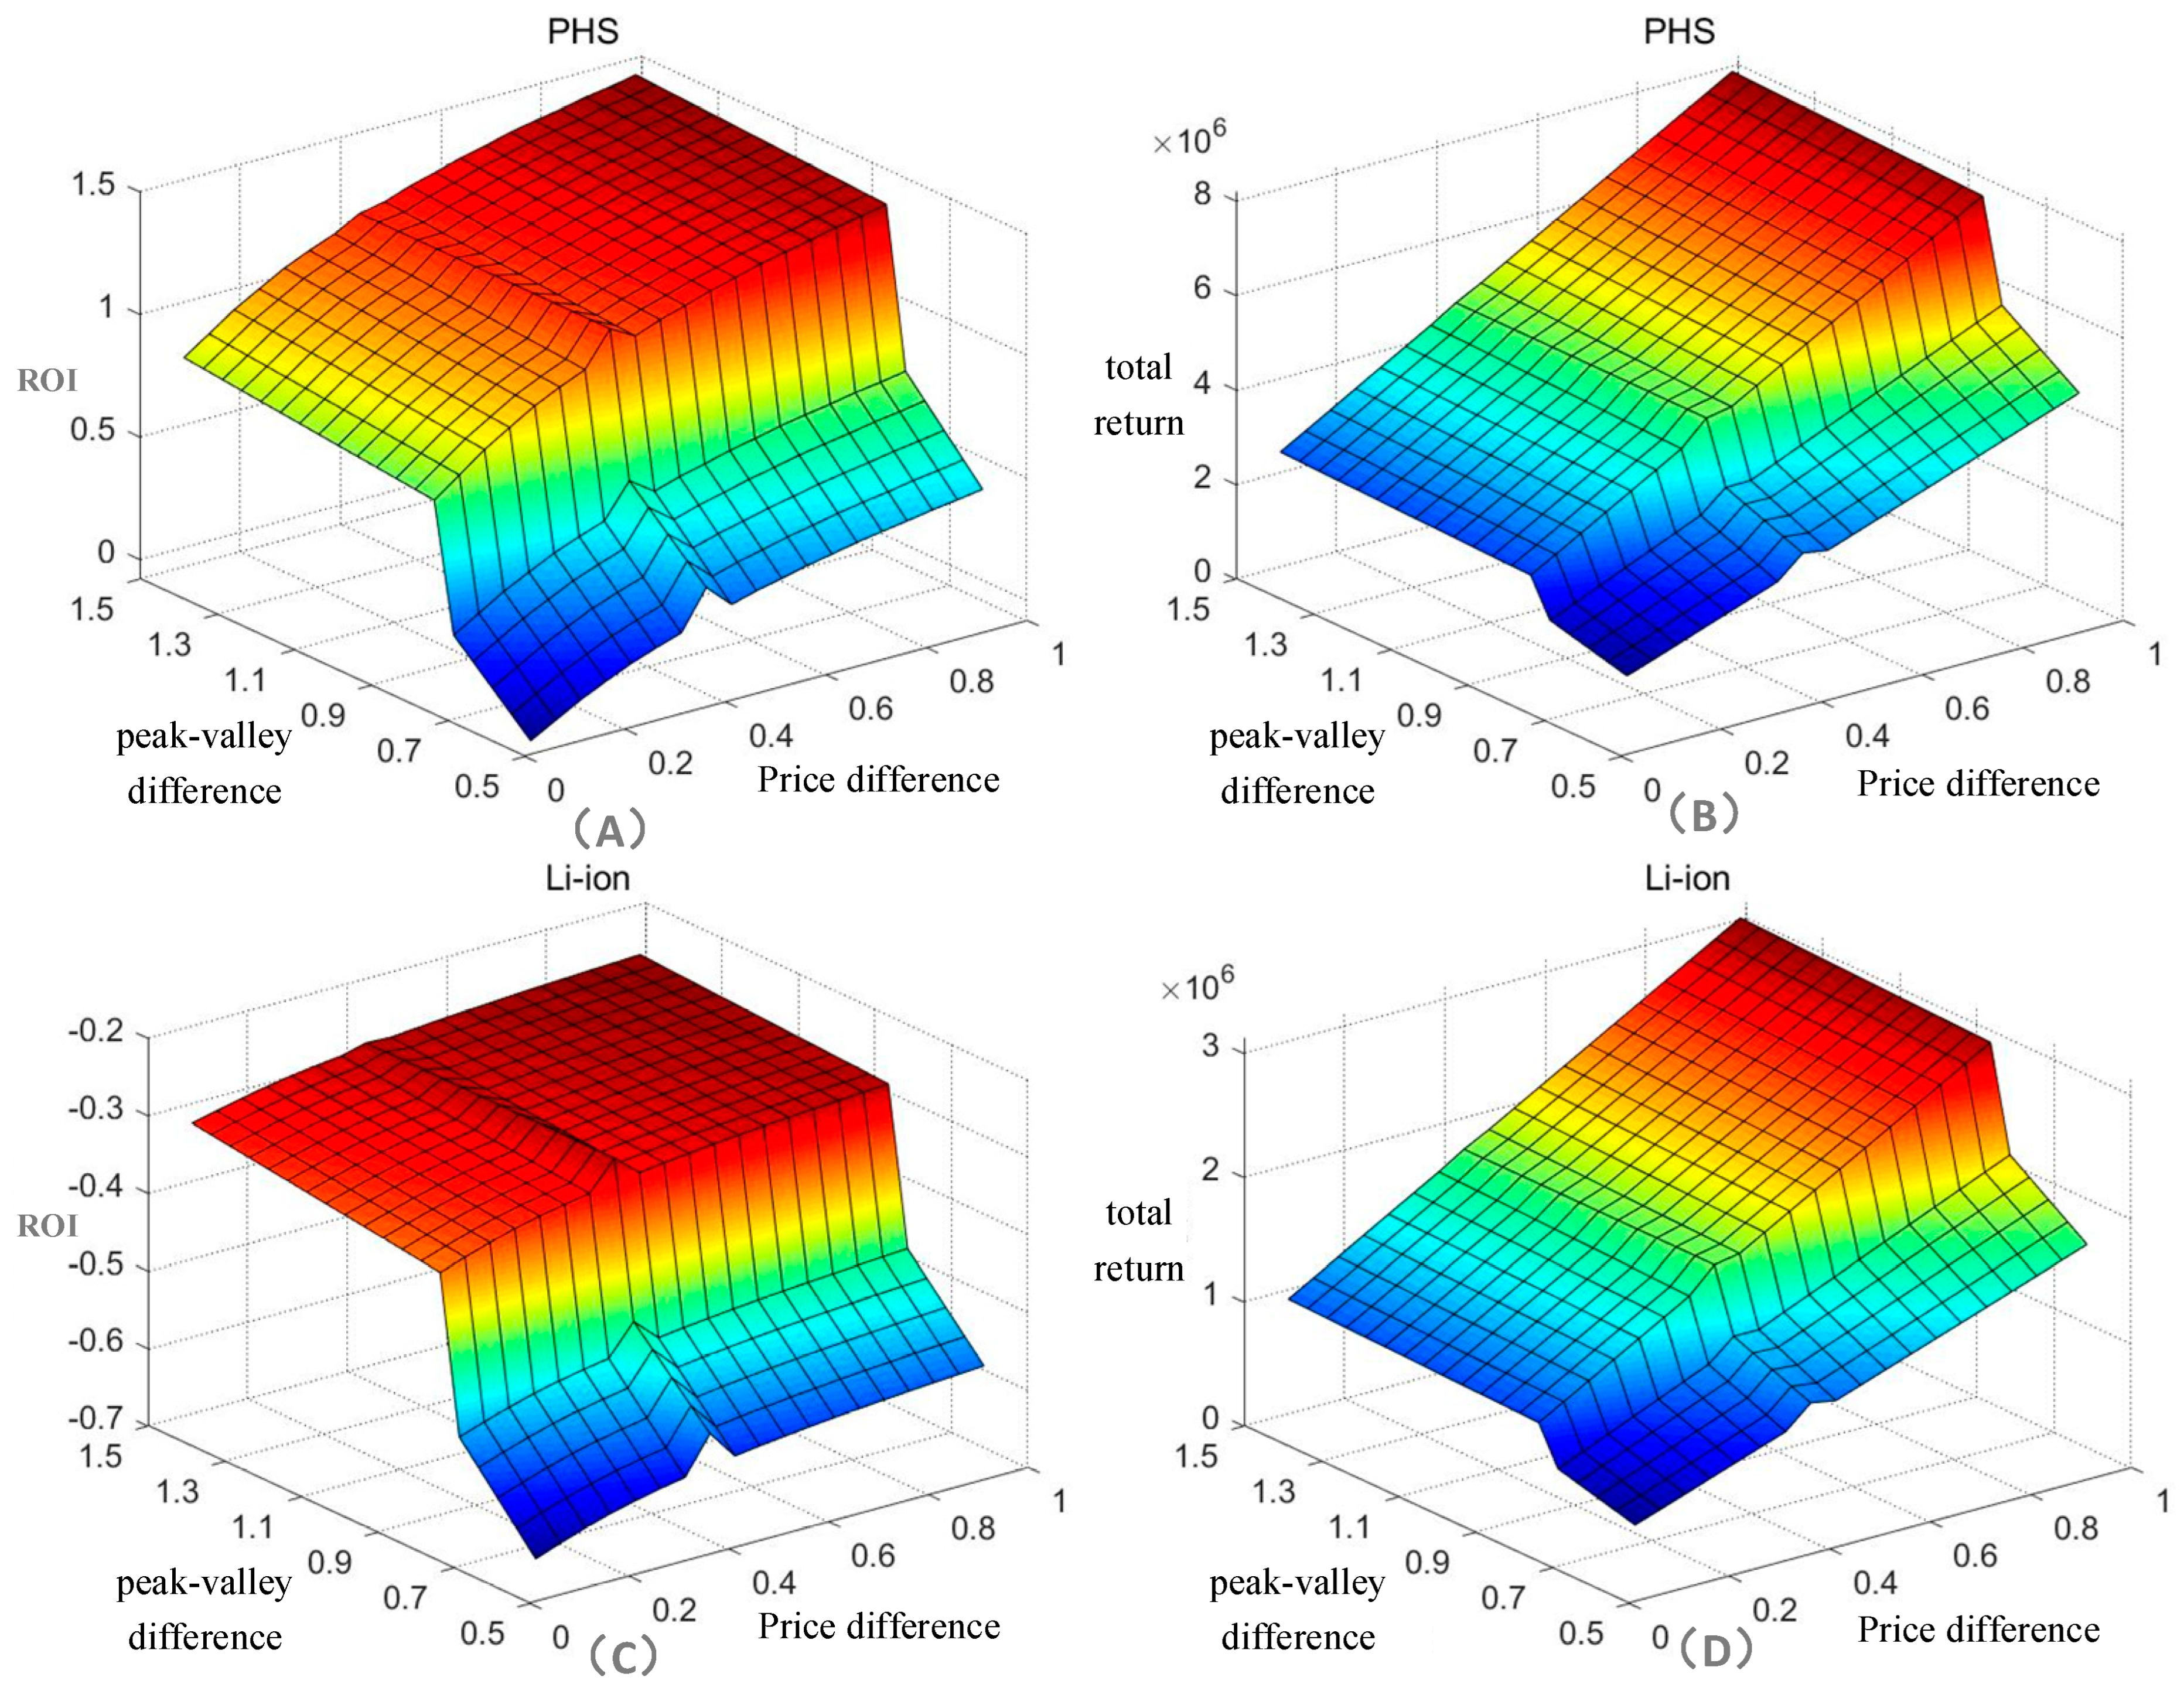
Analysis of Factors Affecting the Benefits of Energy Storage
Having determined the results for pumped storage energy storage and lithium ion battery storage, a further analysis of the primary factors influencing the return on investment in energy storage is warranted. Disregarding cost parameters, lifecycle parameters, and other technical factors, the external factors that most significantly impact the return on investment in energy storage primarily stem from the system load peak–valley difference and the peak–valley price difference [15]. To assess their influence, this study constructs a model using a typical summer day scenario, with the results depicted in Figure 6A–D.
It is evident that the impact of the spread coefficient on energy storage revenue is more stable. As the spread coefficient increases, the energy storage revenue also increases, exhibiting an overall linear relationship. The influence of peak and valley difference factors on energy storage investment returns undergoes noticeable changes. When the system’s peak and valley difference is reduced to 0.7 times below the load curve of the summer scenario, larger peak and valley differences result in higher investment returns for energy storage. However, when the system’s peak–valley difference exceeds 0.7 times the summer scenario load curve, the impact of the peak–valley difference parameter on the investment return of energy storage weakens. Therefore, the market’s peak–valley spread indicator should become a main focus for energy storage investors.

4. Conclusions

In this study, the authors developed a model to optimize the allocation and revenue measurement of various types of energy storage used in the electricity market. The model takes into account the uncertainties of wind and light, as well as the lifecycle cost factors of energy storage. By applying the model to multiple electricity market scenarios, the authors conducted measurements and proposed an optimal allocation strategy for energy storage. The key findings are as follows:
(1)
The high-load seasons, namely, winter and summer, exhibit significant peak-to-valley differences in load, resulting in a high demand for energy storage. On the other hand, the load curve during spring and other low-load seasons is relatively smooth, leading to a smaller demand for energy storage. The peak and valley differences affect both the charging and discharging depths of energy storage and the level of revenue. Therefore, the trend of peak and valley differences can serve as a benchmark for energy storage investors to assess their revenue expectations. It is important to note that if investments are based solely on the demand during winter and summer seasons, the return on investment may be easily affected by excess capacity during spring and fall.
(2)
The gains derived from subsidies exhibit the highest level of stability, as they are solely contingent upon the quantity of electricity discharged from storage. These gains do not exhibit significant differences between the medium- to long-term and spot markets for electricity. Conversely, arbitrage gains demonstrate notable discrepancies across various markets, with the medium- and long-term market yielding considerably higher gains compared to the spot market. The magnitude of these gains is influenced by the extent of the peak–valley spread. Therefore, investors can employ assessments of the spread fluctuation trend in the spot market as a foundation for decision-making when selecting a market.
(3)
When solely considering economic returns and disregarding technical factors, pumped storage serves as the most suitable mechanical energy storage option for investment, while lithium-ion battery energy storage emerges as the most suitable electrochemical energy storage alternative. The internal factors that impact the returns on energy storage consist of the investment cost and service life. These indicators furnish investors with vital information for making investment decisions.

5. Limitations and Outlook

This paper did not assess the implicit societal benefits brought about by energy storage nor conduct an analysis of the rationality behind energy storage subsidies. Furthermore, it should be noted that the simulated data have certain limitations and may not be universally applicable at the global level. Therefore, the research findings cannot be widely generalized. In subsequent studies, we will undertake a comprehensive assessment of the economic externalities associated with energy storage and devise a subsidy framework that duly considers the sustainable development and social benefits of energy storage.

Author Contributions

Conceptualization, Y.M. and Z.Y.; methodology, Y.M.; software, Z.Y.; validation, Y.M.; formal analysis, L.C.; investigation, L.C.; resources, S.H.; data curation, Y.M.; writing—original draft preparation, Y.M.; writing—review and editing, Z.Y.; visualization, S.H.; supervision, Y.M.; project administration, Y.M.; funding acquisition, T.L. All authors have read and agreed to the published version of the manuscript.

Funding

This research received no external funding.

Data Availability Statement

The data can be requested from the corresponding author upon reasonable request.

Conflicts of Interest

The authors declare no conflict of interest.

References

  1. Li, J.L.; Xiu, X.Q.; Lv, X.Y.; Wei, G. A review of research on capacity optimization allocation and whole life cycle economic evaluation of energy storage systems. J. Power Supply 2018, 16, 1–13. (In Chinese) [Google Scholar]
  2. Jiang, K.; Li, H.S.; Li, W.; Chen, S. Introduction to several types of grid-oriented energy storage batteries. Power Syst. Autom. 2013, 37, 47–53. (In Chinese) [Google Scholar]
  3. Li, H.X.; Li, J.L.; Mi, Y. Research progress of optimized allocation technology of new energy side energy storage. Energy Storage Sci. Technol. 2022, 11, 3257–3267. [Google Scholar]
  4. Wang, W.; Li, R.Q.; Zhang, L.; Luo, D.; Ai, X.; Jiang, C. Comparative analysis of optimized operation of integrated energy systems taking into account multiple types of electric energy storage. Grid Clean Energy 2020, 36, 110–116+123. [Google Scholar]
  5. Ma, W.; Wang, W.; Wu, X.Z.; Hu, R.; Tang, F.; Zhang, W.; Han, X.; Ding, L. Optimal allocation of hybrid energy storage systems for smoothing photovoltaic power fluctuations considering the active power curtailment of photovoltaic. IEEE Access 2019, 7, 74787–74799. [Google Scholar] [CrossRef]
  6. Li, Z.Z.; Guo, K.Z.; Liao, M.K.; Zhao, A.; Tian, M.; Wang, Y. Micro-hybrid energy storage system capacity based on genetic algorithm optimization configuration research. Int. Core J. Eng. 2020, 6, 78–83. [Google Scholar]
  7. Xiong, N.; Zhu, W.G.; Yang, W.G.; Zhou, B. Configuration method of distribution network energy storage system based on cost analysis. Smart Power 2019, 47, 51–55+111. [Google Scholar]
  8. Mohammad, A.; Amir, K.; Behrooz, V.; Hosseinian, S.H.; Malakmahmoudi, A. Optimal sizing of battery energy storage in a microgrid considering capacity degradation and replacement year. Electr. Power Syst. Res. 2021, 195, 07170. [Google Scholar]
  9. Sayfutdinov, T.; Ali, M.; Khamisov, O. Alternating direction method of multipliers for the optimal siting, sizing, and technology selection of Li-ion battery storage. Electr. Power Syst. Res. 2020, 185, 106388. [Google Scholar] [CrossRef]
  10. Li, J.H.; Zhang, J.H.; Mu, G.; Ge, Y.; Yan, G.; Shi, S. Hierarchical optimization scheduling of deep peak shaving for energy-storage auxiliary thermal power generating units. Power Syst. Technol. 2019, 43, 3961–3970. (In Chinese) [Google Scholar]
  11. Ye, Z.; Li, X.Q.; Jiang, F.; Chen, L.; Wang, Y.L.; Dai, S. Hierarchical optimization economic dispatching of combined wind-PV-thermal-energy storage system considering the optimal energy abandonment rate. Power Syst. Technol. 2021, 45, 2270–2280. (In Chinese) [Google Scholar]
  12. Li, X.W.; Wang, X.; Gu, J.W. Business models of electric vehicle aggregators considering electricity price uncertainty and capacity decay. Electr. Power 2023, 56, 1–7+48. (In Chinese) [Google Scholar]
  13. Kim, S.H.; Shin, Y.J. Optimize the operating range for improving the cycle life of battery energy storage systems under uncertainty by managing the depth of discharge. J. Energy Storage 2023, 73 Pt D, 109144. [Google Scholar] [CrossRef]
  14. Annu, A.; Debapriya, D. Optimal sizing and scheduling of battery energy storage system with solar and wind DG under seasonal load variations considering uncertainties. J. Energy Storage 2023, 74 Pt A, 109377. [Google Scholar]
  15. Ryutaka, Y.; Dilip, K.; Fernando, S. A comparative life cycle assessment of lithium-ion and lead-acid batteries for grid energy storage. J. Clean. Prod. 2022, 358, 131999. [Google Scholar]
  16. Hunter, C.A.; Penev, M.M.; Reznicek, E.P.; Eichman, J.; Rustagi, N.; Baldwin, S.F. Techno-economic analysis of long-duration energy storage and flexible power generation technologies to support high-variable renewable energy grids. Joule 2021, 5, 2077–2101. [Google Scholar] [CrossRef]
  17. Behnam, Z.; Sanna, S. Electrical energy storage systems: A comparative life cycle cost analysis. Renew. Sustain. Energy Rev. 2015, 42, 569–596. [Google Scholar]
  18. Ge, Y.Y.; Shang, C. Energy storage planning constrained by its life. Proc. CSEE 2020, 40, 6150–6161. (In Chinese) [Google Scholar]
  19. Yang, X.Y.; Liu, X.Y.; Guo, Q.; Sun, Y.; Yan, G.G.; Li, H.Y. Coordinated planning of energy storage and flexible retrofit of thermal power units considering ancillary service income. Power Syst. Technol. 2023, 47, 1350–1362. (In Chinese) [Google Scholar] [CrossRef]
  20. Mirjalili, S.; Mirjalili, S.M.; Lewis, A. Grey wolf optimizer. Adv. Eng. Softw. 2014, 69, 46–61. [Google Scholar] [CrossRef]
  21. Chandran, V.; Mohapatra, P. Enhanced opposition-based grey wolf optimizer for global optimization and engineering design problems. Alex. Eng. J. 2023, 76, 429–467. [Google Scholar] [CrossRef]
  22. Rezaei, H.; Abdollahi, S.E.; Abdollahi, S.; Filizadeh, S. Energy managment strategies of battery-ultracapacitor hybrid storage systems for electric vehicles: Review, challenges, and future trends. J. Energy Storage 2022, 53, 105045. [Google Scholar] [CrossRef]
Figure 1. Flowchart of GWO algorithm.
Processes 12 00130 g001
Figure 2. (A) Typical daily energy storage charge/discharge curve in summer. (B) Typical daily energy storage charge/discharge curve in winter. (C) Typical daily storage charge/discharge curves for spring season.
Processes 12 00130 g002
Figure 3. (A) Spot market return curve for energy storage on a typical summer day. (B) Medium- and long-term market return curve for energy storage on a typical summer day. (C) Spot market return curve for energy storage on a typical winter day. (D) Medium- and long-term market return curve for energy storage on a typical winter day. (E) Figure spot market return curve for energy storage on a typical day in spring. (F) Medium- and long-term market return curve for energy storage on a typical day in spring.
Processes 12 00130 g003
Figure 4. Comparison of benefits of energy storage systems by scenario.
Processes 12 00130 g004
Figure 5. (A) Comparison of energy storage unit cost effectiveness by scenario. (B) Comparison of energy storage return on investment by scenario.
Processes 12 00130 g005aProcesses 12 00130 g005b
Figure 6. (A) Influences on return on investment for pumped storage. (B) Influences on total return for pumped storage. (C) Influences on return on investment for lithium-ion batteries. (D) Influences on total return for lithium-ion batteries.
Processes 12 00130 g006
Table 1. Types of energy storage and related parameters.
Type of Energy StorageAbridgePrice per Unit Capacity (CNY/KW)Price per Unit of Power (CNY/KWH)O&M Cost per Unit of Power
(CNY/KW Year)
Charge/Discharge FactorLife Cycle (Years)
Lead-acid batteryLAB120050010.754
Lithium-ion batteryLi-ion20001000100.99
Sodium-sulfur batteryNas70000100.8512
Flow battery (computing)VRB500010,000150.6030
UltracapacitorEC10,0001000150.9820
Compressed airCASE500500070.6020
Pumped storagePHS500670050.7540
Flywheel energy storageFW3000100050.8530
Table 2. Economic and price parameters.
Indicator NameData SourcesRetrieve a Value
Inflation rate  I n R  China Economic Yearbook 20222%
Discount rate  d  Take the average value of the bankers’ acceptance discount rate in 20225.9%
Government-subsidized tariffs  μ s u b  Take the plurality of energy storage support policies announced by provinces and municipalities in 20220.3 CNY/KWH
Deep Peak Charge Compensation  μ c s  2023 Supplementary Notice on the Participation of Third-Party Independent Entities in the Normalized Operation of Electricity Ancillary Services in Province X0.32 CNY/KWH
(ceiling)
Peak Shaving and Peak Regulation Compensation Prices  μ d c  2023 Supplementary Notice on the Participation of Third-Party Independent Entities in the Normalized Operation of Electricity Ancillary Services in Province X0.65/KWH (ceiling)
Peak Load Threshold Price  μ 0  2023 Supplementary Notice on the Participation of Third-Party Independent Entities in the Normalized Operation of Electricity Ancillary Services in Province X0.65 CNY/KWH
Percentage of Deep Peaking Power  θ c s  Annual electricity consumption and deep peaking compensation for a province in 20220.5%
Monthly Small Disturbance FM Compensation Price  μ s p f  Implementing Rules for the Management of Electricity Ancillary Services in Province X (Revised Version 2023)CNY 72/MW × month
Monthly Large Disturbance FM Compensation Price  μ b p f  Implementing Rules for the Management of Electricity Ancillary Services in Province X (Revised Version 2023)CNY 100/MW × month
Rotating Spare Winning Price  μ s p r  Pilot Program for Participation of Third-Party Independent Entities in Electricity Auxiliary Service Settlement in X Province in 2022 (Draft for Public Comments)CNY 50/MWH
(ceiling)
Rotating Spare Call Prices  μ s p r  Pilot Program for Participation of Third-Party Independent Entities in Electricity Auxiliary Service Settlement in X Province in 2022 (Draft for Public Comments)CNY 10/MWH
Annual Growth Rate of Load  τ  China Power Industry Annual Development Report 20236.3%
Green Certificate Price  μ G E C  China Green Power Certificate Subscription Trading PlatformCNY 100/MWH
Kwh Coal Consumption  α c o a l  Industry average300 g/KWH
Average Annual Coal Price  μ c o a l  2022 Qinhuangdao Power Coal Market Monthly Average Price964 per ton
Kwh Gas Emission Factor  α d i s  Methodology and Reporting Guidelines for Corporate Greenhouse Gas Emissions Accounting and Reporting for Electricity Generating Facilities (Revised 2022)581 g CO2, 30 g SO2, 15 g NO
Costs of Air Pollution Control  μ d i s  Law of the People’s Republic of China on Environmental Protection TaxCNY 1.2/equivalent
Table 3. The scale of investment in various types of energy storage.
Investment Capacity/KWInvestment Power/KWHPresent Value of Total Cost
LABSummer1566.42082371,999,056.568
Winter1710.63022452,176,136.563
Spring 463.828184598,895.571
Li-ionSummer1285.17942372,824,637.646
Winter1402.88242453,068,626.729
Spring 370.833384831,790.783
NasSummer1368.3292379,599,996.279
Winter1493.880824510,479,591.160
Spring 392.6471842,756,218.242
VRBSummer1982.781723712,342,271.140
Winter2166.076724513,340,716.190
Spring 631.3425844,017,398.051
ECSummer1169.009923711,973,609.420
Winter1275.725124513,050,331.500
Spring 344.373843,544,215.010
CASESummer1982.78172372,198,095.896
Winter2166.07672452,330,476.056
Spring 631.342584743,364.183
PHSSummer1566.42082372,393,124.865
Winter1710.63022452,519,572.657
Spring 463.828184802,516.652
FWSummer1368.3292374,361,441.180
Winter1493.88082454,746,753.269
Spring 392.6471841,268,836.360
Disclaimer/Publisher’s Note: The statements, opinions and data contained in all publications are solely those of the individual author(s) and contributor(s) and not of MDPI and/or the editor(s). MDPI and/or the editor(s) disclaim responsibility for any injury to people or property resulting from any ideas, methods, instructions or products referred to in the content.

