Article

Highly Sensitive Ethylene Sensors Based on Ultrafine Pd Nanoparticles-Decorated Porous ZnO Nanosheets and Their Application in Fruit Ripeness Detection

1
Anhui Advanced Building Materials Engineering Laboratory, Anhui Jianzhu University, Hefei 230601, China
2
School of Materials and Chemical Engineering, Anhui Jianzhu University, Hefei 230601, China
*
Authors to whom correspondence should be addressed.
Processes 2023, 11(6), 1686; https://doi.org/10.3390/pr11061686
Submission received: 4 March 2023 / Revised: 16 May 2023 / Accepted: 27 May 2023 / Published: 1 June 2023
(This article belongs to the Special Issue Controllable Preparation and Application of Metal Compounds)

Abstract

:
Ethylene is the most common ripening phytohormone in fruits, and excess ethylene can overripen the fruit. However, the in-field detection of ethylene is still limited. In this work, ultrafine Pd nanoparticles-decorated porous ZnO nanosheets (UPNP ZnO nanosheets) were conveniently synthesized through a facile solvent reduction method. The UPNP ZnO nanosheets were characterized using scanning electron microscopy, transmission electron microscopy, energy dispersive spectrum, X-ray diffraction and X-ray photoelectron spectroscopy. The ZnO nanosheets were uniformly coated with Pd nanoparticles. The size of the Pd nanoparticle was very small, with a diameter of approximately 2 nm. Due to the unique structure of the porous ZnO nanosheets and the excellent catalytic properties of the ultrafine Pd nanoparticles, the as-prepared samples showed very high sensing performance in ethylene detection. The lowest detection concentration was 10 ppb, which is the lowest detection limit to our knowledge. It has been proved that the decoration of ultrafine Pd nanoparticles can largely increase the relative percentage of chemisorbed oxygen and deficient oxygen, which are benefits for ethylene oxidation, and actually accelerate the process of the sensing reaction. Furthermore, the UPNP ZnO nanosheets can even be applied in fruit maturity detection. Using mangos as an example, our experiment revealed that the response of UPNP ZnO nanosheets to mangos at different maturity stages was quite different. This result suggests that our product has broad application prospects in monitoring fruit ripening stage.

Graphical Abstract

1. Introduction

Ethylene is the most common ripening phytohormone of fruits [1,2,3]. Fruits release ethylene in the climacteric stages to accelerate ripening [4,5]. The ethylene efflux rate of fruits is quite different in different ripening stages, especially for some climacteric fruits, such as apple, banana and mango [6,7]. Excessive ethylene would cause the fruit to overripen. However, it is difficult to monitor the ethylene release rate of the fruits, which results in large economic losses in whole fruit supply chains [8,9,10]. Therefore, it is quite significant to achieve real-time monitoring of the ethylene concentration in fruit supply chains. At present, ethylene is primarily measured using several stationary instruments in laboratories, such as gas chromatograph, non-dispersive infrared spectroscopy and photoacoustic spectroscopy [11,12,13,14]. These methods certainly have some advantages, such as high sensitivity and high accuracy; however, the high cost and the lack of portable units have seriously hampered the large-scale application of in-field detection for ethylene.
Metal oxide semiconductor (MOS)-based gas sensors with the virtues of simplicity, low cost and rapid testing speed have exhibited great application potential in real-time detection of ethylene [15,16,17]. Several reports have mentioned MOS ethylene sensors. Damrongsak found that silicalite-coated SnO2 thin film showed a good response to ethylene [18]. Yootana synthesized a WO3-SnO2 nanocomposite which presented a sensitive response to 2–8 ppm ethylene at optimum operating temperature [19]. The sensing performance of ethylene detection still remains poor in spite of MOS gas sensors, and low-concentration ethylene detection is still a big challenge. Noble metal modification would effectively enhance the sensitivity of MOS sensors. Due to the excellent catalytic properties of noble metals, the oxidation reaction that occurs on the sensing film can obviously be accelerated, which further increases the sensing performance of the MOS gas sensors. According to previous reports, Pd has been verified to exhibit great catalytic effects in gas-sensing reactions [20,21,22]. Kolmakov prepared Pd-functionalized SnO2 nanowires which exhibited a dramatic enhancement in sensitivity to hydrogen [23]. Yang synthesized Pd-loaded SnO2 nanofibers which demonstrated a significantly higher response to hydrogen compared to the unloaded samples [24]. Moreover, it is well accepted that smaller noble metal nanoparticles always result in better catalytic performance. Wilson reported the size effect of Pd particles in hydrogenation of allyl alcohol, and the hydrogenation kinetics were dominated by electronic effects for the smallest particles [25]. Zhou prepared small carbon-supported Pd nanoparticles with controllable size, and the testing results proved that smaller Pd nanoparticles were favorable for formic acid electrooxidation [26]. However, modifying the sensing materials with ultrafine Pd nanoparticles is still a big challenge.
Zinc oxide (ZnO), with its prominent photonic and electronic properties, has been extensively utilized in gas detection [27,28,29]. Various ZnO nanostructures have been synthesized for gas detection [30,31,32,33,34]. Wang synthesized ZnO nanorods with diameters from 90 nm to 200 nm which exhibited a high, reversible and rapid response to ethanol [35]. Bie fabricated nanopillar ZnO gas sensors which exhibited a relatively large response to ethanol and hydrogen [36]. ZnO nanomaterials have been widely studied in gas detection; however, their sensing performances for ethylene are quite limited. In this work, we synthesized UPNP ZnO nanosheets through a facile in situ reduction method. The size of the modified Pd nanoparticles was almost 2 nm on average. Due to the excellent catalytic performance of the ultrafine Pd nanoparticle, the working temperature of the UPNP ZnO nanosheets was much lower than that of the pure ZnO nanosheets. Furthermore, the UPNP ZnO nanosheets presented an extremely high sensing performance towards ethylene, and the detection limit was as low as 10 ppb. The sensing performance of the UPNP ZnO nanosheets in the mango maturity test was also investigated for practical application. The results indicate that the as-prepared sample exhibited an outstanding response to the mangos at different maturity stages. Thus, it is expected that UPNP ZnO nanosheets could become promising sensing materials to monitor the ripening stages of fruits in supply chains.

2. Experimental Method

2.1. Chemicals and Reagents

The ethylene gas was supplied by Beijing Haipu-Gas Co., Ltd. (Beijing, China). Sodium borohydride (NaBH4), palladium chloride (PdCl2), urea (CO(NH2)2) and zinc acetate (Zn(CH3COO)2∙2H2O) were purchased from Shanghai McLean Biochemical Technology Co., Ltd. (Shanghai, China). The aqueous solutions were prepared using deionized water.

2.2. Preparation of the Porous ZnO Nanosheets

The porous ZnO nanosheets were prepared using a one-pot wet-chemical method followed by an annealing treatment. Zinc acetate (1 g) and urea (4 g) were dissolved into deionized water (40 mL) and then stirred for 1 h. The transparent solution was sealed in a conical flask and heated in a 100 °C oven for 6 h. The products were cooled to room temperature and then centrifuged, washed and dried. Finally, the porous ZnO nanosheets were obtained by annealing at 300 °C in a muffle furnace for 2 h.

2.3. Preparation of the Ultrafine Pd Nanoparticles-Decorated ZnO Nanosheets

In this study, the UPNP ZnO nanosheets were synthesized through an original reduction method. Typically, 30 mg of porous ZnO nanosheets was dispersed into 30 mL of deionized water. In addition, 10 mL of as-prepared palladium chloride solution was added into the ZnO suspension and stirred for 30 min. Then, sodium borohydride solution (1 mol/L) was added drop by drop until the black precipitate occurred. Finally, the resultants were centrifuged, washed and dried, and the UPNP ZnO nanosheets were obtained.

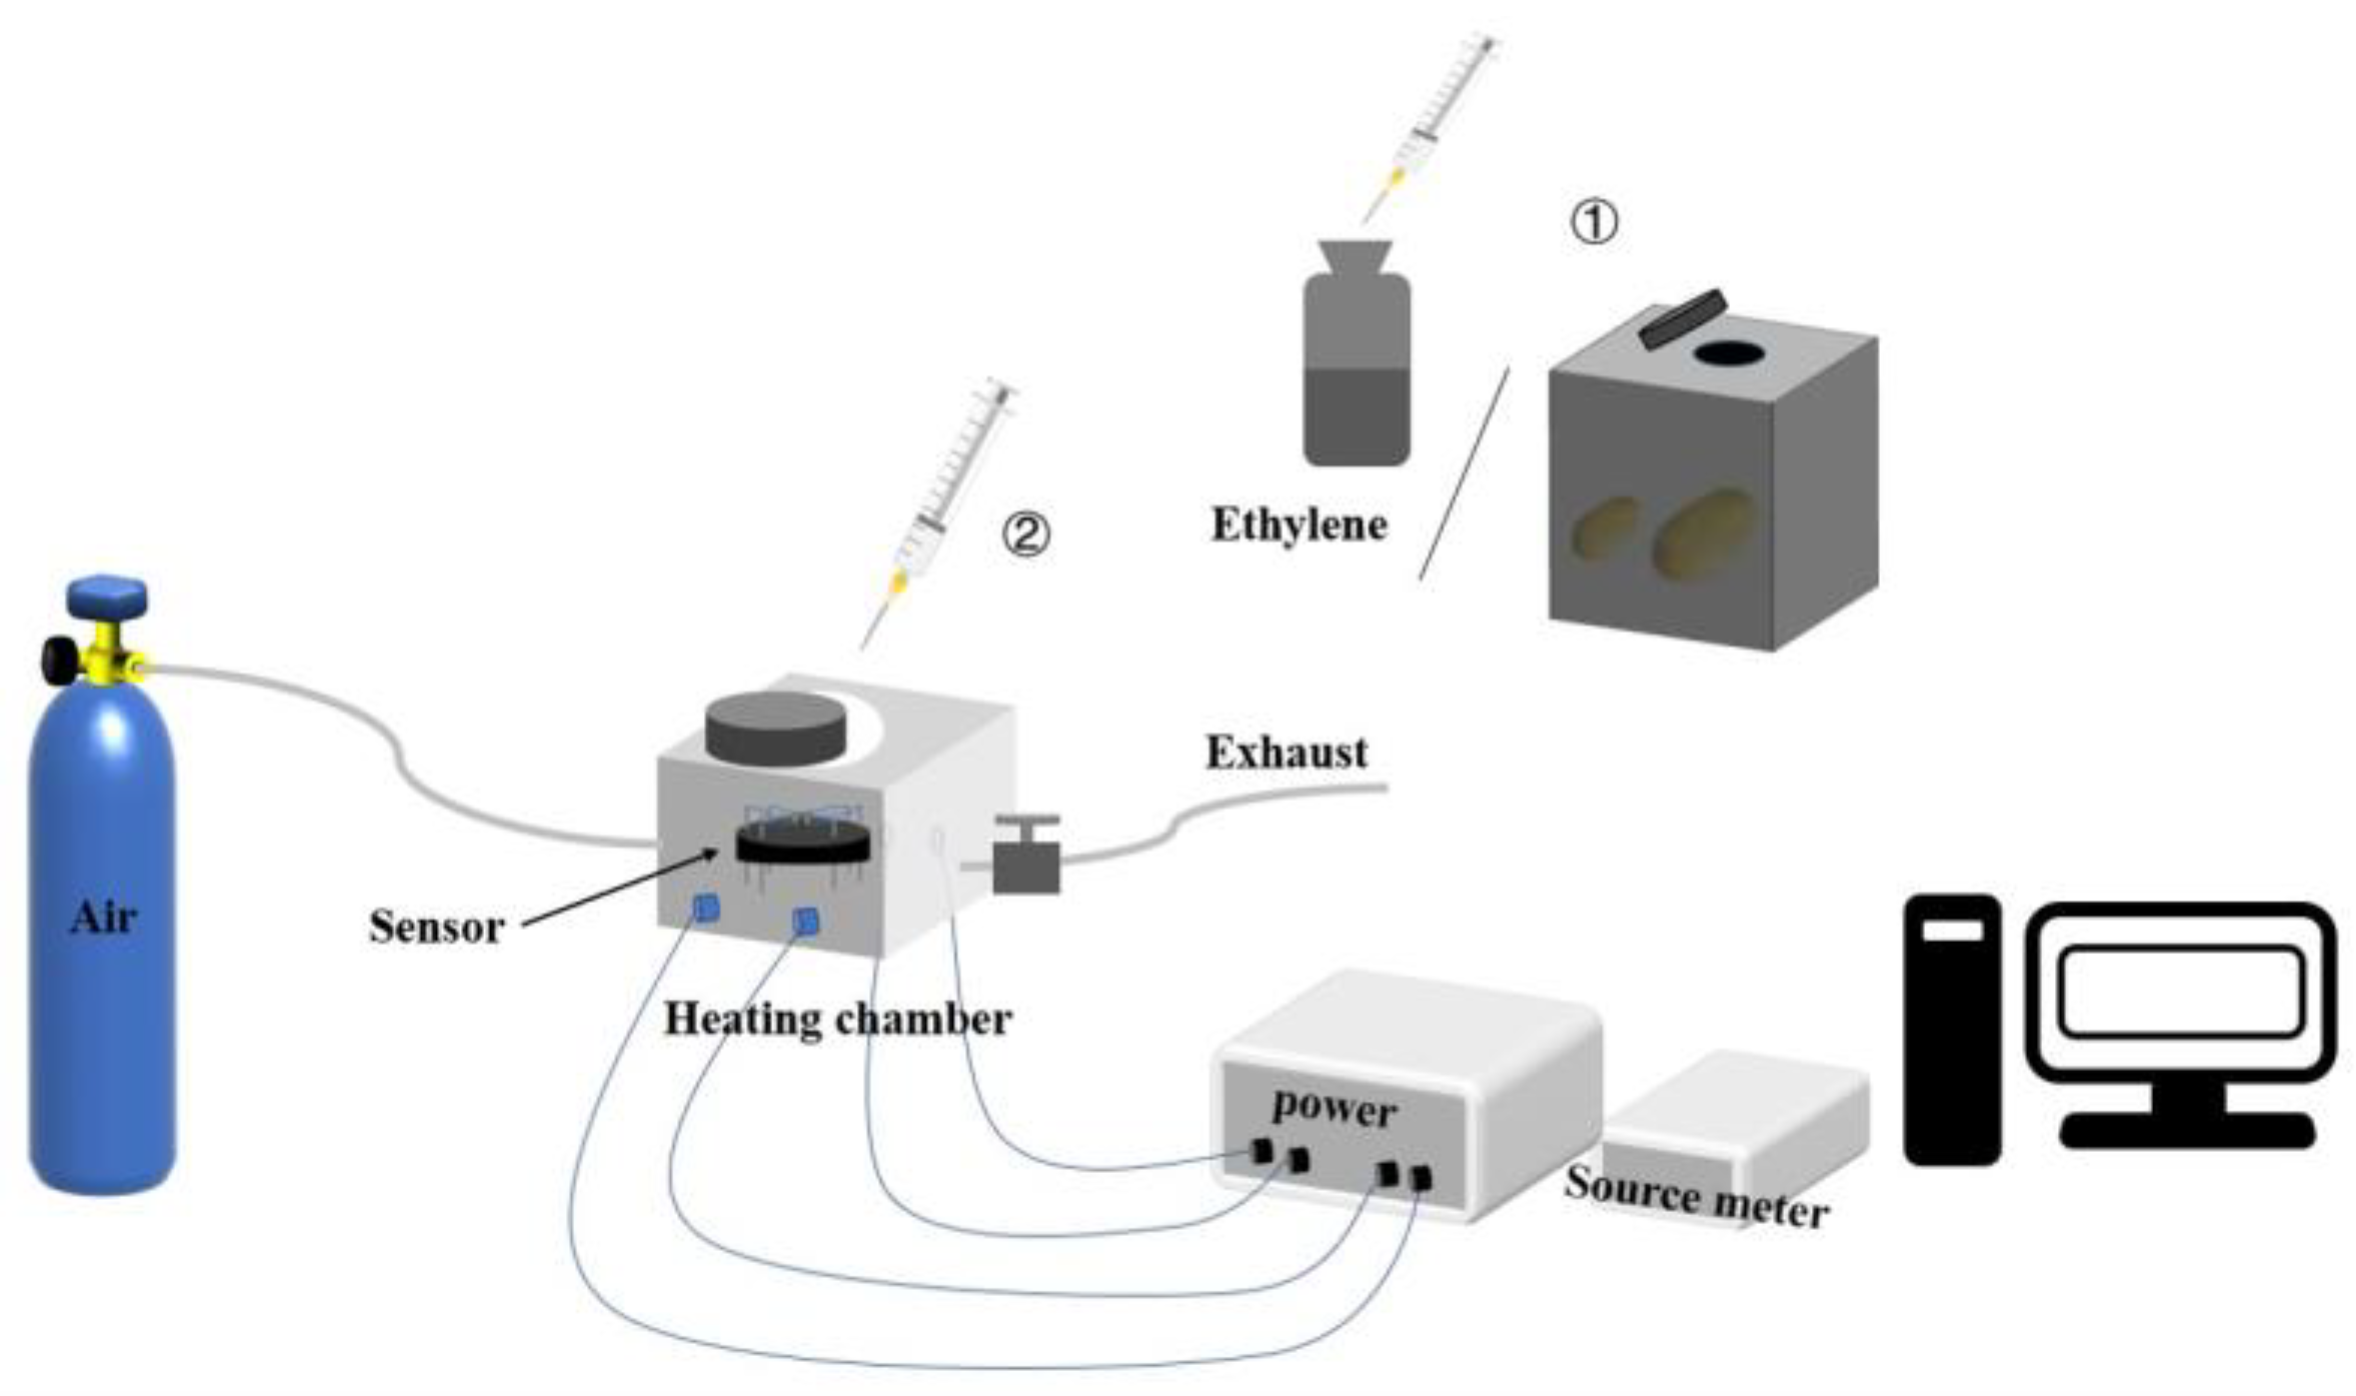
2.4. Measurement System of the Sensor

The schematic diagram of the measurement setup is presented in Figure 1. Typically, a closed chamber (1000 mL) which was equipped with a suitable inlet and an outlet for gas flow was implemented to perform the gas-sensing test. A Source/Measure Unit (Keithley 6487, Tektronix, Beaverton, OR, USA) was used in order to record the change of current passing through the films, as well as to provide a power source. When the test began, a constant voltage was applied to a pair of electrodes between the sensing films, and then the current was measured and recorded. A certain concentration of ethylene was introduced into the test chamber through the inlet using a microinjector. The measurement was completed until the response became flat and finally stayed stable, and then fresh air was inputted into the chamber to release the ethylene. The ethylene concentration could be calculated from the saturated vapor pressure of the organic vapor at standard atmospheric pressure.
The response of the sensor is defined as:
Response = R a R g × 100 %
Ra and Rg are the resistance of the sensing film in the air and target gas, respectively. The response time is defined as the time when the current change reaches 90% of the equilibrium current when exposed to the target gas. Similarly, the recovery time is defined as the time when the current reaches 90% reversal.
The test of ethylene was conducted in the test chamber by injecting an appropriate amount of ethylene gas; ethylene with different concentrations could be achieved.

2.5. Mango Test of Ripening Stages

The practicability of measuring fruit ripeness was discussed through experiments on mangos. First, 6 mangos (all green, light green, half green, half yellow, all yellow and all orange) of similar size at different stages of maturity were sealed in different containers of the same volume (3 L), respectively. In the next 24 h, gases were extracted continuously from the container with a microinjector at regular intervals and injected into the test chamber.

3. Results and Discussion

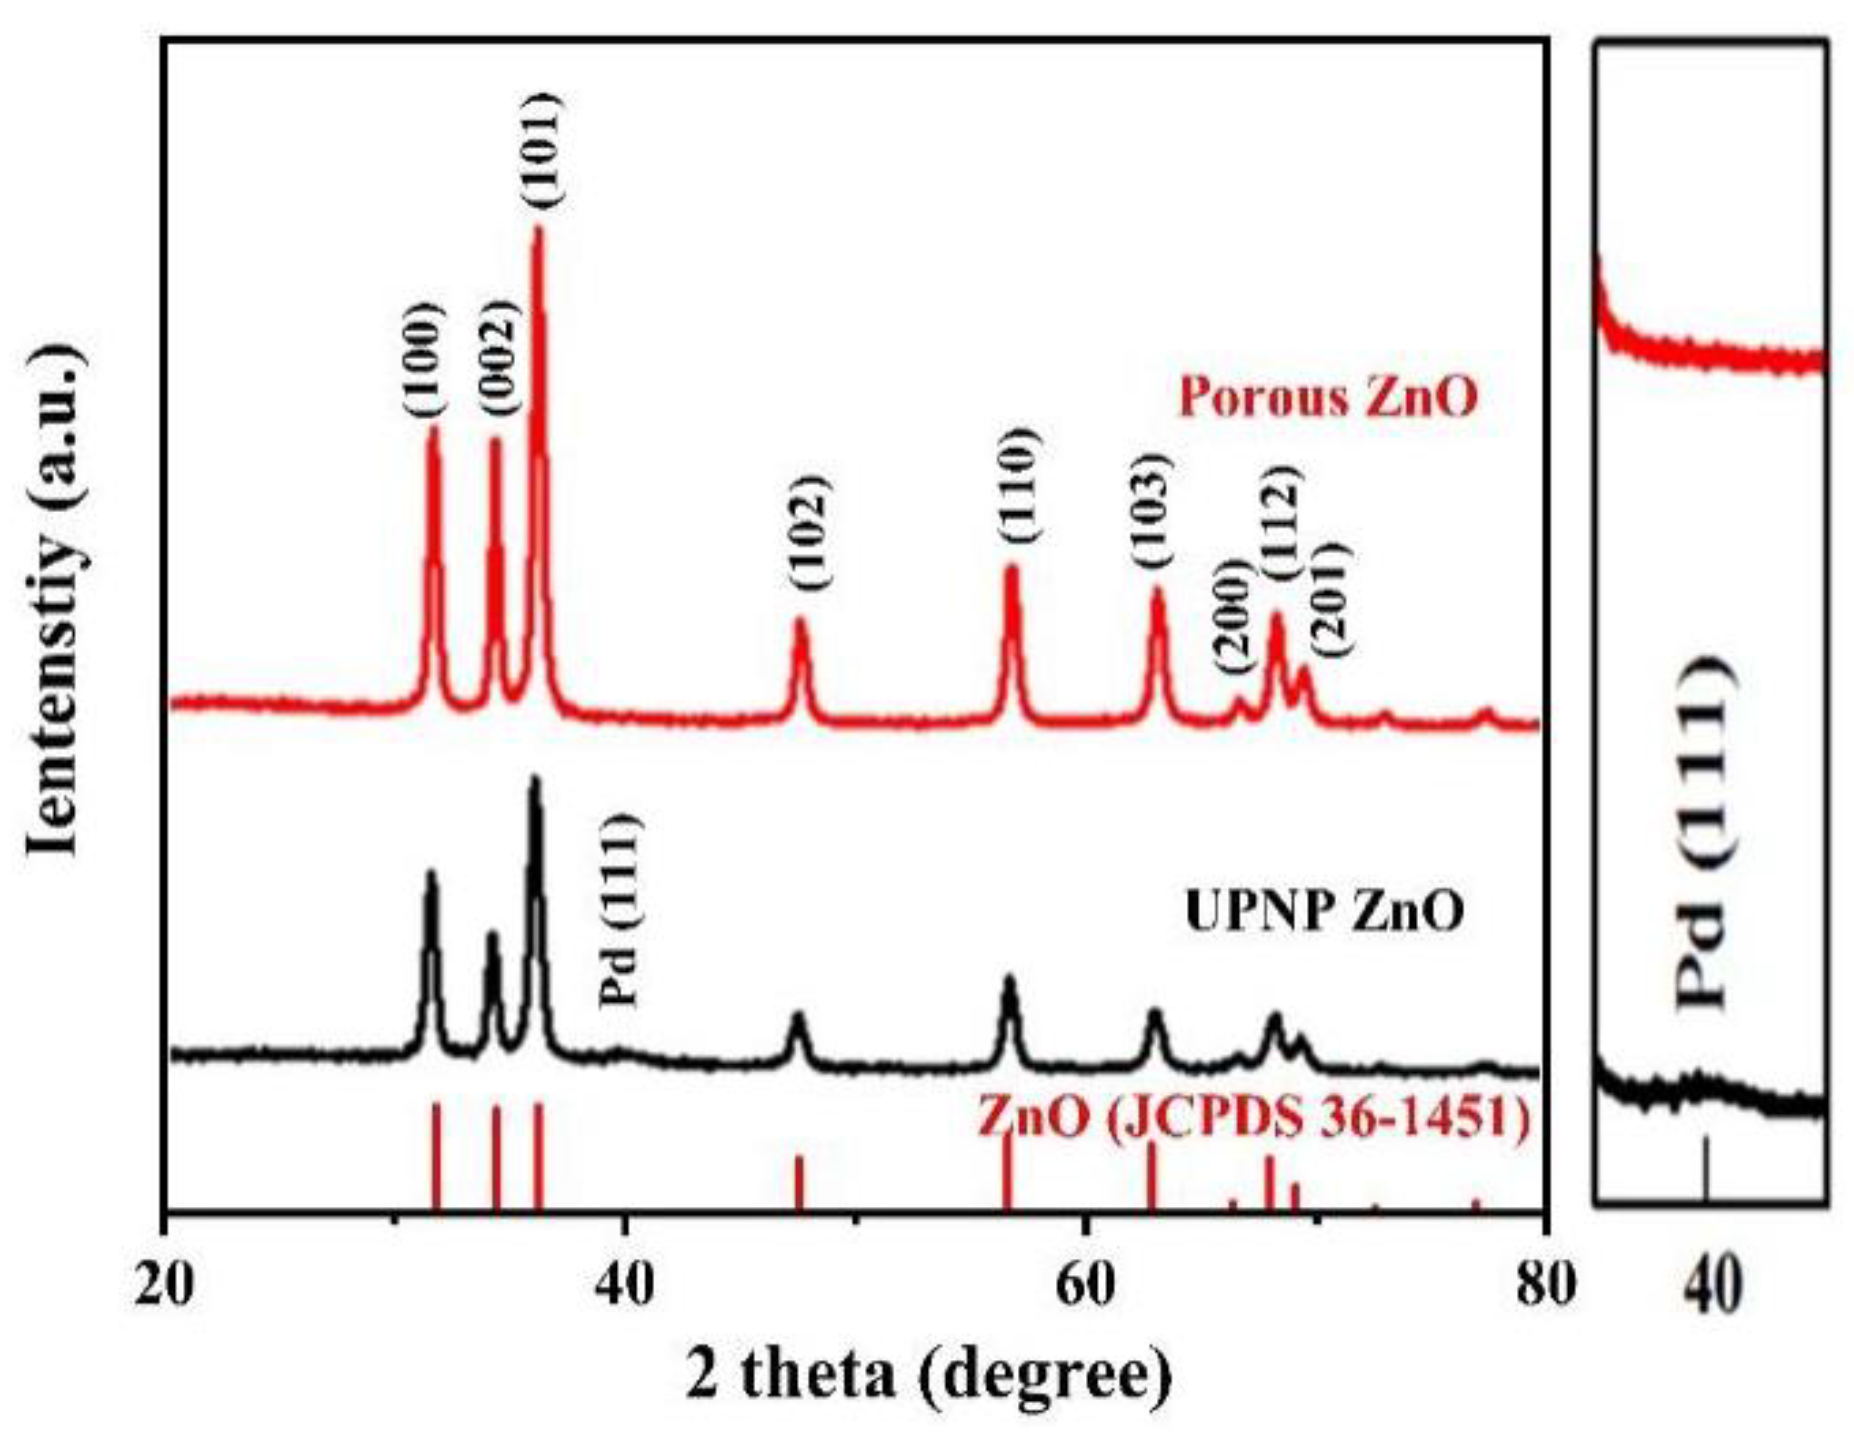
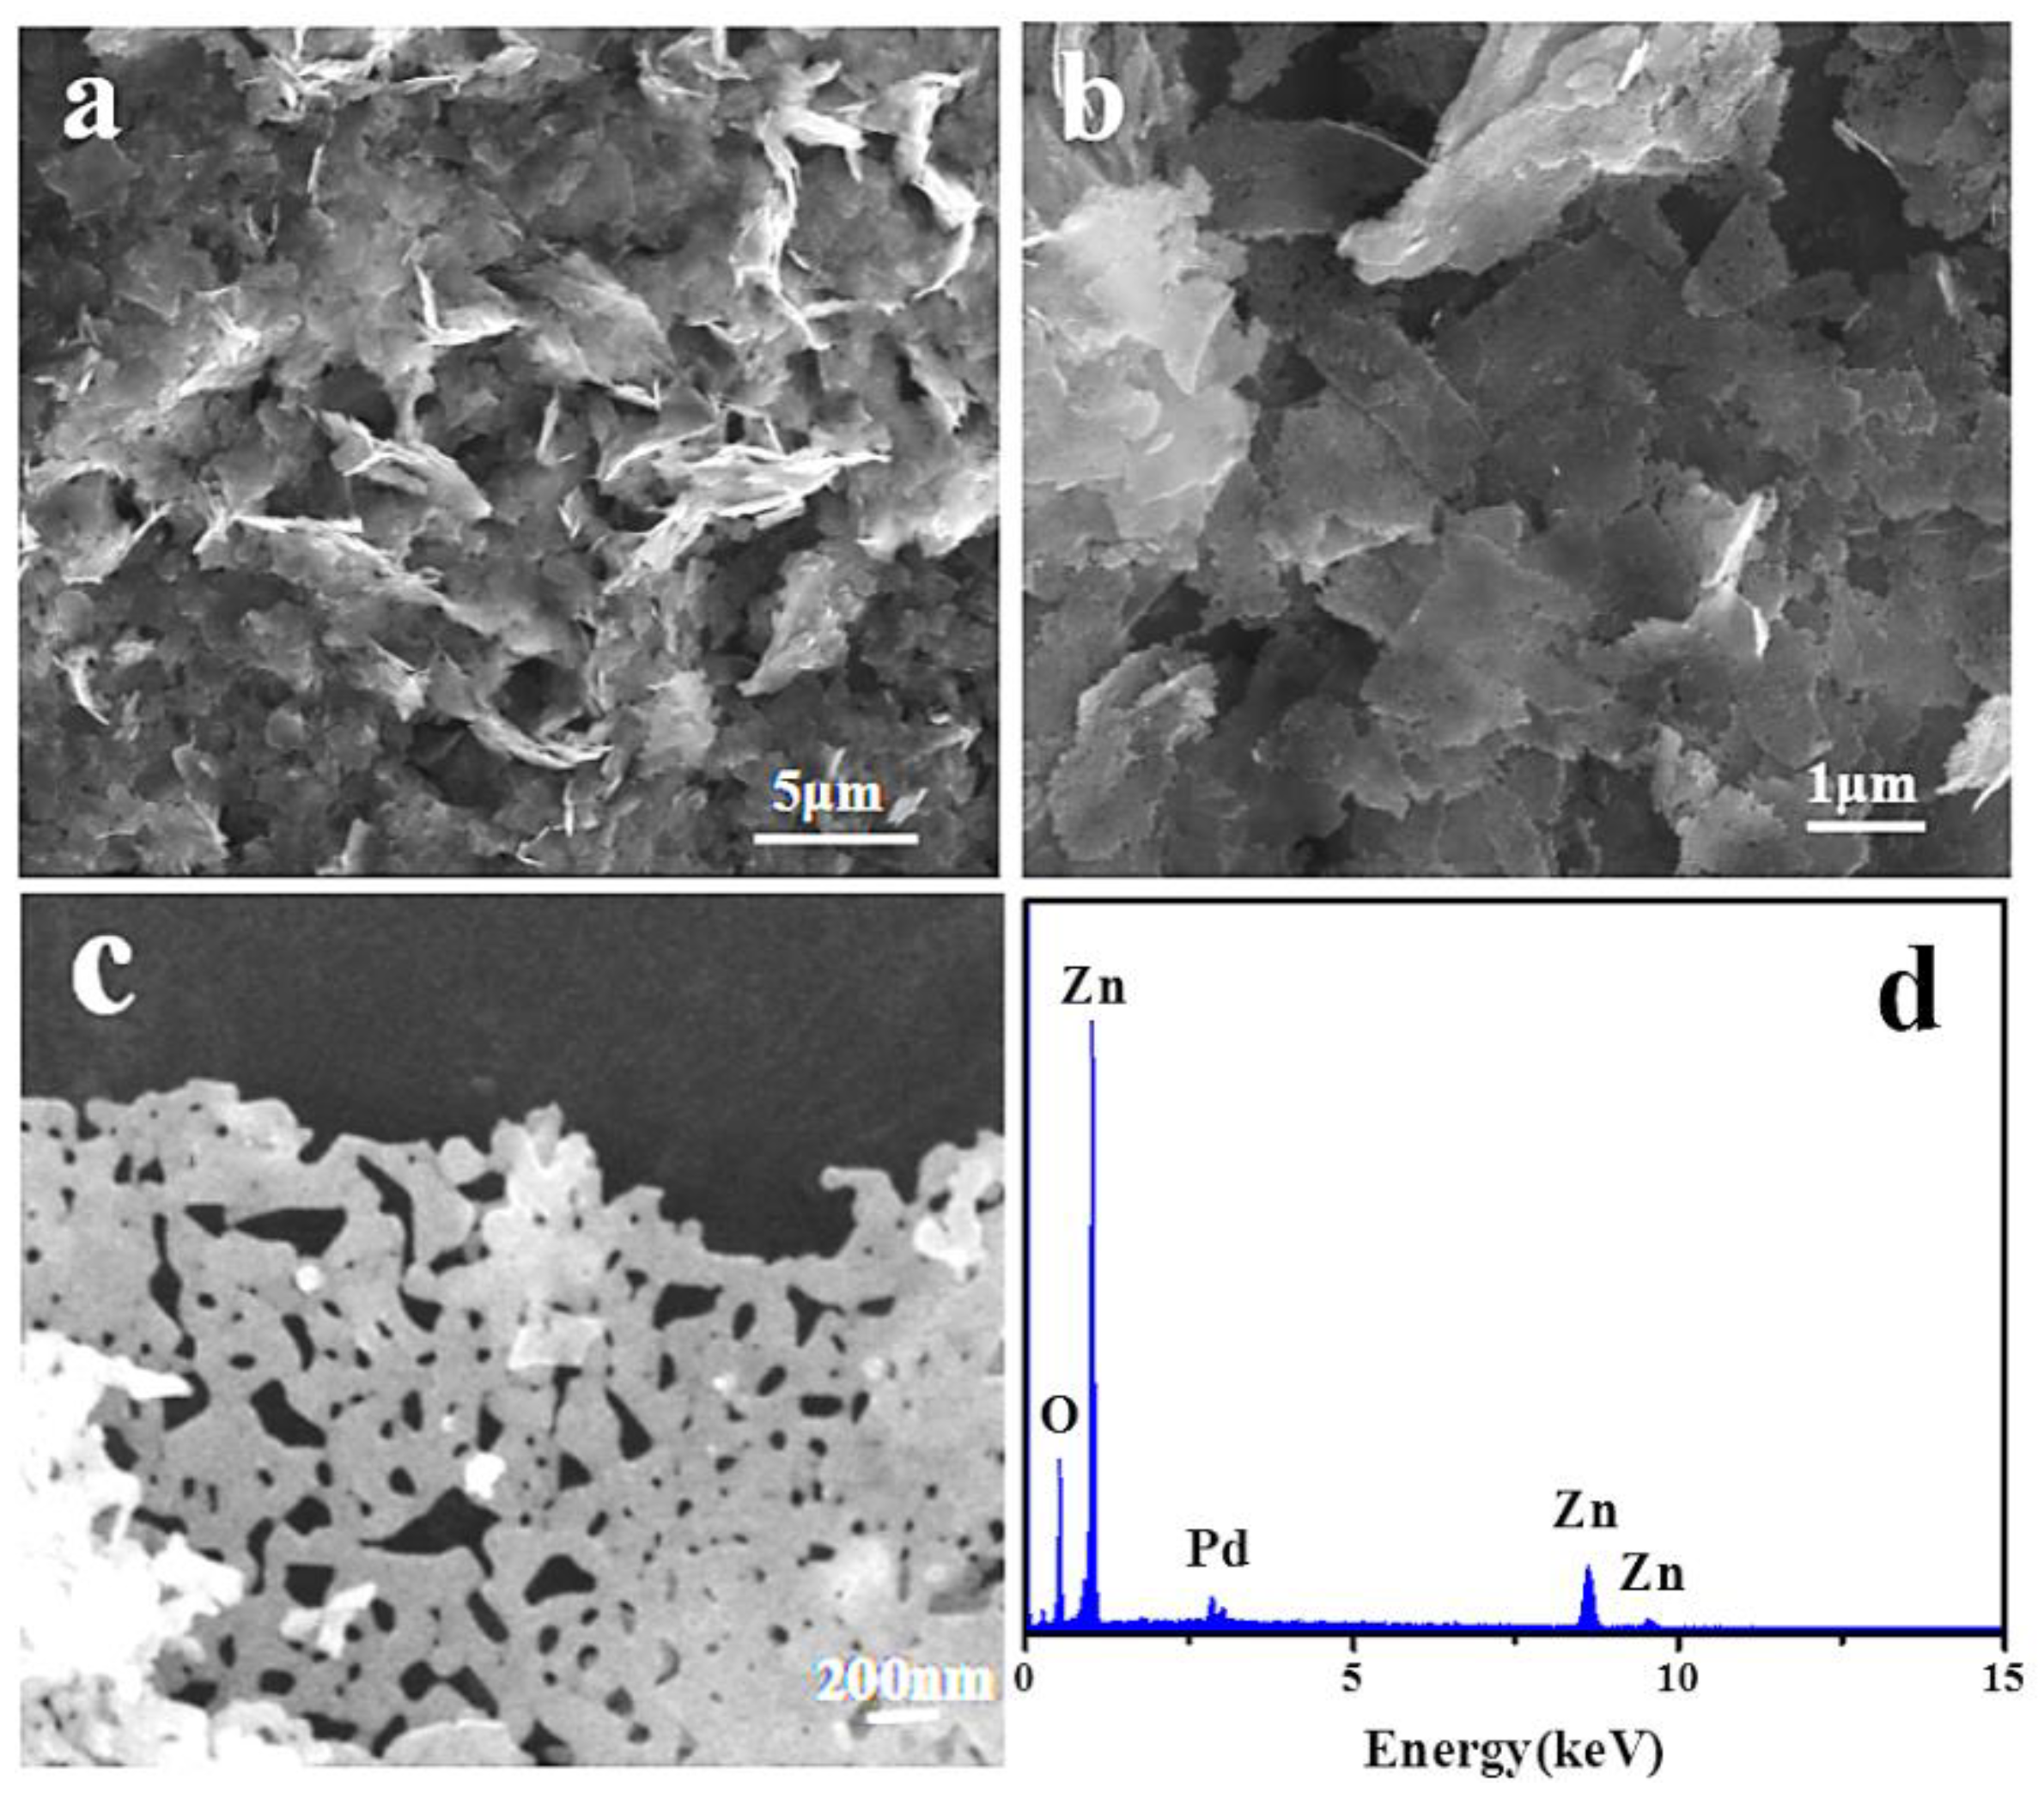
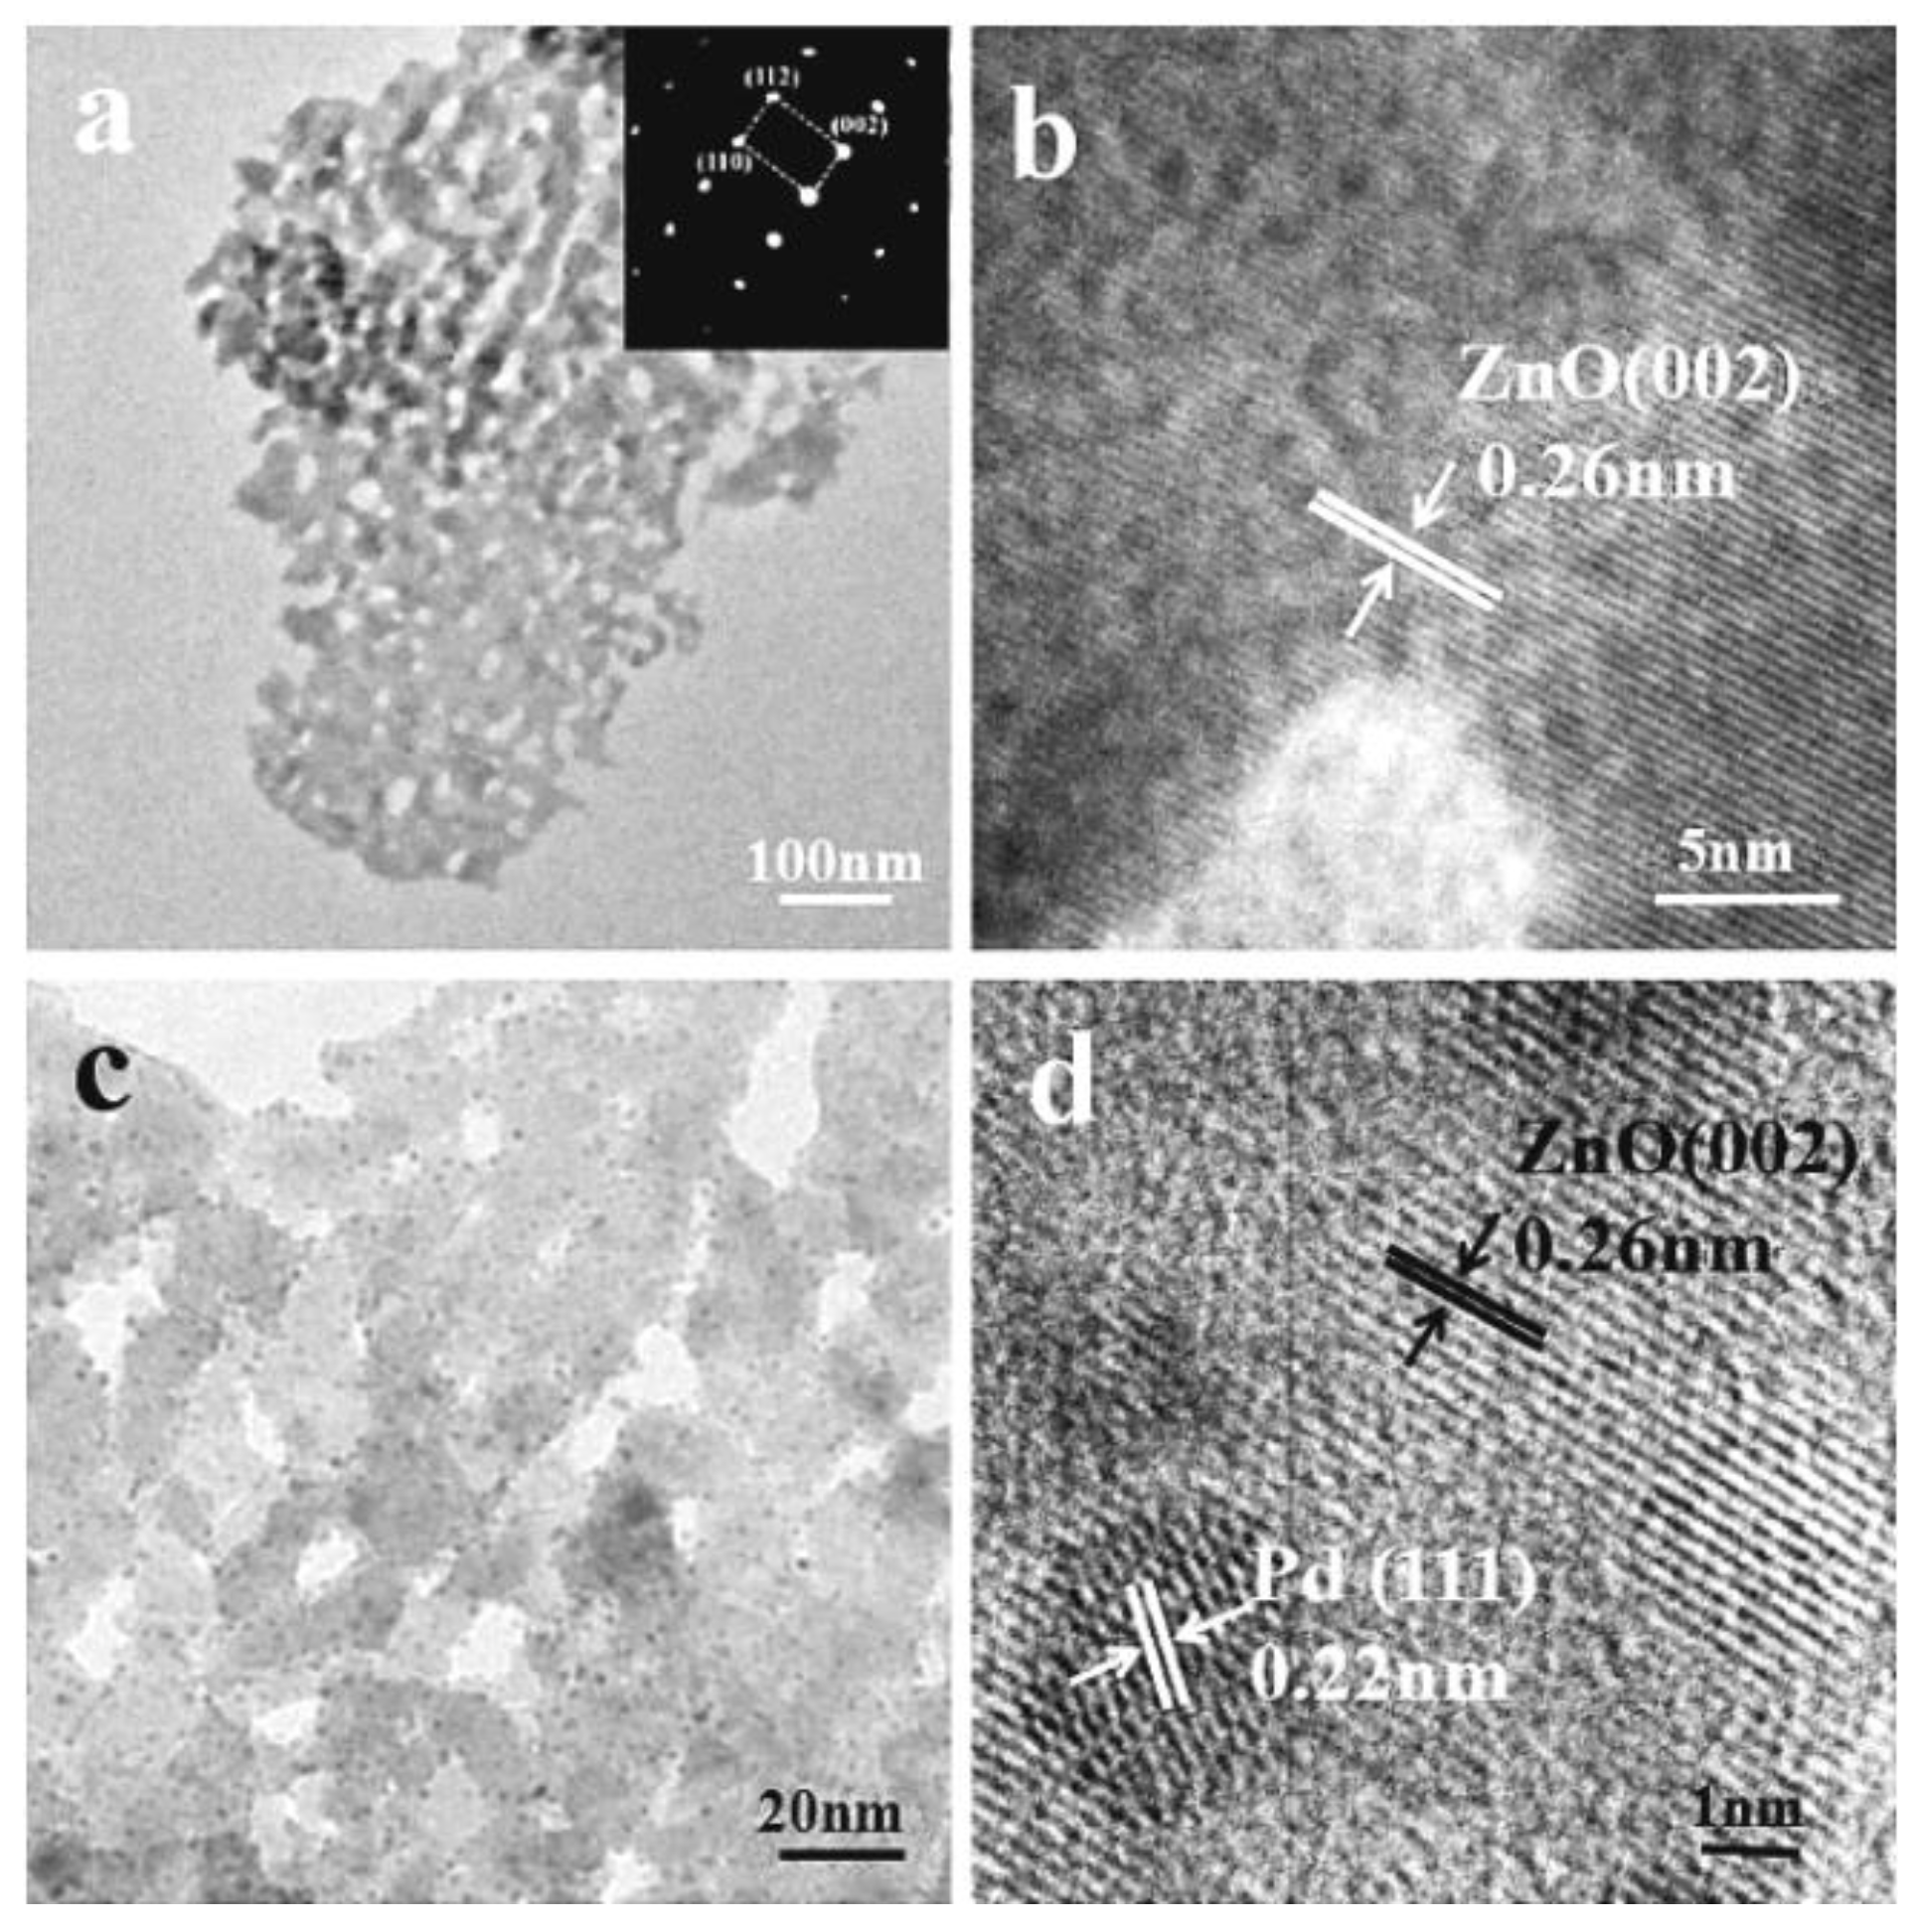
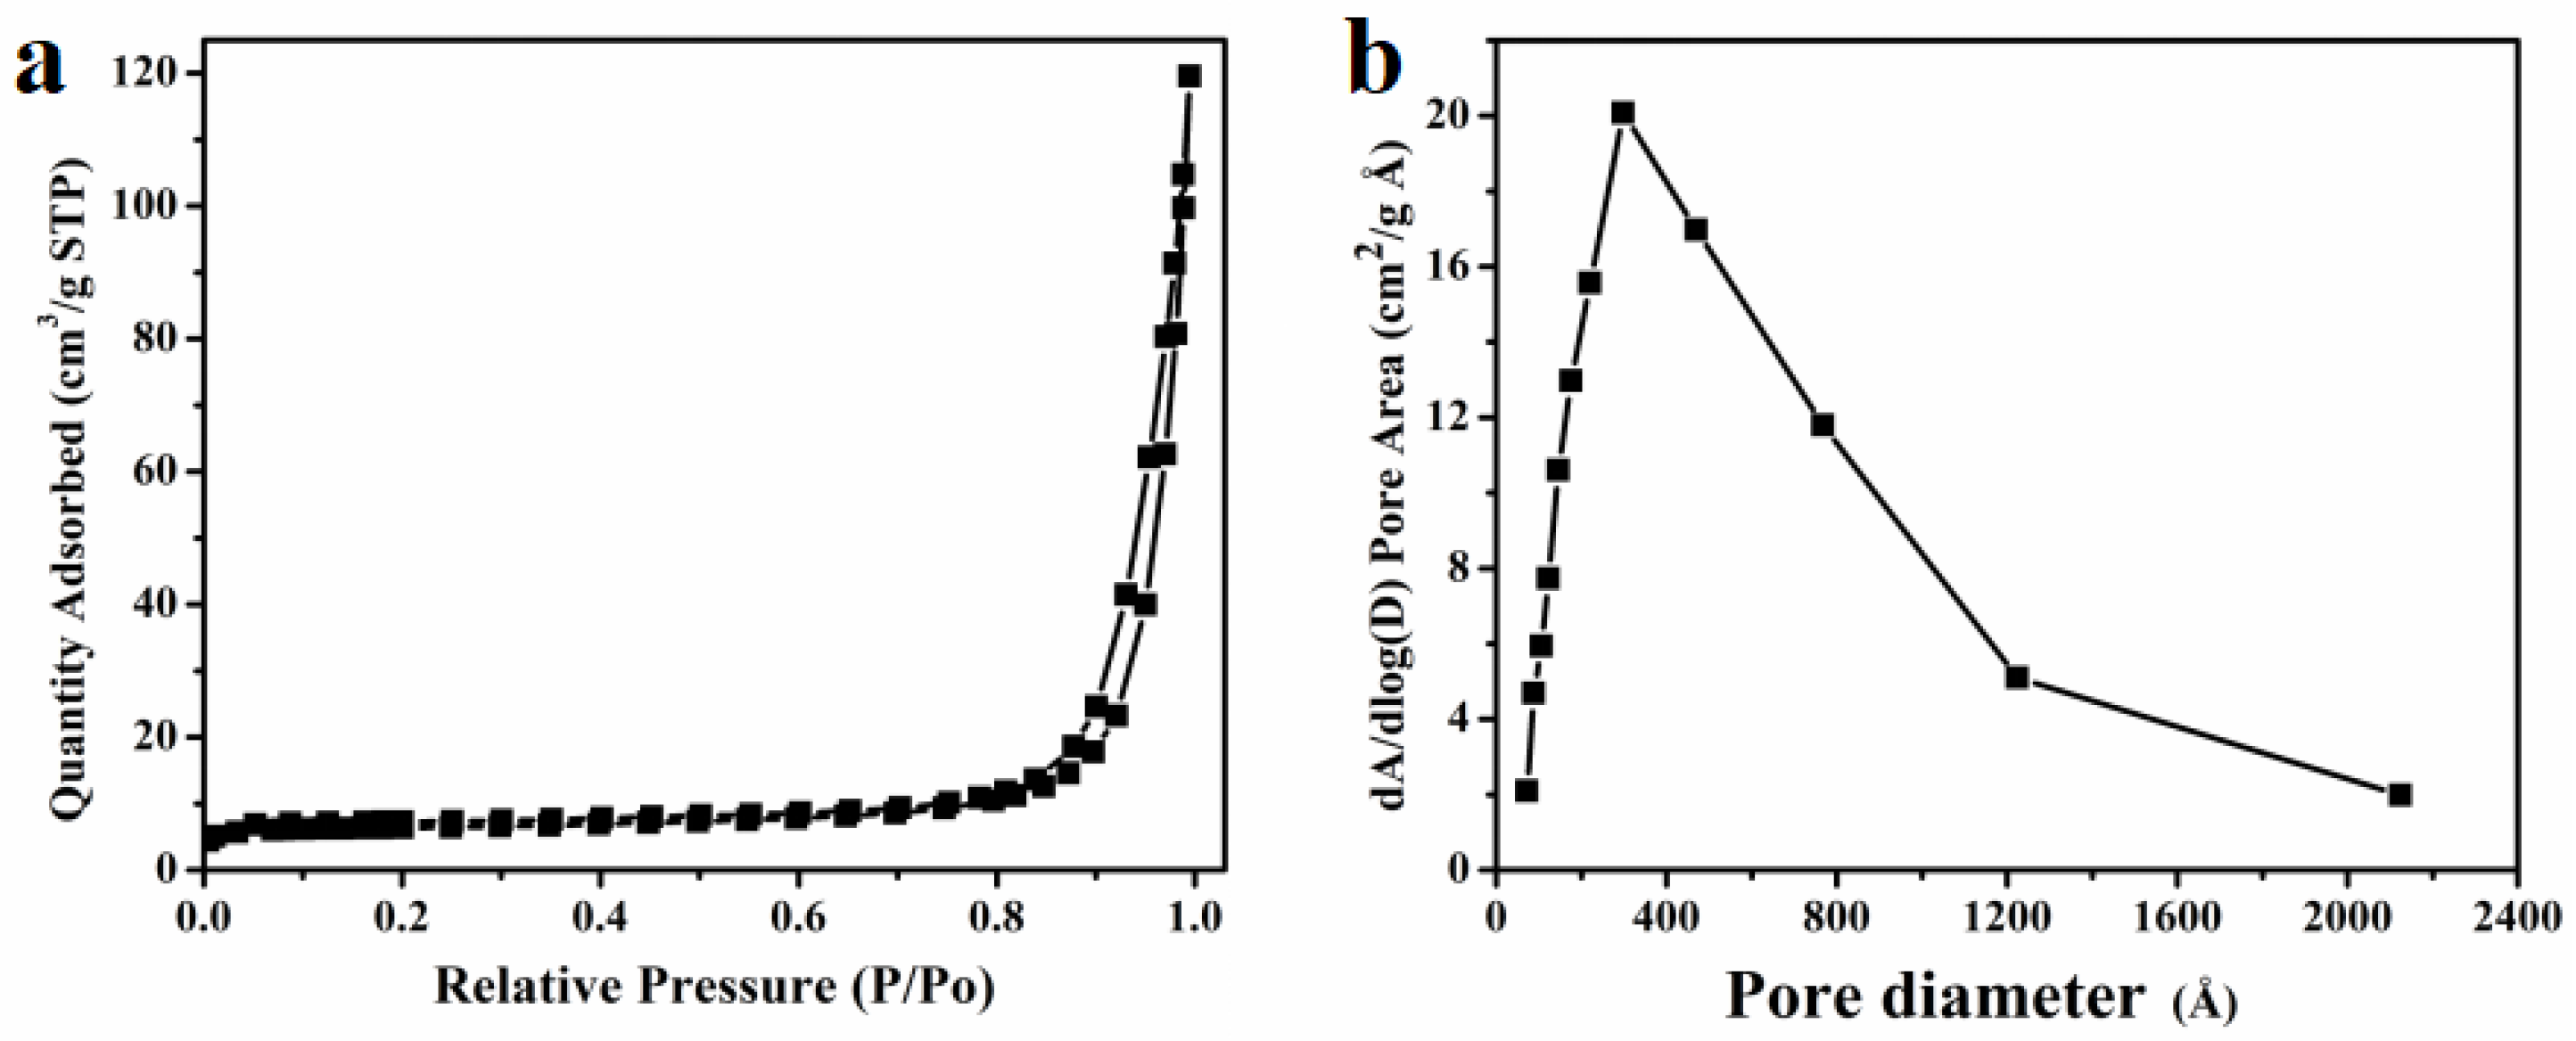
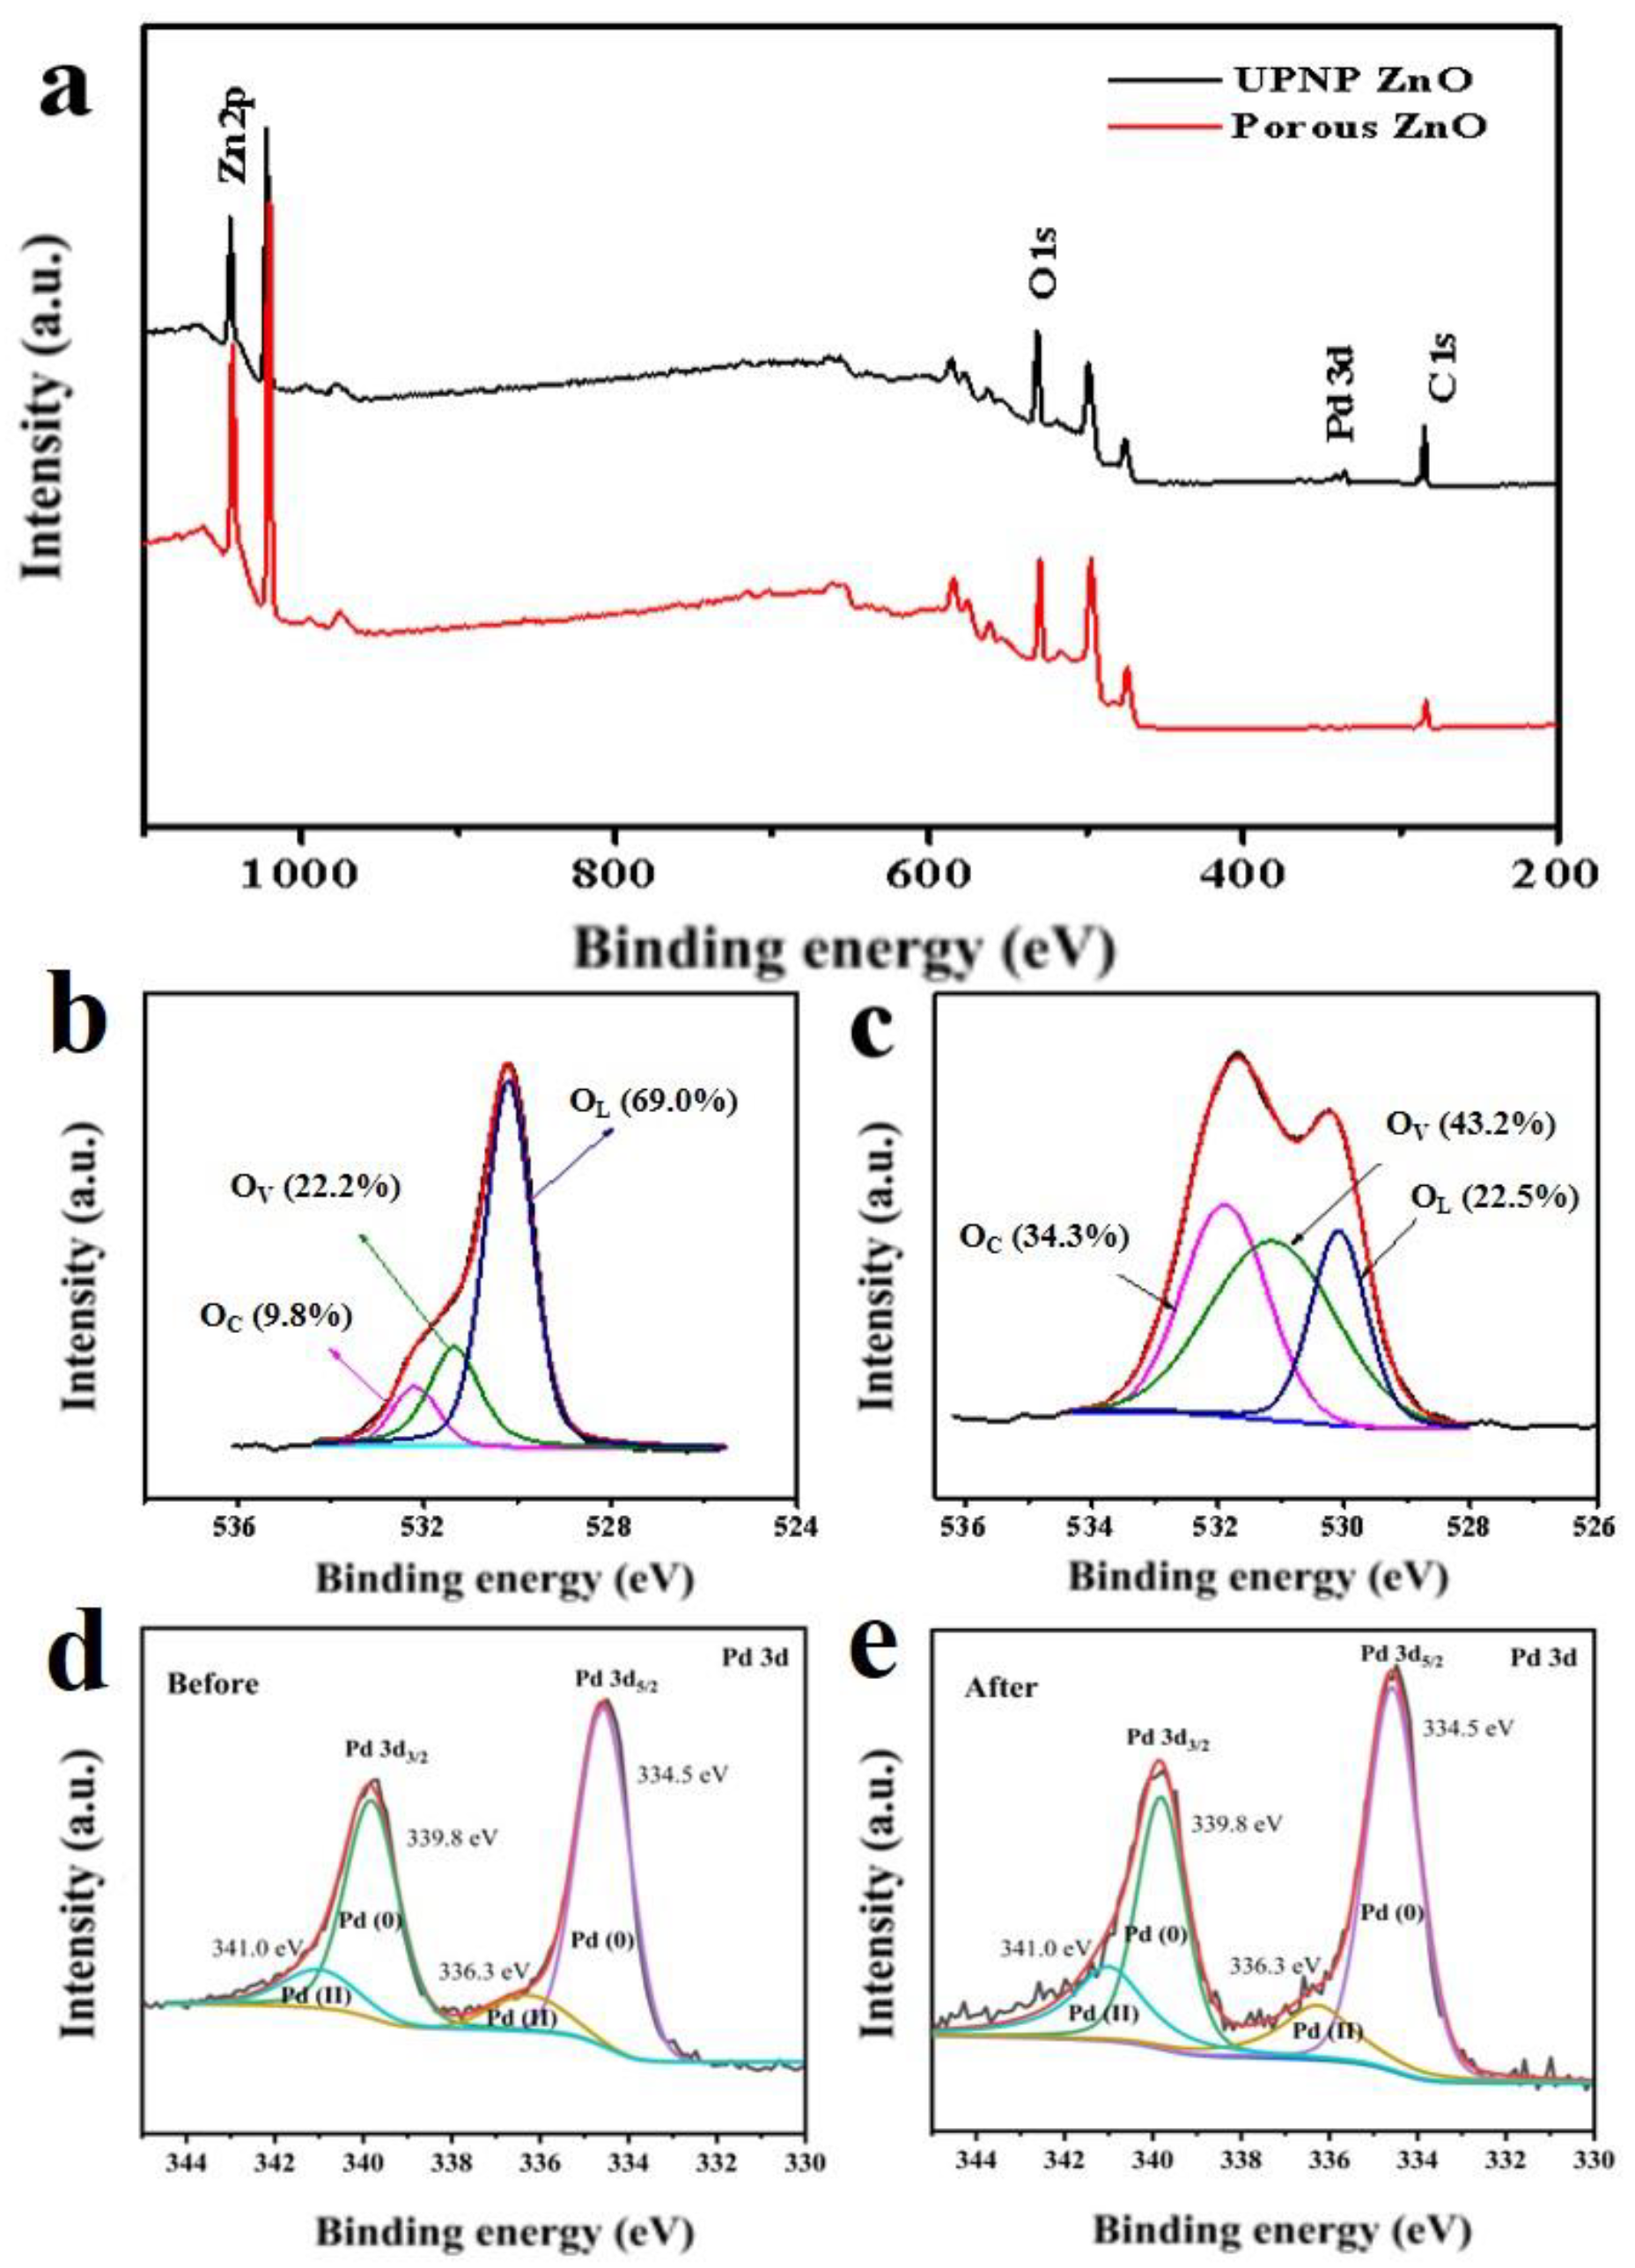
3.1. Characterization of the UPNP ZnO Nanosheets and ZnO Nanosheets

The crystal structures of the porous ZnO nanosheets and as-prepared UPNP ZnO nanosheets were determined using XRD (Figure 2). All peaks of the porous ZnO nanosheets could be indexed to wurtzite ZnO (JCPDS 36-1451). Three main peaks corresponding to the (100), (002) and (101) crystallographic planes can be clearly observed. Compared to porous ZnO nanosheets, an additional weak Pd peak of the (111) plane can be seen in the XRD pattern of UPNP ZnO nanosheets, confirming a modification of ultrafine Pd nanoparticles to ZnO nanosheets.
The morphologies of the UPNP ZnO nanosheets were firstly investigated using SEM. Figure 3a–c show the low- and high-magnification SEM images of the UPNP ZnO nanosheets, and numerous randomly placed nanosheets with lots of mesopores can be clearly observed. However, because of the teeny size of Pd particles, it is hard to observe Pd particles from the SEM images. Figure 3d exhibits the EDS spectrum of the UPNP ZnO nanosheets, and a weak Pd peak can be observed, indicating the existence of the Pd particles.
As shown in Figure 4, the TEM and HRTEM images of the porous ZnO nanosheets and UPNP ZnO nanosheets were further investigated. Figure 4a presents a typical TEM image of the porous ZnO nanosheets, from which it can be observed that plenty of mesopores were distributed on the nanosheets, and the corresponding SAED pattern was well-ordered dots, as the illustration exhibits. The HRTEM image of the porous ZnO nanosheet is shown in Figure 4b, from which the lattice-fringes-coherent orientation of lattice fringes on the whole nanosheet can be clearly seen. The lattice spacing of 0.26 nm can be indexed to the (002) planes of the hexagonal phase ZnO. These results prove the single-crystalline structure of the porous ZnO nanosheets. Figure 4c shows the TEM image of the UPNP ZnO nanosheets, from which it can be observed that lots of ultrafine Pd nanoparticles were distributed over the porous ZnO nanosheets. The HRTEM image of the UPNP ZnO nanosheets is shown in Figure 4d; it can be seen that the lattice fringes of the Pd (111) planes were interlaced on the coherent lattice fringes of the ZnO nanosheets. The average diameter of the Pd nanoparticles was about 2 nm. The ultrafine size of Pd nanoparticles always brings a better catalytic property; thus, the UPNP ZnO nanosheets would be expected to exhibit enhanced sensing performance.
A BET analysis was studied to represent the porous feature of the UPNP ZnO nanosheets. The nitrogen adsorption–desorption isotherm and pore size distribution of the UPNP ZnO nanosheets are shown in Figure 5a,b. The observed loop can be classified as type H3 hysteresis loops, indicating the existence of abundant pores according to the IUPAC classification. The average pore diameter is about 43.2 nm, and the BET surface area of the material is 25.1 m2 g−1. The highly specific surface area and porous structure endow plenty of active sites for surface chemical reactions, making the UPNP ZnO nanosheets sensor more sensitive. Moreover, the porous structure of the UPNP ZnO nanosheets provides more gas diffusion channels, allowing gas molecules to contact the sensing material more effectively.

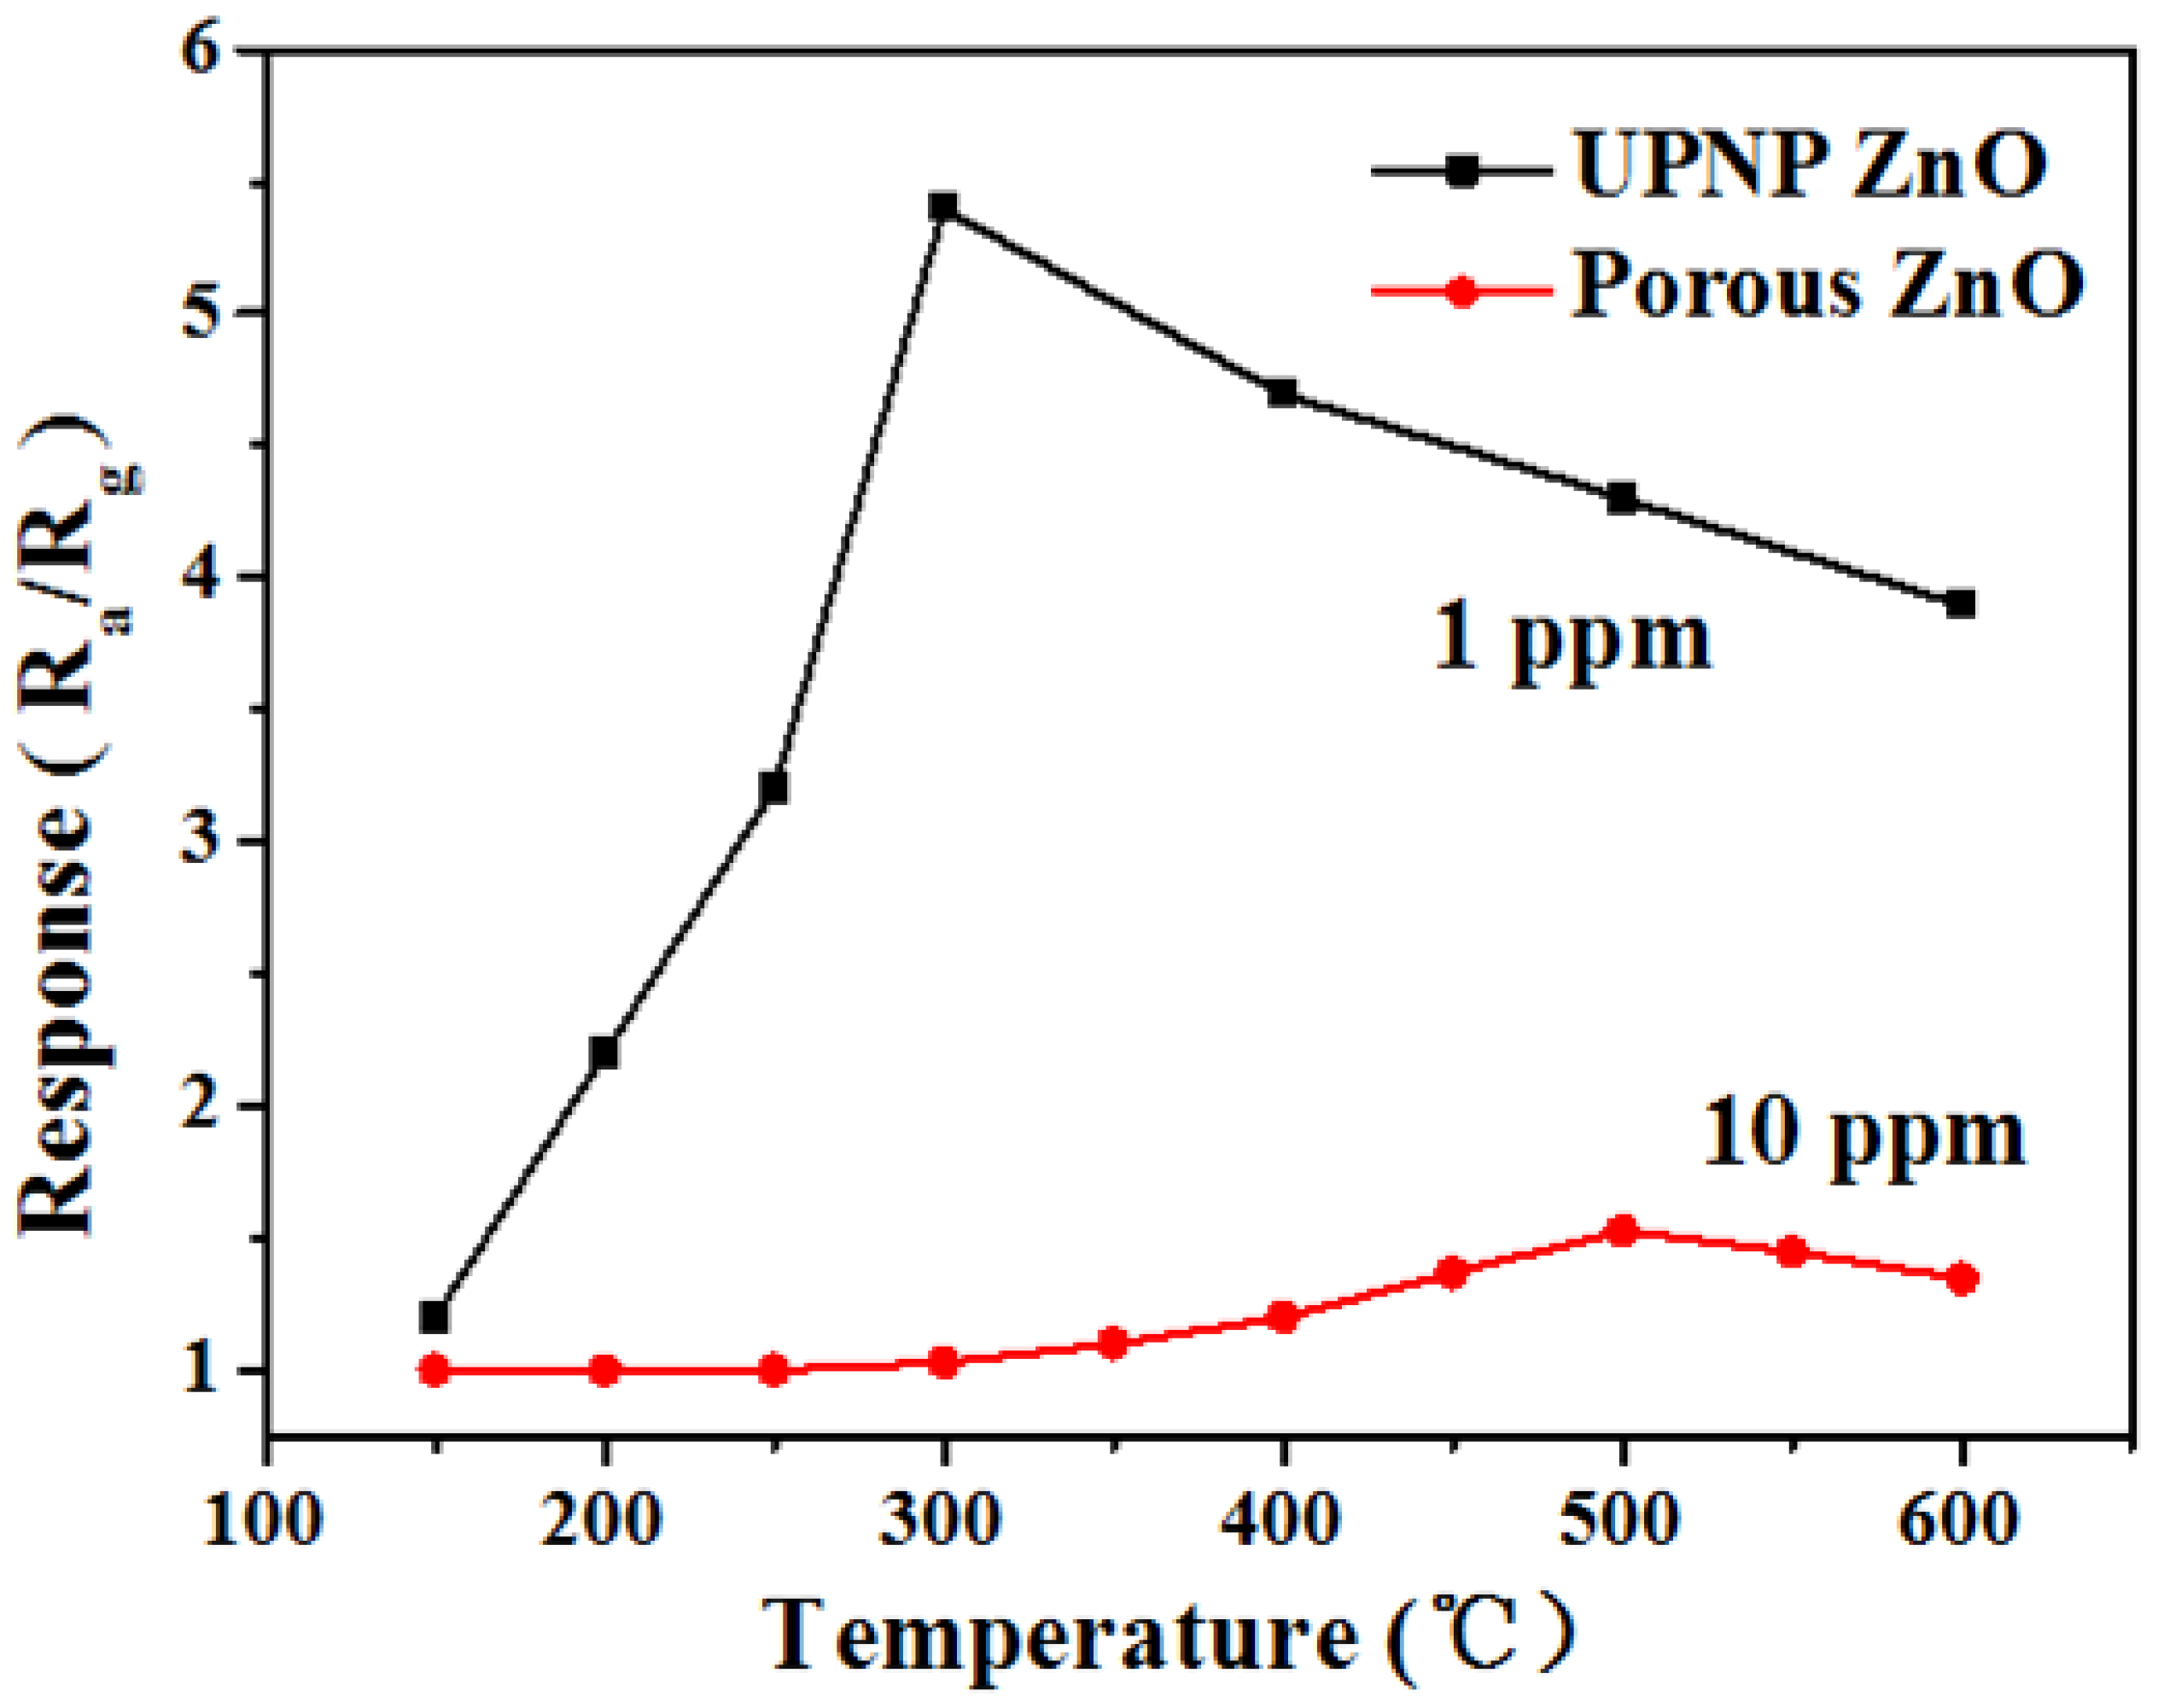
3.2. Operating Temperature of the Pure and Pd-Decorated ZnO Nanosheet-Based Sensor to Ethylene

Usually, temperature make a strong effect to the sensing performance of metal oxide gas sensors. Thus, as shown in Figure 6, the responses of the porous and UPNP ZnO nanosheet to 10 ppm and 1 ppm ethylene are systematically investigated at different temperatures, respectively. It can be clearly seen that the response of the UPNP ZnO nanosheet increases first. When temperature reaches 300 °C, the curve shows a turning point. Therefore, 300 °C can be regarded as the optimal working temperature of the UPNP ZnO nanosheets sensor. Meanwihile, the optimal working temperature of the porous ZnO nanosheets is 500 °C. Obviously, the UPNP ZnO nanosheets possess a lower optimal operated temperature due to the strong catalytic capacity of the ultrafine Pd nanoparticles.

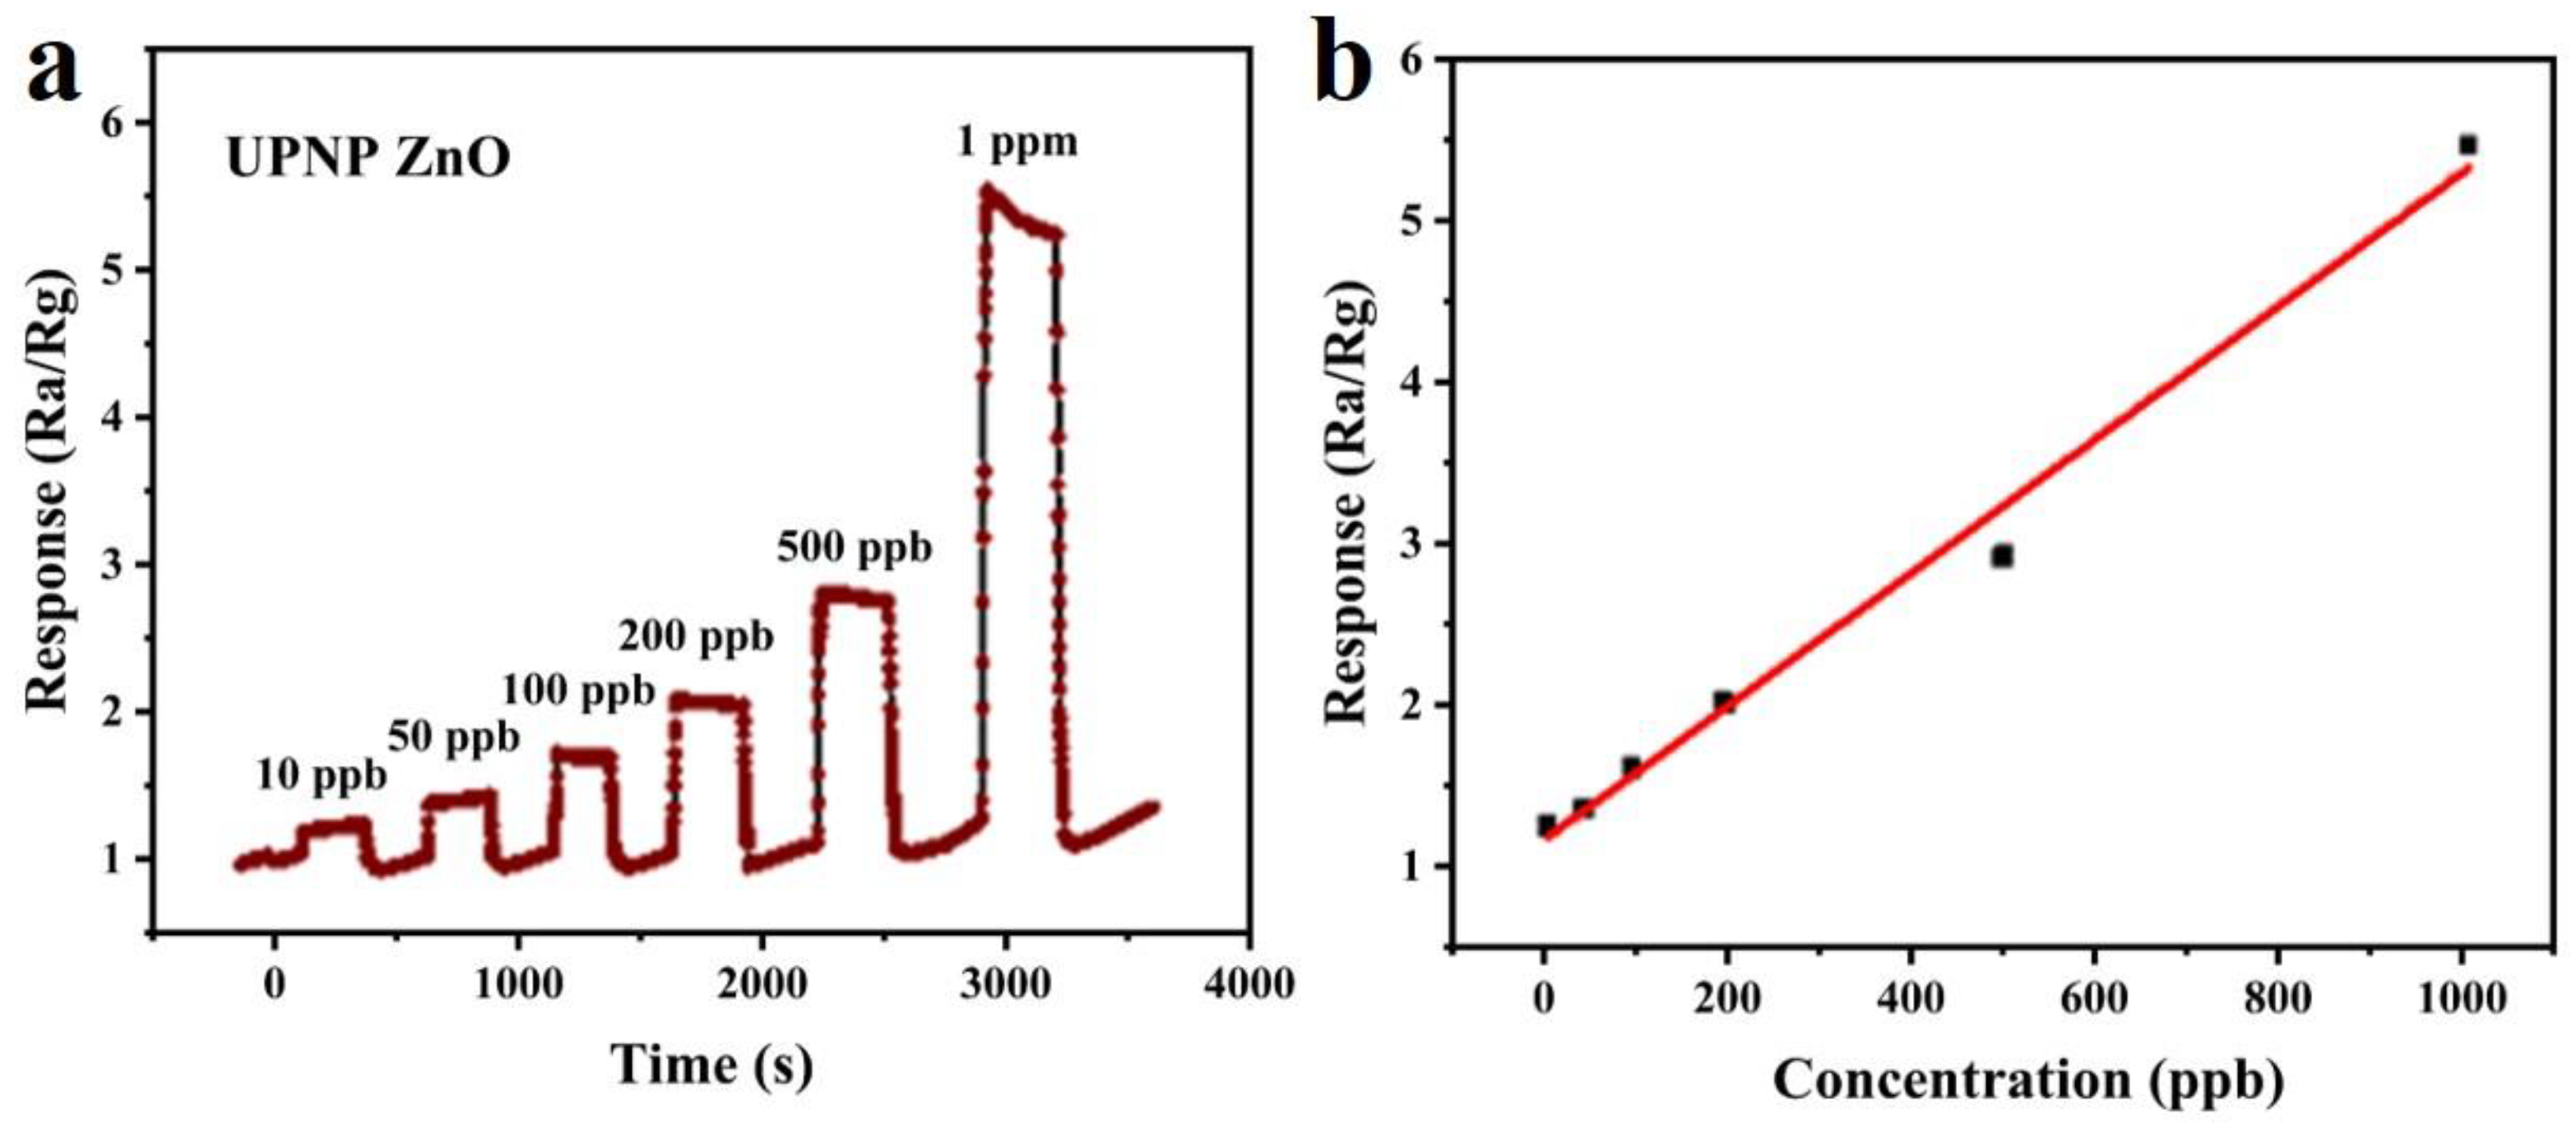
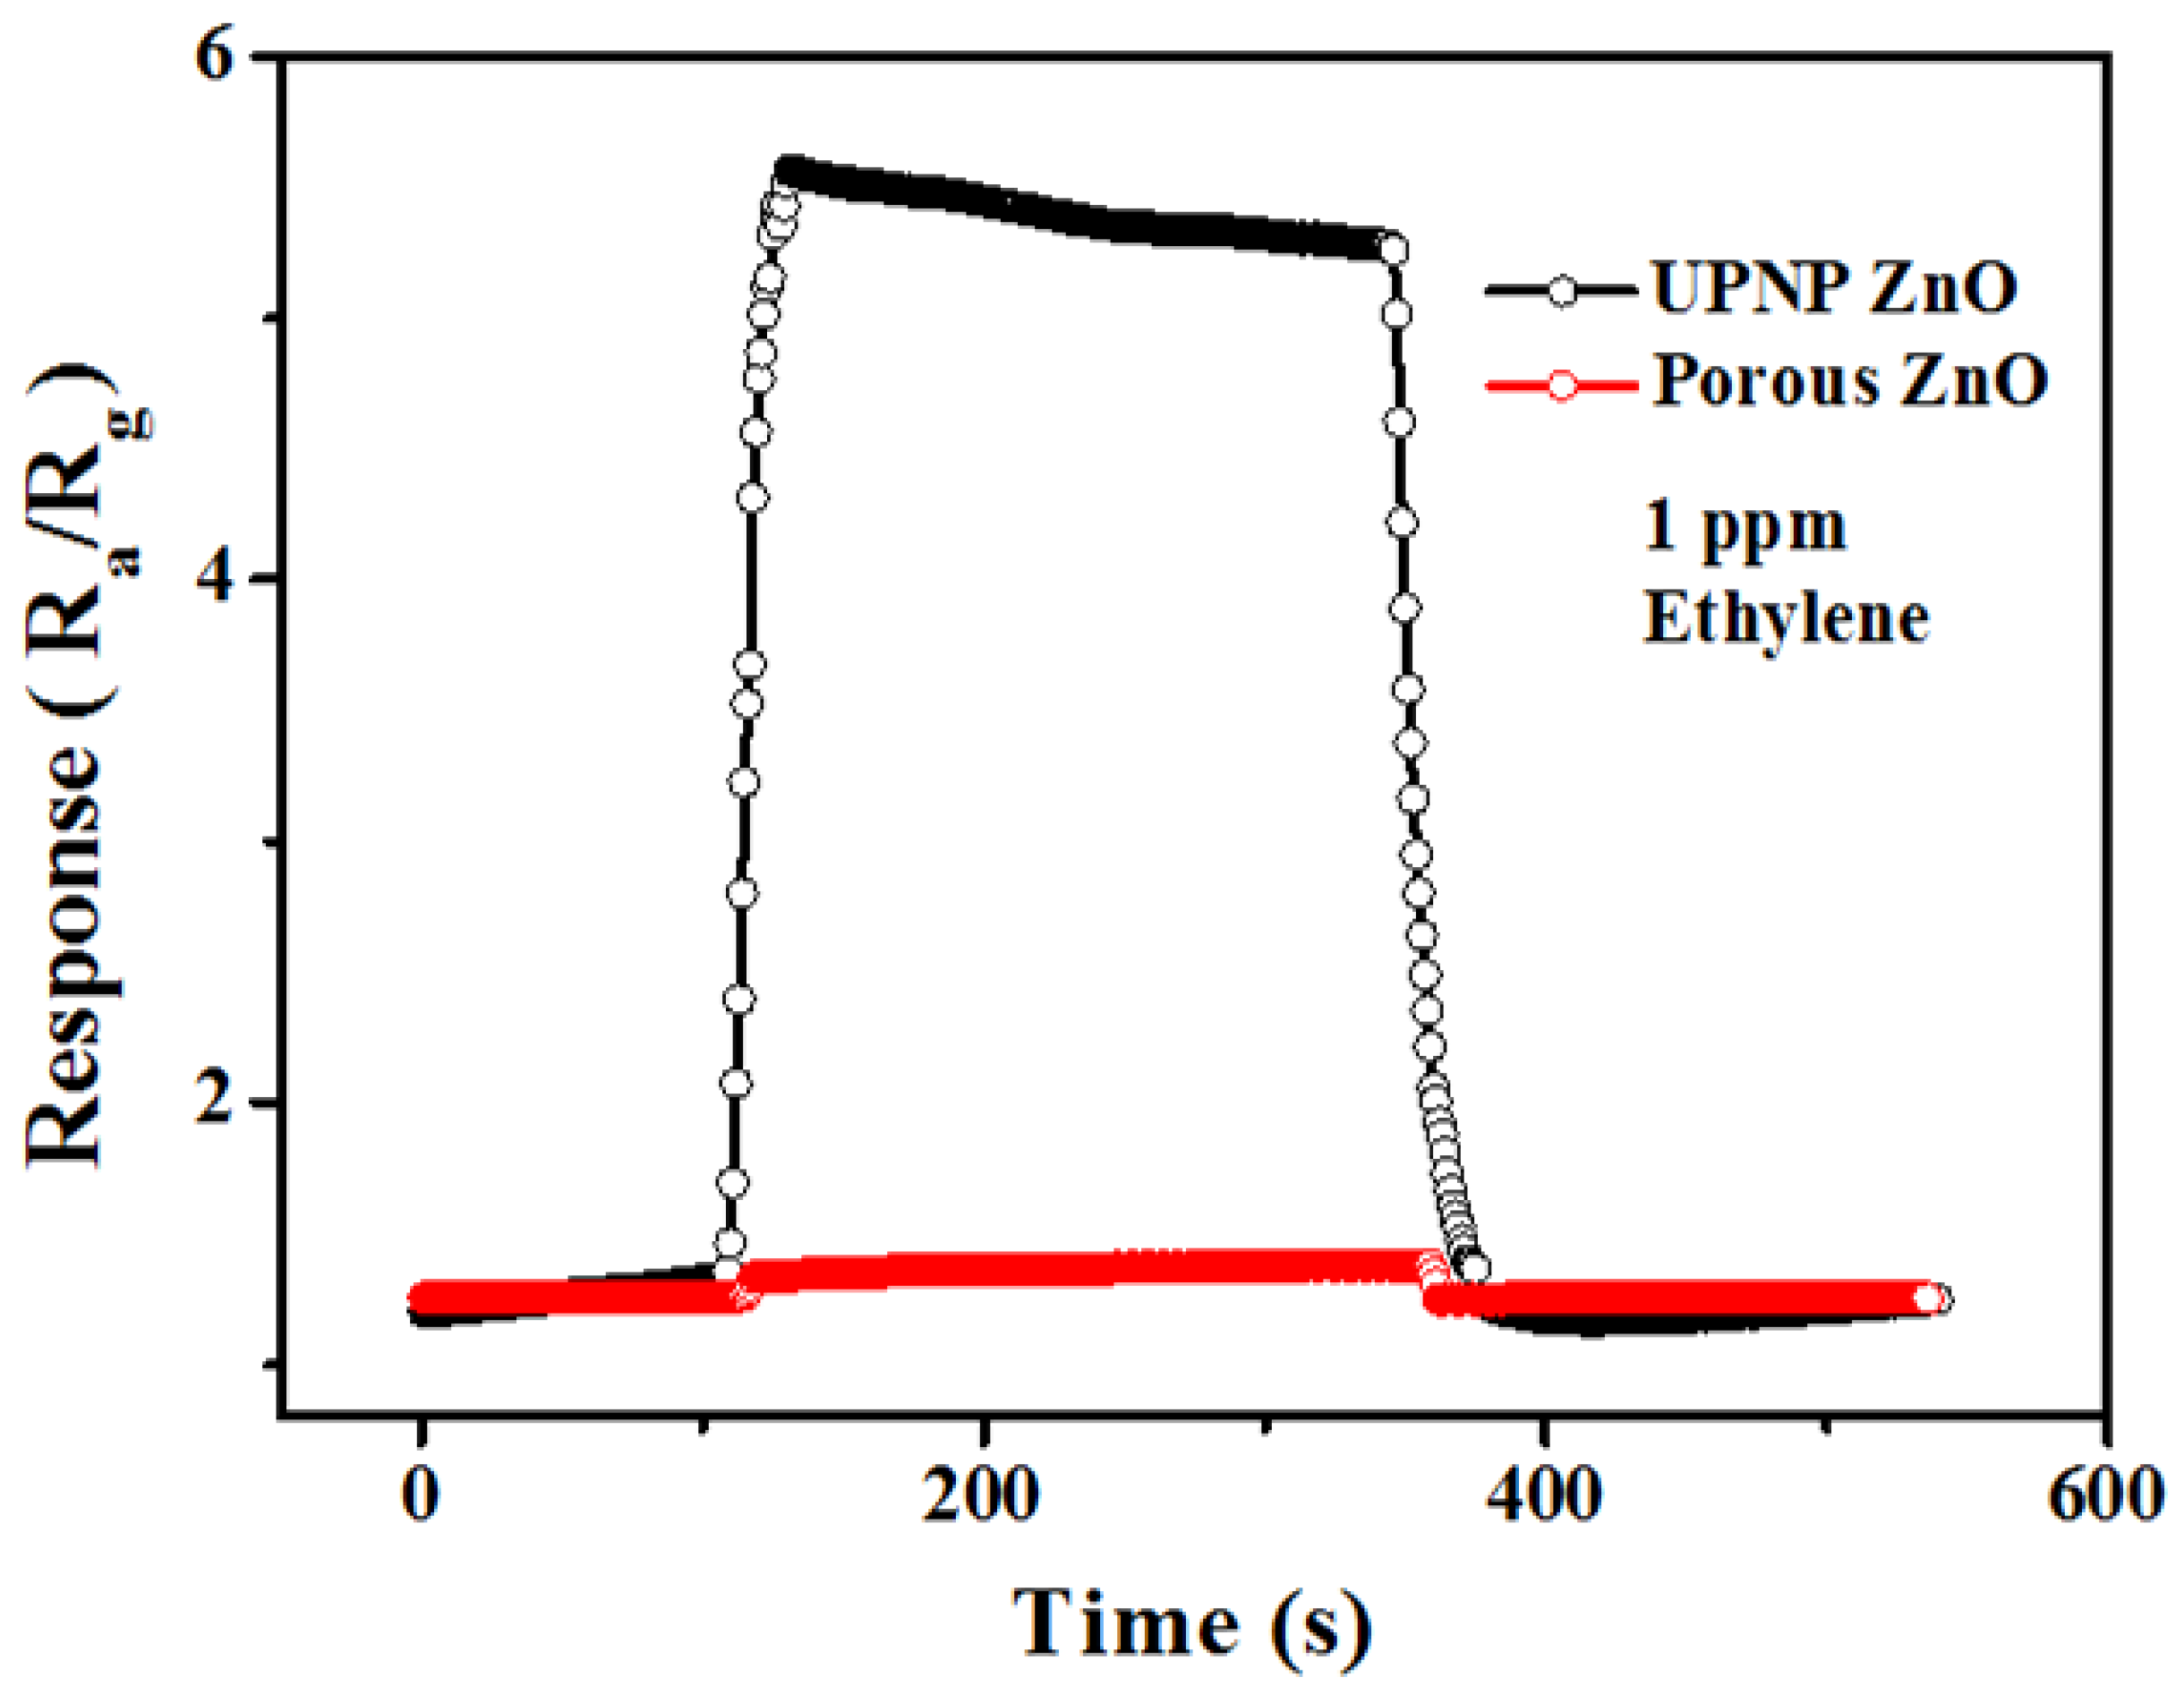
3.3. Gas-Sensing Properties of the UPNP ZnO Nanosheets for Ethylene

In order to verify the positive role of the Pd modification in the gas-sensing properties of the ZnO nanosheets, the gas-sensing performance was systematically studied, as shown in Figure 7. Firstly, Figure 7a shows the real-time response curves of the UPNP ZnO nanosheets for ethylene of different concentrations. An increase in response can be observed as ethylene concentration increases from 10 ppb to 1 ppm. Figure 7b shows the corresponding calibration curve of the response vs. concentration; it can be seen that the response maintains a good linear relationship in the detection range from 10 ppb to 1 ppm. For comparison, the real-time response curves of the porous ZnO nanosheets and UPNP ZnO nanosheets for 1 ppm ethylene are shown in Figure 8, from which it can be obviously seen that the response of the UPNP ZnO nanosheets is much higher than that of the porous ZnO nanosheets. These results successfully reveal the positive effect of Pd particles for ethylene detection. In addition, the response and recovery times of the UPNP ZnO nanosheets are about 10 s and 20 s, respectively, which is far more than the reported semiconductor ethylene sensor.

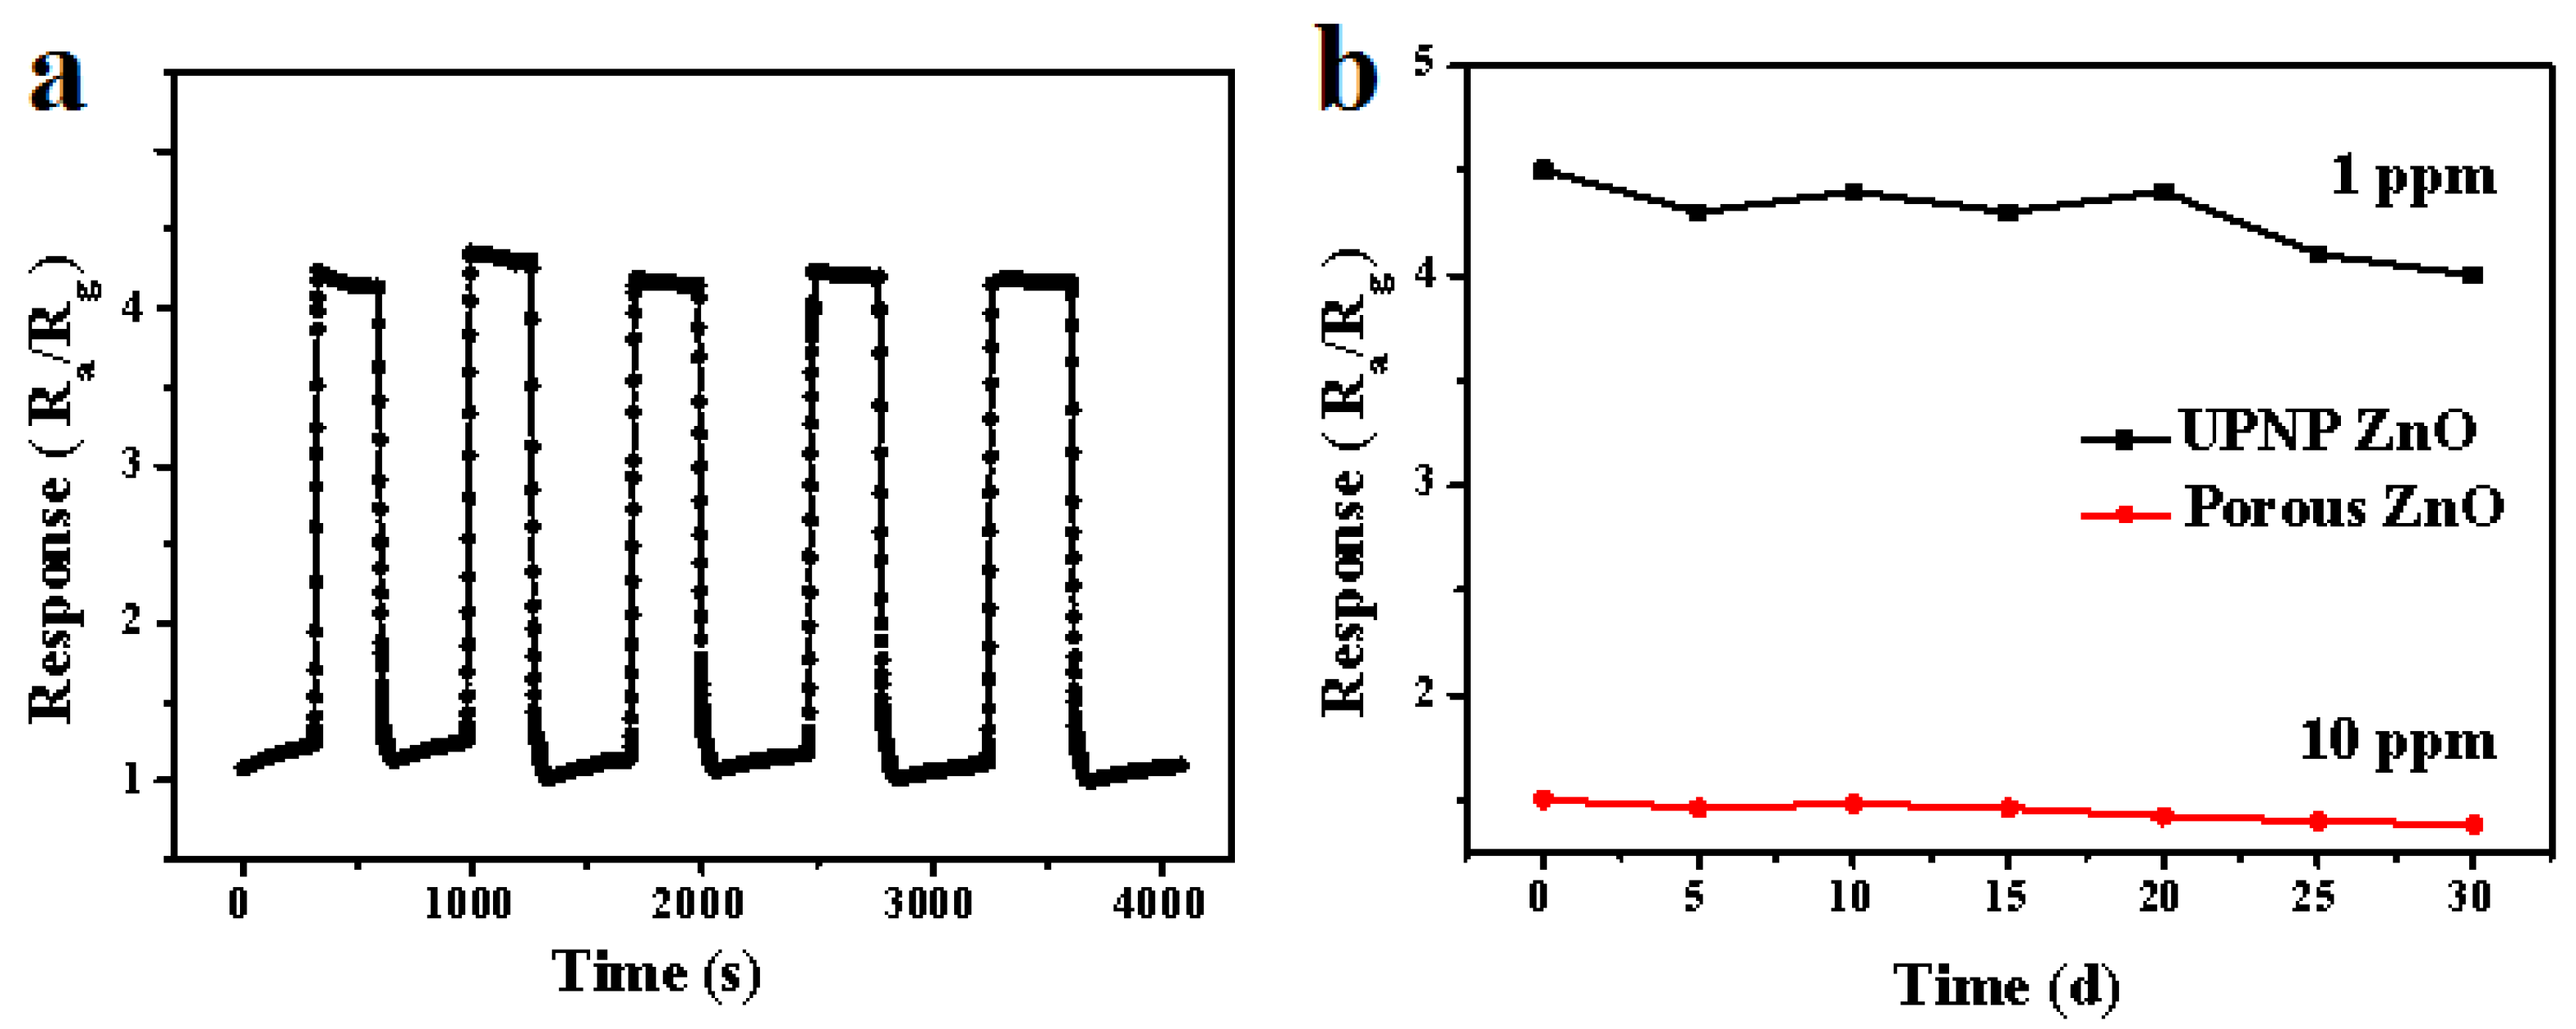
3.4. Stability of the Pd-Decorated ZnO Nanosheet-Based Sensors

For practical application, the stability of the gas sensing also plays an important role in gas-sensing detection. The stability properties of the UPNP ZnO nanosheets have been investigated using a 5-cycles test with 1 ppm ethylene (Figure 9a); the results demonstrate the repeatable sensing properties of the UPNP ZnO nanosheets. In addition, Figure 9b exhibits the long-term stability curves of the UPNP ZnO nanosheets; it can be seen that along with the time lapsing, the UPNP ZnO nanosheets exhibited stable sensing properties, which was because the Pd modification successfully decreased the optimal operating temperature, further extending the life of the sensors. Thus, the UPNP ZnO nanosheets are suitable materials for practical application in the future.

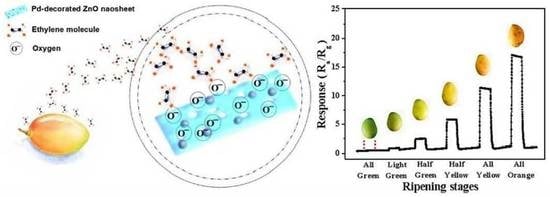
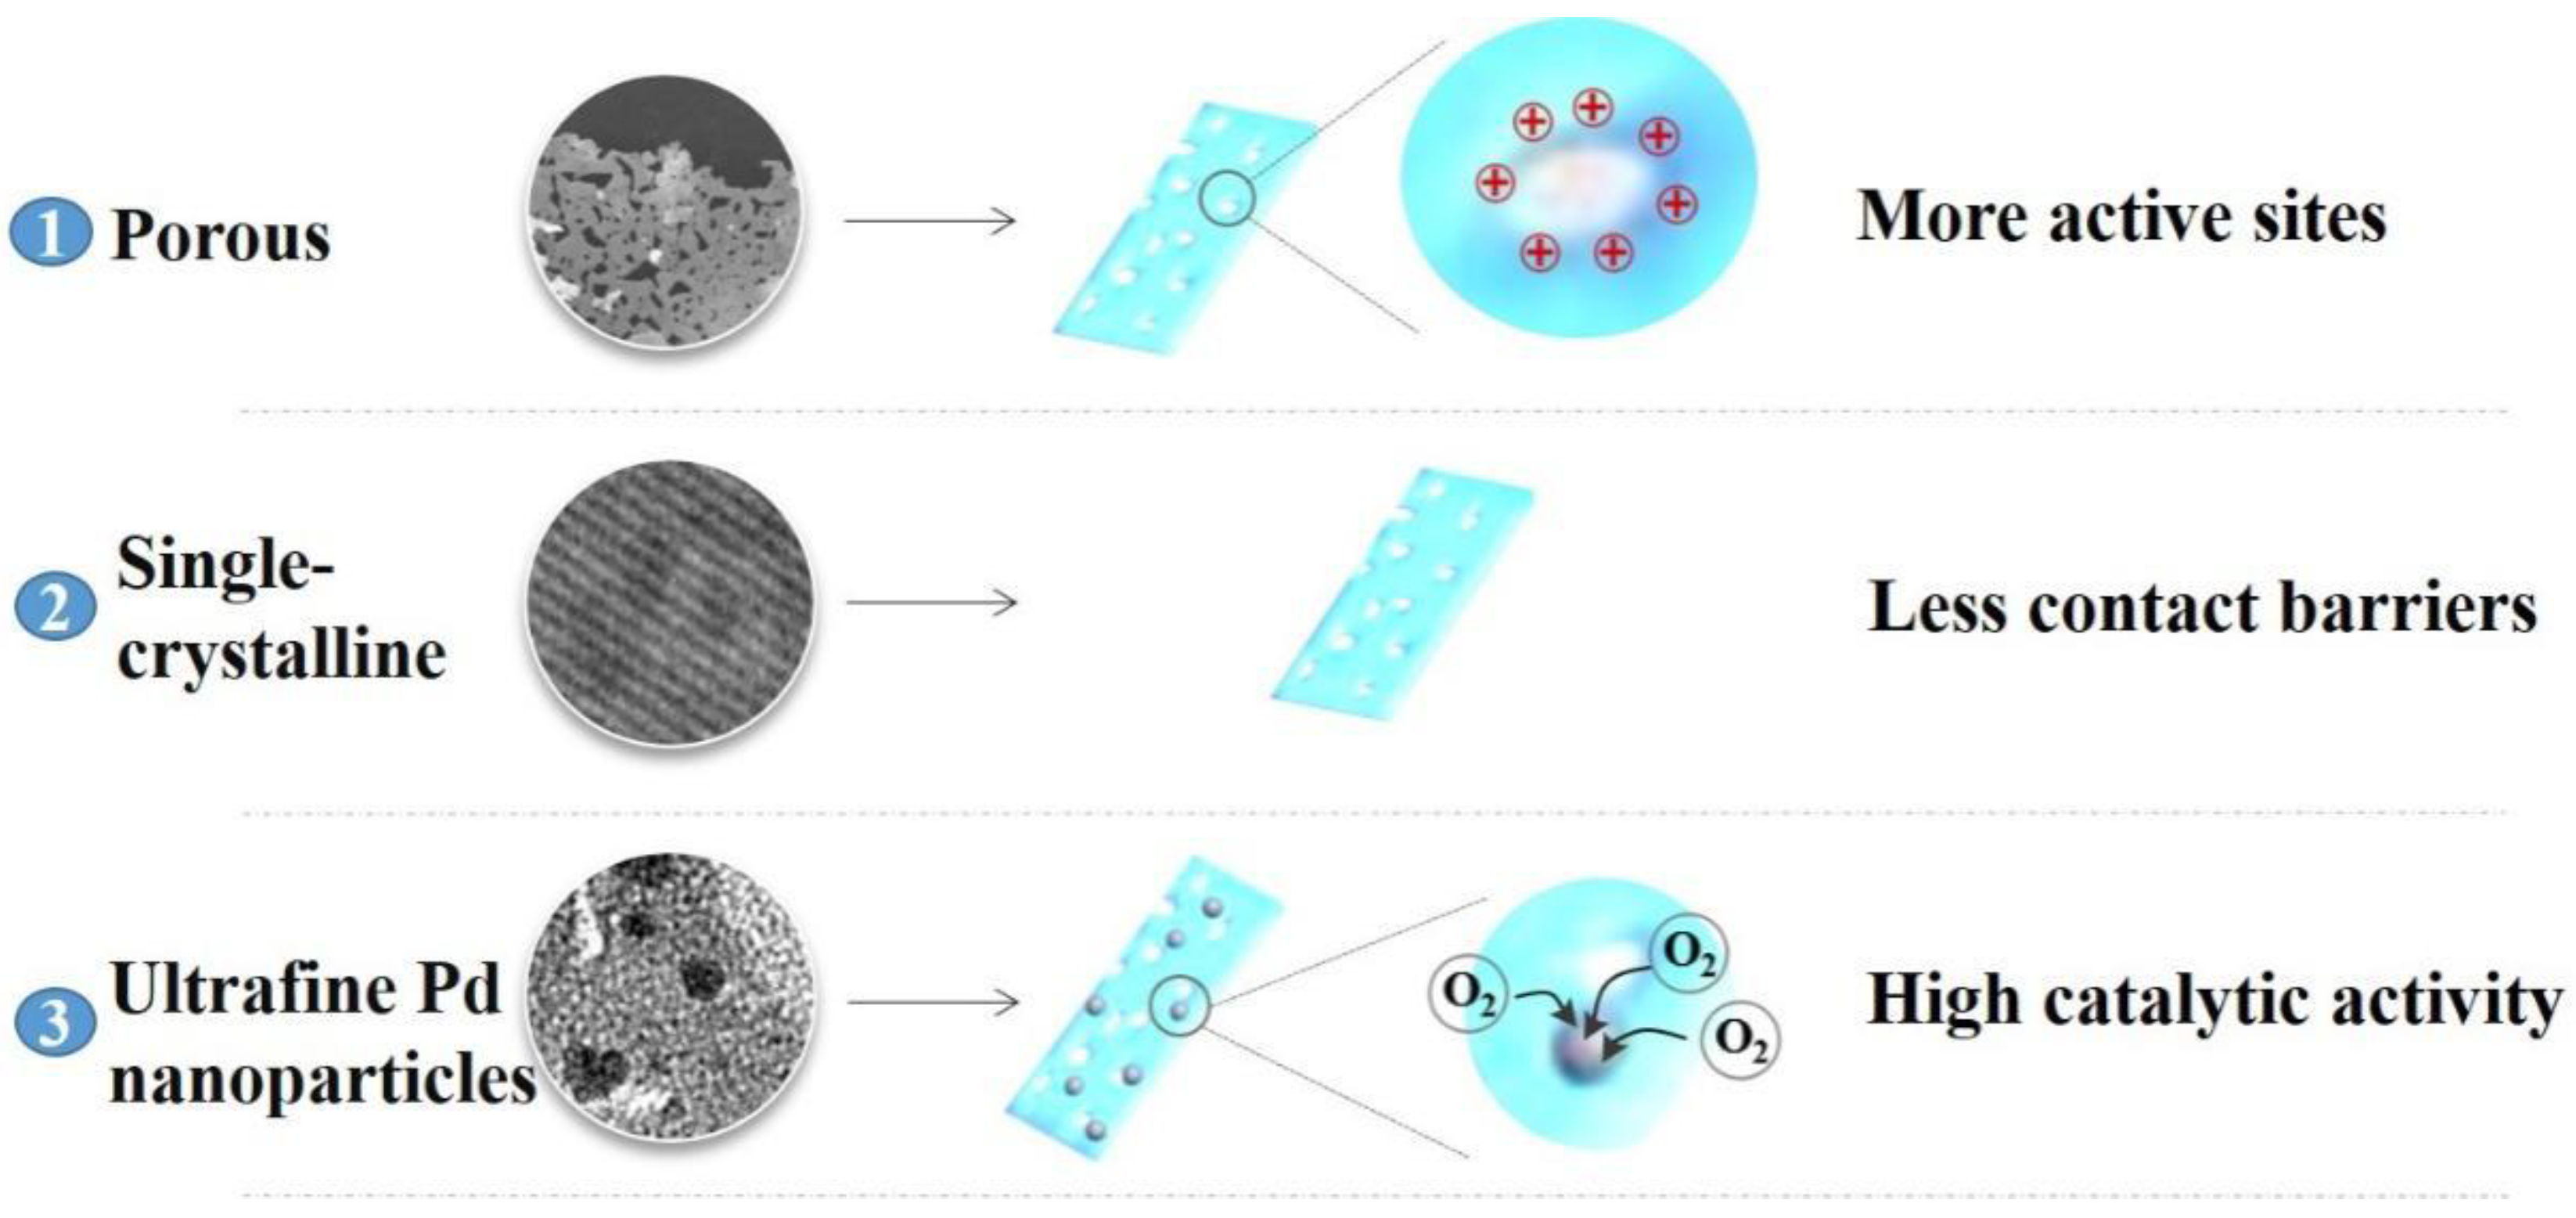
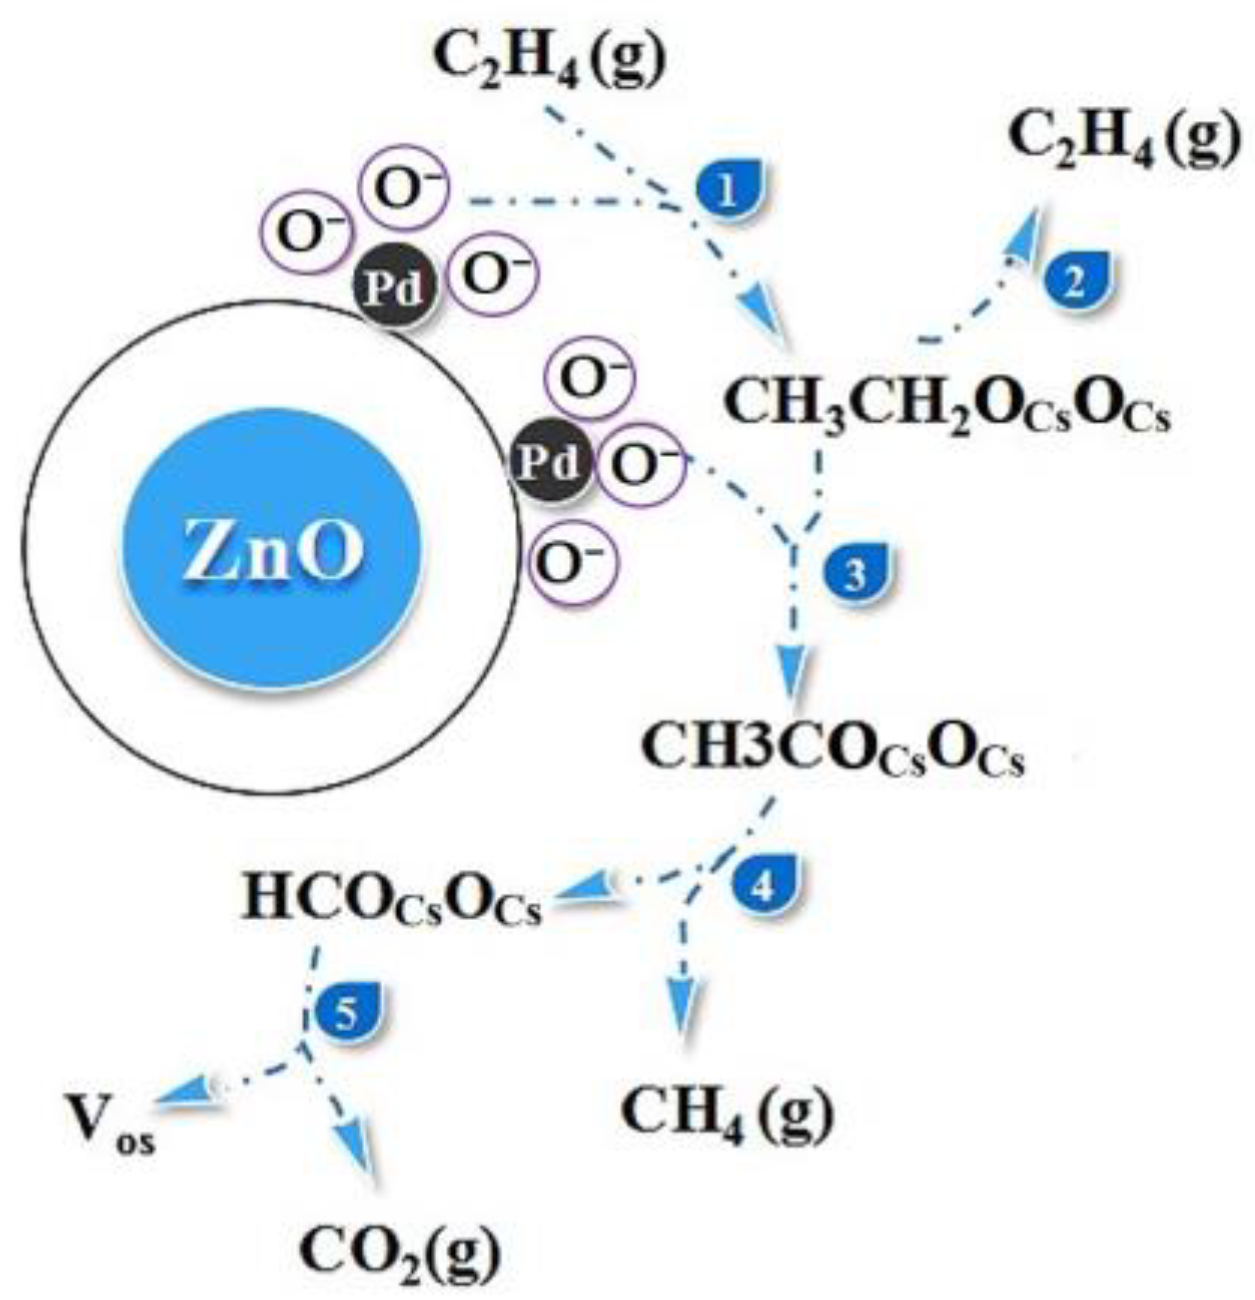
3.5. Sensing Mechanism of the UPNP ZnO Nanosheets

As shown in Figure 10, the high sensitivity of the UPNP ZnO nanosheets can be attributed to three factors. Firstly, the great number of mesopores within the ZnO nanosheets can provide more active sites. It is generally believed that the surface of the mesopores possesses higher surface energy, resulting in better absorption ability. Thus, more gas molecules can be absorbed on the surface of the porous ZnO nanosheets, leading to the increased sensitivity. Secondly, the single-crystalline structures can further improve the sensing properties of the UPNP ZnO nanosheets. Compared to the polycrystalline sensing materials, the single-crystalline materials possess less resistance. In single-crystalline structure materials, electrons do not have to jump across the particle boundary barriers during the transportation, which would definitely increase the sensitivity. Thirdly, the decoration of ultrafine Pd nanoparticles can further increase the sensing performance of the product. The smaller Pd nanoparticles always result in better catalytic performance, which makes strong improvements to the surface redox reaction activity, resulting in the increase in sensitivity. Meanwhile, the modified ultrafine Pd nanoparticles also can increase the amount of active sites, further resulting in a higher response to ethylene.
As shown in Figure 11, the process of the surface oxidation reaction has been vividly displayed, and the positive effect of ultrafine Pd nanoparticles has also been shown in detail. Actually, Pd nanoparticles provide more active sites and absorbed oxygen, effectively accelerating the surface reaction, further resulting in the increase in response. The surface chemical process of ethylene may be explained by the following series of chemical reactions [37,38].
C2H4 (g) + OCs ⇌ CH3CH2OCs + Hads
CH3CH2OCs + OCs → CH3COCsOCs + Hads
CH3COCsOCs + Hads → CH4 (g) + HCOCsOCs
HCOCsOCs → CO2 (g) + Hads + Vos
As shown in Equation (2), ethylene can react with chemisorbed oxygen to form ethyoxyl. Then, the formed ethyoxyl can further react with chemisorbed oxygen (Equation (3)), and the resultant is acetate, which is the most stable intermediate. The acetate sequentially reacts with the adsorbed hydrogen ions, producing formic acid as the resultant (Equation (4)). Finally, the formic acid decomposes to carbon dioxide (Equation (5)). The sensing mechanism in ethylene detection was further investigated using XPS, and the results are shown in Figure 12. From Figure 12a, it can be seen that a new peak of Pd appeared in the survey spectra after decoration, indicating the adsorption of ultrafine Pd nanoparticles on the ZnO nanosheets. Figure 12b,c present the O 1s peaks of the porous ZnO nanosheets and UPNP ZnO nanosheets, respectively. In porous ZnO nanosheets, the O 1s spectrum can be fitted into three different components, chemisorbed oxygen (OC), deficient oxygen (OV) and lattice oxygen (OL), with bind energy at 532.0, 531.2 and 530.1 eV, respectively [39]. Furthermore, the relative percentages of OC, OV and OL were 9.8%, 22.2% and 69%. However, after ultrafine Pd nanoparticle decoration, the relative percentages of OC, OV and OL changed to 34.3%, 43.2% and 22.5%. Obviously, with the decoration of ultrafine Pd nanoparticles, the relative percentages of OC and OV have been largely increased, which benefited the ethylene oxidation ability, actually accelerating the process of the reaction and further causing the large improvement in sensitivity. Figure 12d,e present the Pd 3d XPS spectra of the UPNP ZnO nanosheets before and after the sensing test. As shown, both of the Pd 3d spectra can be fitted into two different components: Pd(0) and Pd(II). Before the test, the relative percentages of Pd(0) and Pd(II) were 15.8% and 84.2%. However, after the test, the relative percentages of Pd(0) and Pd(II) changed to 20.4% and 79.6%. Obviously, part of Pd was converted to PdO during the test process.

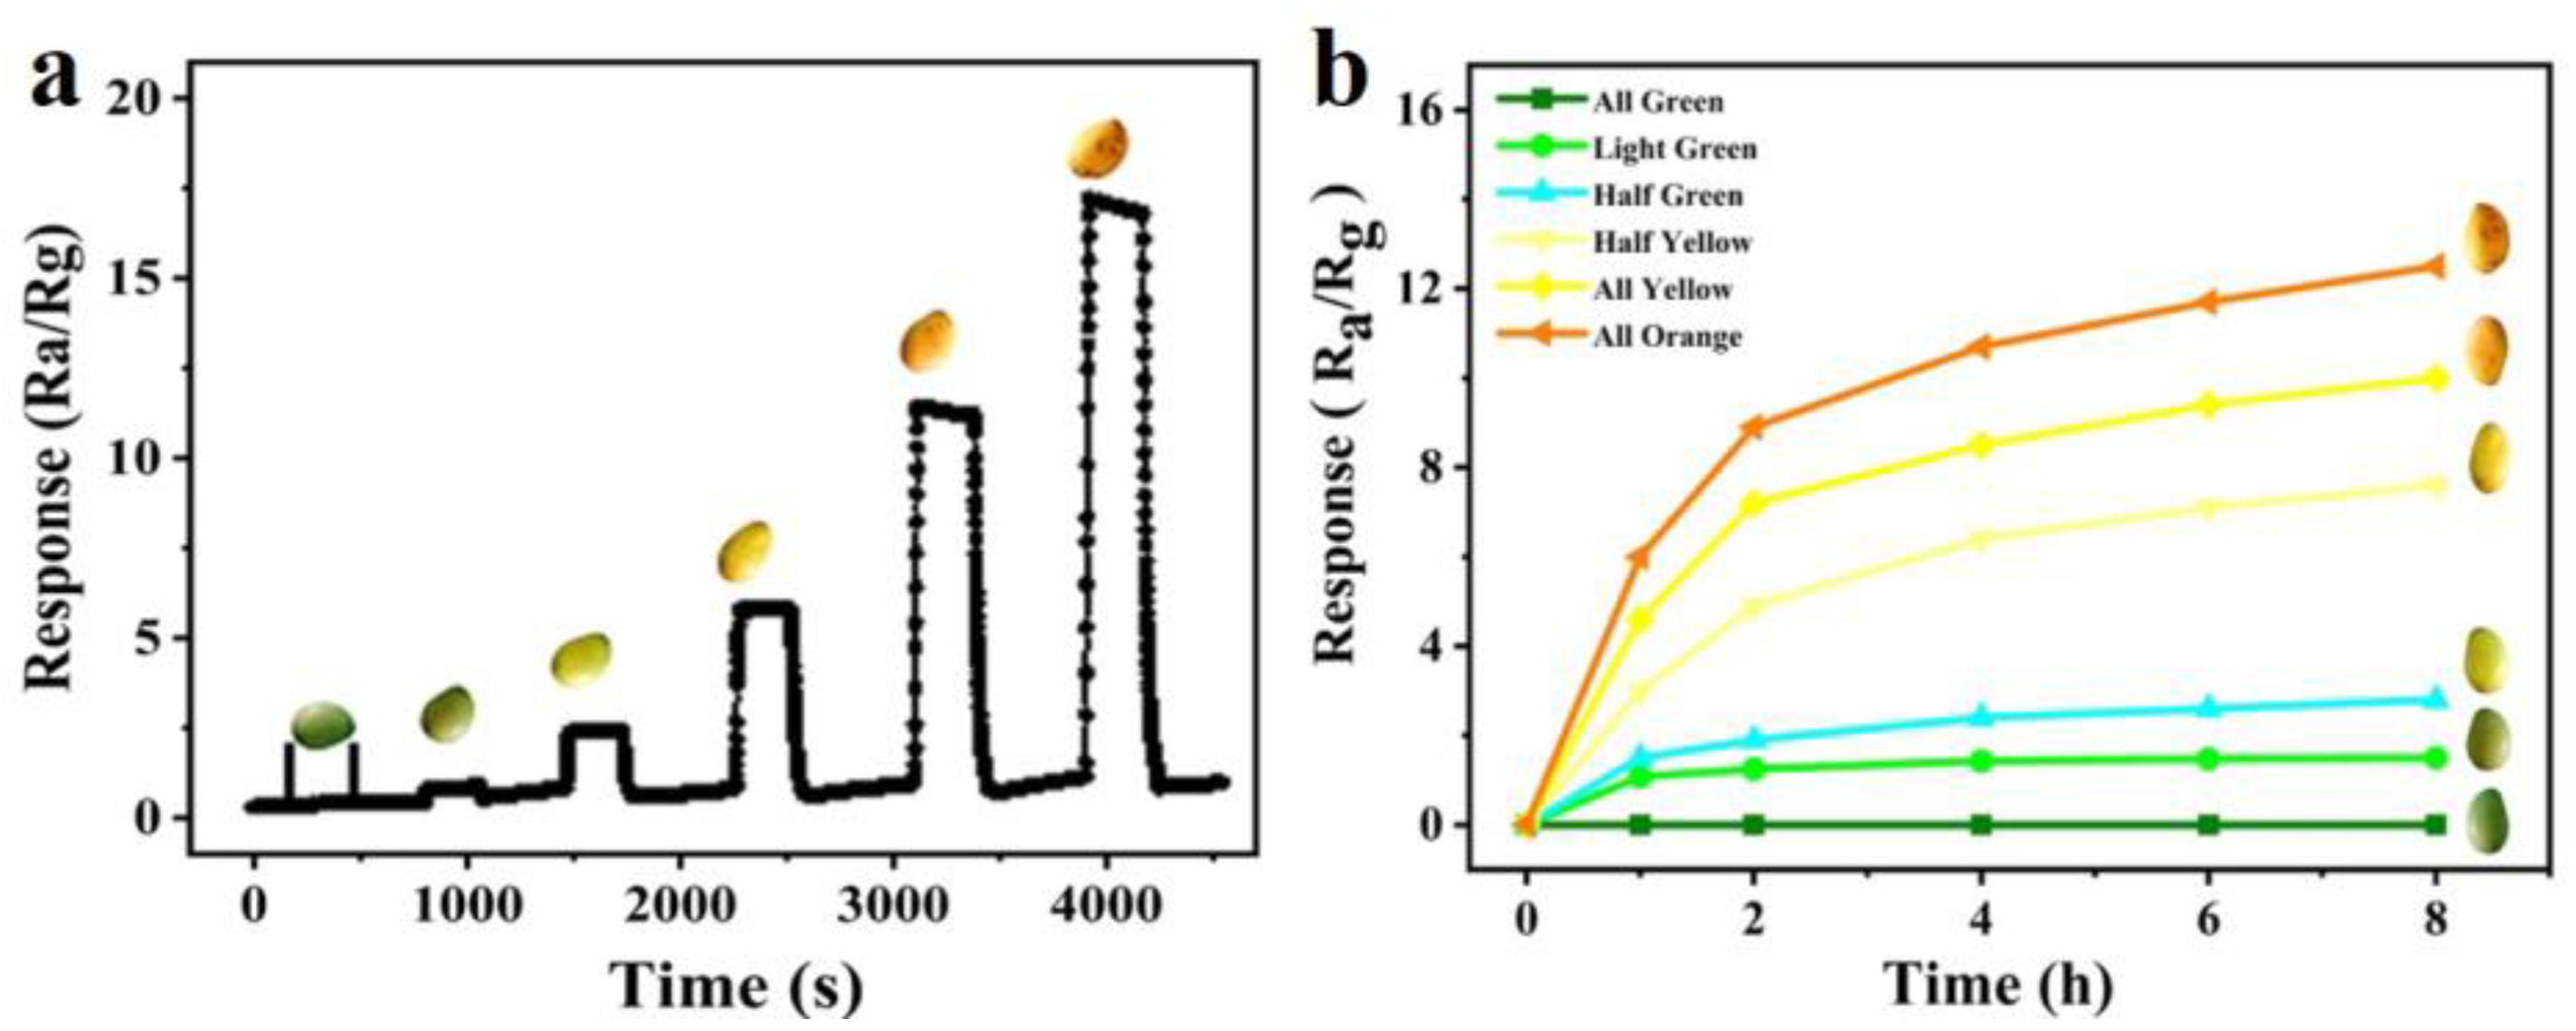
3.6. Ripeness Detection of Mangos

The ultimate goal of our study is monitoring the ripening process of fruits. As we know, fruits can efflux ethylene with different concentrations at different ripening stages. In order to effectively determine the ripeness of the fruits, a novel mango ripeness test was carried out using the UPNP ZnO nanosheets as the sensing material. In a typical experiment, mangos of similar size at different ripening stages (all green, light green, half green, half yellow, all yellow and all orange) were sealed in 6 containers of the same volume (3 L), respectively. Over the next 24 h, a certain amount of gas was extracted from each container using a microinjector and injected into the test chamber every 2 h. Through the gas-sensing test, the complete ethylene efflux process can be further studied, and ethylene concentrations in each vessel of mango efflux at different ripening stages can be compared to demonstrate that the UPNP ZnO nanosheets-based sensors possess the capacity to monitor ripening fruits by detecting ethylene concentration. The results have been displayed in Figure 13. Figure 13a shows the real-time response curve of the UPNP ZnO nanosheets for the gases released by different-maturation-stage mangos at the same sealing time, from which it can be seen that the responses increase with the maturity of the mangos. Therefore, the UPNP ZnO nanosheets exhibited excellent sensing properties for the gas effluence of mango, further supporting their potential application in monitoring fruit maturity stage. The point plot graph of gas-sensing response vs. time in six vessels has been investigated, as shown in Figure 13b, from which it can be obviously seen that the response increased with the storage time and then gradually became flat. Through such a gas test, the ethylene efflux process was successfully investigated. The ethylene concentration in each vessel increased in the first 6 h and then stabilized, becoming flat, indicating that 6 h is the appropriate storage time in this test. In conclusion, the results of mango experiments further indicated that the UPNP ZnO nanosheets have broad application prospects in the determination of fruit ripeness.

4. Conclusions

In summary, the ultrafine Pd nanoparticles-decorated porous ZnO nanosheets were successfully synthesized through a facile solvent reduction method. Due to the unique porous and single-crystalline structure of ZnO sheets and the ultrafine size of Pd nanoparticles, the UPNP ZnO nanosheets possessed a lower working temperature and higher ethylene sensing performance. The lowest detection concentration reached 10 ppb. It has been proved that the decoration of ultrafine Pd nanoparticles can greatly increase the relative percentage of chemisorbed oxygen and deficient oxygen, which are benefits for ethylene oxidation, and actually accelerate the process of the sensing reaction. Moreover, a novel fruits maturity detection experiment was also implemented by using mango as an example. Our results reveal that the UPNP ZnO nanosheets displayed different responses to the mangos at different maturity stages, suggesting that the UPNP ZnO nanosheets are competent to monitor the ripening stages of fruits. It is expected that the UPNP ZnO nanosheets could become a promising sensing material to monitor the ripening stages of the fruits in fruits supply chains.

Author Contributions

Z.J., Conceptualization, Data curation, Funding acquisition, Investigation, Resources, Writing—original draft; D.-C.W., Data curation, Formal analysis, Investigation, Writing—original draft; W.-J.X., Formal analysis, Methodology, Software, Visualization; Y.D., Project administration, Supervision, Validation; J.L., Data curation, Formal analysis, Investigation, Writing—original draft, Writing—review & editing. All authors have read and agreed to the published version of the manuscript.

Funding

This research was funded by the National Key Research and Development Program (No. 2019YFC0408504), Natural Science Foundation of Anhui Province (No. 2008085MB44), Natural Science Research Project of Anhui Educational Committee (No. 2022AH040046) and Science and Technology Service Network Initiative of the Chinese Academy of Sciences (No. KFJ-STSQYZD-173).

Data Availability Statement

The data presented in this study are openly available.

Conflicts of Interest

We declare that we have no financial and personal relationships with other people or organizations that can inappropriately influence our work, and there is no professional or other personal interest of any nature or kind in any product, service and/or company that could be construed as influencing the position presented in, or the review of, the manuscript entitled.

References

  1. Fukao, T.; Bailey-Serres, J. Ethylene—A key regulator of submergence responses in rice. Plant Sci. 2008, 175, 43–51. [Google Scholar] [CrossRef]
  2. Grossmann, K.; Kwiatkowski, J.; Caspar, G. Regulation of Phytohormone Levels, Leaf Senescence and Transpiration by the Strobilurin Kresoxim-methyl in Wheat (Triticum aestivum). J. Plant Physiol. 1999, 154, 805–808. [Google Scholar] [CrossRef]
  3. Achard, P.; Cheng, H.; Grauwe, L.D. Integration of plant responses to environmentally activated phytohormonal signals. Science 2006, 311, 124–135. [Google Scholar] [CrossRef]
  4. Ergun, M.; Huber, D.J. Suppression of ethylene perception extends shelf-life and quality of ‘sunrise solo’ papaya fruit at both pre-ripe and ripe stages of development. Eur. J. Hortic. Sci. 2004, 69, 184–192. [Google Scholar]
  5. Hanson, A.D.; Kende, H. Ethylene-enhanced Ion and Sucrose Efflux in Morning Glory Flower Tissue. Plant Physiol. 1975, 55, 663–669. [Google Scholar] [CrossRef]
  6. Paul, V.; Pandey, R.; Srivastava, G.C. The fading distinctions between classical patterns of ripening in climacteric and non-climacteric fruit and the ubiquity of ethylene—An overview. J. Food Sci. Technol. 2011, 49, 1–21. [Google Scholar] [CrossRef] [PubMed]
  7. Trainotti, L.; Tadiello, A.; Casadoro, G. The involvement of auxin in the ripening of climacteric fruits comes of age: The hormone plays a role of its own and has an intense interplay with ethylene in ripening peaches. J. Exp. Bot. 2007, 58, 3299–3308. [Google Scholar] [CrossRef] [PubMed]
  8. Nunes, M.; Nicometo, M.; Emond, J.P.; Melis, R.B.; Uysal, I. Improvement in fresh fruit and vegetable logistics quality: Berry logistics field studies, Philosophical transactions. Ser. A Math. Phys. Eng. Sci. 2014, 372, 201–220. [Google Scholar]
  9. Janssen, S.; Schmitt, K.; Blanke, M.; Bauersfeld, M.L.; Wöllenstein, J.; Lang, W. Ethylene detection in fruit supply chains. Philos. Trans. R. Soc. A Math. Phys. Eng. Sci. 2014, 372, 20130311. [Google Scholar] [CrossRef]
  10. Parfitt, J.; Barthel, M.; Macnaughton, S. Food waste within food supply chains: Quantification and potential for change to 2050. Philos. Trans. R. Soc. B Biol. Sci. 2010, 365, 3065–3081. [Google Scholar] [CrossRef]
  11. Woltering, E.J.; Harren, F.; Boerrigter, H.A.M. Use of a Laser-Driven Photoacoustic Detection System for Measurement of Ethylene Production in Cymbidium Flowers. Plant Physiol. 1988, 88, 506–510. [Google Scholar] [CrossRef] [PubMed]
  12. Giberti, A.; Carotta, M.C.; Guidi, V.; Malagù, C.; Martinelli, G.; Piga, M.; Vendemiati, B. Monitoring of ethylene for agro-alimentary applications and compensation of humidity effects. Sens. Actuators B Chem. 2004, 103, 272–276. [Google Scholar] [CrossRef]
  13. Pham-Tuan, H.; Vercammen, J.; Devos, C.; Sandra, P. Automated capillary gas chromatographic system to monitor ethylene emitted from biological materials. J. Chromatogr. A 2000, 868, 249–259. [Google Scholar] [CrossRef] [PubMed]
  14. Adam, S.; Steffen, J.; Walter, L. Application of a miniaturised packed gas chromatography column and a SnO2 gas detector for analysis of low molecular weight hydrocarbons with focus on ethylene detection. Sens. Actuators B Chem. 2013, 180, 43–49. [Google Scholar]
  15. Mangilal, A.; Mercyma, B.; Sudhir, S.; Kody, V. SnO2 nanoparticle-based passive capacitive sensor for ethylene detection. J. Nanomater. 2012, 2012, 5. [Google Scholar]
  16. Nimittrakoolchai, O.-U.; Supothina, S. High-yield precipitation synthesis of tungsten oxide platelet particle and its ethylene gas-sensing characteristic. Mater. Chem. Phys. 2008, 112, 270–274. [Google Scholar] [CrossRef]
  17. Peng, S.; Chen, W.; Jin, L.; Xu, L.; Teng, L.; Zhou, Q. Pt-doped SnO2 nanoflower gas sensor detection characteristic for hydrocarbon gases dissolved in transformer oil. In Proceedings of the 2016 IEEE International Conference on High Voltage Engineering and Application (ICHVE), Chengdu, China, 9–22 September 2016; 978. [Google Scholar] [CrossRef]
  18. Jadsadapattarakul, C.; Thanachayanont, D.; Nukeaw, C.; Sooknoi, J. Improved selectivity, response time and recovery time by [010] highly preferred-orientation silicalite-1 layer coated on SnO2 thin film sensor for selective ethylene gas detection. Sens. Actuators B Chem. 2010, 144, 73–80. [Google Scholar] [CrossRef]
  19. Ngam, P.; Jiemsirilers, Y.; Supothina, S. Preparation of tungsten oxide–tin oxide nanocomposites and their ethylene sensing characteristics. Sens. Actuators A Phys. 2007, 139, 7–11. [Google Scholar] [CrossRef]
  20. Kanungo, D.; Saha, J.; Basu, H. Pd sensitized porous silicon hydrogen sensor -Influence of ZnO thin film. Sens. Actuators B Chem. 2010, 147, 128–136. [Google Scholar] [CrossRef]
  21. Winquist, F.; Spetz, A.; Armgarth, M.; Nylander, C.; Lundström, I. Modified palladium metal-oxide-semiconductor structures with increased ammonia gas sensitivity. Appl. Phys. Lett. 1983, 43, 839–841. [Google Scholar] [CrossRef]
  22. Zhang, Y.; Xiang, Y.; Xu, Q.; Xu, J.Q.; Pan, P. Self-assemblies of Pd nanoparticles on the surfaces of single crystal ZnO nanowires for chemical sensors with enhanced performances. J. Mater. Chem. 2009, 19, 4701. [Google Scholar] [CrossRef]
  23. Kolmakov, A.; Klenov, D.O.; Lilach, Y.; Stemmer, S.; Moskovits, M. Enhanced Gas Sensing by Individual SnO2 Nanowires and Nanobelts Functionalized with Pd Catalyst Particles. Nano Lett. 2005, 5, 667–673. [Google Scholar] [CrossRef] [PubMed]
  24. Yang, H.; Kamienchick, D.J.; Youn, I.; Rothschild, D.Y.; Kim, A. Ultrasensitive and highly selective gas sensors based on elec-trospun SnO2 nanofibers modified by Pd loading. Adv. Funct. Mater. 2010, 20, 4258–4264. [Google Scholar] [CrossRef]
  25. Wilson, O.M.; Knecht, M.R.; Garcia-Martinez, J.C.; Crooks, R.M. Effect of Pd Nanoparticle Size on the Catalytic Hydrogenation of Allyl Alcohol. J. Am. Chem. Soc. 2006, 128, 4510–4511. [Google Scholar] [CrossRef]
  26. Lee, W.Z. Particle Size Effects in Pd-Catalyzed Electrooxidation of Formic Acid. J. Phys. Chem. C 2008, 112, 3789–3793. [Google Scholar]
  27. Cheng, X.L.; Zhao, X.L.; Huo, H.; Gao, L.H.; Zhao, S. ZnO nanoparticulate thin film: Preparation, characterization and gas-sensing property. Sens. Actuators B Chem. 2004, 102, 248–252. [Google Scholar] [CrossRef]
  28. Look, D.C. Electrical and optical properties of p-type ZnO. Semicond. Sci. Technol. 2005, 20, S55–S61. [Google Scholar] [CrossRef]
  29. Wang, Z.L. Zinc oxide nanostructures: Growth, properties and applications. J. Phys. Condens. Matter 2004, 16, R829–R858. [Google Scholar] [CrossRef]
  30. Shooshtari, M.; Pahlavan, S.; Rahbarpour, S.; Ghafoorifard, H. Investigating Organic Vapor Sensing Properties of Composite Carbon Nanotube-Zinc Oxide Nanowire. Chemosensors 2022, 10, 205. [Google Scholar] [CrossRef]
  31. Liu, X.H.; Zhang, J.; Wang, J.; Yang, L.W. 3D hierarchically porous ZnO structures and their functionalization by aunanoparticles for gas sensors. J. Mater. Chem. 2011, 21, 349–356. [Google Scholar] [CrossRef]
  32. Meng, F.; Hou, N.; Ge, S.; Sun, B.; Jin, Z.; Shen, W.; Kong, L.; Guo, Z.; Sun, Y.; Wu, H.; et al. Flower-like hierarchical structures consisting of porous single-crystalline ZnO nanosheets and their gas sensing properties to volatile organic compounds (VOCs). J. Alloy. Compd. 2014, 626, 124–130. [Google Scholar] [CrossRef]
  33. Sberveglieri, G.; Baratto, C.; Comini, E.; Faglia, G.; Ferroni, M.; Ponzoni, A.; Vomiero, A. Synthesis and characterization of semiconducting nanowires for gas sensing. Sens. Actuators B Chem. 2007, 121, 208–213. [Google Scholar] [CrossRef]
  34. Zhu, C.; Lu, B.; Su, Q.; Xie, E.; Lan, W. A simple method for the preparation of hollow ZnO nanospheres for use as a high per-formance photocatalyst. Nanoscale 2012, 4, 3060–3064. [Google Scholar] [CrossRef] [PubMed]
  35. Wang, L.; Kang, Y.; Liu, X.; Zhang, S.; Huang, W.; Wang, S. ZnO nanorod gas sensor for ethanol detection. Sens. Actuators B Chem. 2012, 162, 237–243. [Google Scholar] [CrossRef]
  36. Bie, L.-J.; Yan, X.-N.; Yin, J.; Duan, Y.-Q.; Yuan, Z.-H. Nanopillar ZnO gas sensor for hydrogen and ethanol. Sens. Actuators B Chem. 2007, 126, 604–608. [Google Scholar] [CrossRef]
  37. Kocemba, I.; Rynkowski, J. The effect of oxygen adsorption on catalytic activity of SnO2 in CO oxidation. Catal. Today 2011, 169, 192–199. [Google Scholar] [CrossRef]
  38. Kohl, D. Surface processes in the detection of reducing gases with SnO2-based devices. Sens. Actuators 1989, 18, 71–113. [Google Scholar] [CrossRef]
  39. Alenezi, M.; Jayawardena, A.S.; Beliatis, K.; Henley, M.J.; Silva, S.J. Role of The Exposed Polar Facets in The Performance of Thermally and UV Activated ZnO nanostructured Gas Sensors. Sens. J. Phys. Chem. C 2013, 23, 17850–17858. [Google Scholar] [CrossRef]
Figure 1. The schematic diagram of the testing setup. In mango test, gases were firstly extracted from the container with a microinjector (①) and then injected into the test chamber (②).
Processes 11 01686 g001
Figure 2. XRD patterns of the porous ZnO nanosheets and UPNP ZnO nanosheets.
Processes 11 01686 g002
Figure 3. SEM images (ac) and EDS (d) spectrum of the UPNP ZnO nanosheets.
Processes 11 01686 g003
Figure 4. (a) TEM images, the inset presents corresponding SAED pattern, (b) lattice-resolved HRTEM image of porous ZnO nanosheets, (c,d) TEM image and lattice-resolved HRTEM image of UPNP ZnO nanosheets.
Processes 11 01686 g004
Figure 5. (a) N2 adsorption–desorption isotherm of the UPNP ZnO nanosheets and (b) the corresponding pore size distribution.
Processes 11 01686 g005
Figure 6. Responses of the porous ZnO nanosheets and UPNP ZnO nanosheets to 10 ppm and 1 ppm ethylene at different operating temperatures.
Processes 11 01686 g006
Figure 7. (a) Real-time responses of the UPNP ZnO nanosheets to different concentrations of ethylene at 300 °C. (b) The corresponding calibration curves of the response vs. concentration of UPNP ZnO nanosheets.
Processes 11 01686 g007
Figure 8. Real-time responses of the porous ZnO nanosheets and UPNP ZnO nanosheets to 1 ppm ethylene.
Processes 11 01686 g008
Figure 9. (a) Response of the UPNP ZnO nanosheets to 1 ppm of ethylene after 5 cycles of gas on and off at 300 °C. (b) Long-time stability of the UPNP ZnO nanosheets for 1 ppm of ethylene at 300 °C and the porous ZnO nanosheets for 10 ppm ethylene at 500 °C.
Processes 11 01686 g009
Figure 10. Schematic illustration of the sensing mechanism of the UPNP ZnO nanosheets.
Processes 11 01686 g010
Figure 11. Schematic illustration of the reaction process on the surface of the UPNP ZnO nanosheets.
Processes 11 01686 g011
Figure 12. (a) Full range spectra of the porous ZnO nanosheets and UPNP ZnO nanosheets. (b,c) The O 1s peak of the porous ZnO nanosheets and UPNP ZnO nanosheets. (d,e) The Pd 3d peak of the UPNP ZnO nanosheets before and after sensing test.
Processes 11 01686 g012
Figure 13. (a) The plot of the response vs. time at different ripening stages. (b) Real-time response of the UPNP ZnO nanosheets to the mangos at different ripening stages.
Processes 11 01686 g013
Disclaimer/Publisher’s Note: The statements, opinions and data contained in all publications are solely those of the individual author(s) and contributor(s) and not of MDPI and/or the editor(s). MDPI and/or the editor(s) disclaim responsibility for any injury to people or property resulting from any ideas, methods, instructions or products referred to in the content.

