
Extraction and Characterization of Silica from Empty Palm Fruit Bunch (EPFB) Ash

Abstract
:1. Introduction
2. Materials and Method
2.1. Materials
2.2. Methods
2.2.1. Calcination of EPFB Ash
2.2.2. Silica Extraction
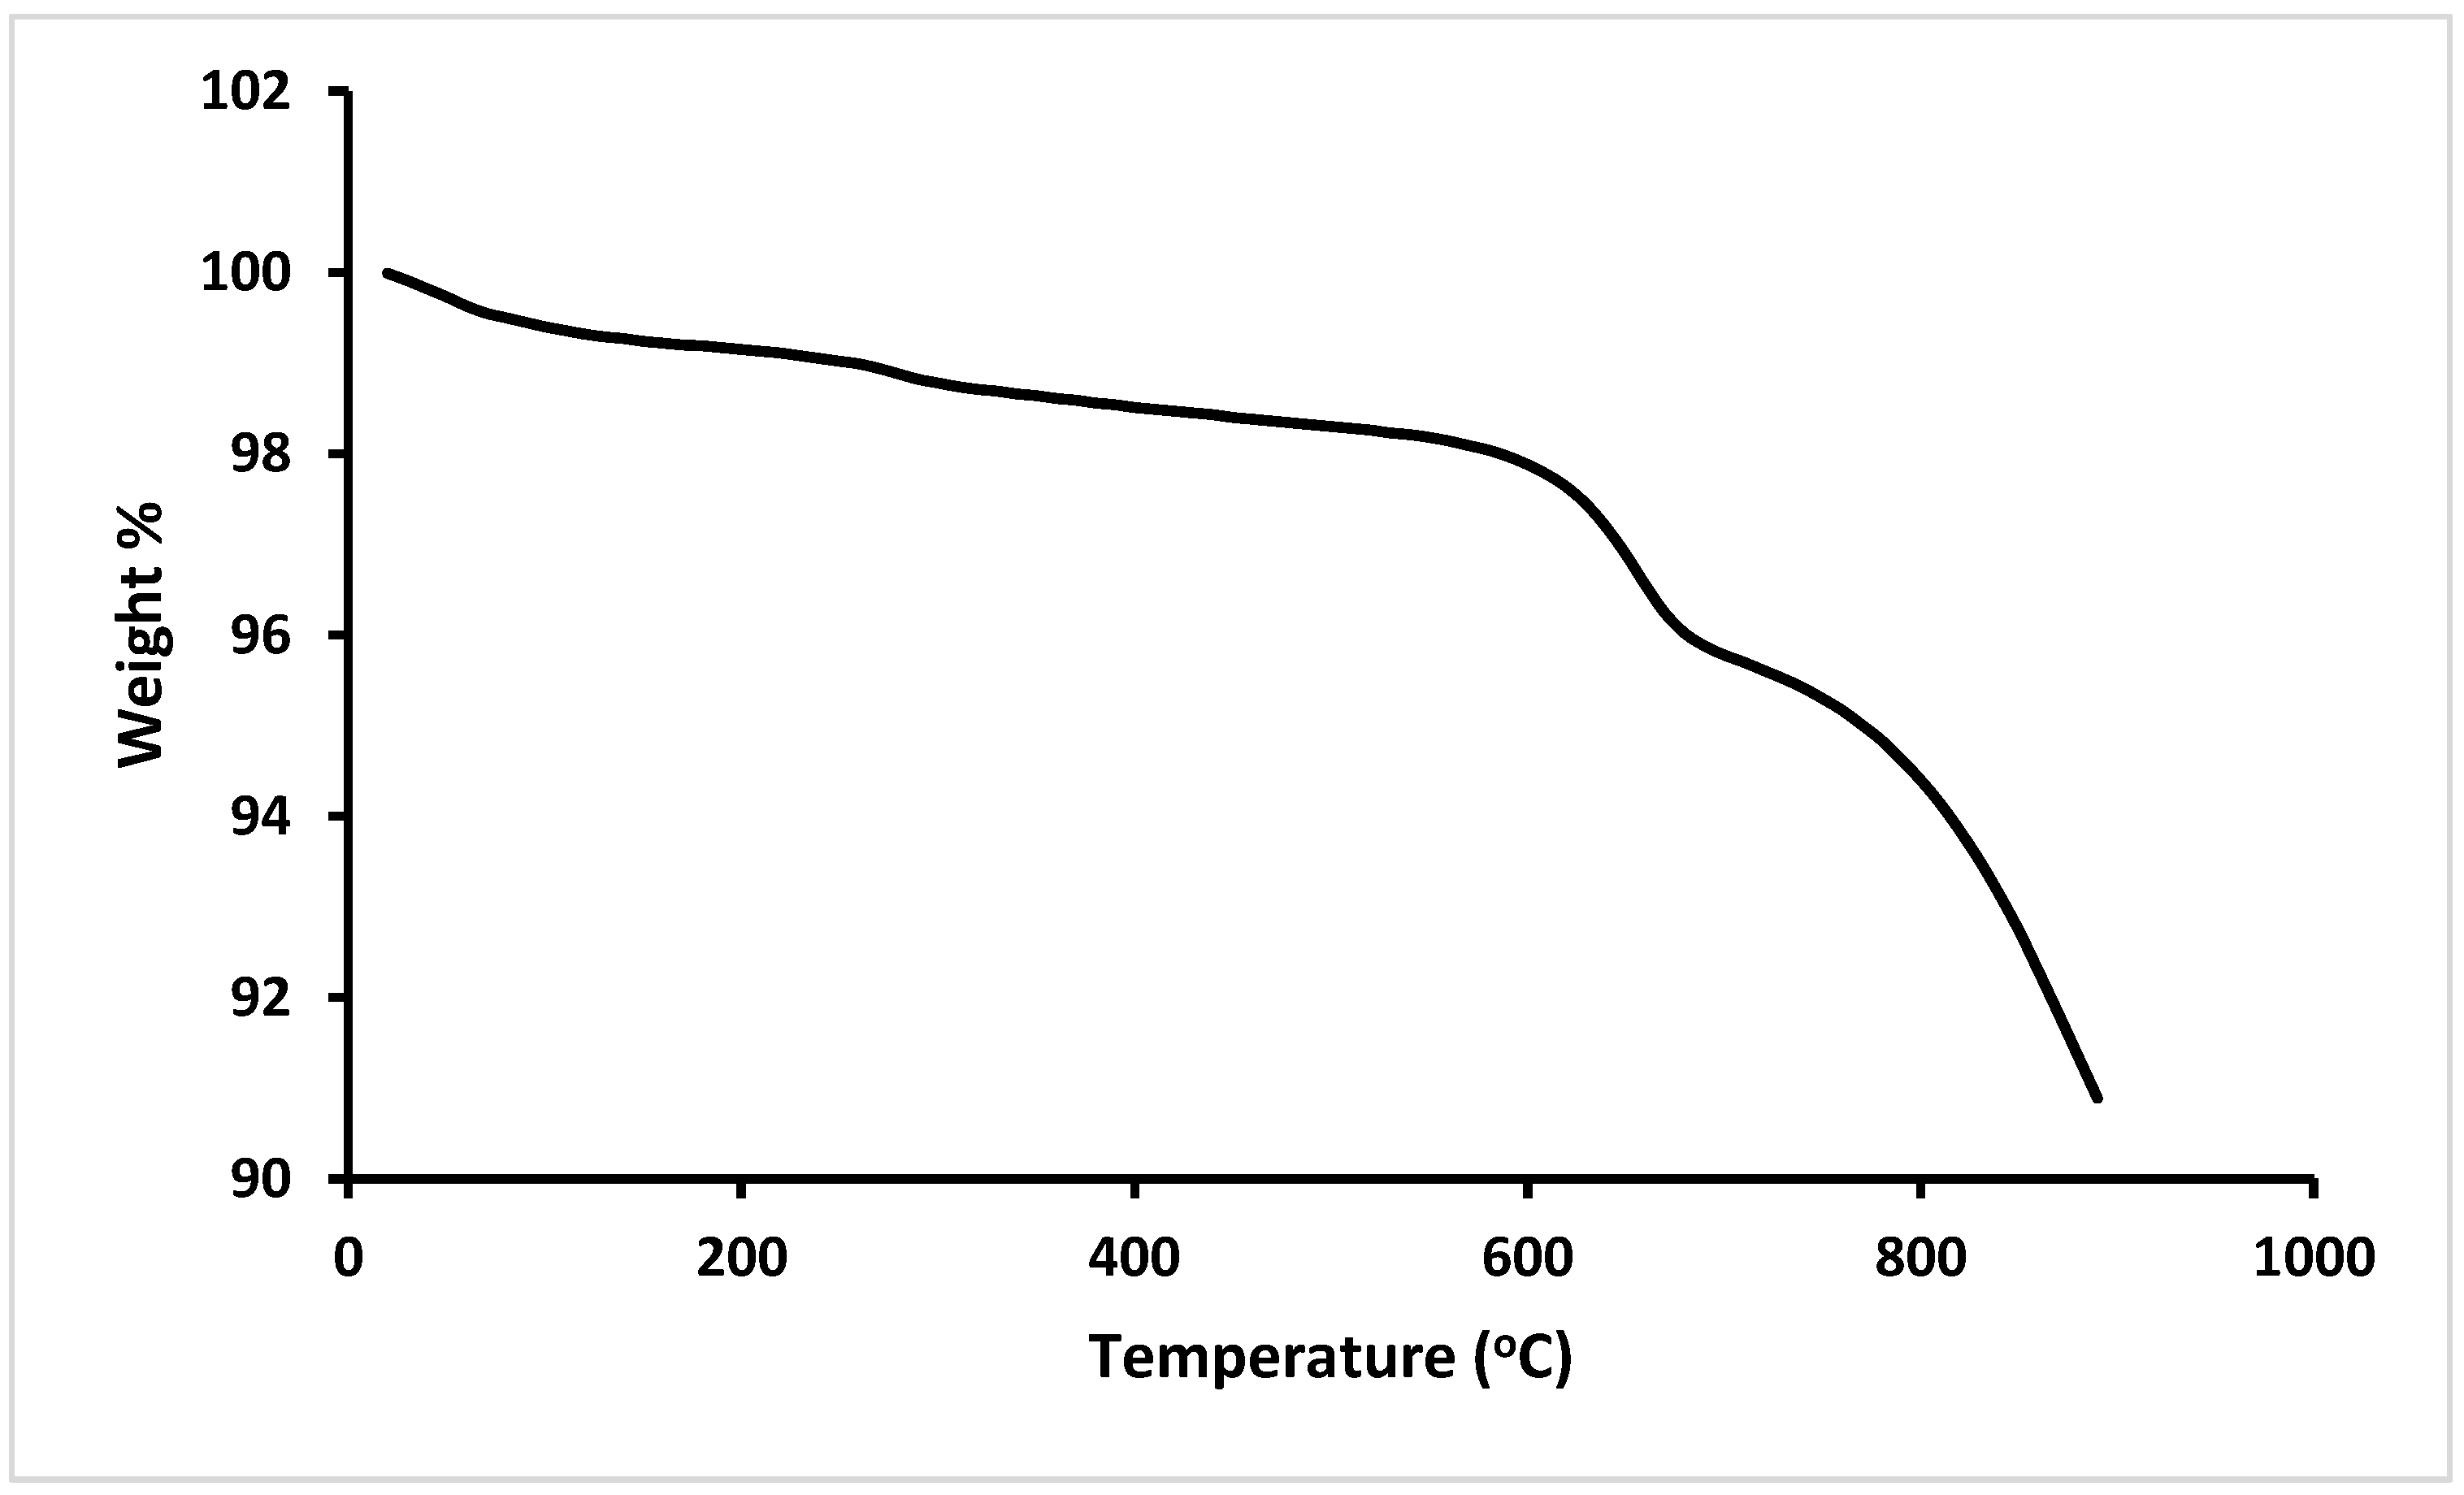
2.3. Analysis of EPFB Biomass Weight Loss
Characterization of EPFB Ash and Produced Silica
3. Results and Discussion
3.1. Mass Loss of EPFB Biomass at Different Temperatures after Calcination
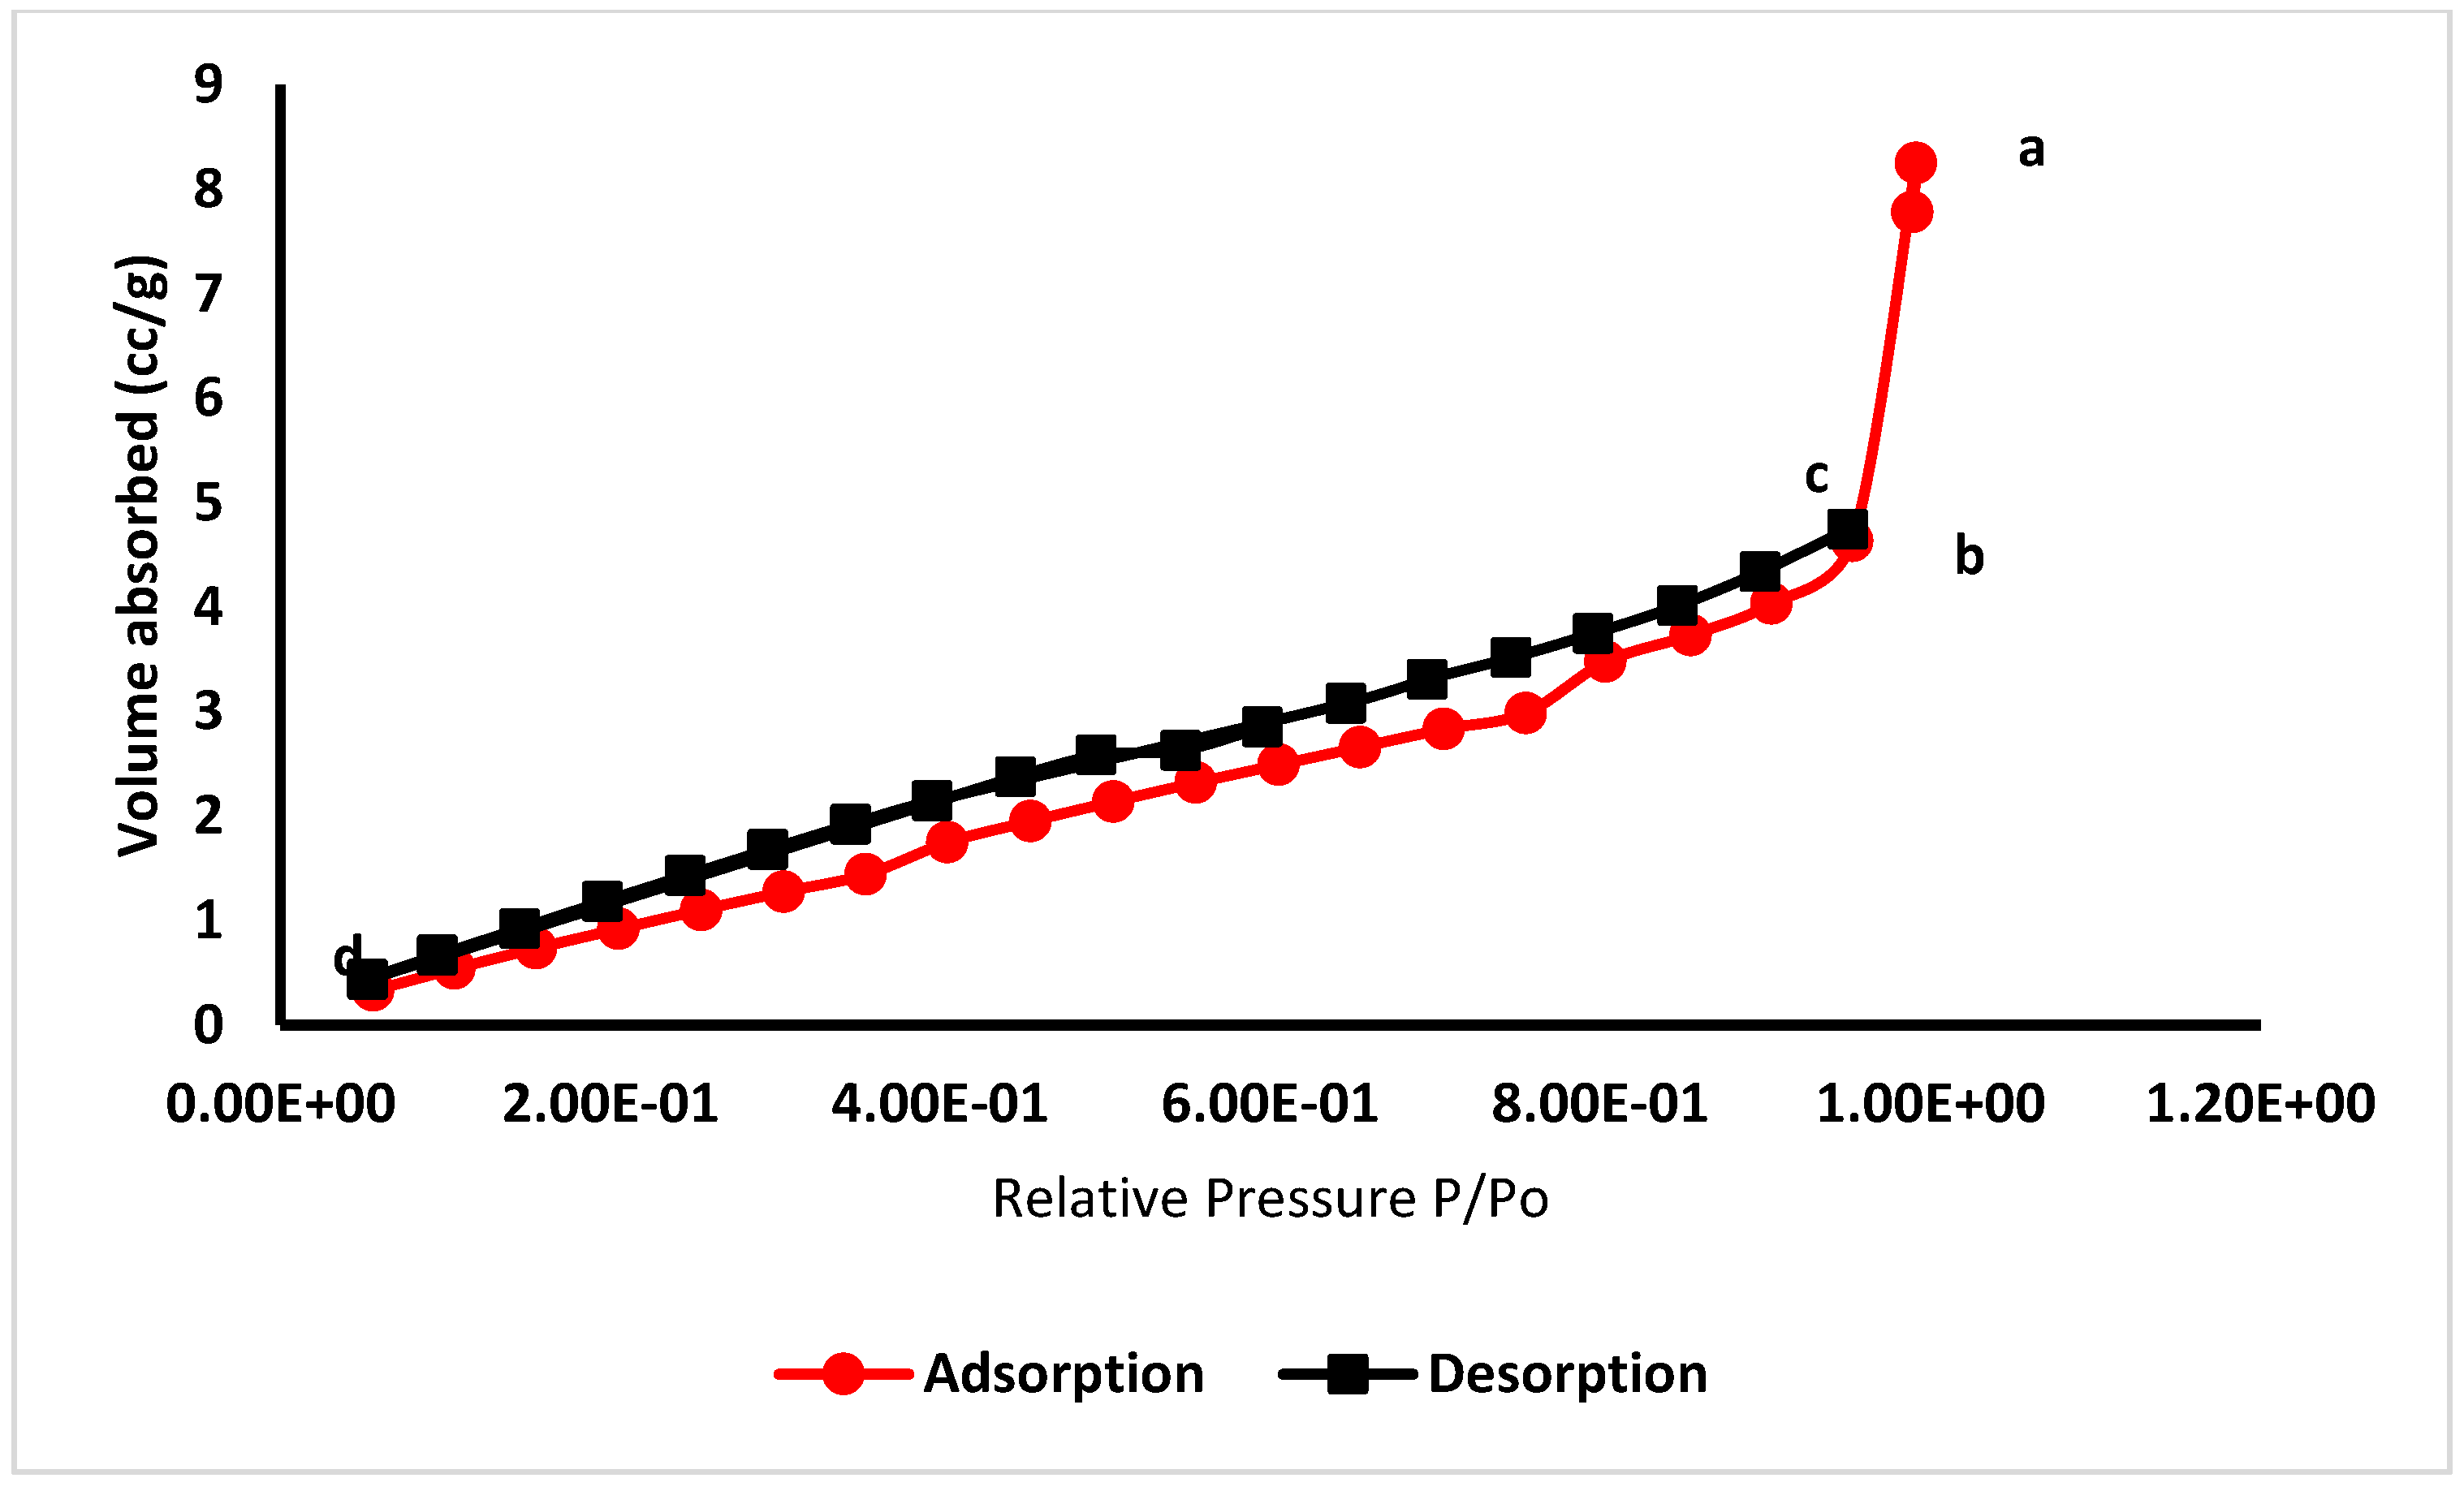
3.2. Textural Property and N2 Adsorption Isotherm of EPFB Ash
3.3. X-ray Fluorescence (XRF) Analysis
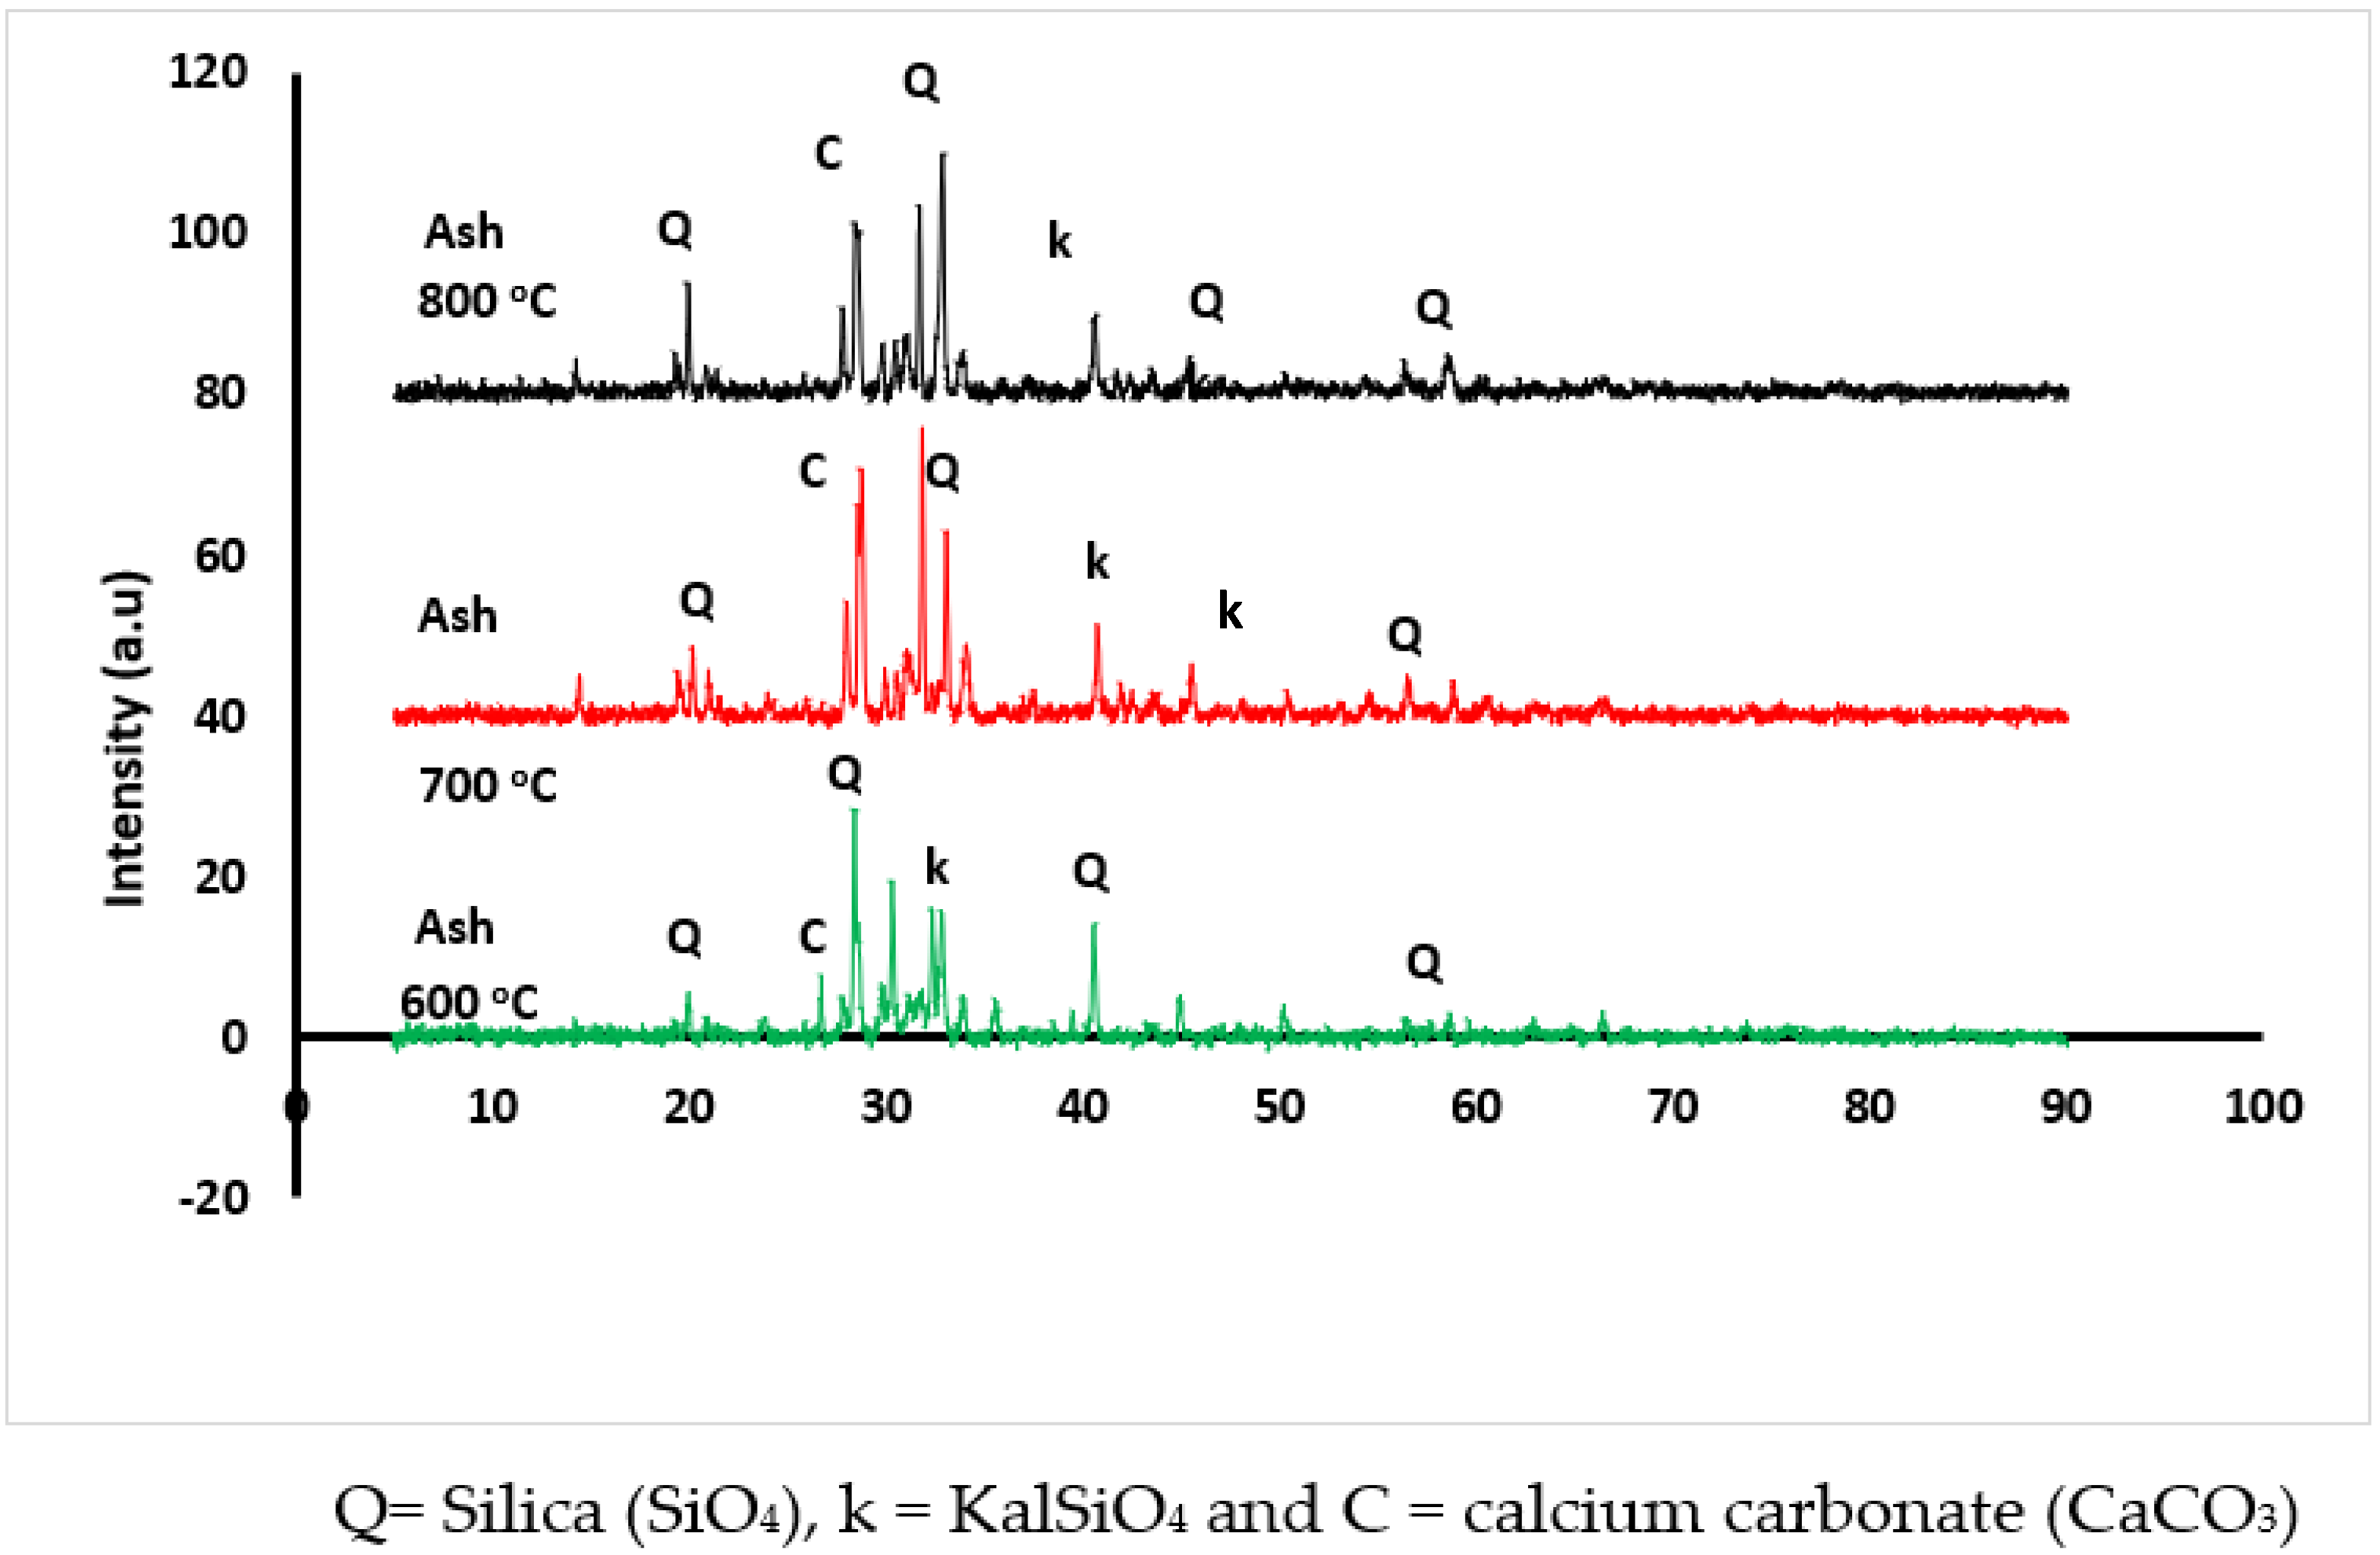
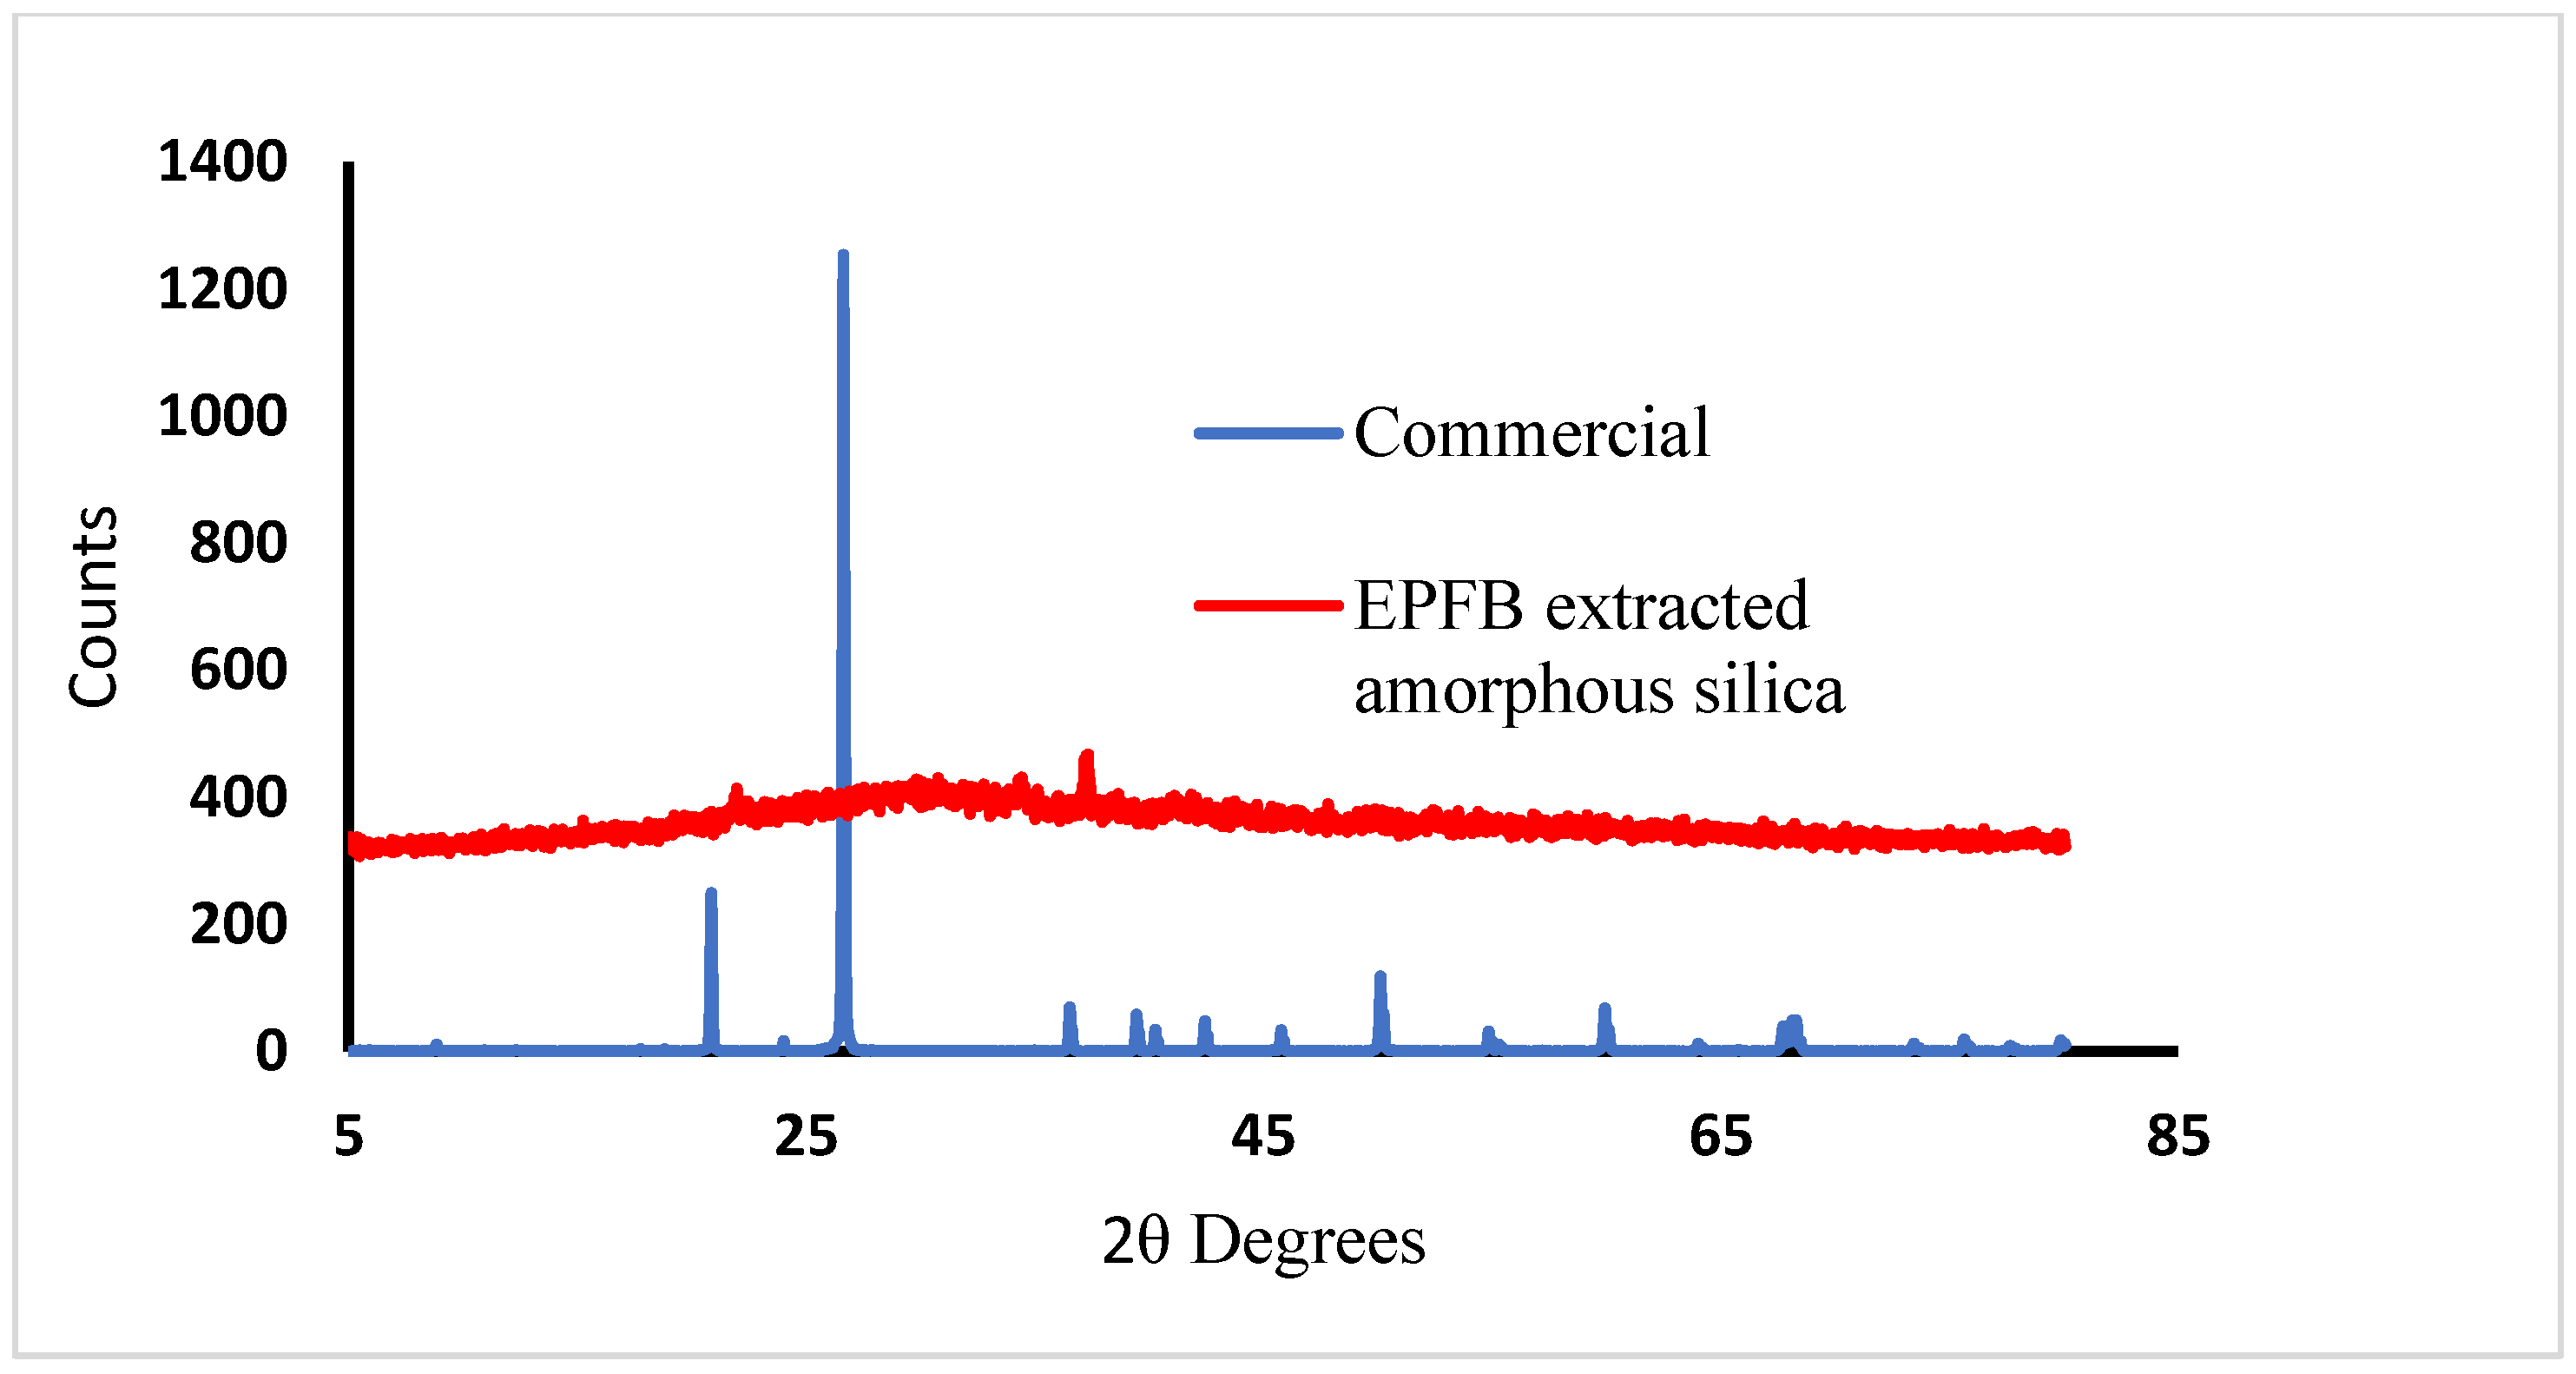
3.4. XRD Analysis of EPFB Ash and Produced Silica
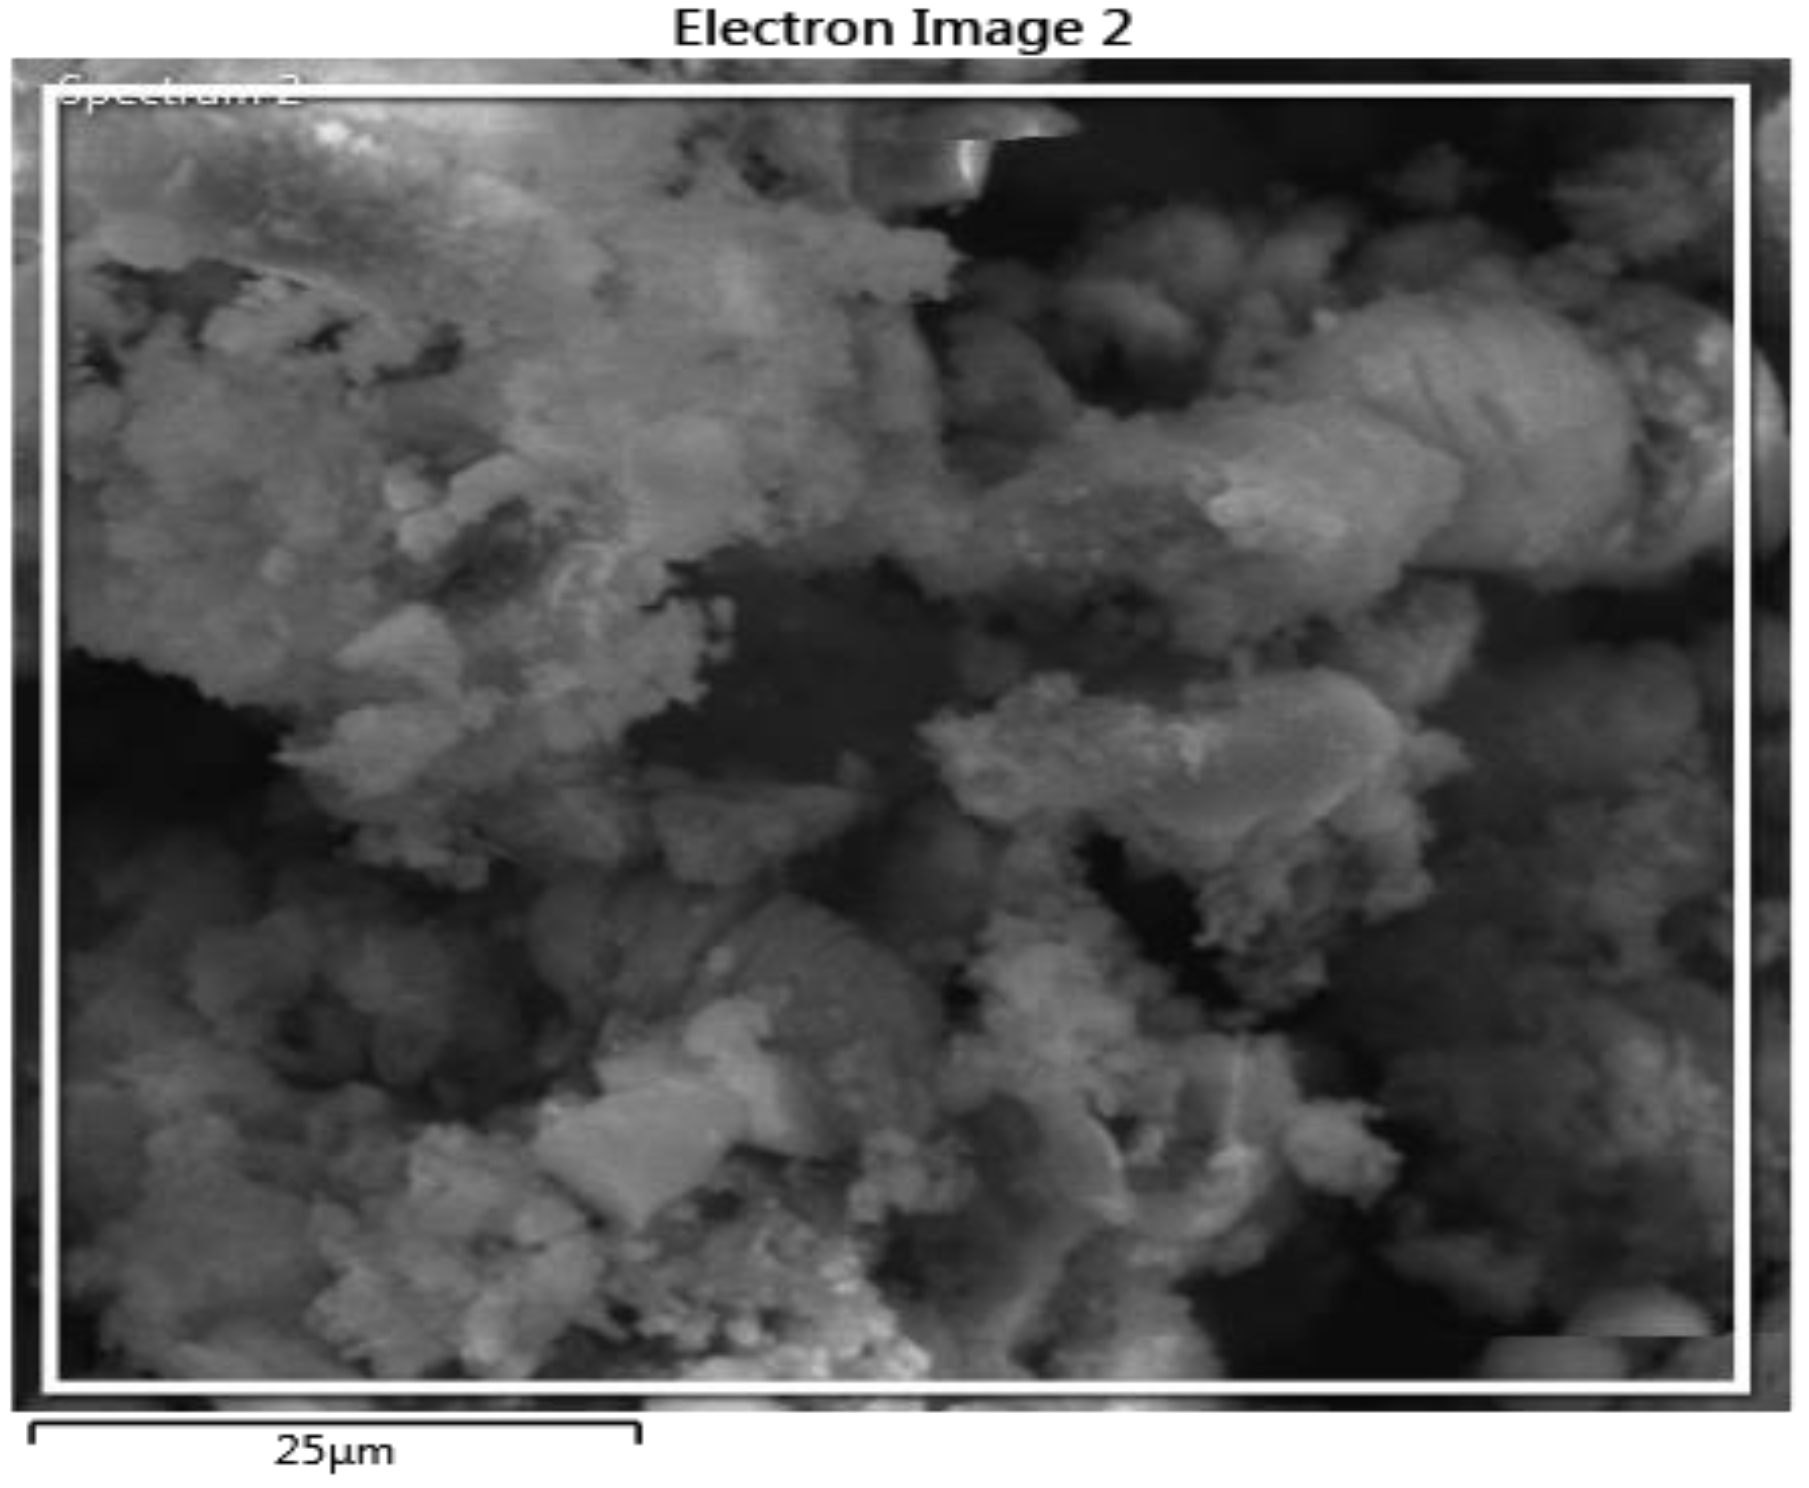
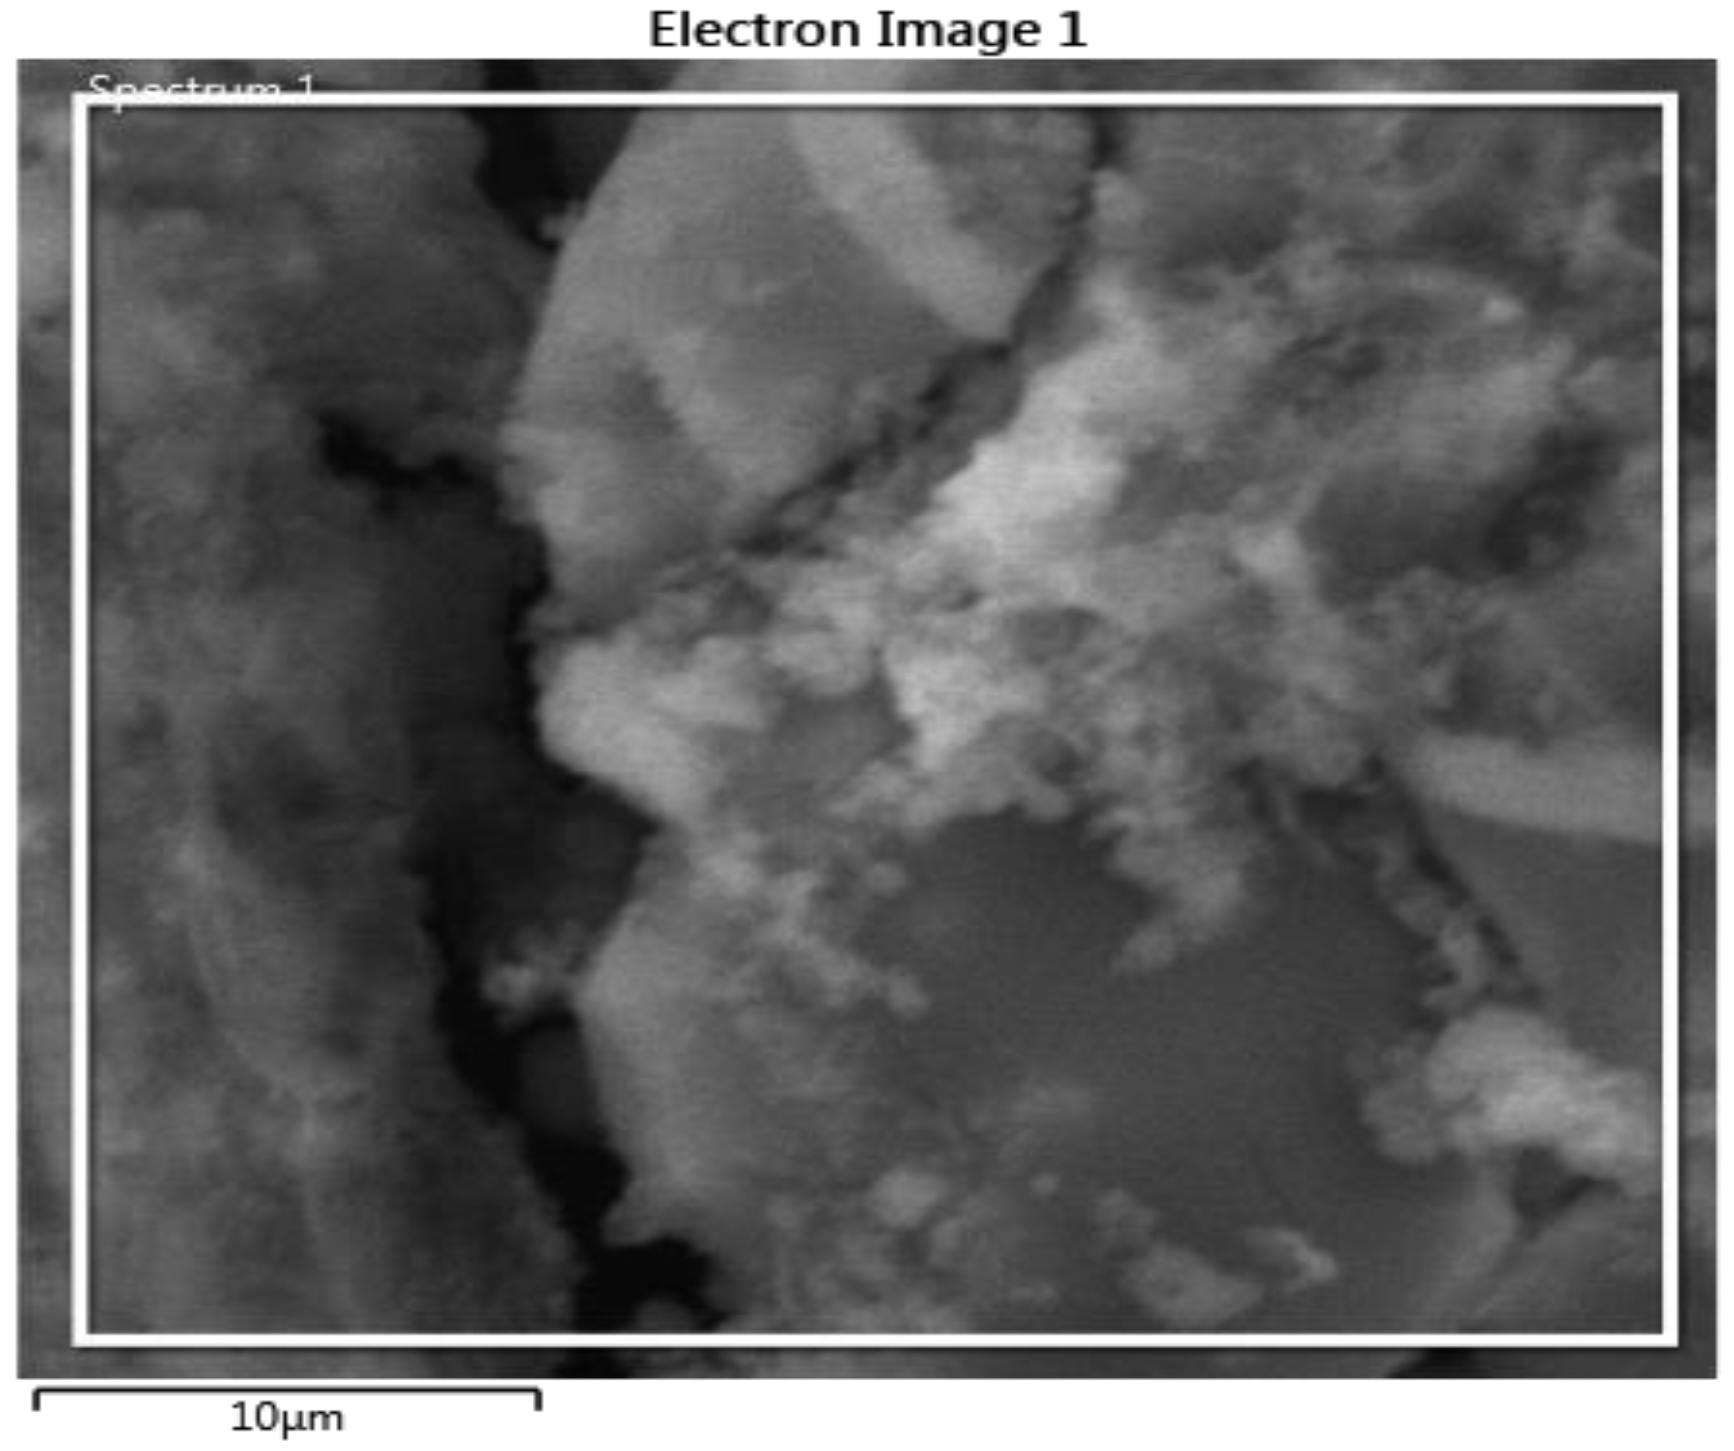
3.5. Surface Morphology Analysis
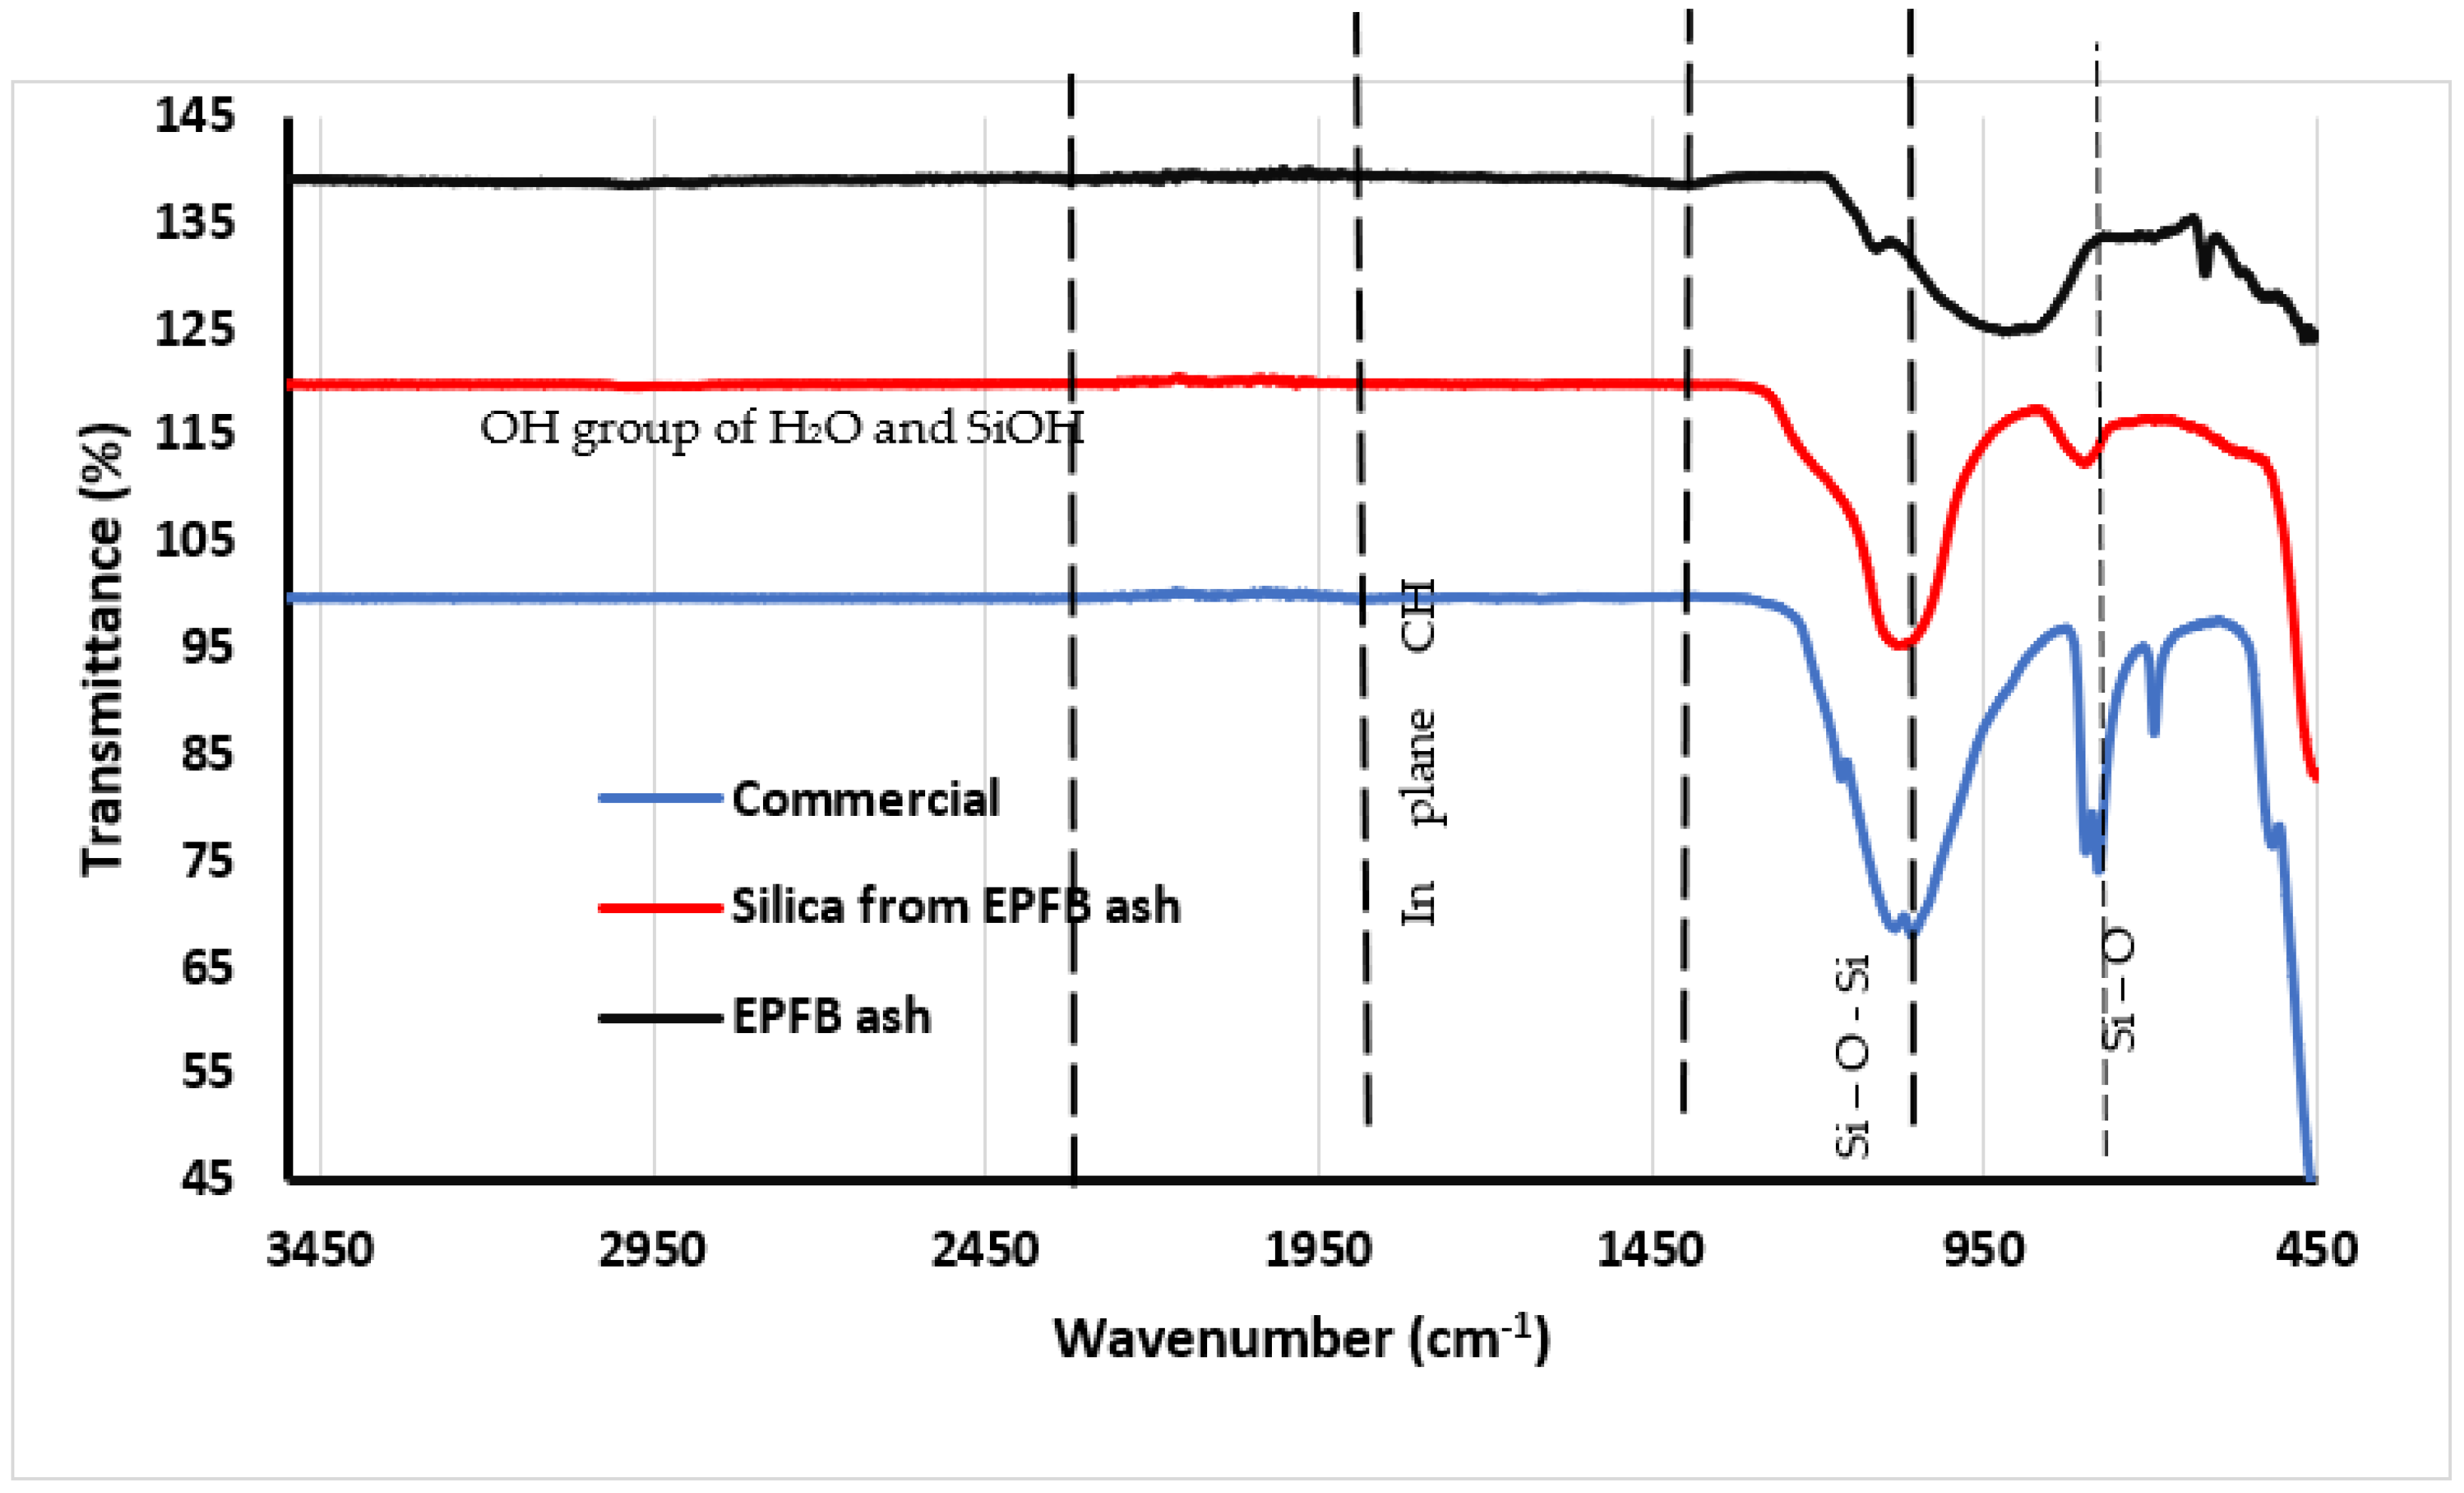
3.6. FTIR Identification of Functional Groups in Silica
4. Conclusions
Author Contributions
Funding
Data Availability Statement
Acknowledgments
Conflicts of Interest
References
- Alves, C.; Valk, M.; de Jong, S.; Bonomi, A.; van der Wielen, L.; Mussatto, S. Techno-economic assessment of biorefinery technologies for aviation biofuels supply chains in Brazil. Biofuels Bioprod. Biorefining 2017, 11, 67–91. [Google Scholar] [CrossRef]
- Wang, J.; Bi, P.; Zhang, Y.; Xue, H.; Jiang, P.; Wu, X. Preparation of jet fuel range hydrocarbons by catalytic transformation of bio-oil derived from fast pyrolysis of straw stalk. Energy 2015, 86, 488–499. [Google Scholar] [CrossRef]
- Arfiana, E.; Finali, R.; Noor, I.; Murti, S.S.; Suratno, H.; Rosyadi, E.; Saputra, H.; Noda, R. Oil palm empty fruit bunch ash as a potassium source in the synthesis of NPK fertilizer. IOP Conf. Ser. Earth Environ. Sci. 2021, 749, 012038. [Google Scholar] [CrossRef]
- Madrid, R.; Nogueira, C.; Margarido, F. Production and characterization of amorphous silica from rice husk waste. In Proceedings of the WasteEng’2012: 4th International Conference on Engineering for Waste and Biomass Valorisation, Porto, Portugal, 10–13 September 2012. [Google Scholar]
- Pérez-Botella, E.; Valencia, S.; Rey, F. Zeolites in Adsorption Processes: State of the Art and Future Prospects. Chem. Rev. 2022, 122, 17647–17695. [Google Scholar] [CrossRef]
- Zaffar, S.; Kumar, A.; Memon, N.; Kumar, R.; Saand, A. Investigating Optimum Conditions for Developing Pozzolanic Ashes from Organic Wastes as Cement Replacing Materials. Materials 2022, 15, 2320. [Google Scholar] [CrossRef] [PubMed]
- Future Market Insights, Inc. Worldwide Demand for Precipitated Silica Market Will Surge at a Robust 8.8% CAGR during 2022 and 2032; Globe Newswire: Newark, NJ, USA, 2023. [Google Scholar]
- Kaniapan, S.; Hassan, S.; Ya, H.; Nesan, K.P.; Azeem, M. The Utilisation of Palm Oil and Oil Palm Residues and the Related Challenges as a Sustainable Alternative in Biofuel, Bioenergy, and Transportation Sector: A Review. Sustainability 2021, 13, 311. [Google Scholar] [CrossRef]
- Elanthikkal, S.; Mohamed, H.; Alomair, N. Green Route Synthesis of Amorphous Silica from Oil Palm Decanter Cake: From Literature Review to Experiments. Indones. J. Sci. Technol. 2023, 8, 141–156. [Google Scholar]
- Bakar, R.; Yahya, R.; Gan, S. Production of high purity amorphous silica from rice husk. Procedia Chem. 2016, 19, 189–195. [Google Scholar] [CrossRef]
- Suryana, R.; Iriani, Y.; Nurosyid, F.; Fasquelle, D. Characteristics of silica rice husk ash from Mojogedang Karanganyar Indonesia. IOP Conf. Ser. Mater. Sci. Eng. 2018, 367, 012008. [Google Scholar] [CrossRef]
- Pa, F.; Chik, A.A.; Bari, M. Palm Ash as an Alternative Source for Silica Production. In MATEC Web of Conferences; EDP Sciences: Kangar, Malaysia, 2016. [Google Scholar]
- Samat, N.; Zulkafly, S.; Jaman, U.; Zauzi, N.; Rahman, M.; Baini, R. Characteristics Analysis of Bio-Based Silica Extracted from. Int. J. Eng. Technol. 2018, 7, 94–96. [Google Scholar]
- Rahmat, F.; Fen, Y.; Anuar, M.; Omar, N.; Zaid, M.; Matori, K.; Khaidir, R. Synthesis and Characterization of ZnO-SiO2 Composite Using Oil Palm Empty Fruit Bunch as a Potential Silica Source. Molecules 2021, 26, 1061. [Google Scholar] [CrossRef] [PubMed]
- Affandi, S.; Setyawan, H.; Winardi, S.; Purwanto, A.; Balgis, R. A facile method for production of high-purity silica xerogels from bagasse ash. Adv. Powder Technol. 2009, 20, 468–472. [Google Scholar] [CrossRef]
- Zang, J.; Yu, H.; Liu, G.; Hong, M.; Liu, J.; Chen, T. Research Progress on Modifications of Zeolite Y for Improved Catalytic Properties. Inorganics 2023, 11, 22. [Google Scholar] [CrossRef]
- Permatasari, N.; Sucahya, T.; Nandiyanto, A. Review: Agricultural Wastes as a Source of Silica Material. Indones. J. Sci. Technol. 2016, 1, 82–106. [Google Scholar] [CrossRef]
- Pandiangan, K.; Simanjuntak, W.; Hadi, S.; Ilim, I.; Amrulloh, H. Physical characteristics and utilization of ZSM-5 prepared from rice husk silica and aluminum hydroxide as catalyst for transesterification of Ricinus communis oil. Mater. Res. Express 2021, 8, 06550. [Google Scholar] [CrossRef]
- Liu, Y.; Guo, Y.; Zhu, Y.; An, D.; Gao, W.; Wang, Z.; Ma, Y.; Wang, Z. A sustainable route for the preparation of activated carbon and silica from rice husk ash. J. Hazard. Mater. 2011, 186, 1314–1319. [Google Scholar] [CrossRef]
- Costa, J.; Paranhos, C. Systematic evaluation of amorphous silica production from rice husk ashes. J. Clean. Prod. 2018, 192, 688–697. [Google Scholar] [CrossRef]
- Velmurugan, P.; Shim, J.; Lee, K.J.; Cho, M.; Lim, S.S.; Seo, S.K.; Cho, K.M.; Bang, S.K.; Oh, B.T. Extraction, characterization, and catalytic potential of amorphous silica from corn cobs by sol-gel method. J. Ind. Eng. Chem. 2015, 29, 298–303. [Google Scholar] [CrossRef]
- Kaya, G.; Yilmaz, E.; Deveci, H. Sustainable nanocomposites of epoxy and silica xerogel synthesized from corn stalk ash: Enhanced thermal and acoustic insulation performance. Compos. Part B Eng. 2018, 150, 1–6. [Google Scholar] [CrossRef]
- Usman, A.M.; Raji, A.; Waziri, N.H.; Hassan, M.A. A Study on silica and alumina potential of the savannah bagasse ash. IOSR J. Mech. Civ. Eng. 2014, 11, 48–52. [Google Scholar] [CrossRef]
- Channoy, C.; Maneewan, S.; Punlek, C.; Chirarattananon, S. Preparation and characterization of silica gel from bagasse ash. Adv. Mater. Res. Trans. Tech. Publ. 2018, 1145, 44–48. [Google Scholar] [CrossRef]
- Adebisi, A.; Agunsoye, J.; Bello, S.; Kolawole, F.; Ramakokovhu, M.; Hassan, S.; Daramola, M. Extraction of Silica from Sugarcane Bagasse, Cassava Periderm and Maize Stalk: Proximate Analysis and Physico-Chemical Properties of Wastes. Waste Biomass Valor 2019, 10, 617–629. [Google Scholar] [CrossRef]
- Farirai, F.; Mupa, M.; Daramola, M. An improved method for the production of high purity silica from sugarcane bagasse ash obtained from bioethanol plant boiler. Part. Sci. Technol. 2021, 39, 252–259. [Google Scholar] [CrossRef]
- Imoisili, P.; Ukoba, K.; Jen, T. Green technology extraction and characterisation of silica nanoparticles from palm kernel shell ash via sol–gel. J. Matters Res. Technol. 2020, 9, 307–313. [Google Scholar] [CrossRef]
- Adebisi, J.A.; Agunsoye, J.O.; Bello, S.A.; Haris, M.; Ramakokovhu, M.M.; Daramola, M.O.; Hassan, S.B. Extraction of Silica from Cassava Periderm using Modified Sol-Gel Method. Niger. J. Technol. Dev. 2018, 15, 57–65. [Google Scholar] [CrossRef]
- Utama, P.; Yamsaengsung, R.; Sangwichien, C. Silica gel derived from palm oil mill fly ash. Songklanakarin J. Sci. Technol. 2018, 40, 121–126. [Google Scholar]
- Idris, J.; Shirai, Y.; Anduo, Y.; Ali, A.; Othman, M.; Ibrahim, I.; Husen, R.; Hassan, M. Improved yield and higher heating value of biochar from oil palm biomass at low retention time under self-sustained carbonization. J. Clean. Prod. 2015, 104, 475–479. [Google Scholar] [CrossRef]
- Ibrahim, I.; Tsubota, T.; Hassan, M.; Andou, Y. Surface Functionalization of Biochar from Oil Palm Empty Fruit Bunch through Hydrothermal Process. Processes 2021, 9, 149. [Google Scholar] [CrossRef]
- Akhayere, E.; Kavaz, D.; Vaseashta, A. Efficacy Studies of Silica Nanoparticles Synthesized Using Agricultural Waste for Mitigating Waterborne Contaminants. Appl. Sci. 2022, 12, 9279. [Google Scholar] [CrossRef]
- Claoston, N.; Samsuri, A.; Husni, M.A.; Amran, M.M. Effects of pyrolysis temperature on the physicochemical properties of empty fruit bunch and rice husk biochars. Waste Manag. Res. 2014, 32, 331–339. [Google Scholar] [CrossRef]
- Saceda, J.; de Leon, R.; Rintramee, K.; Prayoonpokarach, S. Properties of silica from rice husk and rice husk ash and their utilization for zeolite y synthesis. Quim. Nova 2011, 34, 1394–1397. [Google Scholar] [CrossRef]
- Aranovich, G.; Donohue, M. Adsorption isotherm for microsporous adsorbents. Carbon 1995, 33, 1369–1373. [Google Scholar] [CrossRef]
- Yang, K.; Fox, J. Adsorption of humic acid by acid-modified granular activated carbon and powder activated carbon. J. Environ. Eng. 2018, 144, 04018104. [Google Scholar] [CrossRef]
- Kurji, B.; Abba, A. Comparative Study of Textural Properties for Various Silica by Nitrogen Adsorption-desorption Technique. Egypt. J. Chem. 2022, 65, 313–320. [Google Scholar] [CrossRef]
- Dhaneswara, D.; Fatriansyah, J.; Situmorang, F.; Haqoh, A. Synthesis of Amorphous Silica from Rice Husk Ash: Comparing HCl and CH3COOH Acidification Methods and Various Alkaline Concentrations. Int. J. Technol. 2020, 11, 200–208. [Google Scholar] [CrossRef]
- Bonyadi, Z.; Kumar, P.; Foroutan, R.; Kafaei, R.; Arfaeinia, H.; Farjadfard, S.; Ramavandi, B. Ultrasonicassisted synthesis of Populus alba activated carbon for water defluorination: Application for real wastewater. Korean J. Chem. Eng. 2019, 36, 1595–1603. [Google Scholar] [CrossRef]
- Fernandes, I.; Calheiro, D.; Sánchezb, F.; Camachob, A.; Rochac, T.; Caldas de Sousaa, V. Characterization of Silica Produced from Rice Husk Ash: Comparison of Purification and Processing Methods. Mater. Res. 2017, 20, 512–518. [Google Scholar] [CrossRef]
- Bhardwaj, A.; Hossain, S.; Majhi, M. Preparation and characterization of clay bonded high strength silica refractory by utilizing agriculture waste. Bol. Soc. Esp. Cerám. Vidr. 2017, 56, 256–262. [Google Scholar] [CrossRef]
- Gomesa, G.; Philipssenc, C.; Barda, E. Rice husk bubbling fluidized bed combustion for amorphous silica synthesis. J. Environ. Chem. Eng. 2016, 4, 2278–22906. [Google Scholar] [CrossRef]
- Van, V.; Rößler, C.; Bui, D. Pozzolanic reactivity of mesoporous amorphous rice husk ash in portlandite solution. Constr. Build. Mater. 2014, 59, 111–119. [Google Scholar] [CrossRef]
- Adu, M.O.; Atia, K.; Arthur, E.; Asare, P.; Obour, P.; Danso, E.; Frimpong, K.; Sanleri, K.; Asare-Larbi, S.; Adjei, R.; et al. The use of oil palm empty fruit bunches as a soil amendment to improve growth and yield of crops. A meta-analysis. Agron. Sustain. Dev. 2022, 42, 13. [Google Scholar] [CrossRef]
- Lizcano-Toledo, R.; Reyes-Martín, M.; Celi, L.; Fernández-Ondoño, E. Phosphorus Dynamics in the Soil–Plant–Environment Relationship in Cropping Systems: A Review. Appl. Sci. 2021, 11, 11133. [Google Scholar] [CrossRef]
- Sivakumar, G.; Amutha, K. Studies on silica obtained from cow dung ash. Adv. Mater. Res. 2012, 584, 470–473. [Google Scholar] [CrossRef]
- Imoisili, P.; Ukoba, K.; Jen, T. Synthesis and characterization of amorphous mesoporous silica from palm kernel shell ash. Bol. De La Soc. Esp. De Ceram. Yvidrio 2020, 59, 159–164. [Google Scholar] [CrossRef]
- Awadh, S.; Yaseen, Z. Investigation of silica polymorphs stratified in siliceous geode using FTIR and XRD methods. Mater. Chem. Phys. 2019, 228, 45–50. [Google Scholar] [CrossRef]
- Chen, X.; Li, S.; Chen, W.; Chen, Y.; Chen, H.; Yang, H. Influence of calcination temperature on calcined carbide slag assisted biomass pyrolysis. Fuel Process. Technol. 2022, 234, 107339. [Google Scholar] [CrossRef]
- Sritham, E.; Gunasekaran, S. FTIR spectroscopic evaluation of sucrose-maltodextrin-sodium citrate bioglass. Food Hydrocoll. 2017, 70, 371–382. [Google Scholar] [CrossRef]
- Osman, N.; Sapawe, N. Synthesis of silica (SiO2) from reproducible acid-leached oil palm frond ash (OPFA) via optimized sol–gel method. Mater. Today Proc. 2020, 31, 249–252. [Google Scholar] [CrossRef]
- Usman, A.; Abduljabbar, A.; Vithanage, M.; Ok, Y.; Ahmad, M.; Ahmad, M. Biochar production from date palm waste: Charring temperature induced changes in composition and surface chemistry. J. Anal. Appl. Pyrolysis 2015, 115, 392–400. [Google Scholar] [CrossRef]


| Temperature °C | Before Calcination (g) | After Calcination (g) | Weight Loss (%) |
|---|---|---|---|
| 600 | 15 | 2.6 | 82.7 |
| 700 | 15 | 2.2 | 85.3 |
| 800 | 15 | 2.4 | 84.0 |
| Temperature °C | BET Surface Area (m2/g) | Total Pore Volume (cm3/g) | Micropore Volume (cm3/g) | Average Pore Size (Å) |
|---|---|---|---|---|
| 600 | 91 | 0.02 | 0.007 | 83.66 |
| 700 | 580 | 0.10 | 0.060 | 25.08 |
| 800 | 921 | 0.24 | 0.170 | 20.86 |
| Property | EPFB Ash | EPFB Silica | Commercial Silica * |
|---|---|---|---|
| Mean pore size (µm) | 5.2 | 23.9 | 19.97 |
| Specific weight/density (kg/m3) | 7.18 | 2.27 | 2.69 |
| Surface area (m2 g−1) | 3.85 | 0.38 | 0.92 |
| SiO2 (%) | 29.5 | 59.85 | 99.24 |
| Morphology | Amorphous | Amorphous | Crystalline |
| Oxides of Element | 600 °C | 700 °C | 800 °C | Commercial Silica * |
|---|---|---|---|---|
| SiO2 | 25.4 | 39.97 | 59.85 | 99.24 |
| CaO | 13.33 | 15.72 | 7.34 | 0.1147 |
| K2O | 7.41 | 10.36 | 11.66 | 0.38 |
| Al2O3 | 8.27 | 1.73 | 1.97 | 0.68 |
| Fe2O3 | 15.84 | 13.74 | 1.55 | - |
| P2O5 | - | 5.40 | 6.28 | 0.0244 |
| MnO | 0.51 | 0.38 | 0.44 | 0.0072 |
| MgO | 4.25 | 8.73 | 8.62 | - |
| Na2O | 0.31 | 0.83 | 0.56 | - |
| TiO2 | 1.59 | 0.21 | 0.15 | - |
| Cr2O3 | 0.15 | 0.07 | 0.06 | - |
| Pb | - | - | - | 0.0002 |
| Mo LOI | - 5.2 | - 1.16 | - 0.95 | 0.0006 <4 |
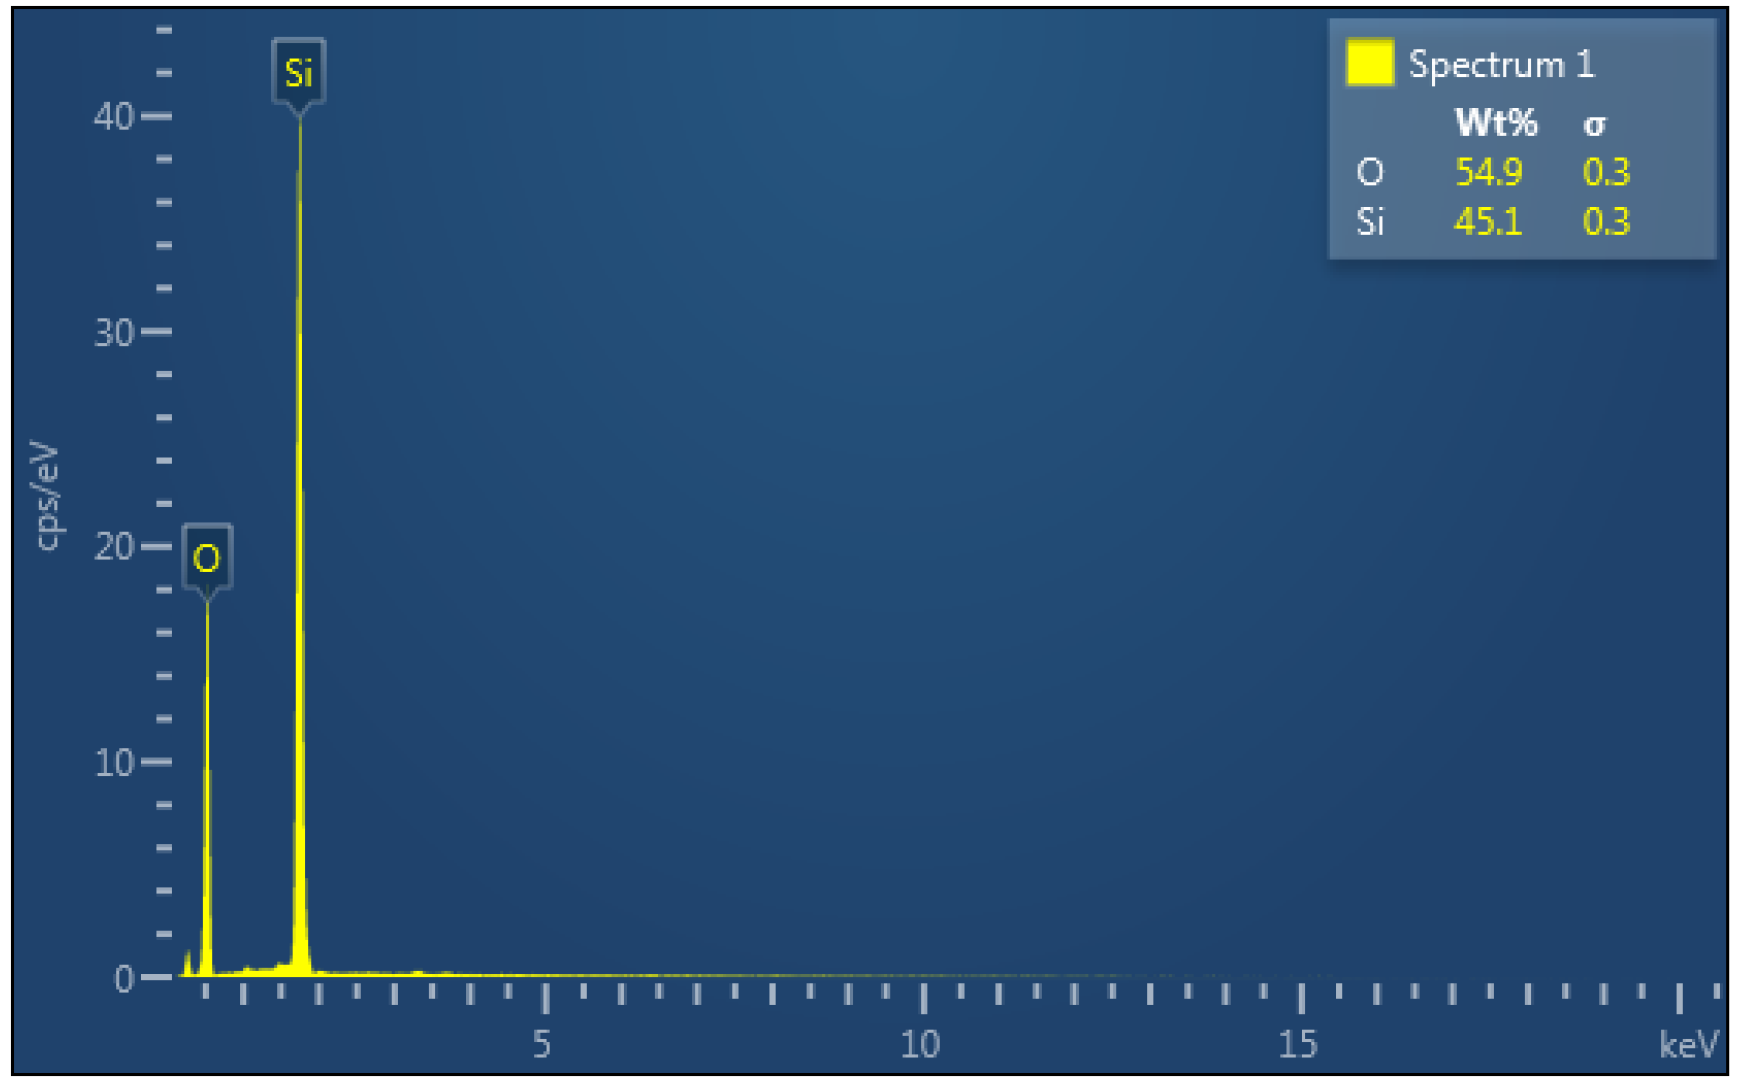
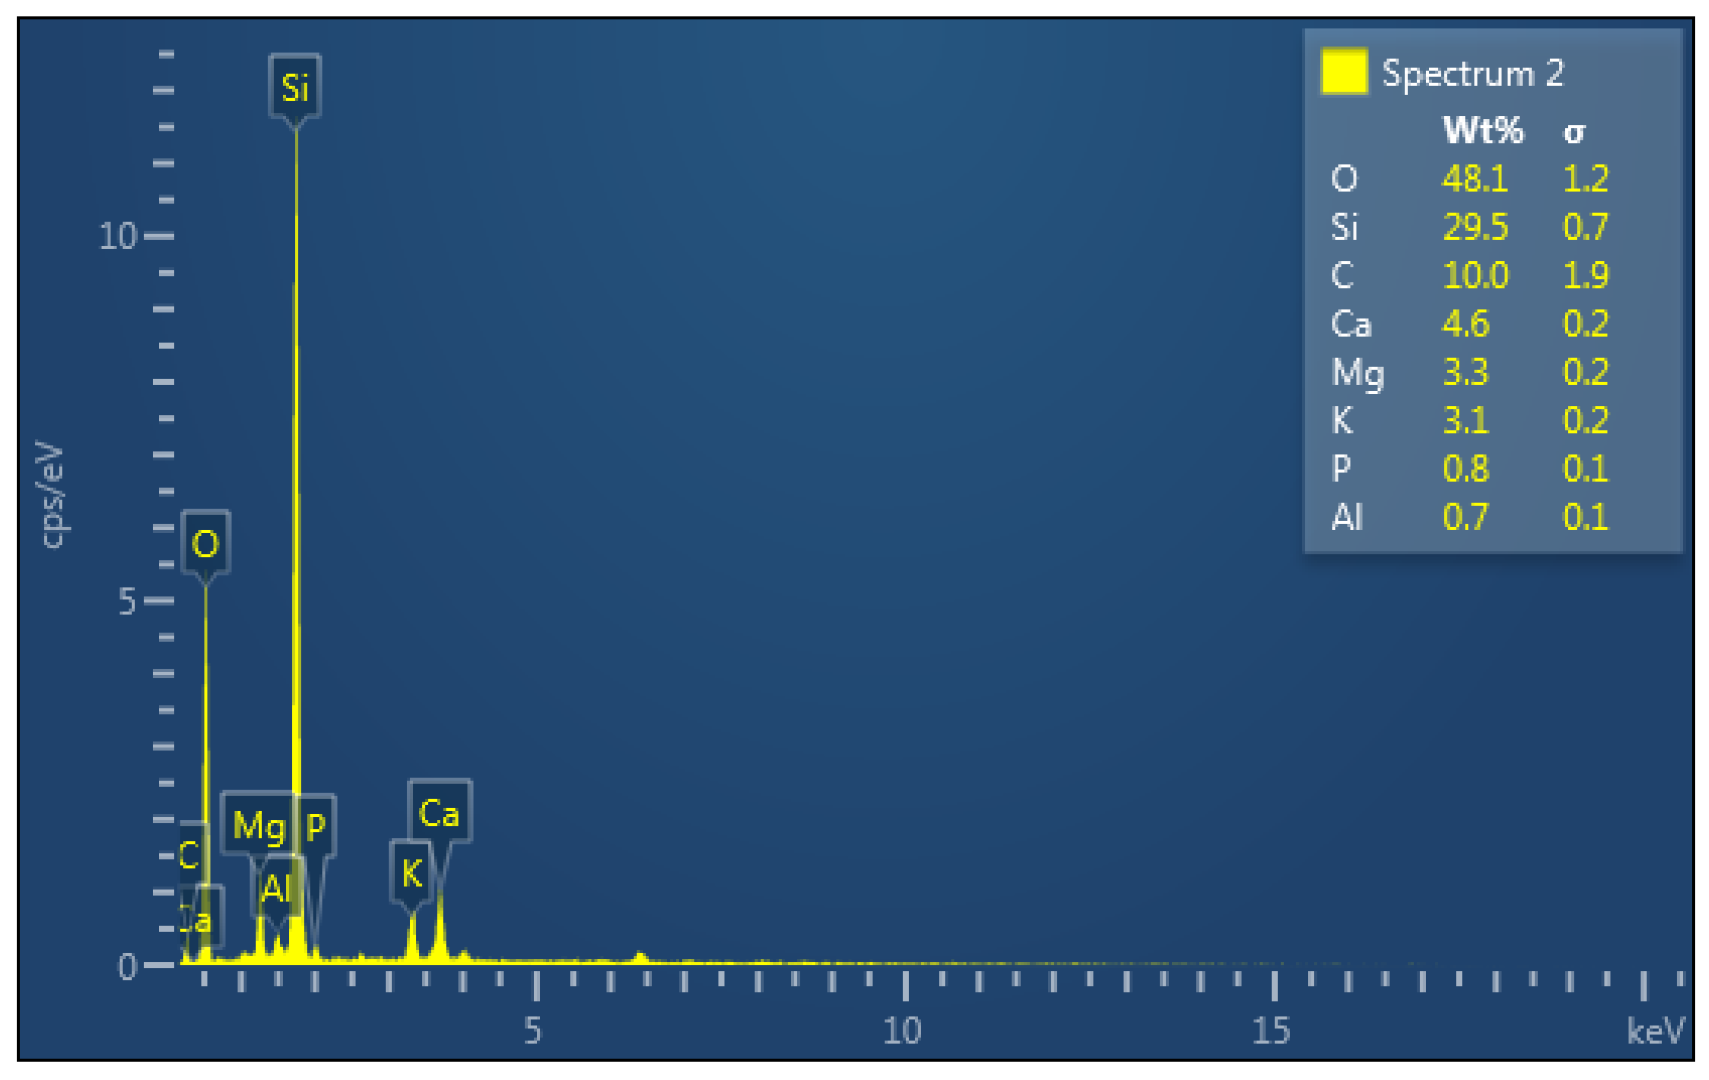
| Elements | Peak (keV) | Ash at 800 °C (wt%) | Extracted Silica (wt%) |
|---|---|---|---|
| Si | 0.05 | 29.5 | 45.1 |
| O | 1.75 | 48.1 | 54.9 |
| C | 0.025 | 10 | - |
| Ca | 3.74 | 4.6 | - |
| Mg | 1.84 | 3.3 | - |
| K | 3.47 | 3.1 | - |
| P | 2.00 | 0.8 | - |
| Al | 1.5 | 0.7 |
| Wave Number | Compound |
|---|---|
| 516–767 | Si-O bond |
| 1000–1058 | Si-O-Si asymmetric bond stretching vibration |
| 1720–2159 | In-plane C=H bond |
| 1998–2096 | OH groups of Si-OH |
| 2841–3000 | OH stretching (H2O) and hydroxyl (Si-OH) |
Disclaimer/Publisher’s Note: The statements, opinions and data contained in all publications are solely those of the individual author(s) and contributor(s) and not of MDPI and/or the editor(s). MDPI and/or the editor(s) disclaim responsibility for any injury to people or property resulting from any ideas, methods, instructions or products referred to in the content. |
© 2023 by the authors. Licensee MDPI, Basel, Switzerland. This article is an open access article distributed under the terms and conditions of the Creative Commons Attribution (CC BY) license (https://creativecommons.org/licenses/by/4.0/).
Share and Cite
Nelson, E.S.; Iyuke, S.; Daramola, M.O.; Okewale, A. Extraction and Characterization of Silica from Empty Palm Fruit Bunch (EPFB) Ash. Processes 2023, 11, 1684. https://doi.org/10.3390/pr11061684
Nelson ES, Iyuke S, Daramola MO, Okewale A. Extraction and Characterization of Silica from Empty Palm Fruit Bunch (EPFB) Ash. Processes. 2023; 11(6):1684. https://doi.org/10.3390/pr11061684
Chicago/Turabian StyleNelson, Ebitei Sintei, Sunny Iyuke, Michael Olawale Daramola, and Akindele Okewale. 2023. "Extraction and Characterization of Silica from Empty Palm Fruit Bunch (EPFB) Ash" Processes 11, no. 6: 1684. https://doi.org/10.3390/pr11061684