
Effect of the Freezing Step on Primary Drying Experiments and Simulation of Lyophilization Processes


Abstract
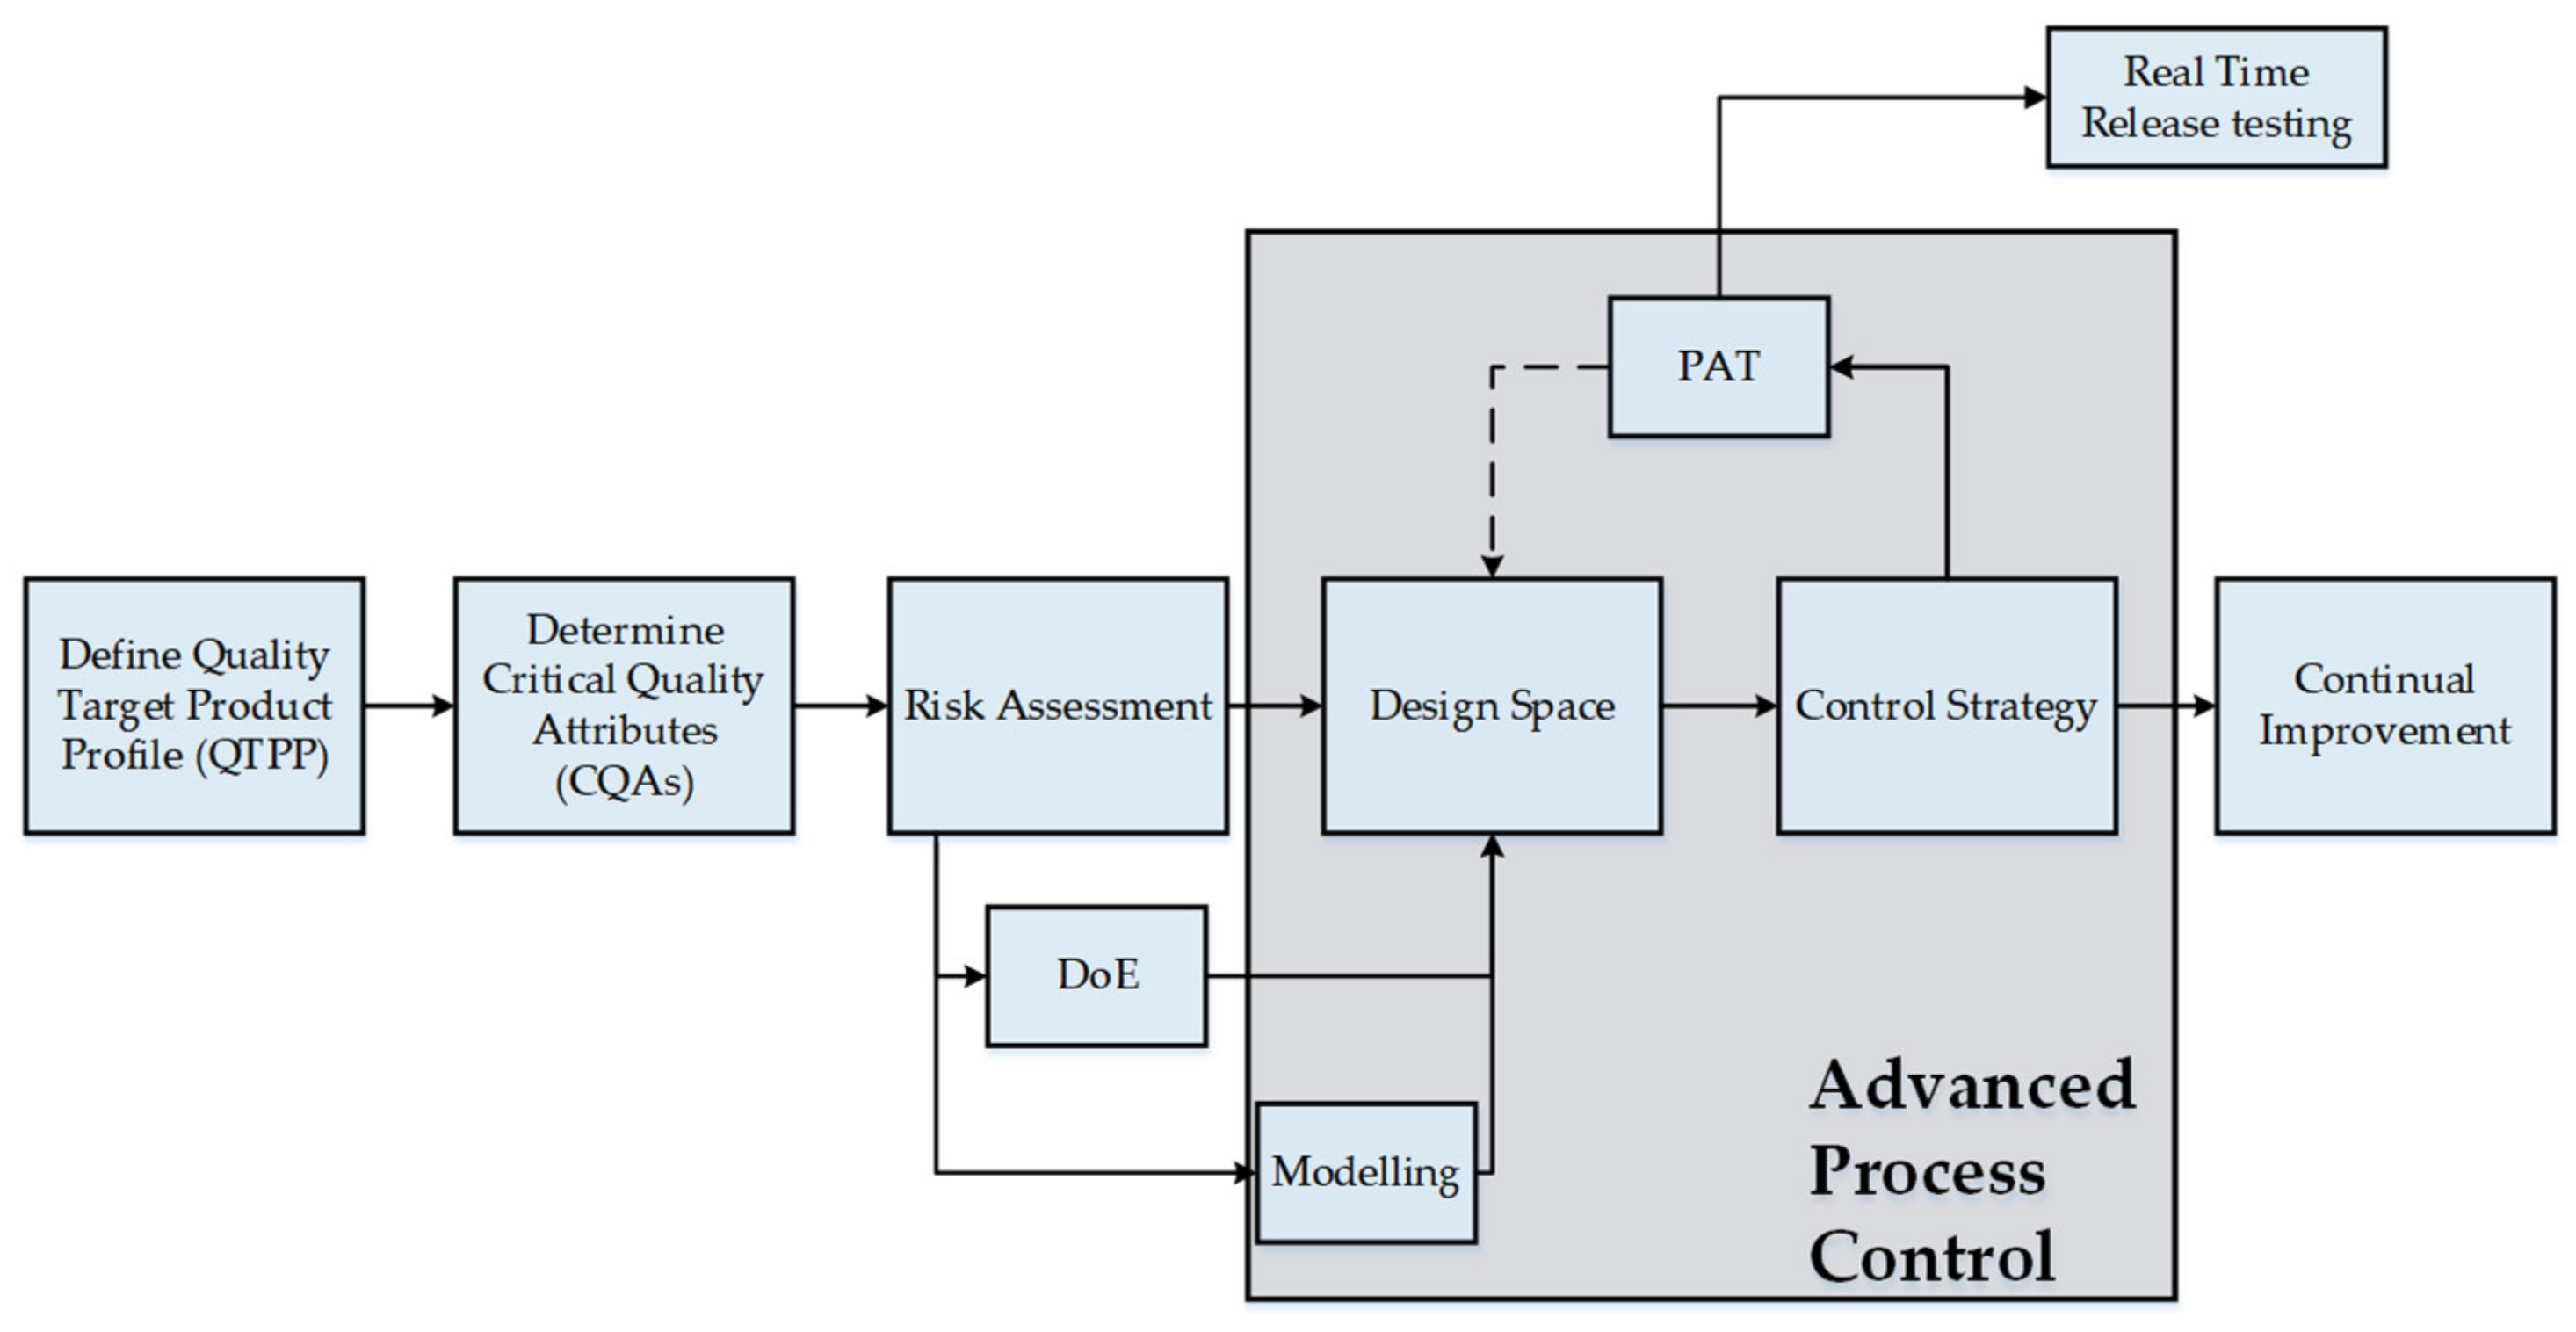
:1. Introduction
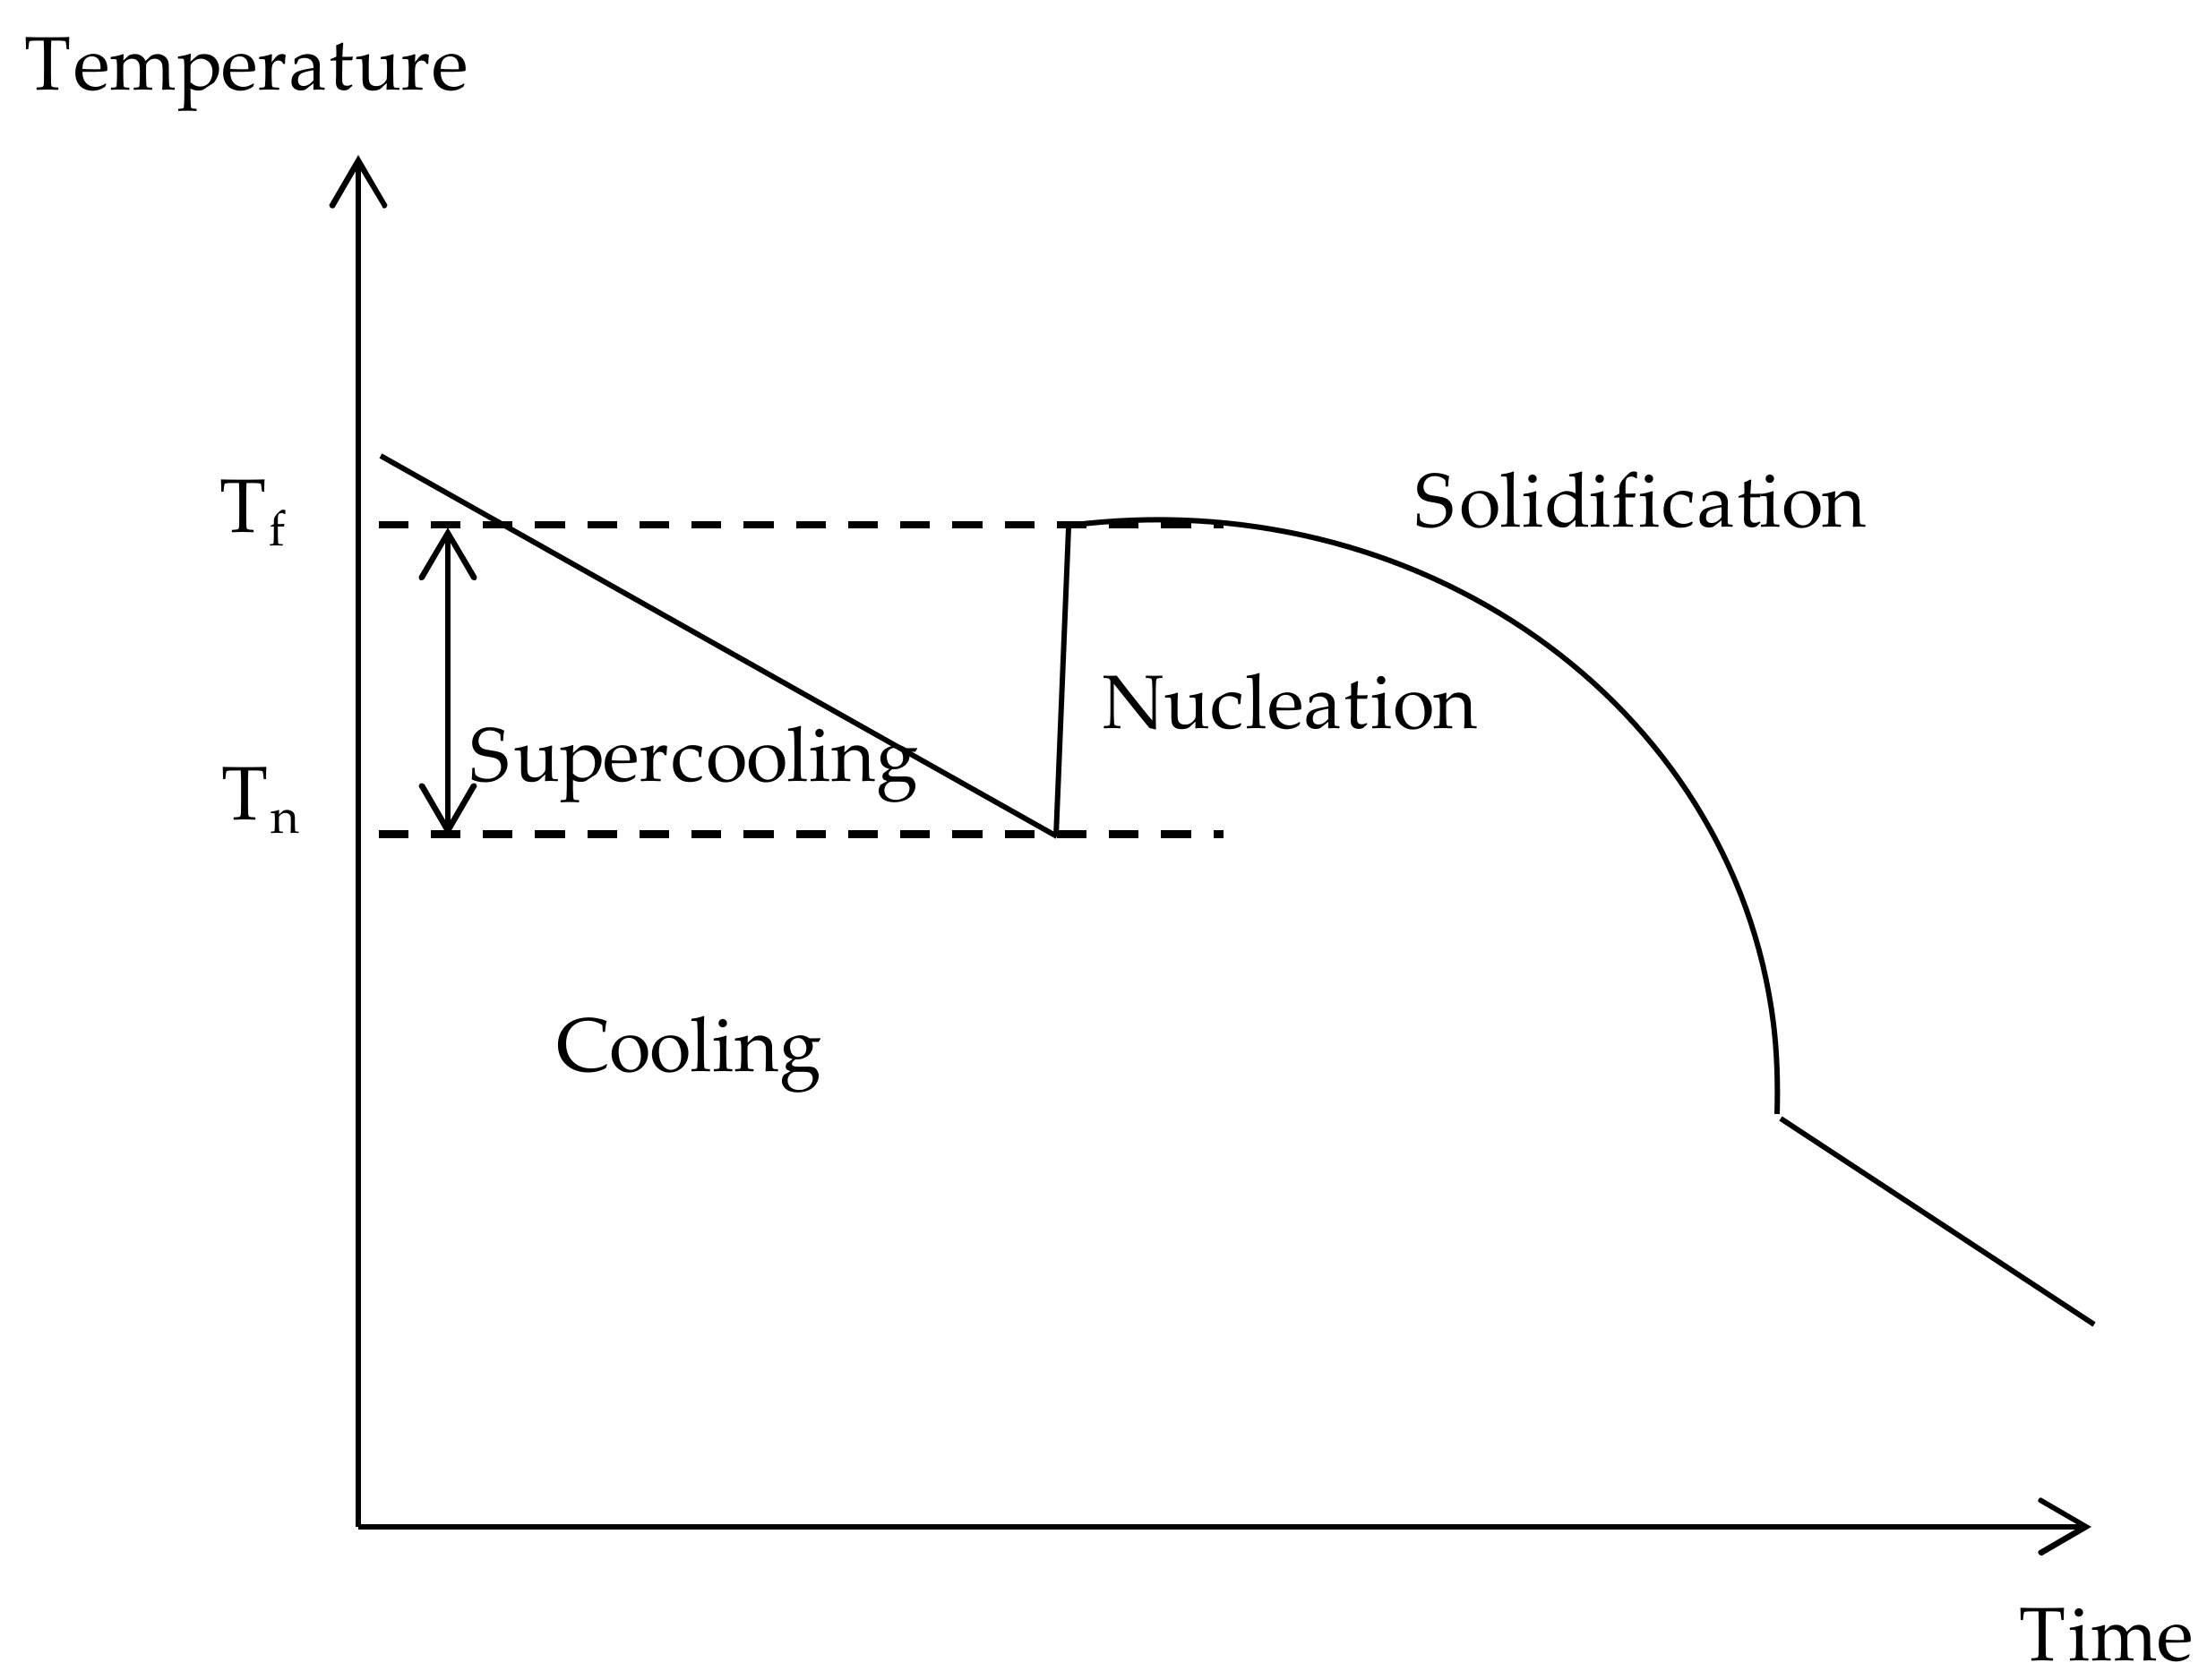
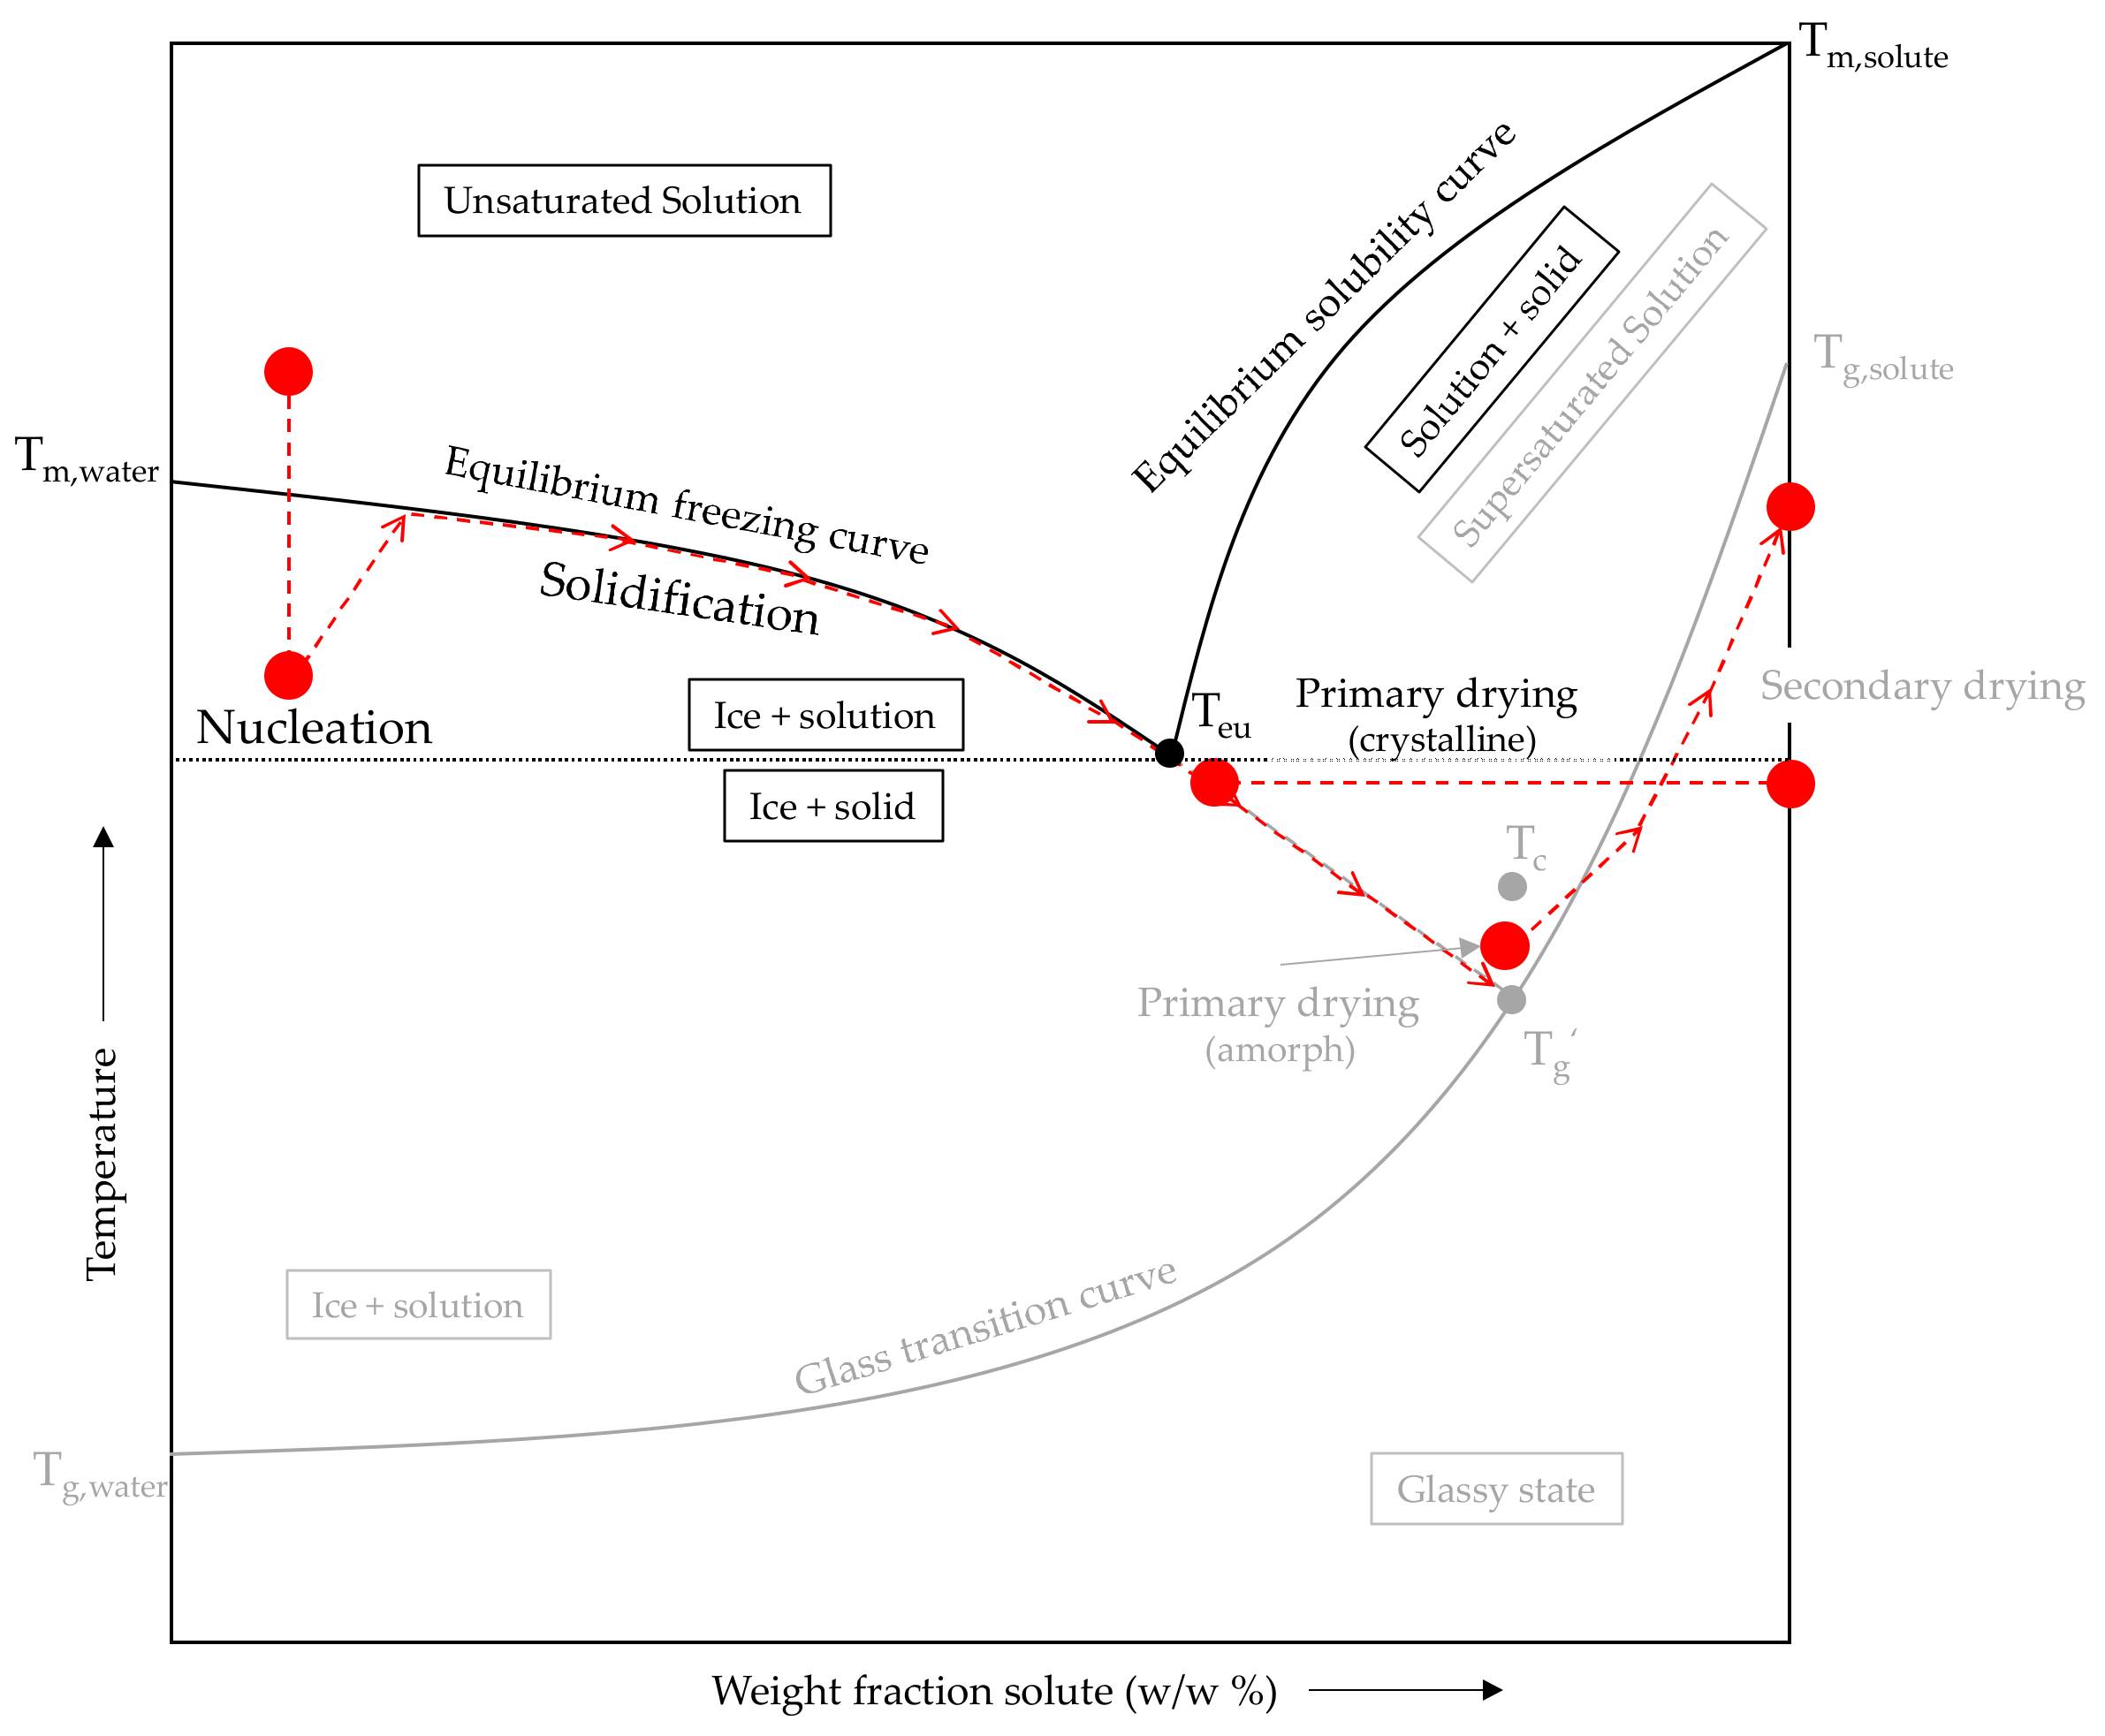
2. Freezing Fundamentals
- -
- Cooling—liquid formulation is cooled to freezing temperature;
- -
- Nucleation—the first ice nucleus is formed;
- -
- Solidification—ice crystals grow until no water is available.
2.1. Cooling
2.2. Nucleation
- -
- Needle-like crystals: random arrangement of water molecules around ice nuclei with a high degree of supercooling;
- -
- Regular hexagonal crystals (dendrites): ordered arrangement of water molecules around ice nucleus with low degree of supercooling;
- -
- Ice spears (spherulites): spherulites form from the center of crystallization with high cooling rates.
2.3. Solidifaction
3. Freezing Methods and Effects on Process Performance
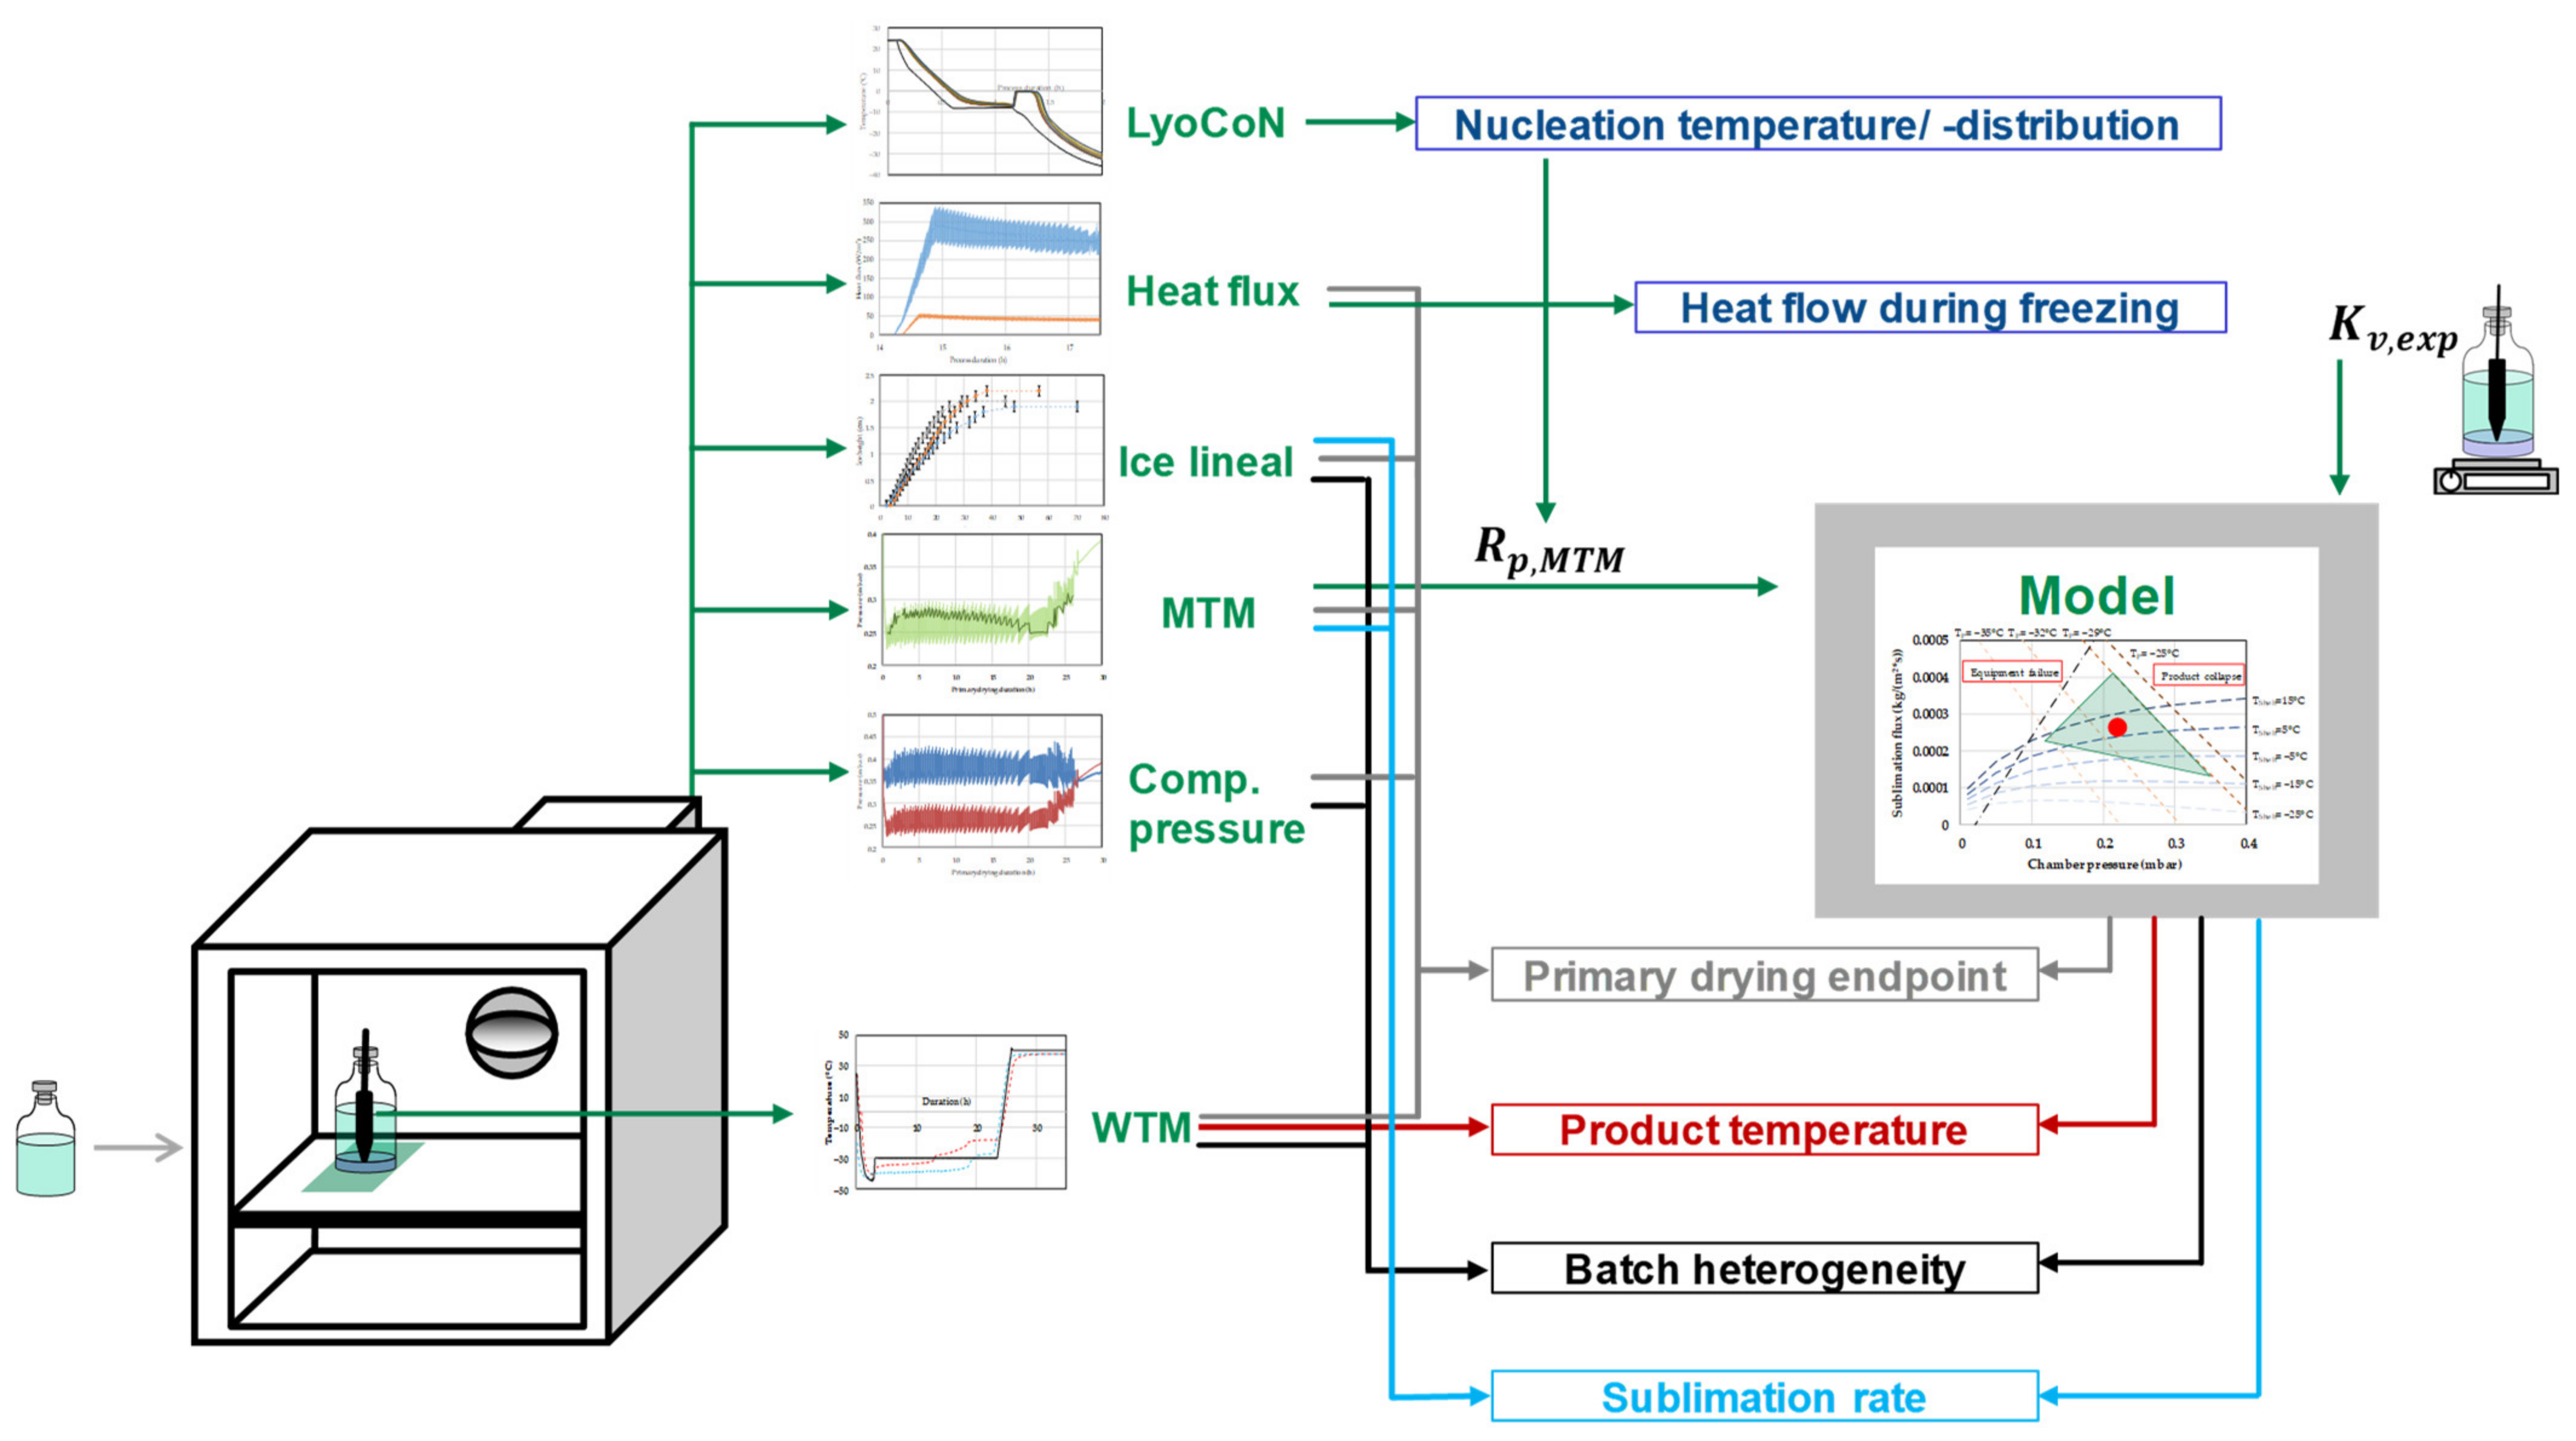
4. Materials and Methods
4.1. Product Mixture and Instruments
4.2. Experimental Runs
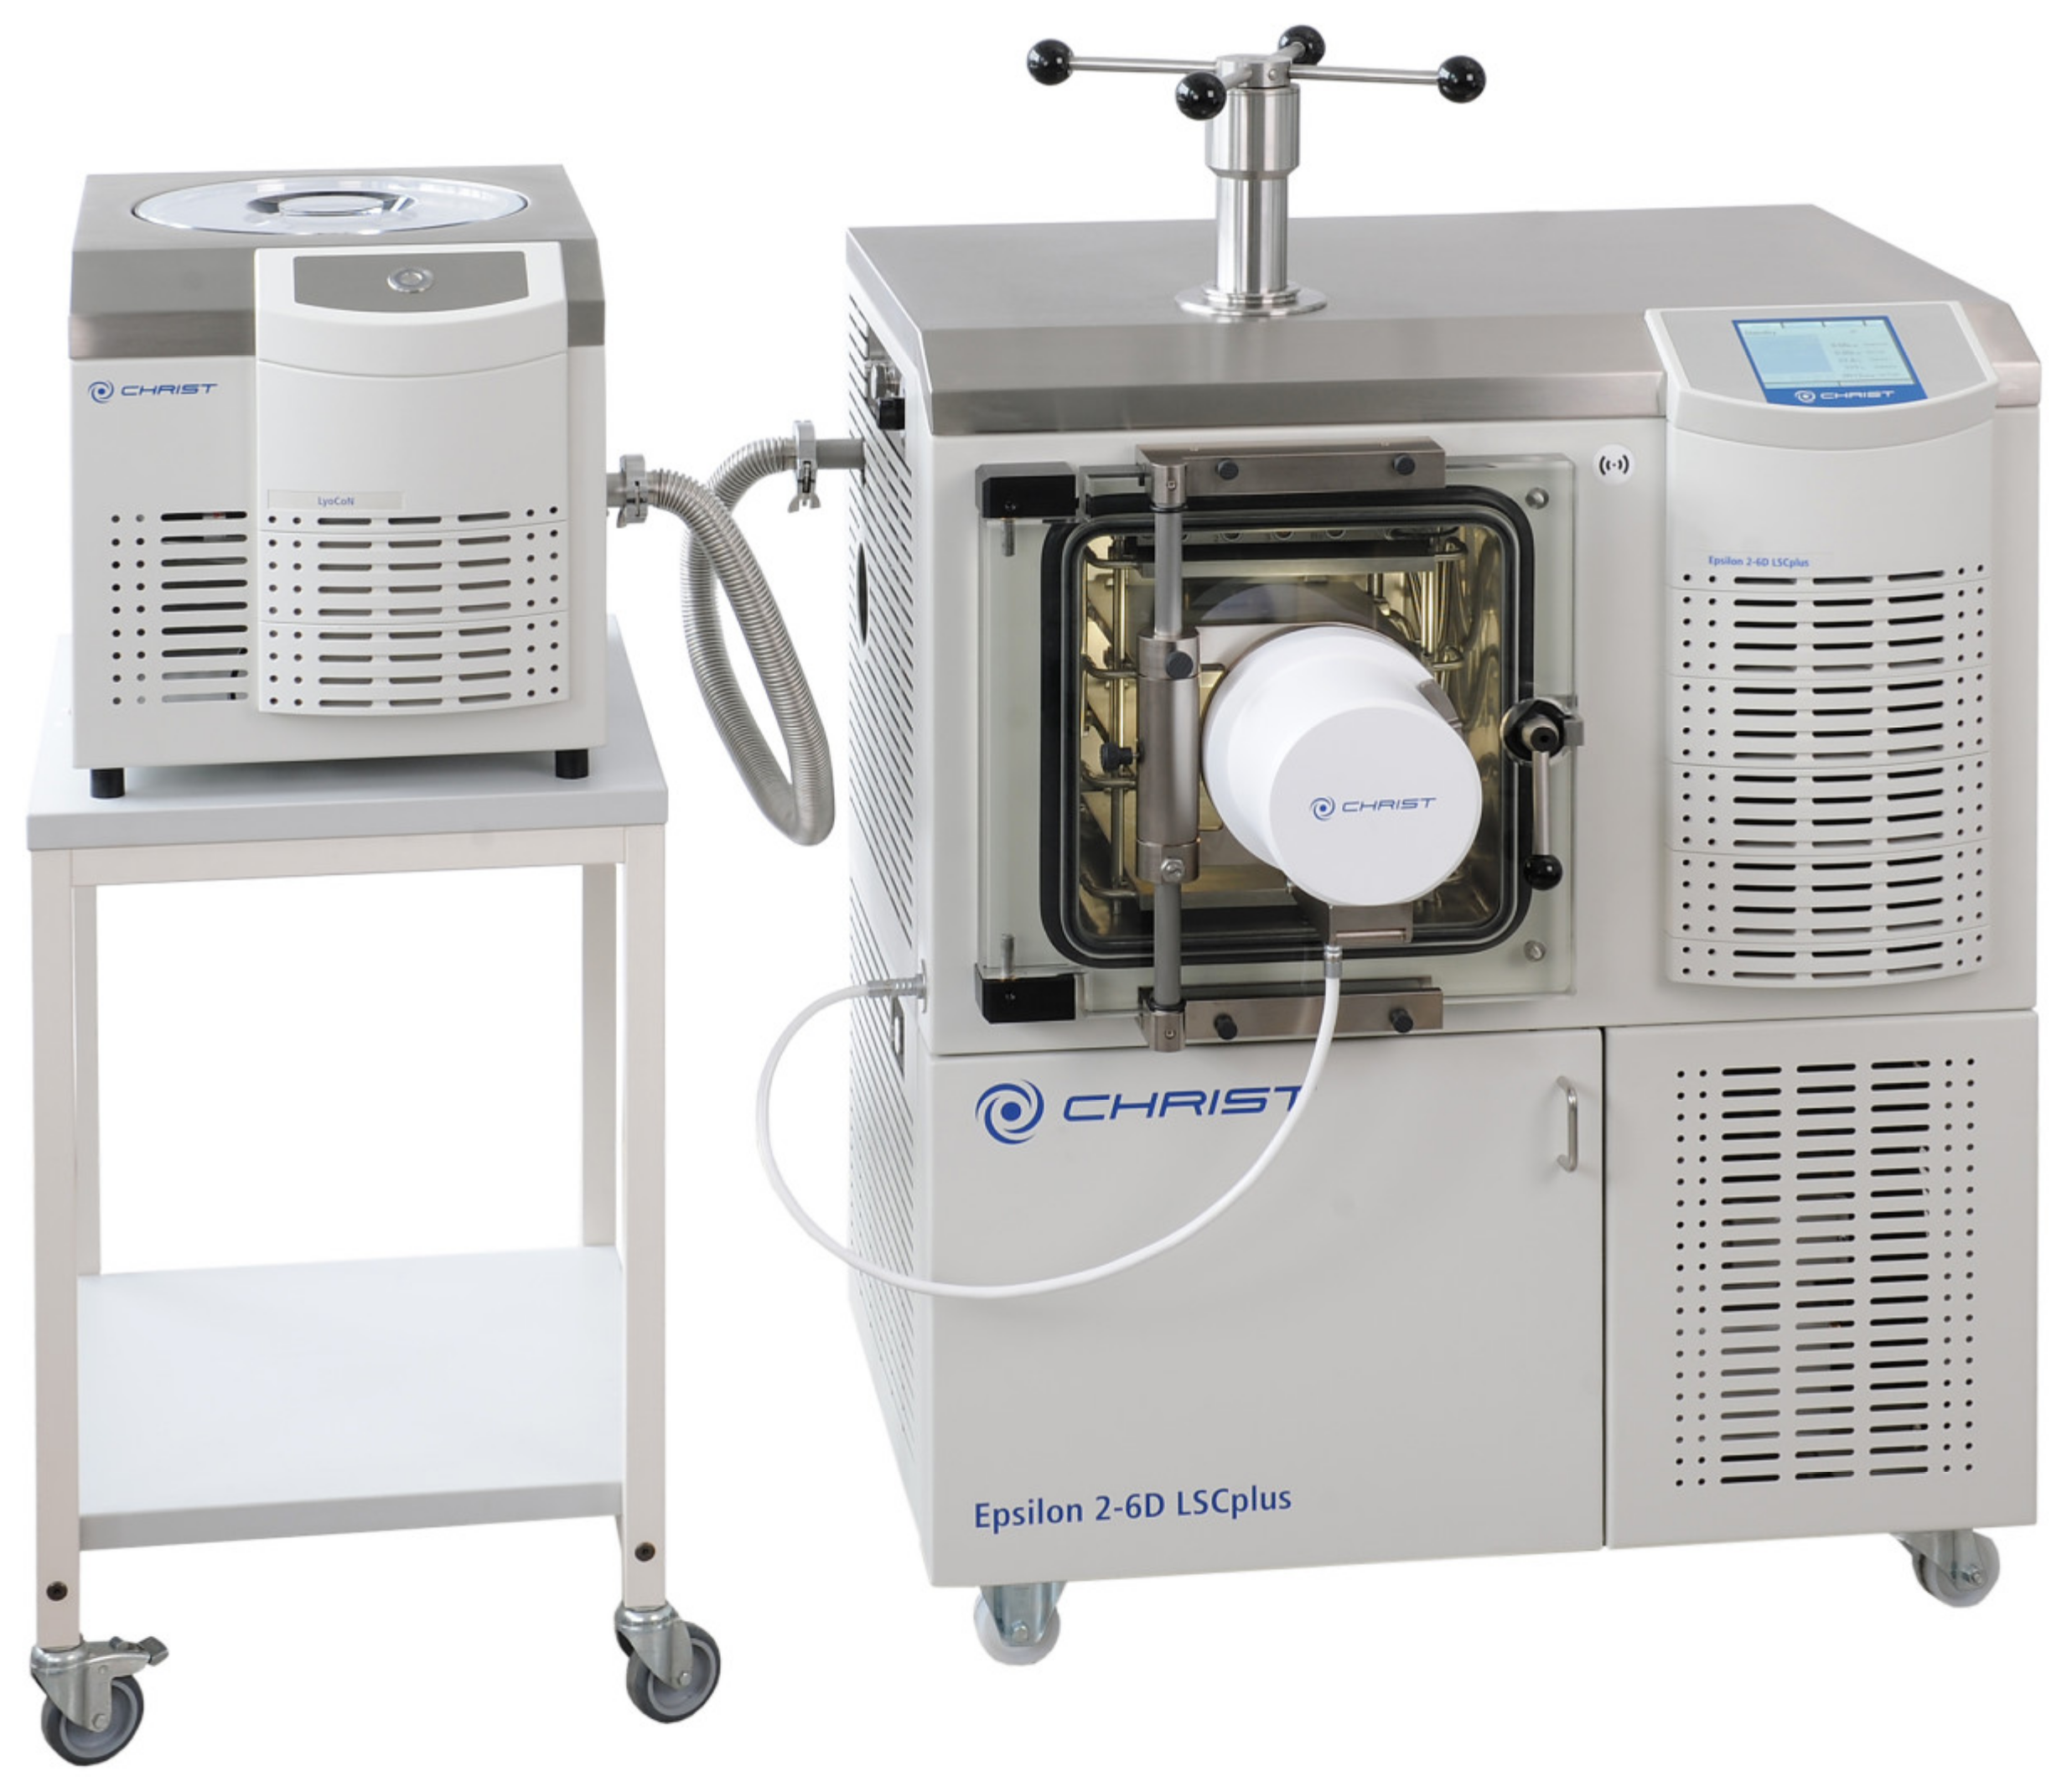
4.3. Freeze-Drying Equipment
4.4. Dry Layer Resistance
4.5. Heat Flux Measurement
4.6. Modeling
4.7. Software
5. Results
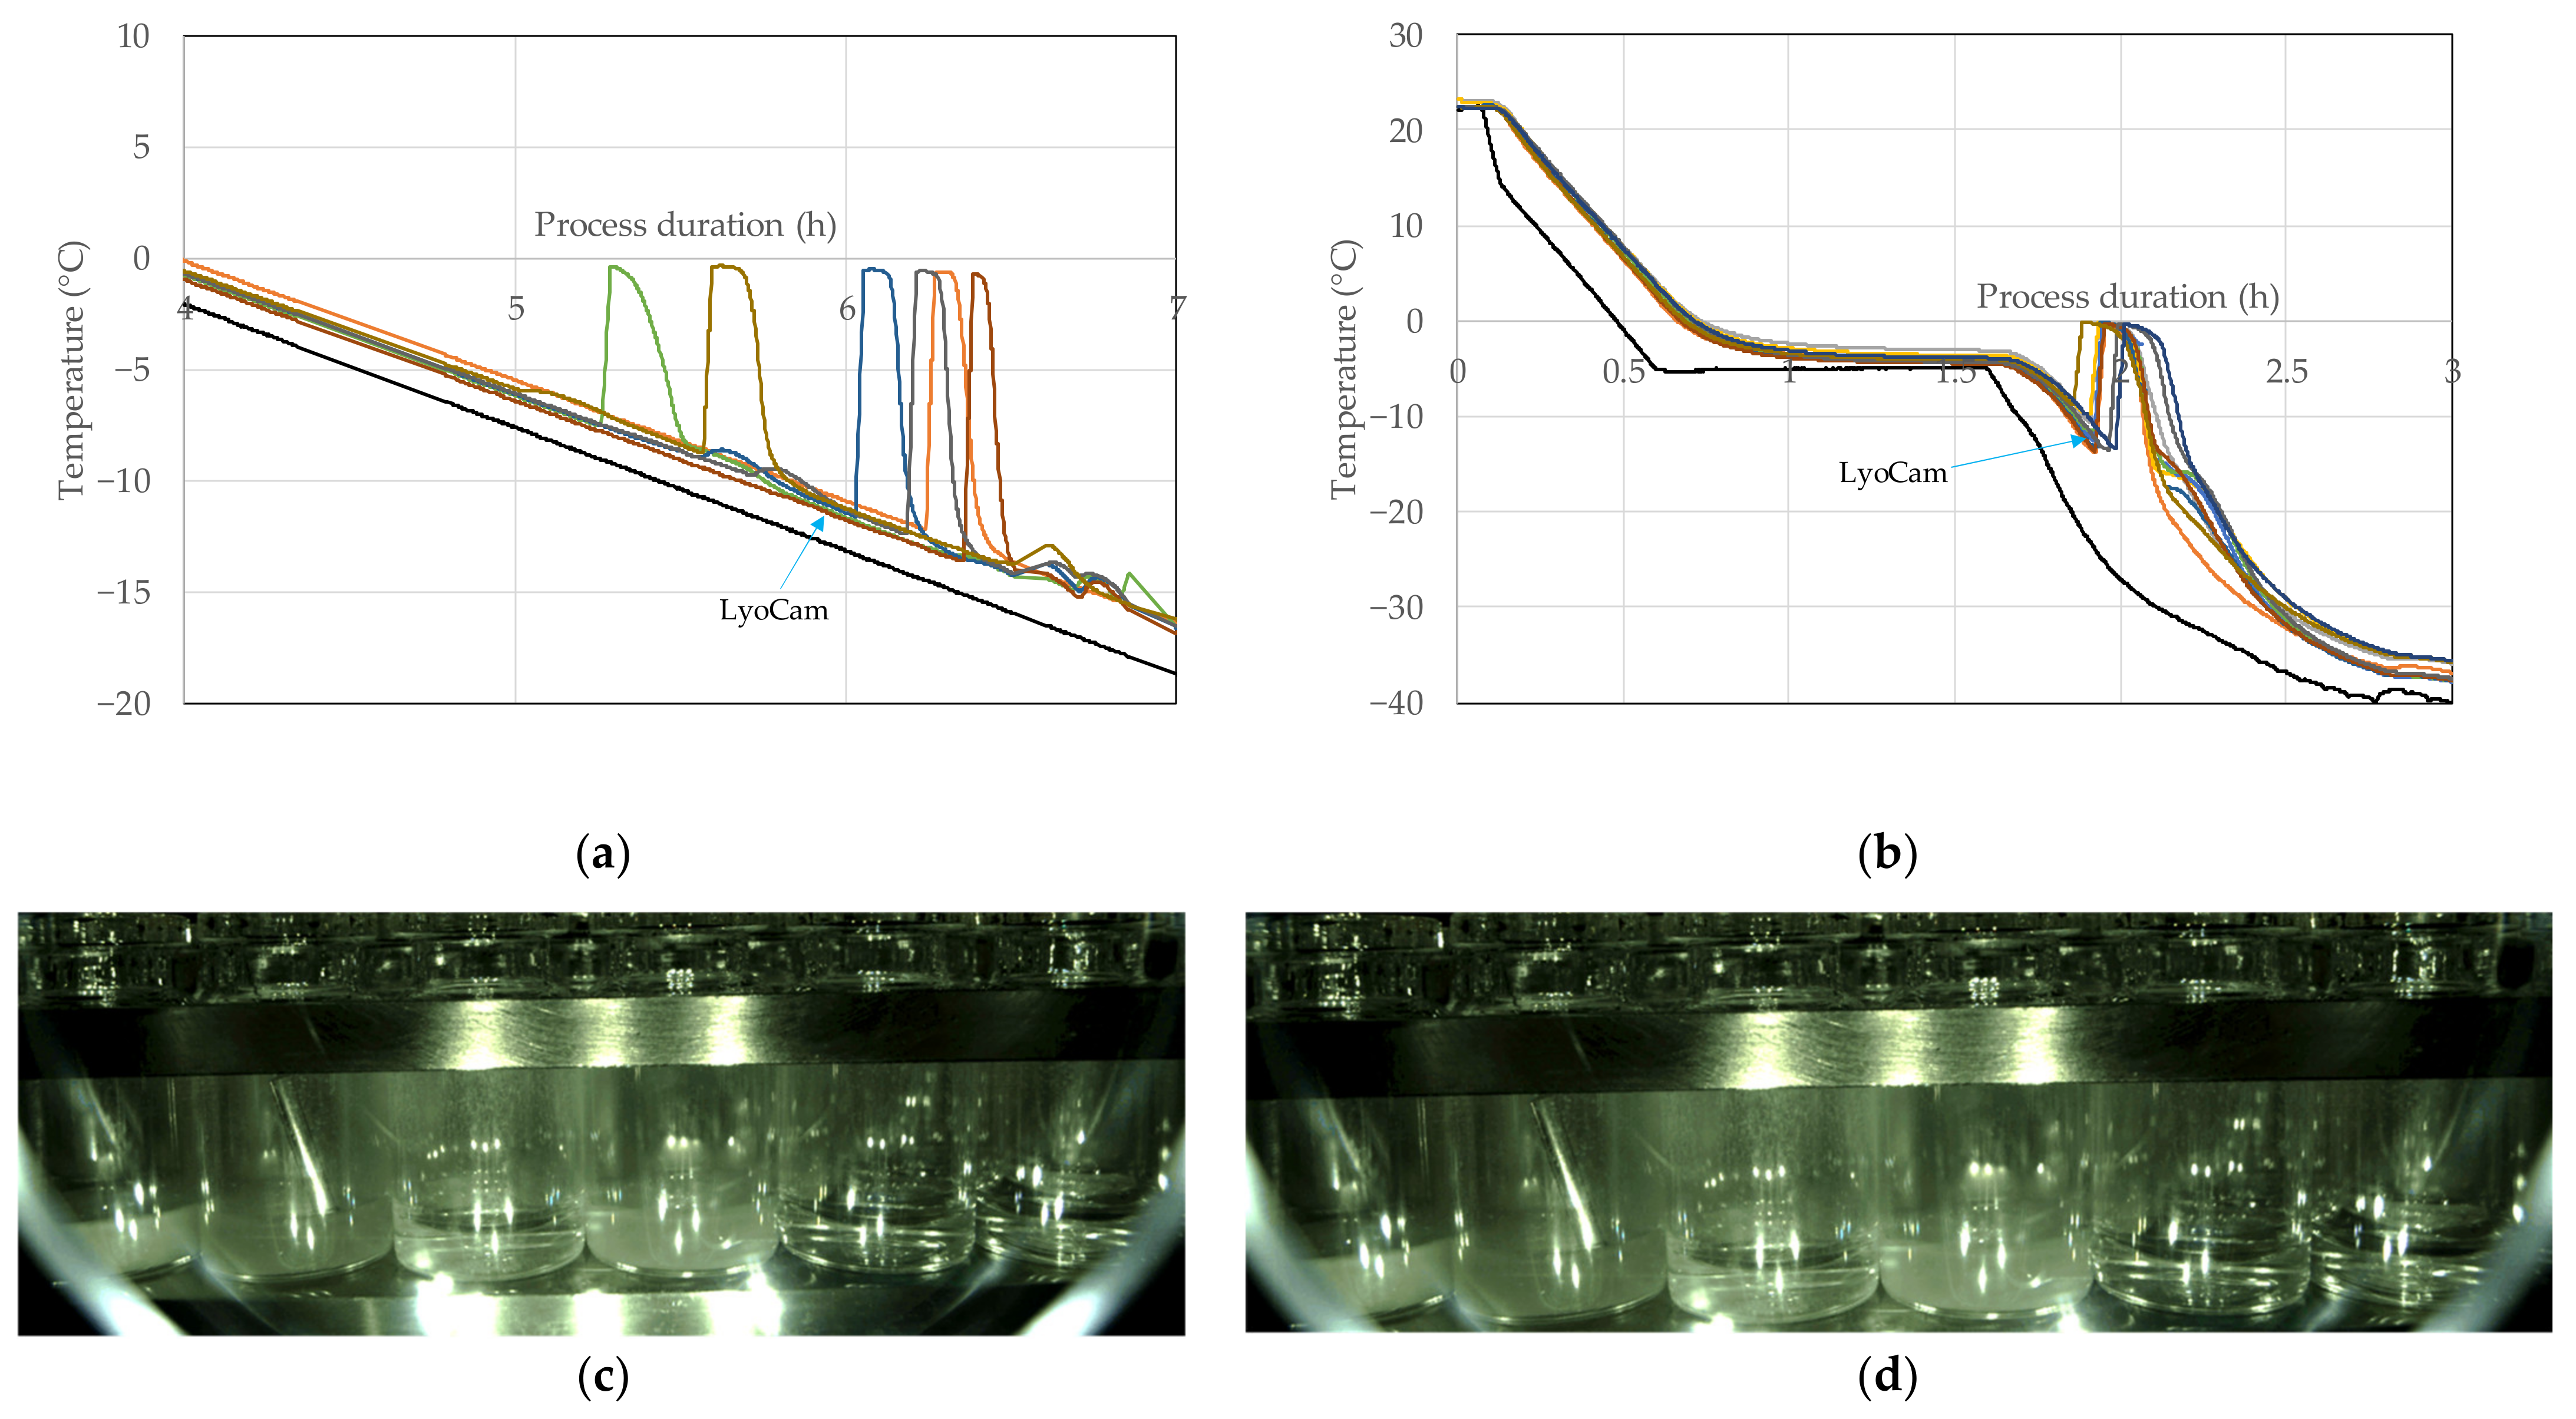
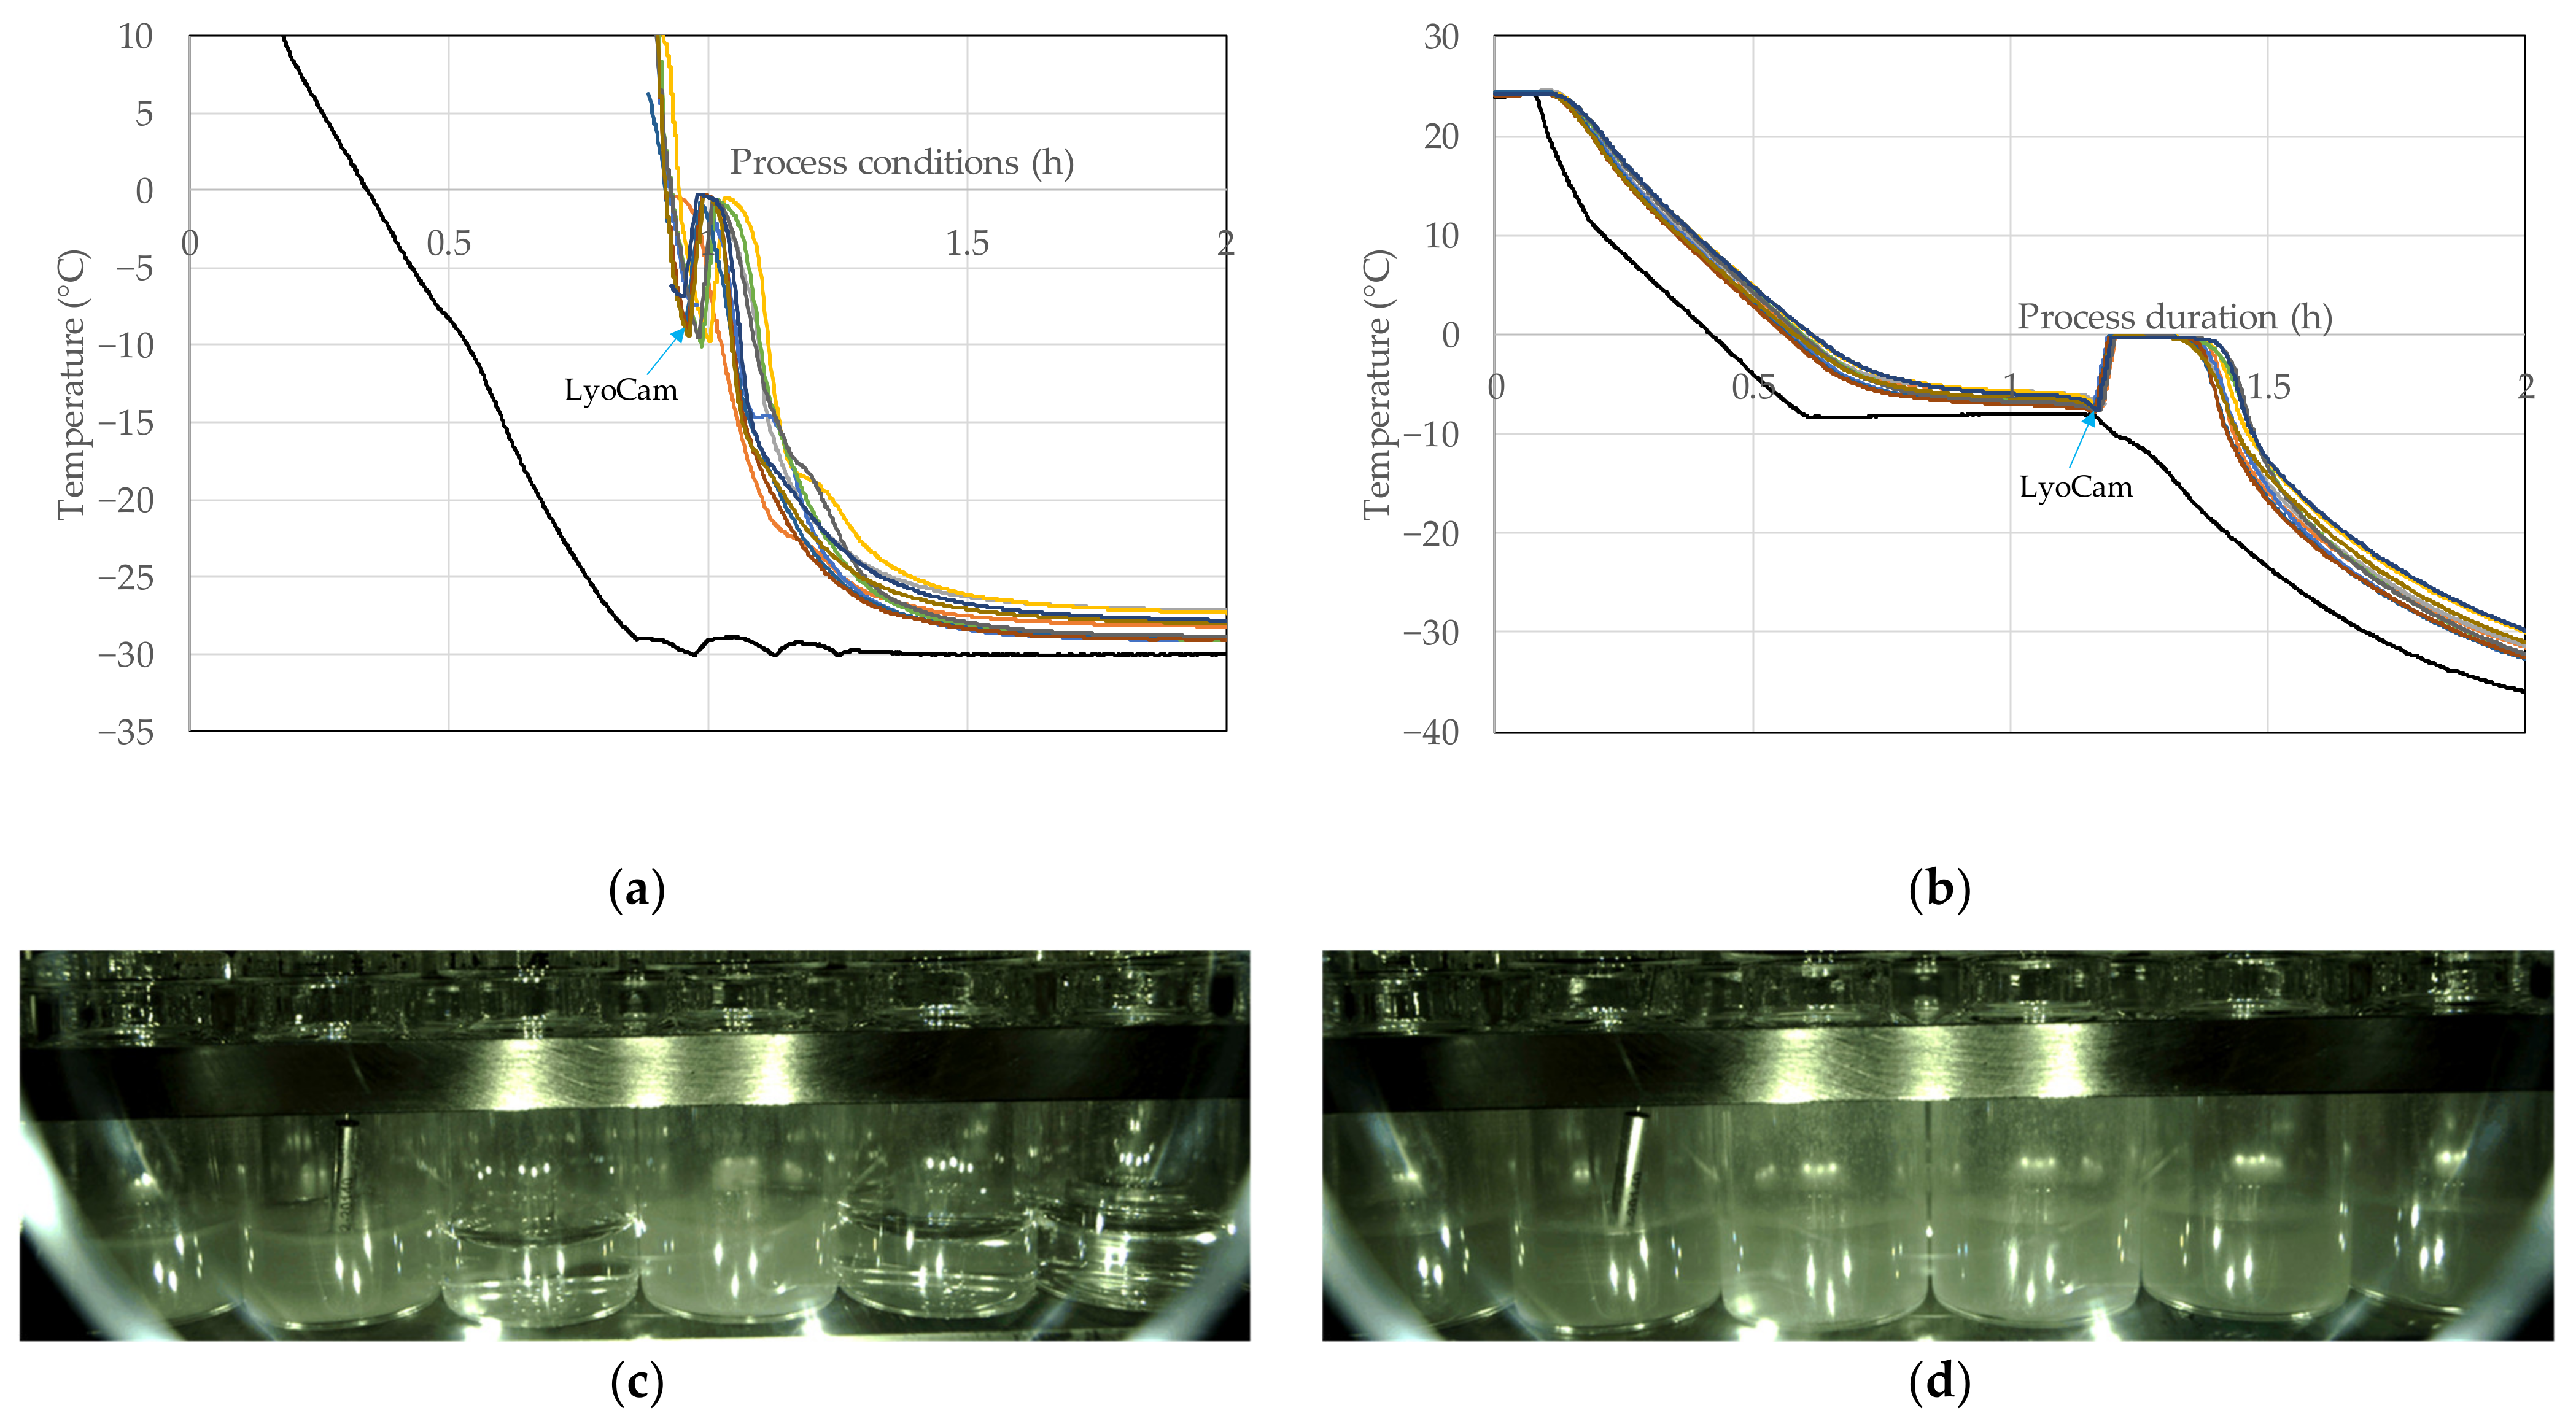
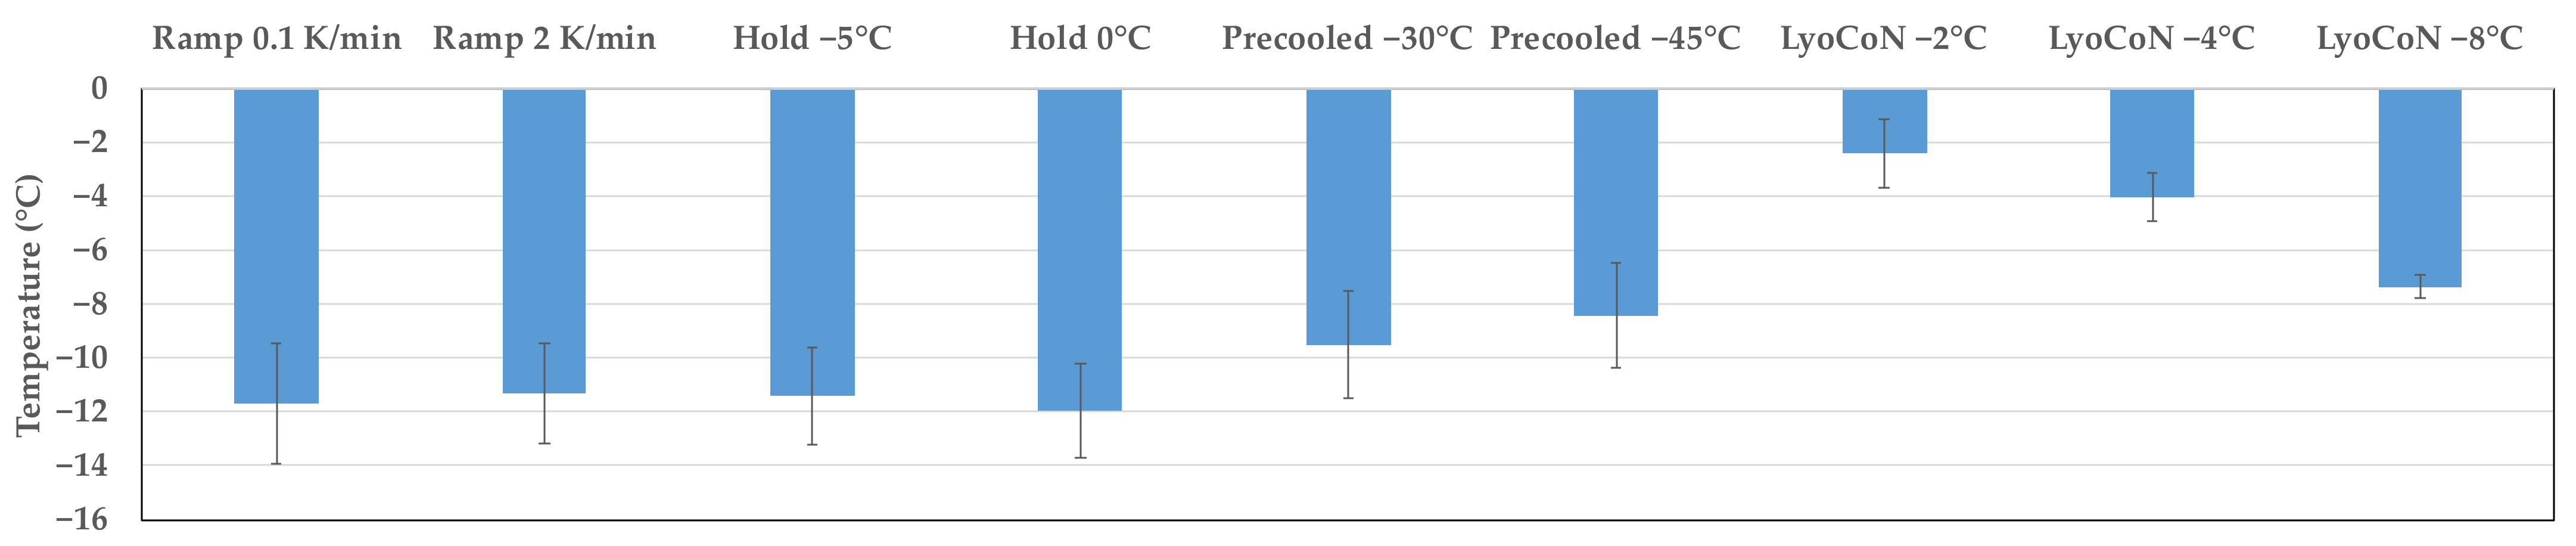
5.1. Nucleation Temperature
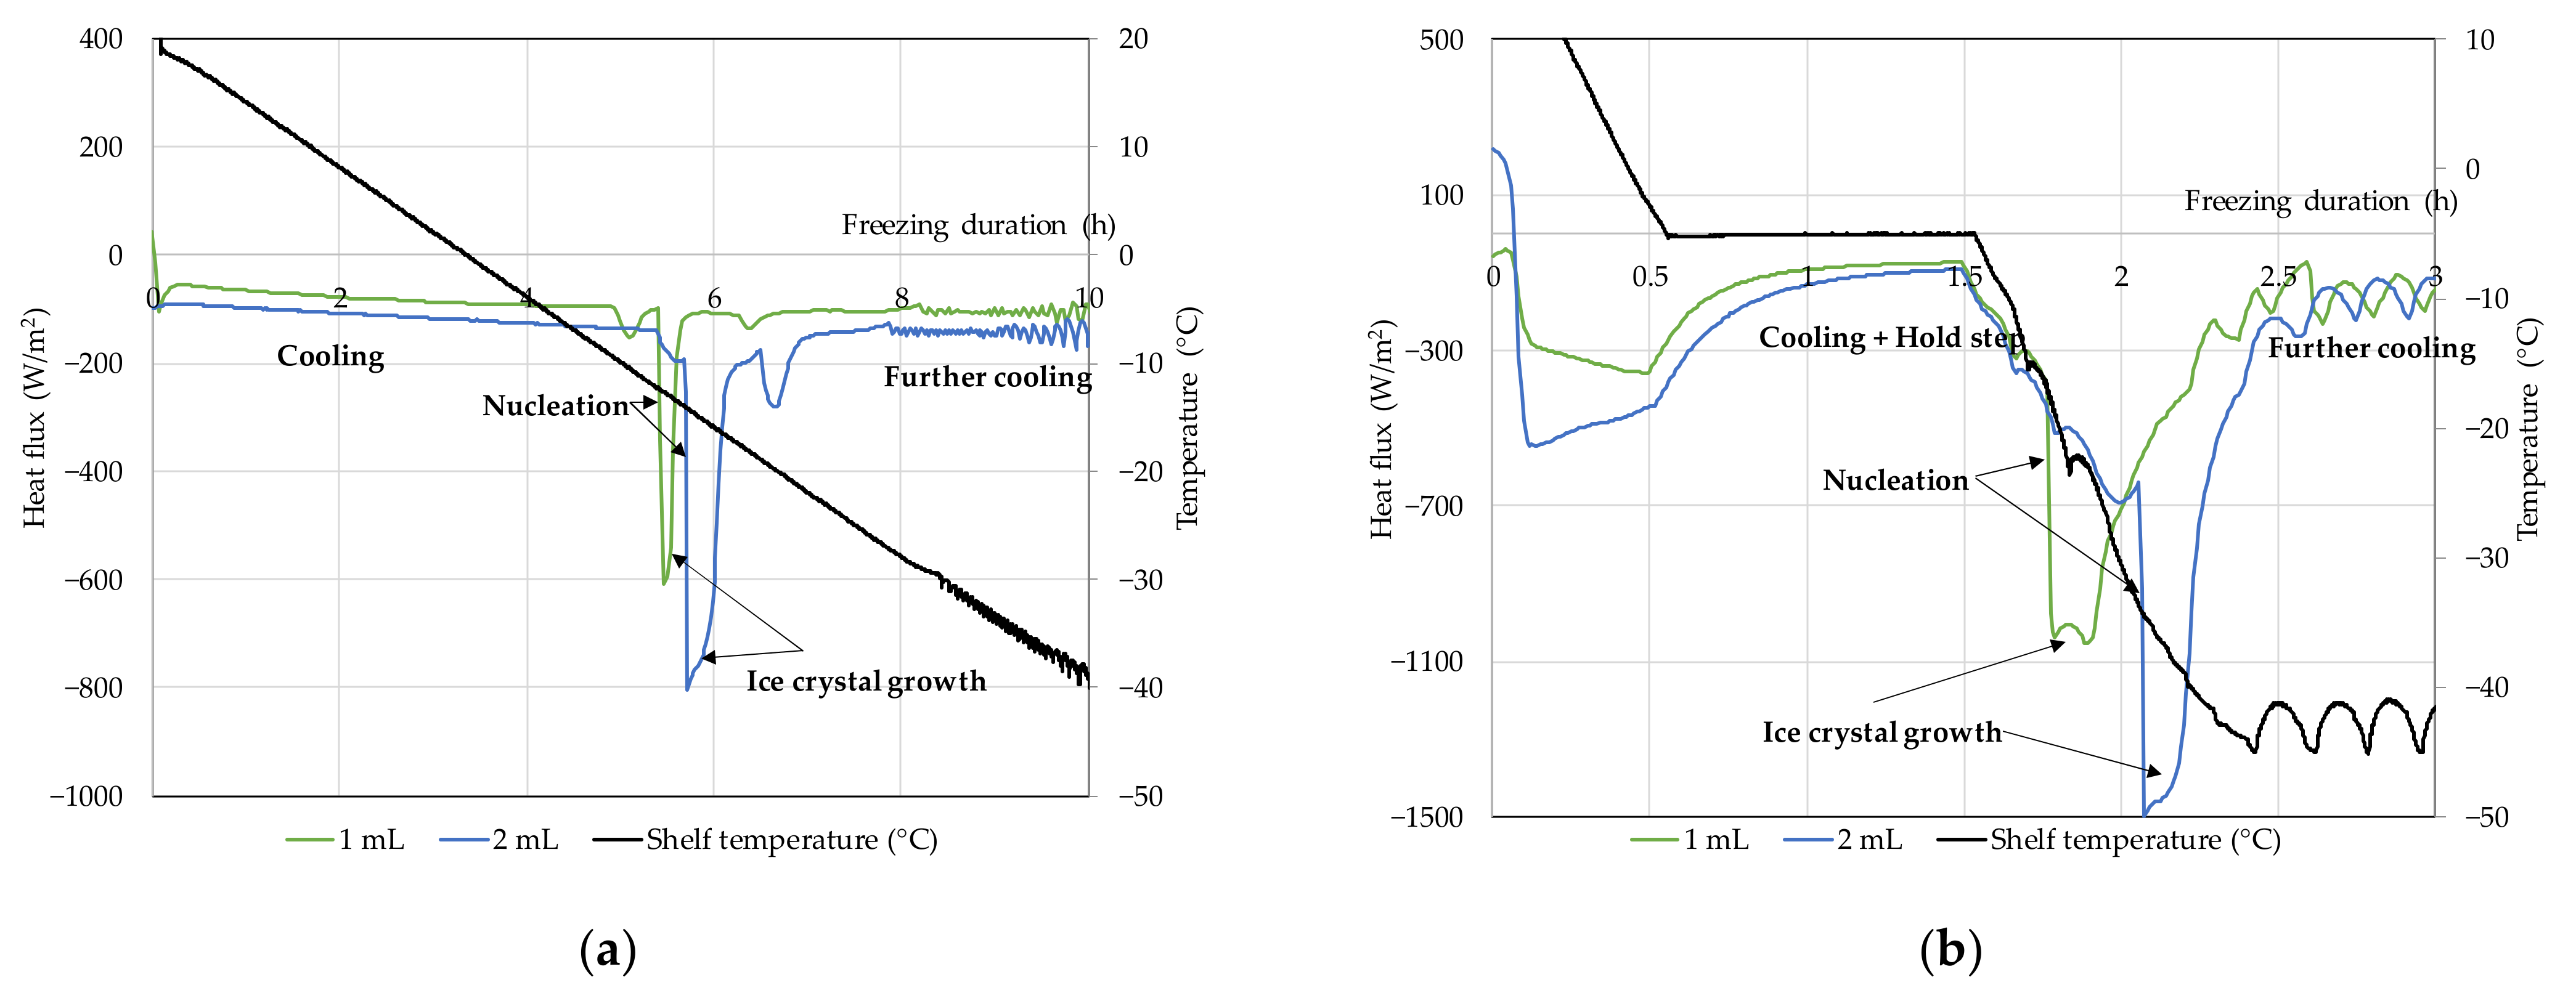
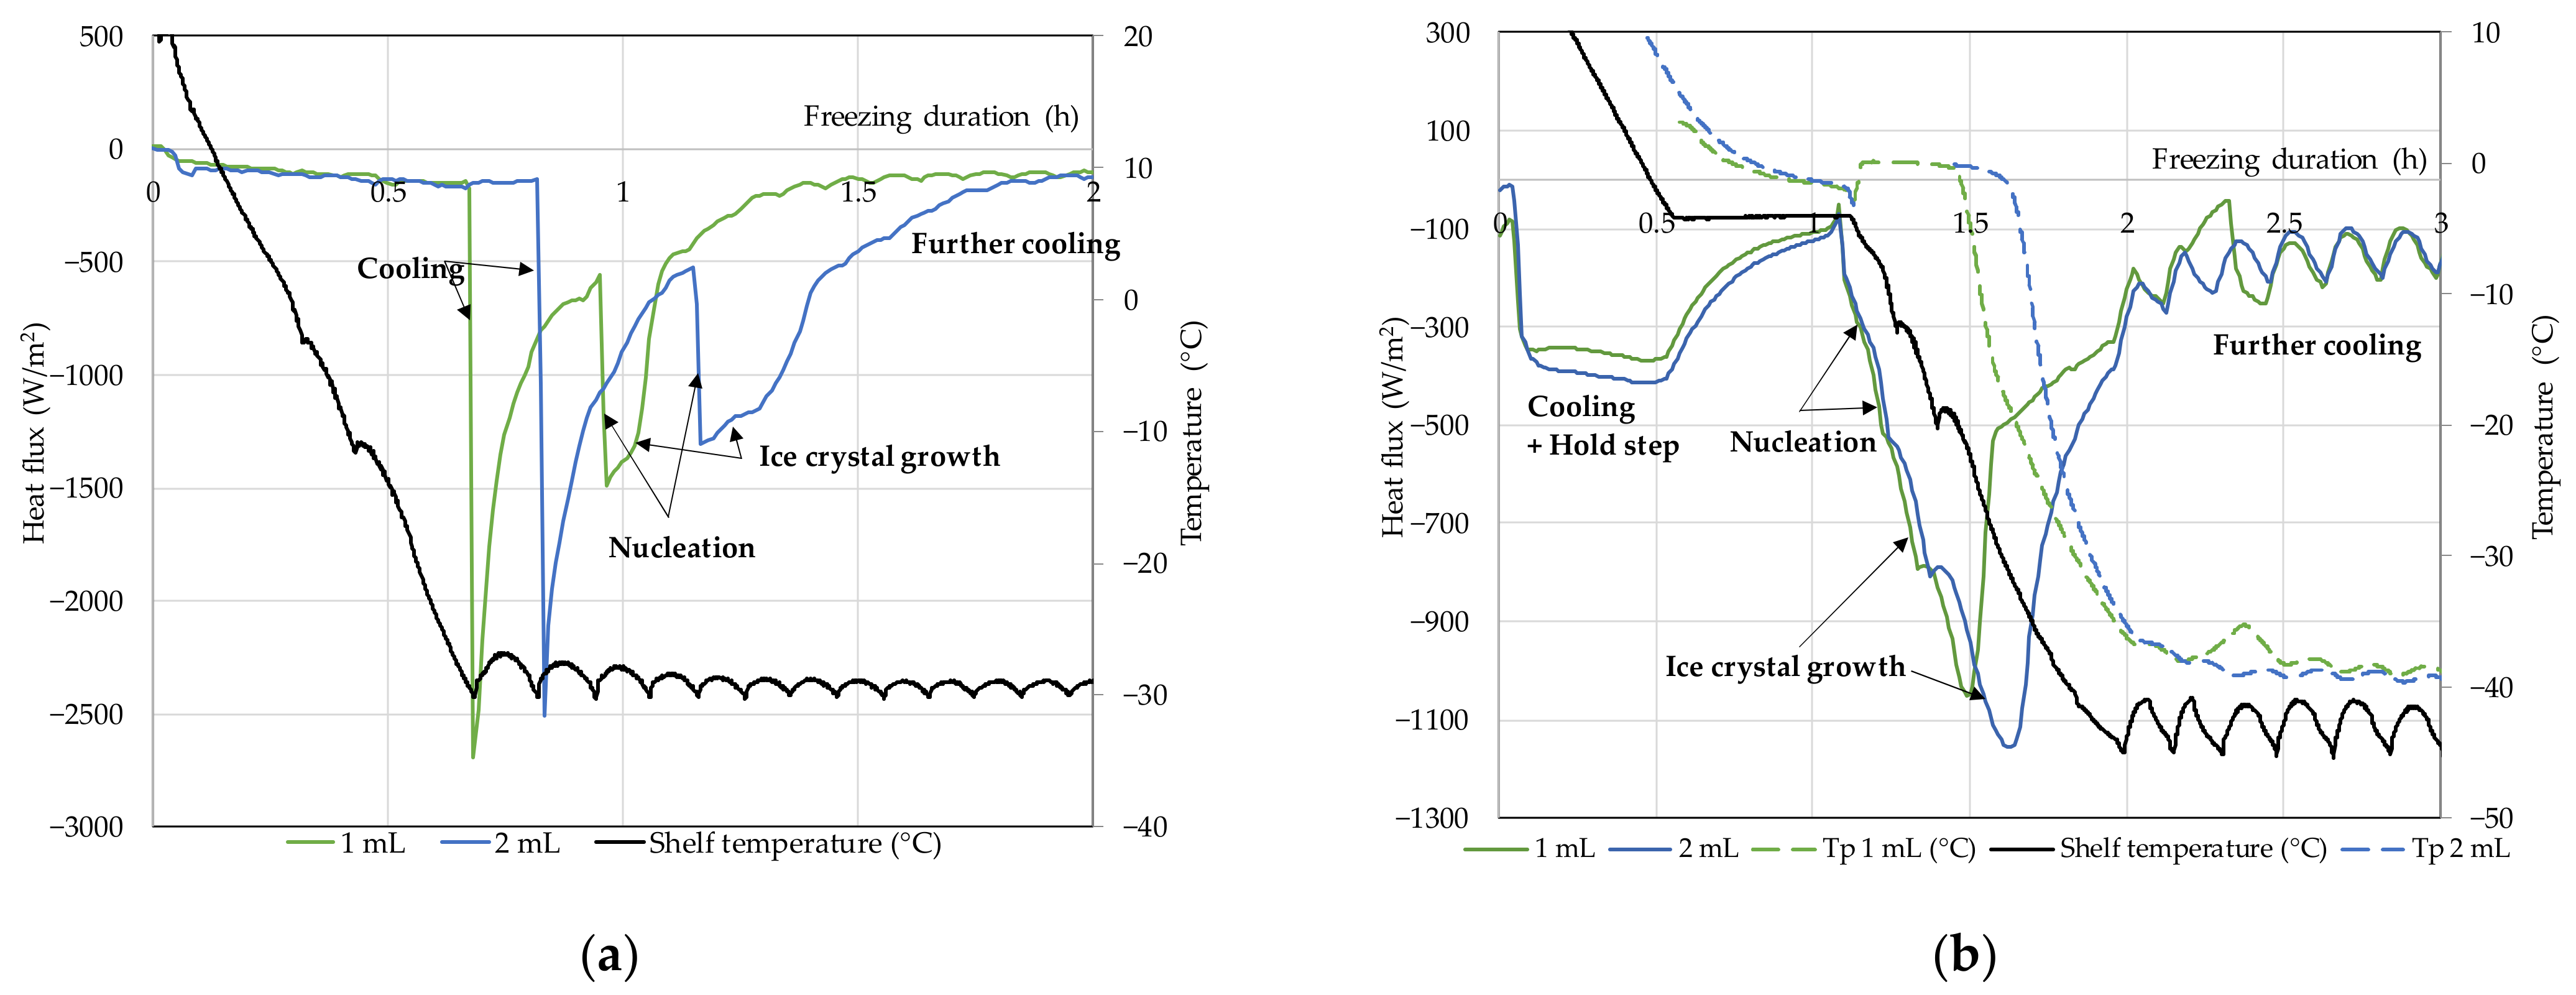
5.2. Heat Flux
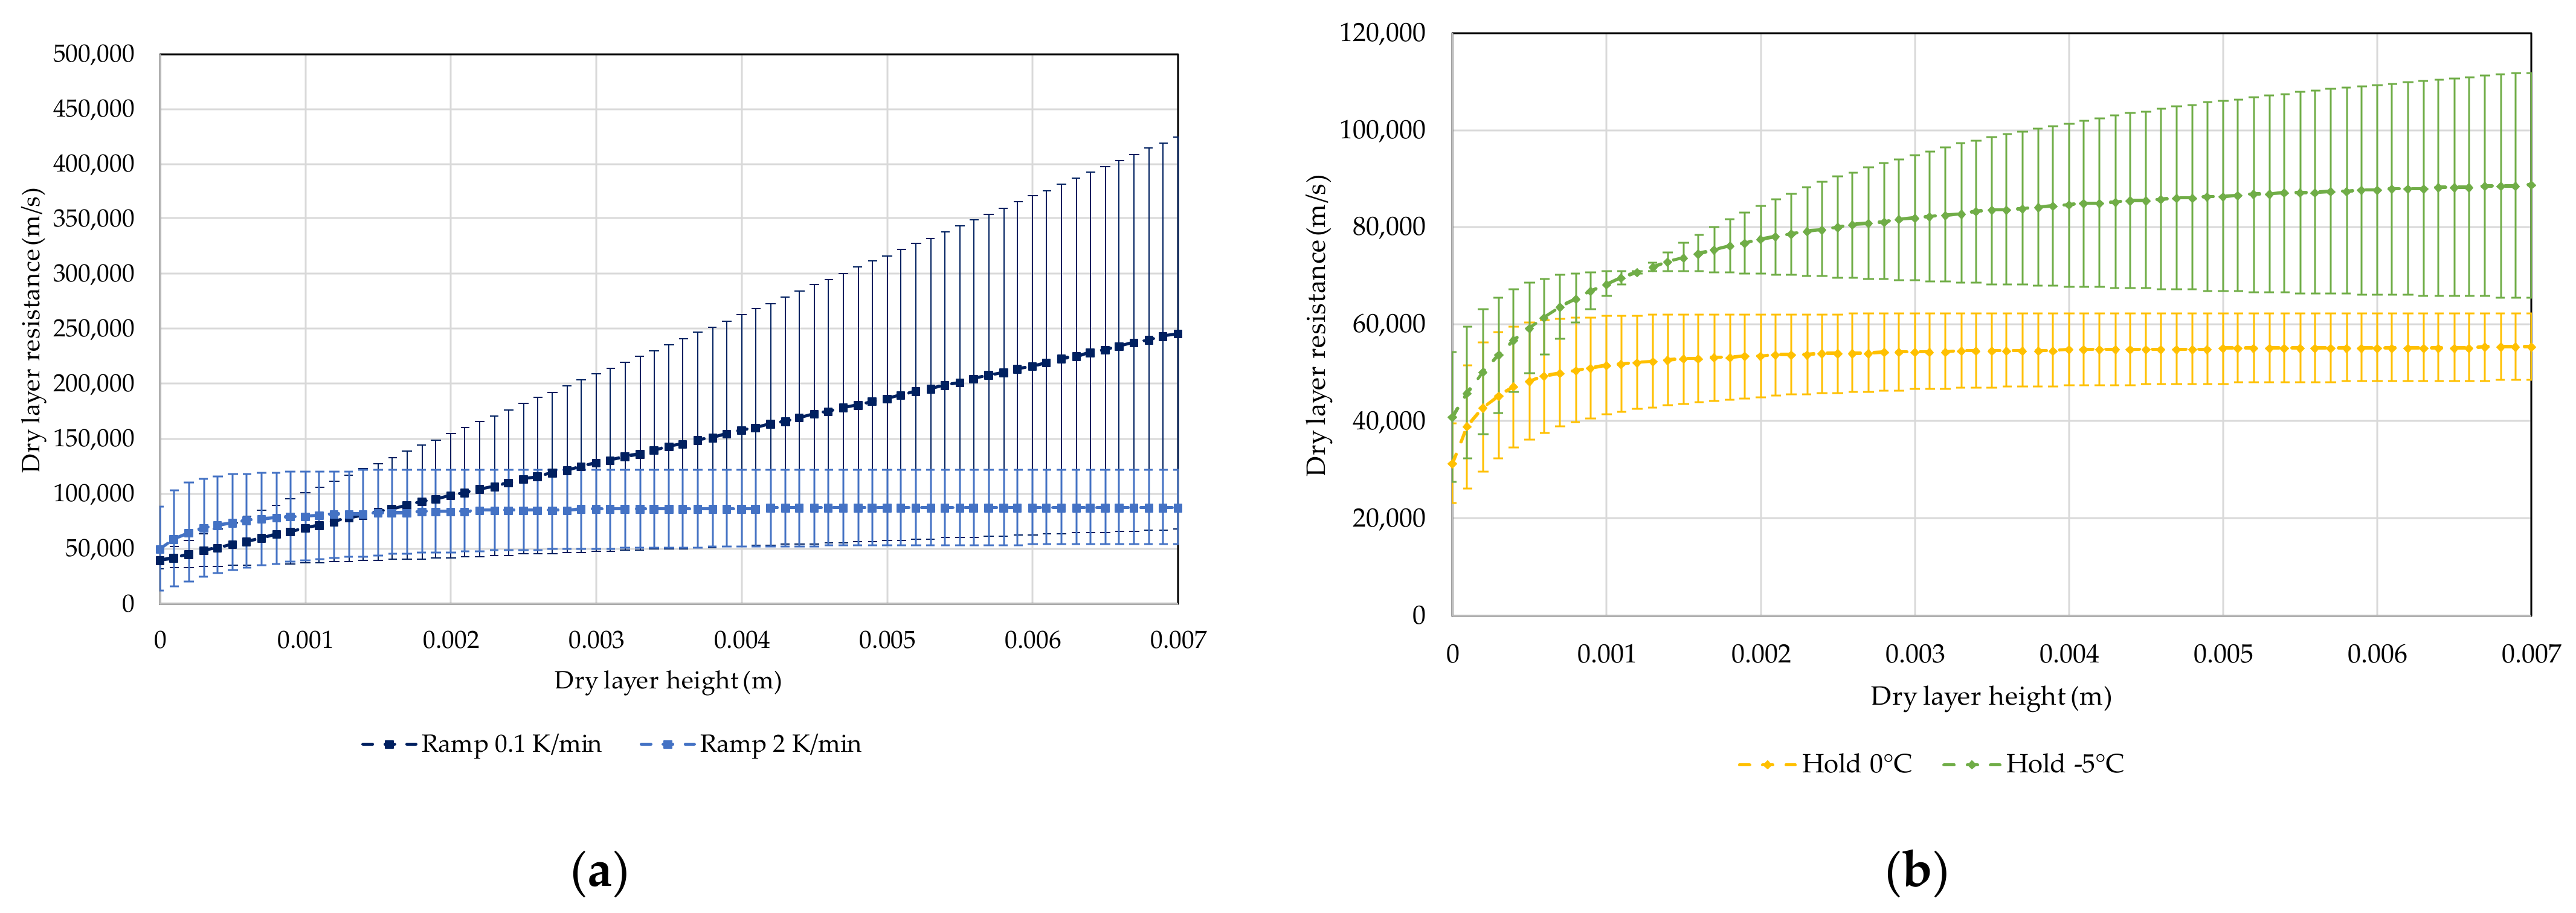
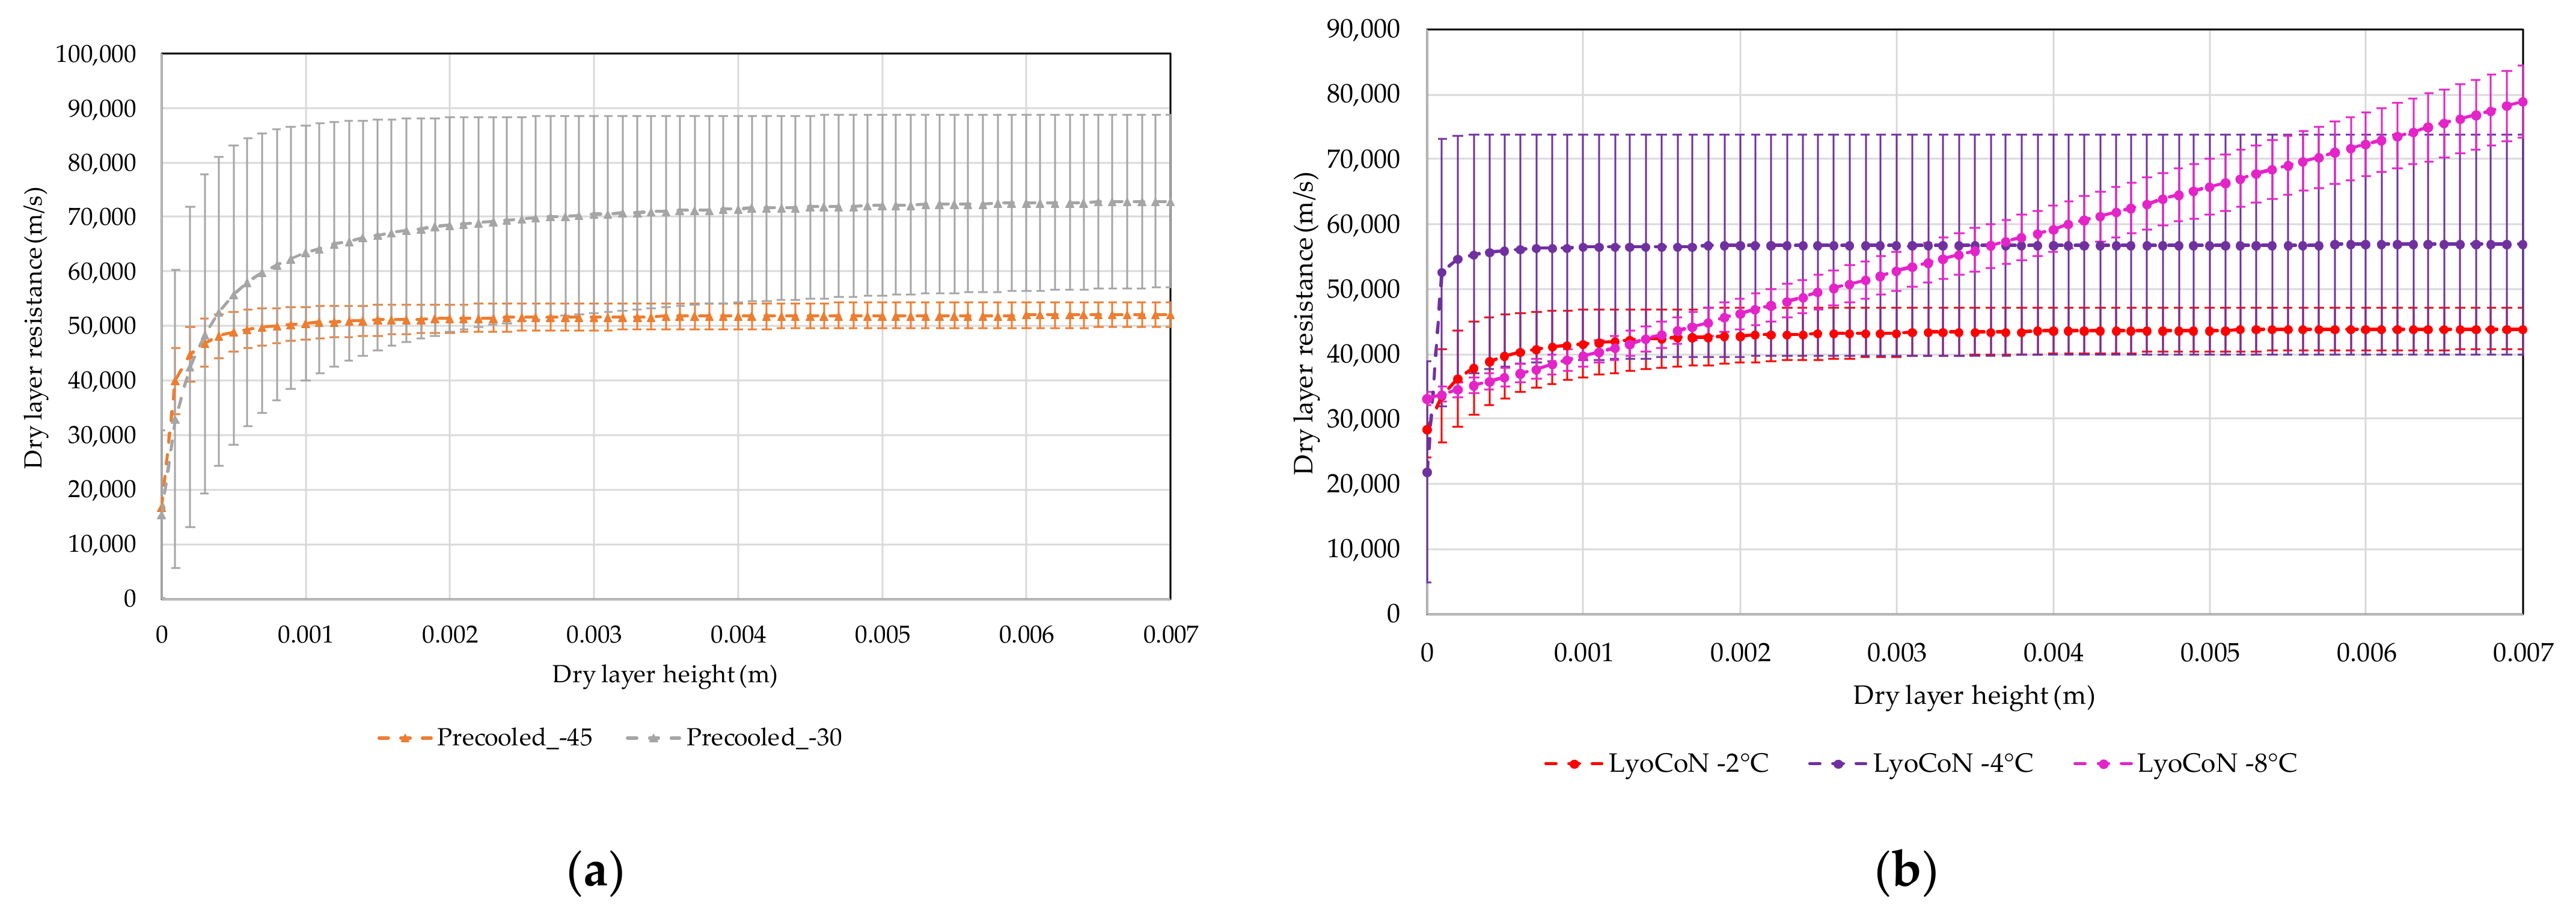
5.3. Dry Layer Resistance
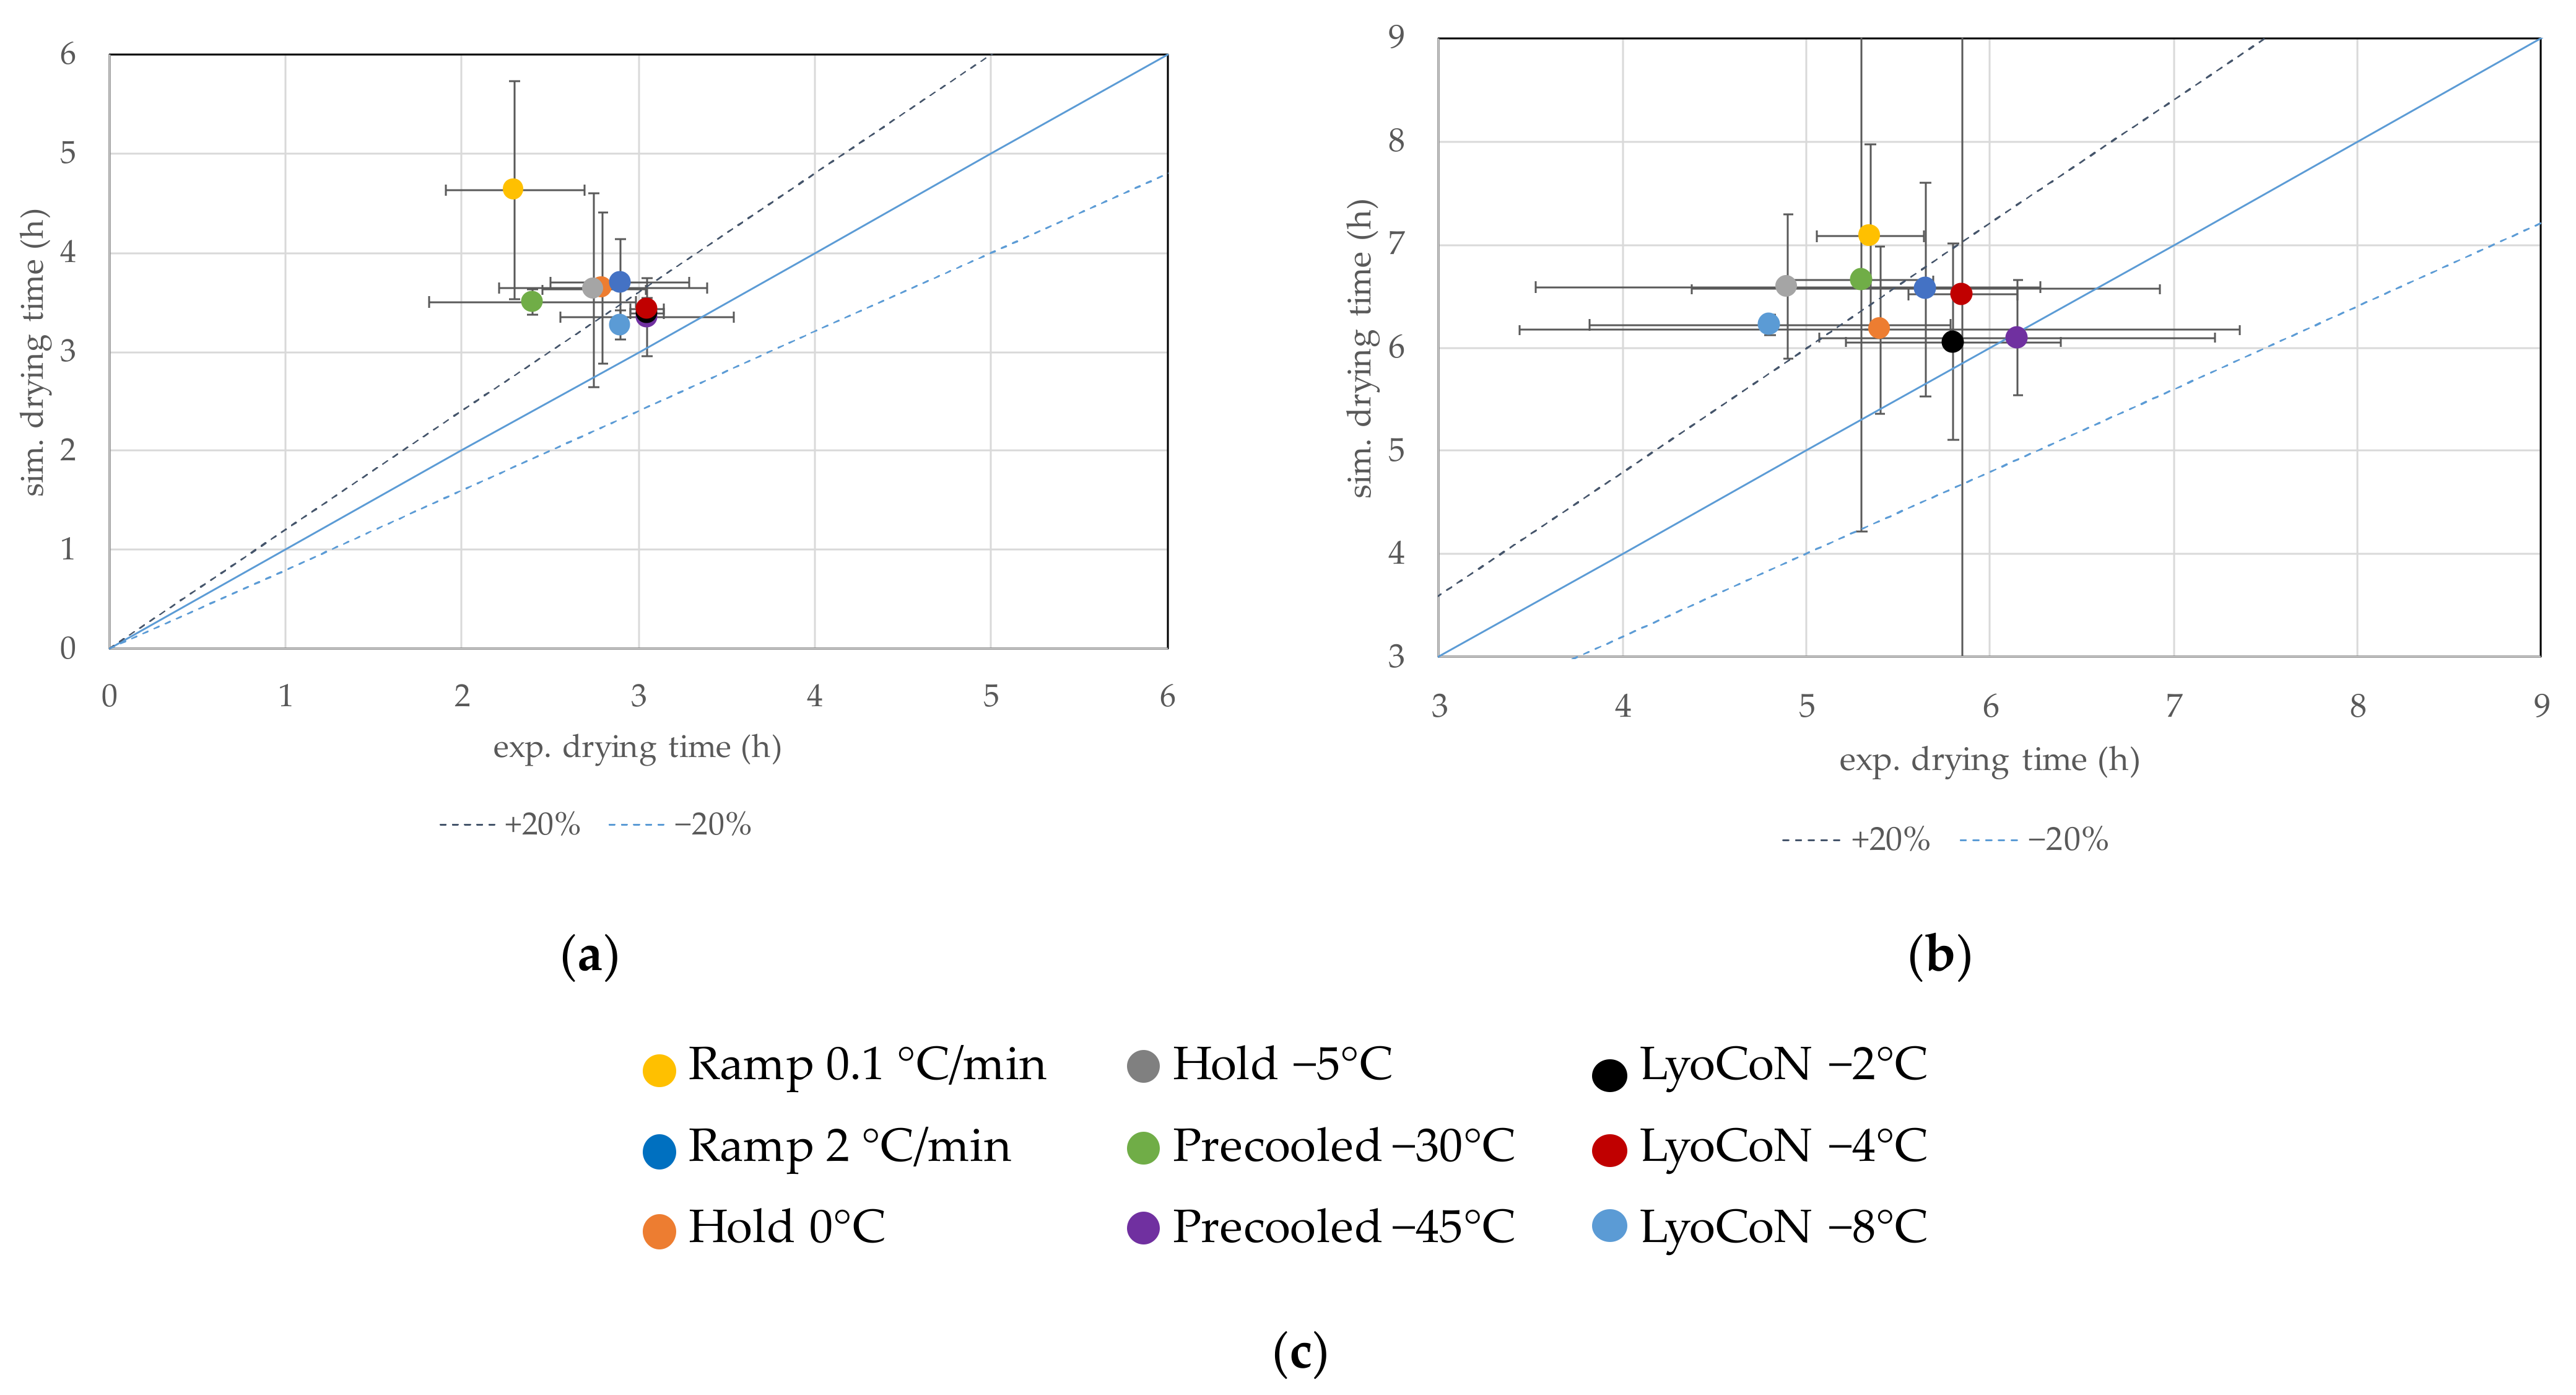
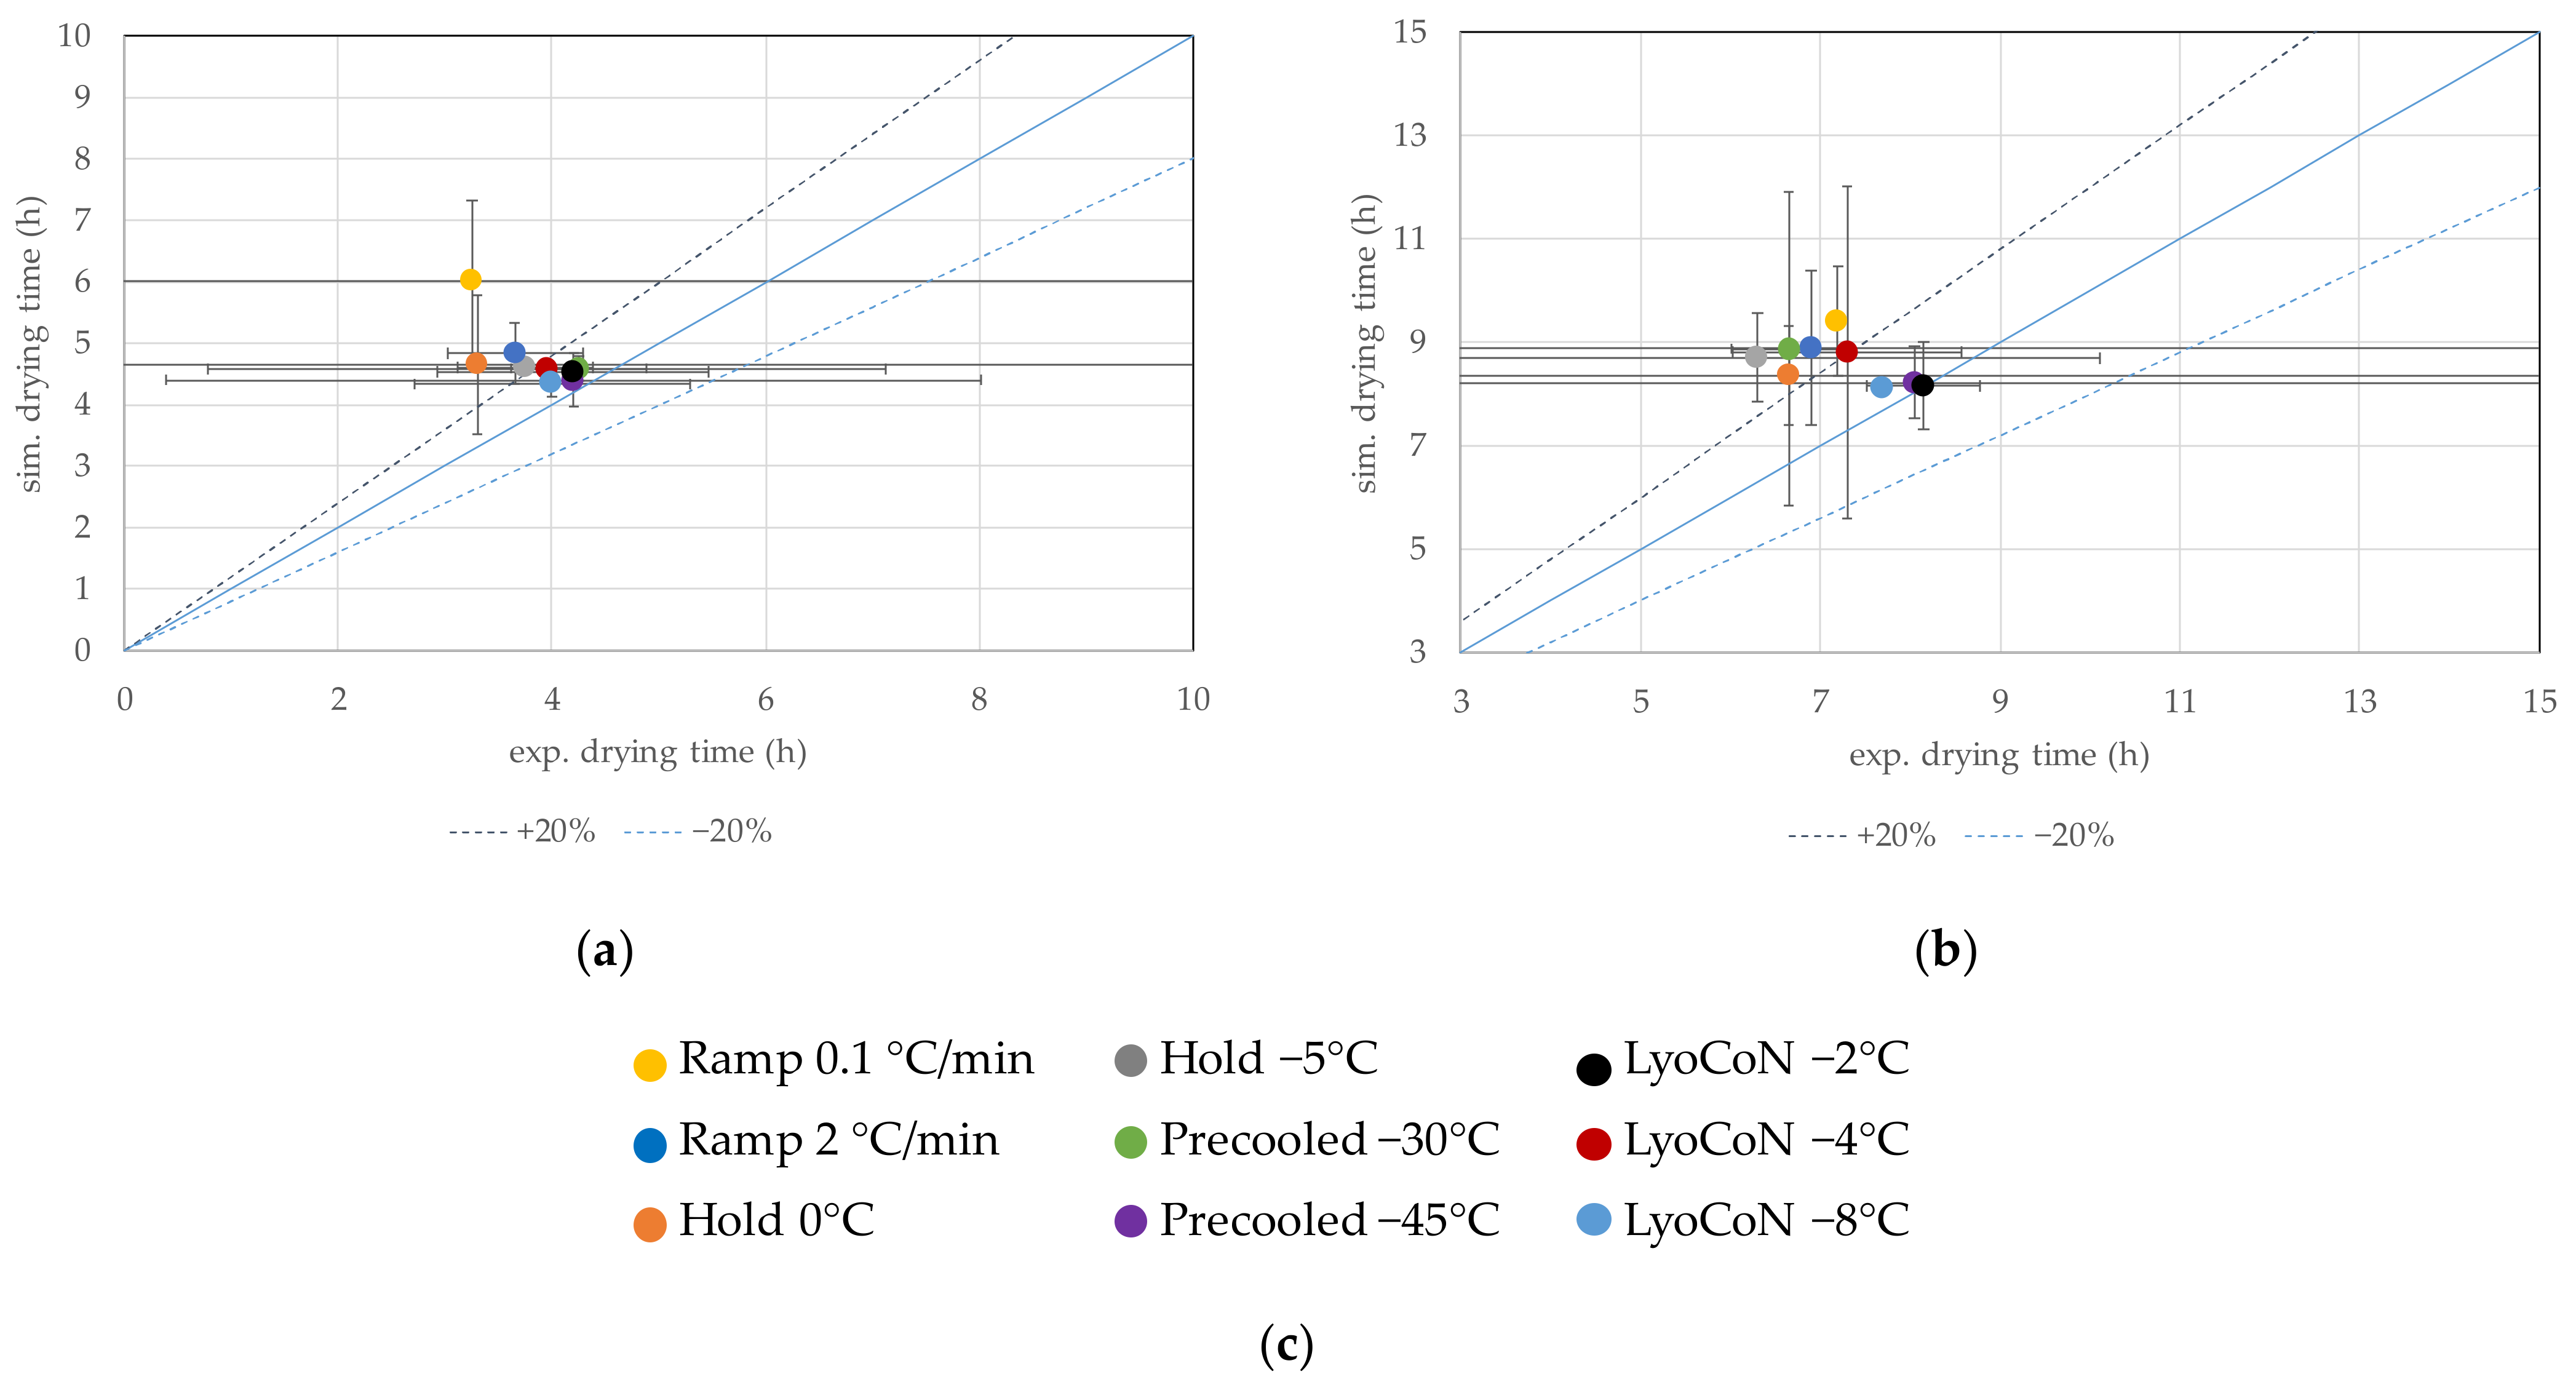
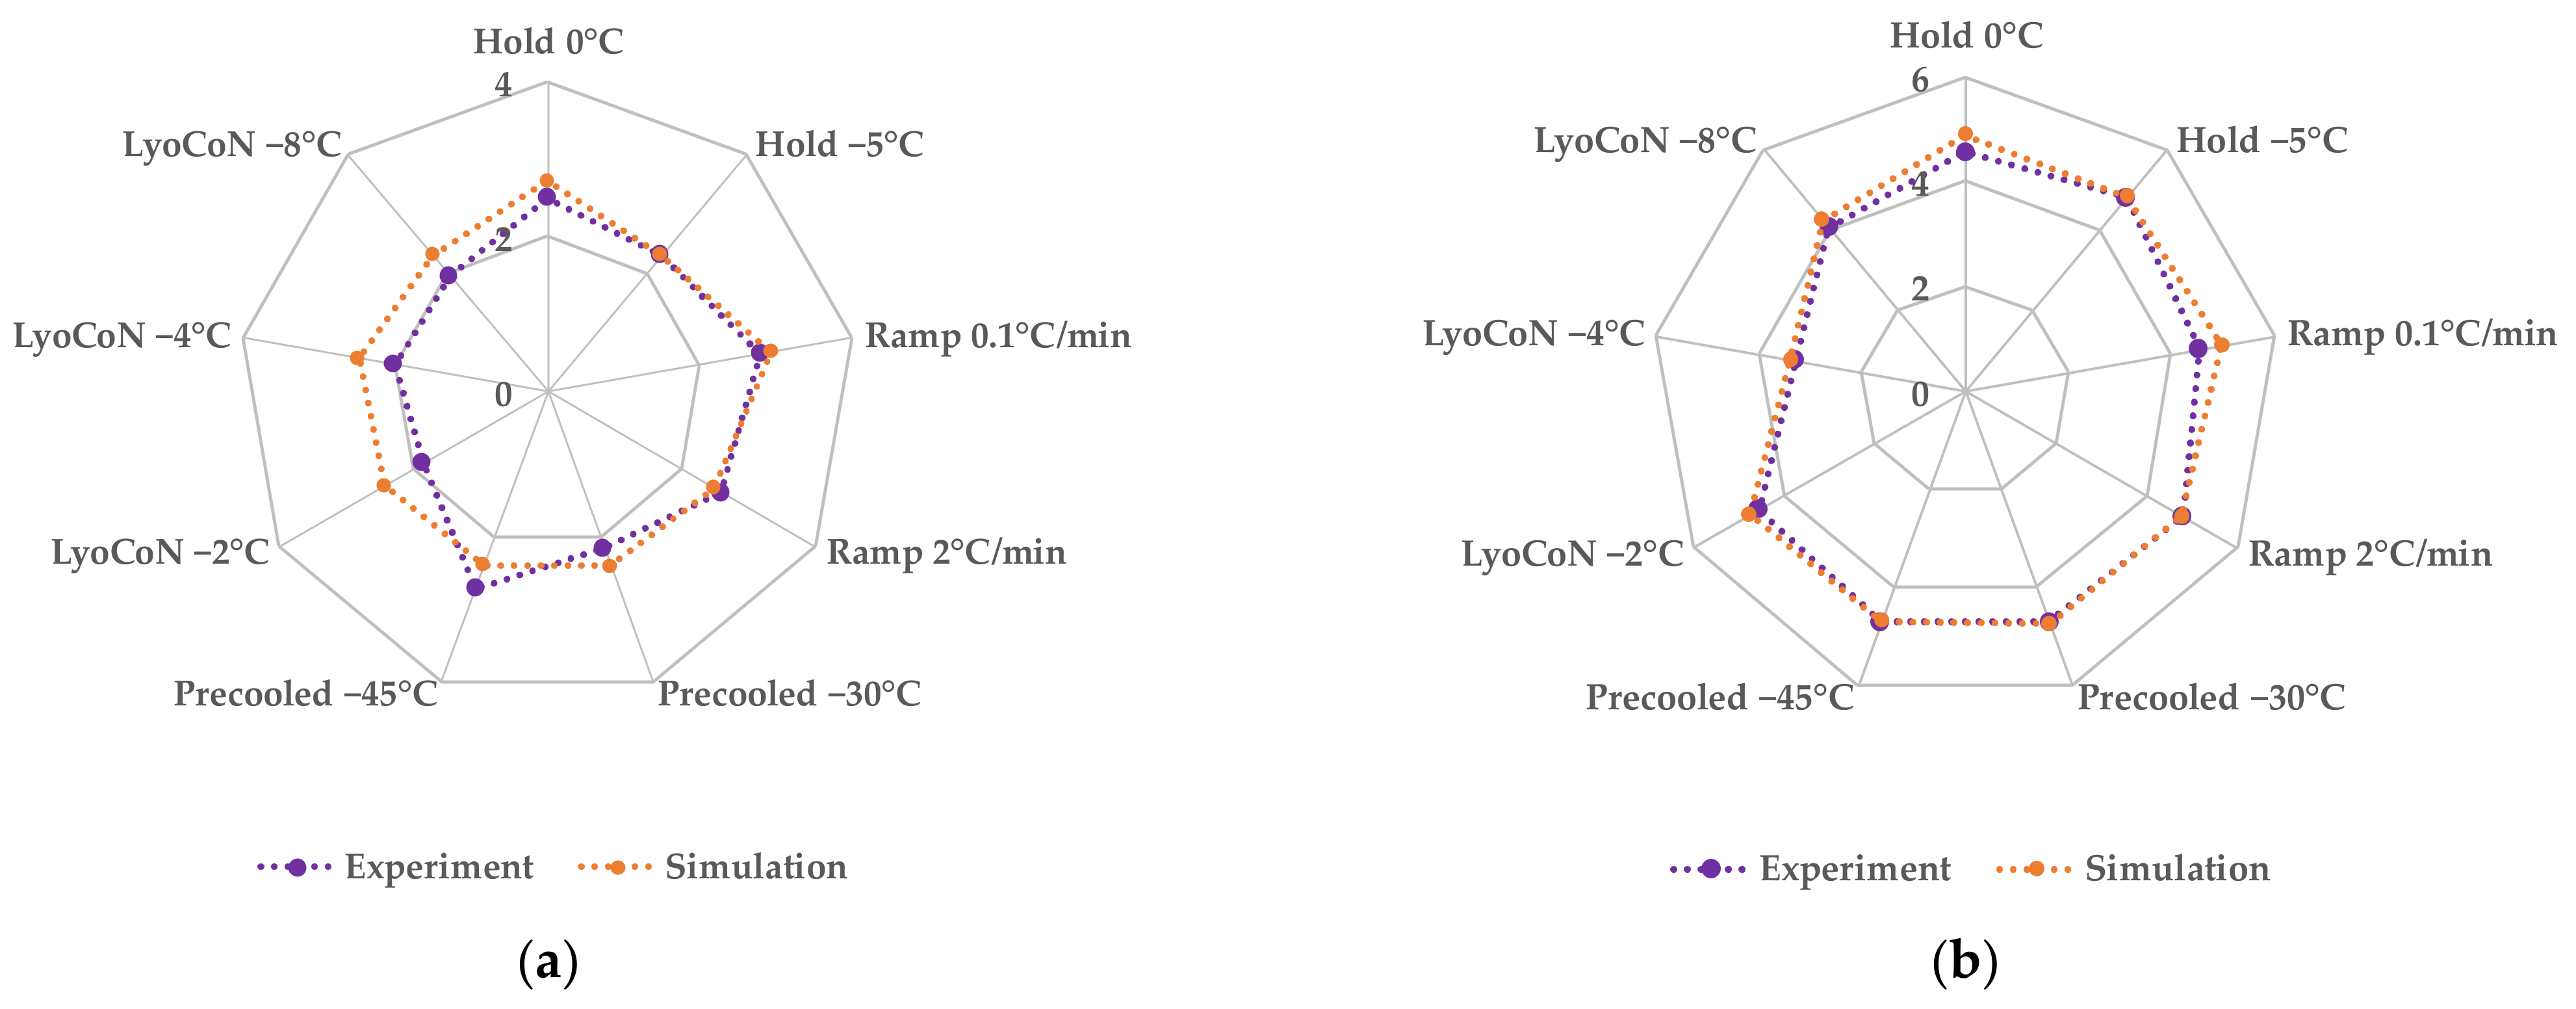
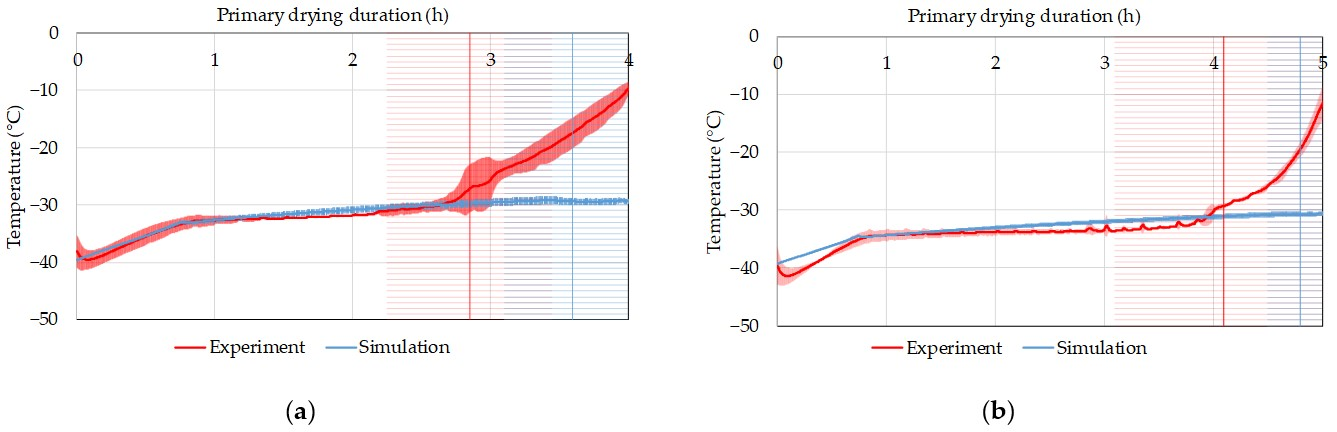
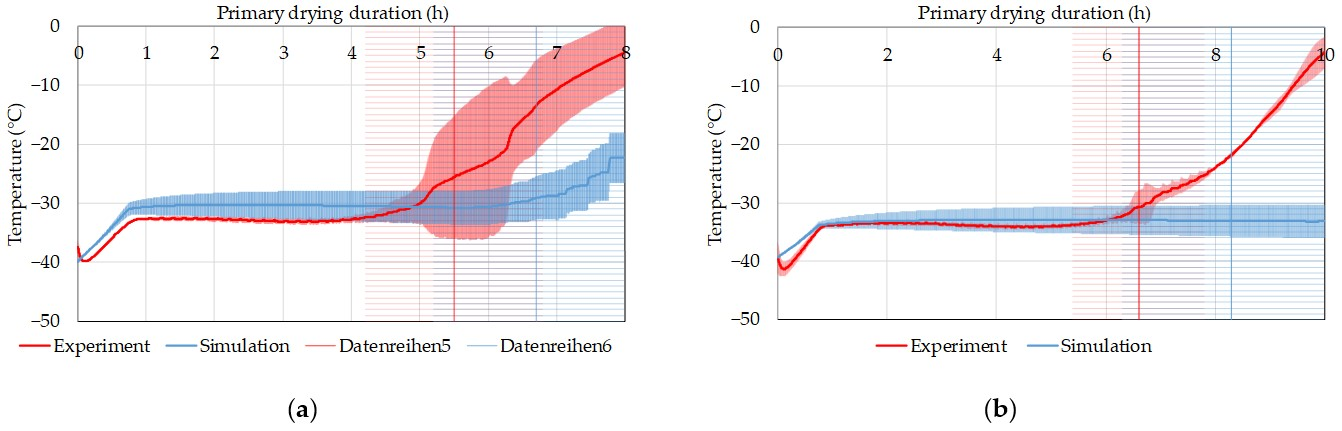
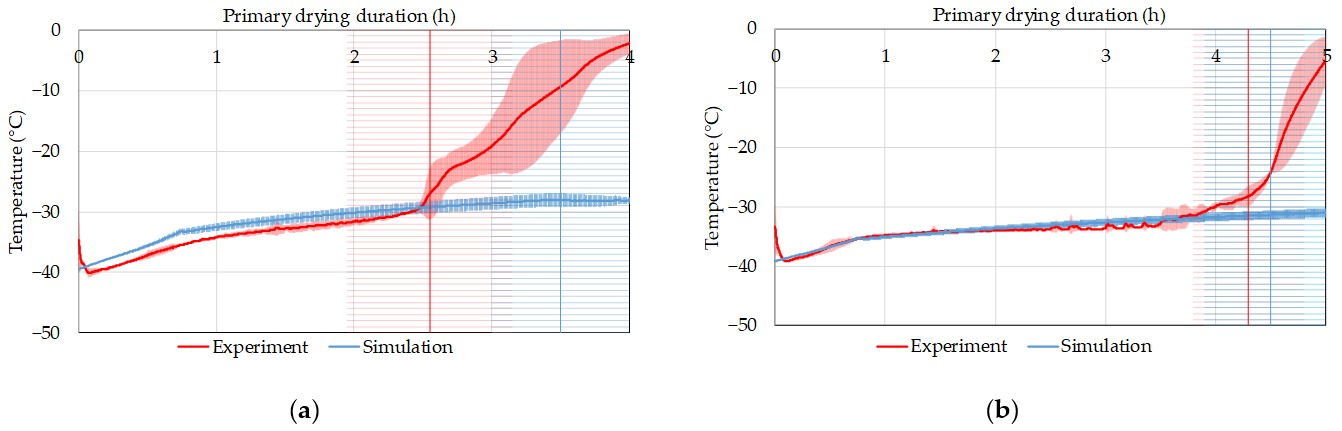
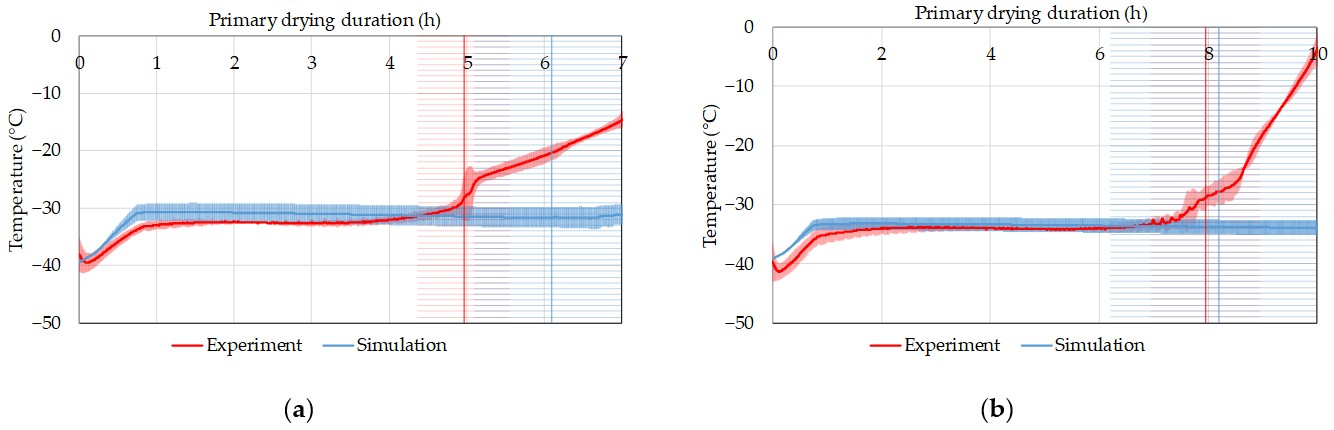
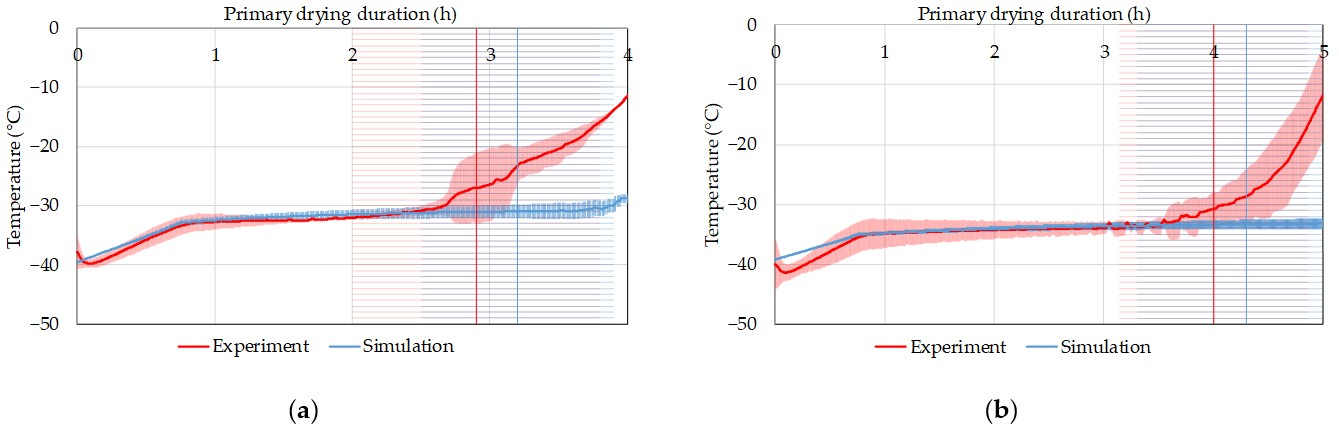
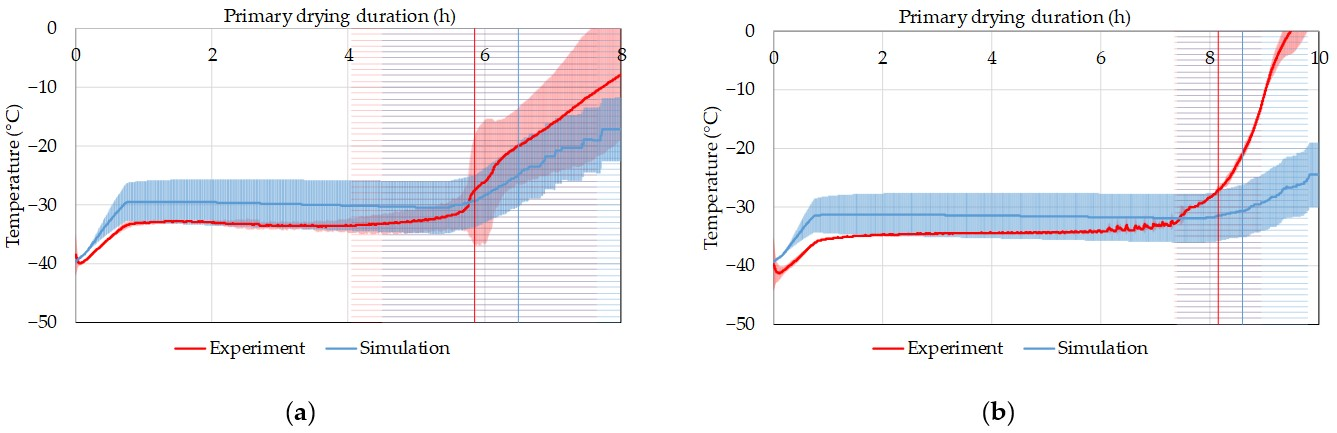
5.4. Primary Drying Endpoint
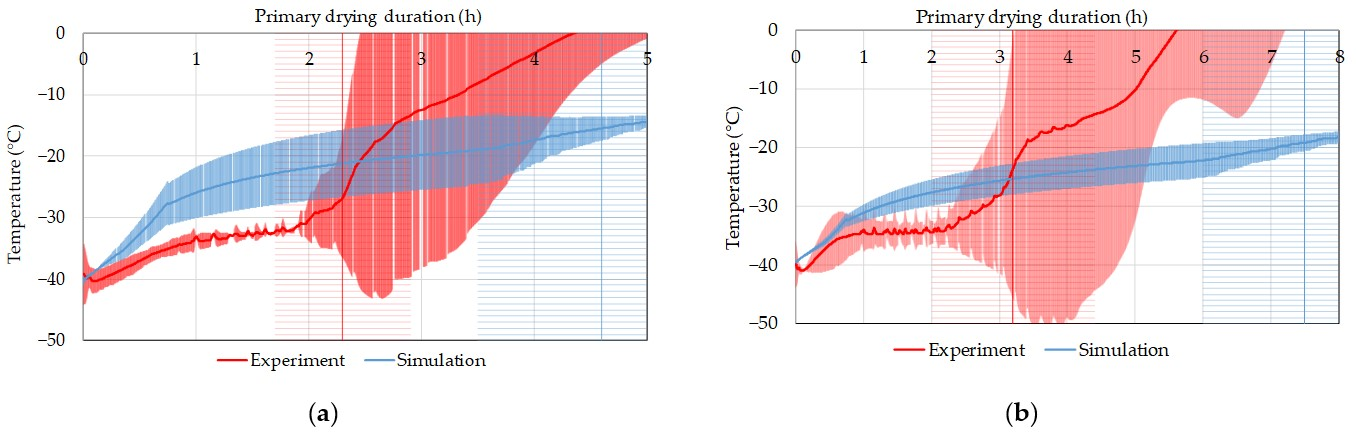
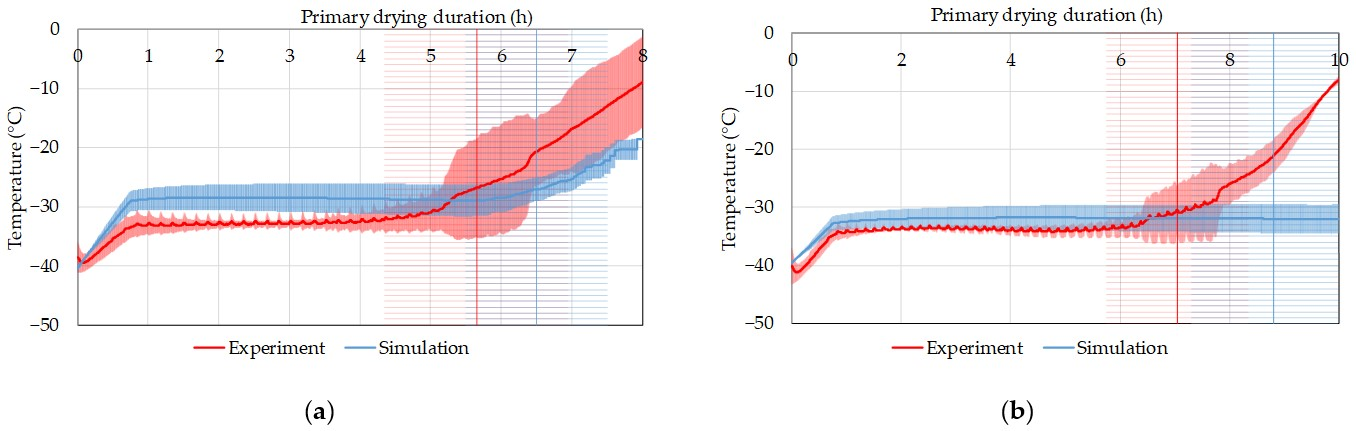
5.5. Product Temperature
6. Discussion
Author Contributions
Funding
Data Availability Statement
Acknowledgments
Conflicts of Interest
References
- Ohtake, S.; Izutsu, K.; Lechuga Ballesteros, D. (Eds.) Drying Technologies for Biotechnology and Pharmaceutical Applications; Wiley-VCH: Weinheim, Germany, 2020; ISBN 9783527341122. [Google Scholar]
- Difranco, N. Lyophilization of Pharmaceuticals: An Overview. Lubrizol CDMO. 8 October 2019. Available online: https://lubrizolcdmo.com/blog/lyophilization-of-pharmaceuticals-an-overview/ (accessed on 3 December 2020).
- Price, E. What is Driving the Growing Demand for Lyophilization? PCI Synthesis. 15 August 2019. Available online: https://www.pcisynthesis.com/what-is-driving-the-growing-demand-for-lyophilization/ (accessed on 3 December 2020).
- Tang, X.; Pikal, M.J. Design of freeze-drying processes for pharmaceuticals: Practical advice. Pharm. Res. 2004, 21, 191–200. [Google Scholar] [CrossRef] [PubMed]
- Franks, F.; Auffret, T. Freeze-Drying of Pharmaceuticals and Biopharmaceuticals; RSC Publishing: Cambridge, UK, 2007. [Google Scholar]
- Walters, R.H.; Bhatnagar, B.; Tchessalov, S.; Izutsu, K.; Tsumoto, K.; Ohtake, S. Next generation drying technologies for pharmaceutical applications. J. Pharm. Sci. 2014, 103, 2673–2695. [Google Scholar] [CrossRef] [PubMed]
- Assegehegn, G.; La Brito-de Fuente, E.; Franco, J.M.; Gallegos, C. The Importance of Understanding the Freezing Step and Its Impact on Freeze-Drying Process Performance. J. Pharm. Sci. 2019, 108, 1378–1395. [Google Scholar] [CrossRef] [PubMed]
- Greiff, D. Development of cycles for lyophilization. Dev. Biol. Stand. 1992, 74, 85–92. [Google Scholar]
- Mirasol, F. Lyophilization Presents Complex Challenges. BioPharm Int. 2020, 33, 22–24. [Google Scholar]
- EMA. ICH Guideline Q8 (R2) on Pharmaceutical Development. Available online: https://www.ema.europa.eu/en/documents/scientific-guideline/international-conference-harmonisation-technical-requirements-registration-pharmaceuticals-human-use_en-11.pdf (accessed on 24 June 2022).
- FDA. PAT—A Framework for Innovative Pharmaceutical Development, Manufacturing, and Quality Assurance. FDA. 11 June 2020. Available online: https://www.fda.gov/regulatory-information/search-fda-guidance-documents/pat-framework-innovative-pharmaceutical-development-manufacturing-and-quality-assurance (accessed on 15 February 2021).
- Thomas, F. Changing Perceptions: An Understanding of Lyophilization Advancements. Pharm. Technol. 2019, 43, 32–34. [Google Scholar]
- Arsiccio, A.; Pisano, R. Application of the Quality by Design Approach to the Freezing Step of Freeze-Drying: Building the Design Space. J. Pharm. Sci. 2018, 107, 1586–1596. [Google Scholar] [CrossRef]
- Arsiccio, A.; McCarty, J.; Pisano, R.; Shea, J.-E. Heightened Cold-Denaturation of Proteins at the Ice-Water Interface. J. Am. Chem. Soc. 2020, 142, 5722–5730. [Google Scholar] [CrossRef]
- Arsiccio, A.; Marenco, L.; Pisano, R. A model-based approach for the rational design of the freeze-thawing of a protein-based formulation. Pharm. Dev. Technol. 2020, 25, 823–831. [Google Scholar] [CrossRef]
- Arsiccio, A.; Giorsello, P.; Marenco, L.; Pisano, R. Considerations on Protein Stability during Freezing and Its Impact on the Freeze-Drying Cycle: A Design Space Approach. J. Pharm. Sci. 2020, 109, 464–475. [Google Scholar] [CrossRef]
- Helgers, H.; Schmidt, A.; Lohmann, L.J.; Vetter, F.L.; Juckers, A.; Jensch, C.; Mouellef, M.; Zobel-Roos, S.; Strube, J. Towards Autonomous Operation by Advanced Process Control—Process Analytical Technology for Continuous Biologics Antibody Manufacturing. Processes 2021, 9, 172. [Google Scholar] [CrossRef]
- Pikal, M.J.; Rambhatla, S.; Ramot, R. The impact of the freezing stage in lyophilization: Effects of the ice nucleation temperature on process design and product quality. Am. Pharmaceut. Rev. 2002, 5, 48. [Google Scholar]
- Jennings, T. The Freezing Process. In Lyophilization: Introduction and Basic Principles; Interpharm Press: Englewood, CO, USA, 1999. [Google Scholar]
- Pisano, R.; Capozzi, L.C. Prediction of product morphology of lyophilized drugs in the case of Vacuum Induced Surface Freezing. Chem. Eng. Res. Des. 2017, 125, 119–129. [Google Scholar] [CrossRef]
- Arsiccio, A.; Pisano, R. The Ice-Water Interface and Protein Stability: A Review. J. Pharm. Sci. 2020, 109, 2116–2130. [Google Scholar] [CrossRef]
- Nail, S.L.; Jiang, S.; Chongprasert, S.; Knopp, S.A. Fundamentals of freeze-drying. In Development and Manufacture of Protein Pharmaceuticals; Springer: New York, NY, USA, 2002. [Google Scholar]
- Kasper, J.C.; Friess, W. The freezing step in lyophilization: Physico-chemical fundamentals, freezing methods and consequences on process performance and quality attributes of biopharmaceuticals. Eur. J. Pharm. Biopharm. 2011, 78, 248–263. [Google Scholar] [CrossRef]
- Rambhatla, S.; Ramot, R.; Bhugra, C.; Pikal, M.J. Heat and mass transfer scale-up issues during freeze drying: II. Control and characterization of the degree of supercooling. AAPS PharmSciTech 2004, 5, e58. [Google Scholar] [CrossRef]
- Liu, J. Physical characterization of pharmaceutical formulations in frozen and freeze-dried solid states: Techniques and applications in freeze-drying development. Pharm. Dev. Technol. 2006, 11, 3–28. [Google Scholar] [CrossRef]
- Searles, J.A. Freezing and annealing phenomena in lyophilization. In Freeze-Drying/Lyophilization of Pharmaceutical and Biological Products; CRC Press: Boca Raton, FL, USA, 2004. [Google Scholar]
- Dalvi-Isfahan, M.; Hamdami, N.; Xanthakis, E.; Le-Bail, A. Review on the control of ice nucleation by ultrasound waves, electric and magnetic fields. J. Food Eng. 2017, 195, 222–234. [Google Scholar] [CrossRef]
- Petzold, G.; Aguilera, J.M. Ice Morphology: Fundamentals and Technological Applications in Foods. Food Biophys. 2009, 4, 378–396. [Google Scholar] [CrossRef]
- Akyurt, M.; Zaki, G.; Habeebullah, B. Freezing phenomena in ice–water systems. Energy Convers. Manag. 2002, 43, 1773–1789. [Google Scholar] [CrossRef]
- Matsumoto, M.; Saito, S.; Ohmine, I. Molecular dynamics simulation of the ice nucleation and growth process leading to water freezing. Nature 2002, 416, 409–413. [Google Scholar] [CrossRef] [PubMed]
- Jennings, T. The importance of process water. In Lyophilization: Introduction and Basic Principles; Interpharm Press: Englewood, CO, USA, 1999. [Google Scholar]
- Wilson, P.W.; Heneghan, A.F.; Haymet, A.D.J. Ice nucleation in nature: Supercooling point (SCP) measurements and the role of heterogeneous nucleation. Cryobiology 2003, 46, 88–98. [Google Scholar] [CrossRef] [PubMed]
- Blond, G. Velocity of linear crystallization of ice in macromolecular systems. Cryobiology 1988, 25, 61–66. [Google Scholar] [CrossRef] [PubMed]
- Searles, J.A.; Carpenter, J.F.; Randolph, T.W. The ice nucleation temperature determines the primary drying rate of lyophilization for samples frozen on a temperature-controlled shelf. J. Pharm. Sci. 2001, 90, 860–871. [Google Scholar] [CrossRef] [PubMed]
- Liu, J.; Viverette, T.; Virgin, M.; Anderson, M.; Paresh, D. A study of the impact of freezing on the lyophilization of a concentrated formulation with a high fill depth. Pharm. Dev. Technol. 2005, 10, 261–272. [Google Scholar] [CrossRef] [PubMed]
- Hatley, R.H.; Mant, A. Determination of the unfrozen water content of maximally freeze-concentrated carbohydrate solutions. Int. J. Biol. Macromol. 1993, 15, 227–232. [Google Scholar] [CrossRef]
- Pikal, M.J.; Shah, S.; Senior, D.; Lang, J.E. Physical chemistry of freeze-drying: Measurement of sublimation rates for frozen aqueous solutions by a microbalance technique. J. Pharm. Sci. 1983, 72, 635–650. [Google Scholar] [CrossRef]
- Shibkov, A.A.; Golovin, Y.; Zheltov, M.A.; Korolev, A.A.; Leonov, A.A. Morphology diagram of nonequilibrium patterns of ice crystals growing in supercooled water. Phys. A Stat. Mech. Its Appl. 2003, 319, 65–79. [Google Scholar] [CrossRef]
- Cameron, P. Good Pharmaceutical Freeze-Drying Practice; Interpharm Press Inc.: Englewood, CO, USA, 1997. [Google Scholar]
- Blond, G.; Simatos, D.; Catté, M.; Dussap, C.G.; Gros, J.B. Modeling of the water-sucrose state diagram below 0 °C. Carbohydr. Res. 1997, 298, 139–145. [Google Scholar] [CrossRef]
- Kett, V.; McMahon, D.; Ward, K. Thermoanalytical techniques for the investigation of the freeze drying process and freeze-dried products. Curr. Pharm. Biotechnol. 2005, 6, 239–250. [Google Scholar] [CrossRef]
- Andrieu, J.; Vessot, S. A review on experimental determination and optimization of physical quality factors during pharmaceuticals freeze-drying cycles. Dry. Technol. 2018, 36, 129–145. [Google Scholar] [CrossRef]
- Her, L.M.; Nail, S.L. Measurement of glass transition temperatures of freeze-concentrated solutes by differential scanning calorimetry. Pharm. Res. 1994, 11, 54–59. [Google Scholar] [CrossRef]
- Ma, X.; Wang, D.Q.; Bouffard, R.; MacKenzie, A. Characterization of murine monoclonal antibody to tumor necrosis factor (TNF-MAb) formulation for freeze-drying cycle development. Pharm. Res. 2001, 18, 196–202. [Google Scholar] [CrossRef]
- Schawe, J. A quantitative DSC analysis of the metastable phase behavior of the sucrose–water system. Thermochim. Acta 2006, 451, 115–125. [Google Scholar] [CrossRef]
- Sacha, G.A.; Nail, S.L. Thermal analysis of frozen solutions: Multiple glass transitions in amorphous systems. J. Pharm. Sci. 2009, 98, 3397–3405. [Google Scholar] [CrossRef]
- Ward, K.R.; Matejutschek, P. The use of microscopy, thermal analysis, and impedance measurements to establish critical formulation parameters for freeze-drying cycle development. In Freeze-Drying/Lyophilization of Pharmaceutical and Biological Products; CRC Press: Boca Raton, FL, USA, 2010; p. 112. [Google Scholar]
- Knopp, M.M.; Löbmann, K.; Elder, D.P.; Rades, T.; Holm, R. Recent advances and potential applications of modulated differential scanning calorimetry (mDSC) in drug development. Eur. J. Pharm. Sci. 2016, 87, 164–173. [Google Scholar] [CrossRef]
- Passot, S.; Fonseca, F.; Alarcon-Lorca, M.; Rolland, D.; Marin, M. Physical characterisation of formulations for the development of two stable freeze-dried proteins during both dried and liquid storage. Eur. J. Pharm. Biopharm. 2005, 60, 335–348. [Google Scholar] [CrossRef]
- Meister, E.; Gieseler, H. Freeze-dry microscopy of protein/sugar mixtures: Drying behavior, interpretation of collapse temperatures and a comparison to corresponding glass transition data. J. Pharm. Sci. 2009, 98, 3072–3087. [Google Scholar] [CrossRef]
- Depaz, R.A.; Pansare, S.; Patel, S.M. Freeze-Drying Above the Glass Transition Temperature in Amorphous Protein Formulations While Maintaining Product Quality and Improving Process Efficiency. J. Pharm. Sci. 2016, 105, 40–49. [Google Scholar] [CrossRef]
- Horn, J.; Friess, W. Detection of Collapse and Crystallization of Saccharide, Protein, and Mannitol Formulations by Optical Fibers in Lyophilization. Front. Chem. 2018, 6, 4. [Google Scholar] [CrossRef]
- Pisano, R. Alternative Methods of Controlling Nucleation in Freeze Drying. In Lyophilization of Pharmaceuticals and Biologicals; Ward, K.R., Matejtschuk, P., Eds.; Springer: New York, NY, USA, 2019; pp. 79–111. ISBN 978-1-4939-8927-0. [Google Scholar]
- Velardi, S.A.; Barresi, A.A. Development of simplified models for the freeze-drying process and investigation of the optimal operating conditions. Chem. Eng. Res. Des. 2008, 86, 9–22. [Google Scholar] [CrossRef]
- Juckers, A.; Knerr, P.; Harms, F.; Strube, J. Advanced Process Analytical Technology in Combination with Process Modeling for Endpoint and Model Parameter Determination in Lyophilization Process Design and Optimization. Processes 2021, 9, 1600. [Google Scholar] [CrossRef]
- Juckers, A.; Knerr, P.; Harms, F.; Strube, J. Model-Based Product Temperature and Endpoint Determination in Primary Drying of Lyophilization Processes. Pharmaceutics 2022, 14, 809. [Google Scholar] [CrossRef] [PubMed]
- Juckers, A.; Knerr, P.; Harms, F.; Strube, J. Emerging PAT for Freeze-Drying Processes for Advanced Process Control. Processes 2022, 10, 2059. [Google Scholar] [CrossRef]


| Freezing Method | Procedure | CN? | Tn | SSA | RP | Primary Drying Time | Secondary Drying Time | Integration (Equipment Change Necessary?) | GMP | Comments |
|---|---|---|---|---|---|---|---|---|---|---|
| Shelf-ramped freezing | Linear decrease in shelf temperature | No | −− | ++ | ++ | ++ | −− | No | ✓ | Most common used |
| Shelf-ramped step freezing | Linear decrease in shelf temperature with equilibration holding steps (e.g., 5 °C and −10 °C) | No | − | + | + | + | − | No | ✓ | Equilibration reduces the inter-vial heterogeneity |
| Pre-cooled shelf method | Vials are loaded onto shelf at desired temperature (e.g., −45 °C) | No | + | − | − | − | + | No | ✓ | High inter-vial heterogeneity, primary drying time reduction of up to 18% |
| Annealing | Holding step above glass transition temperature | No | n.i.. | −− | −− | −− | ++ | No | ✓ | Eliminates dependence of ice crystal size on nucleation temperature, reduces inter-vial heterogeneity, |
| Quench freezing | Immersion into liquid nitrogen or other solutions | No | + | +++ | +++ | +++ | --- | No | x | Lowered degree of supercooling, high freezing rate |
| Vertical freezing | Nucleation with dry ice at vial bottom | No | + | −− | −− | −− | ++ | No | x | Produces large vertical ice crystals |
| Ice fog technique | Ice fog introduced into chamber, generated small ice crystals serve as nucleating agents | Yes | ++ | −− | −− | −− | ++ | Yes | ✓ | Reduced pressure inside chamber enables faster and more uniform freezing, dependent on load |
| Electrical | Ice nucleation induced by high voltage | Yes | ++ | −− | −− | −− | ++ | Yes | x | Application in cryotubes, direct vs. Indirect electrofreezing |
| Ultrasound | Ice nucleation triggered with ultrasound wave | Yes | ++ | −− | −− | −− | ++ | Yes | ✓ | High intra-vial heterogeneity, scale-up limited |
| Vacuum induced surface freezing | Vacuum inside chamber evaporates small amount of water on surface, self-cooling induces ice nucleation | Yes | ++ | −− | − | − | ++ | No | ✓ | Easy scale-up, vacuum formulation dependent |
| Depressurization | Pressure shift from overpressure to atm shifts freezing point | Yes | ++ | −− | -- | −− | ++ | No, only if equipment can withstand overpressure | ✓ | Efficiency connected with inert gas |
| Ice nucleating agents | Ice nucleating agent acts as nucleation site (e.g., AgI, P. syringae) | No | + | − | − | − | + | No | x | Great inter-vial heterogeneity, nucleation efficiency depends on concentration |
| Non-aqueous co-solvent | Ice crystal habit is changed by high-volatility co-solvent (e.g., TBA) | No | n.i. | −− | -- | −− | ++ | No | x | Ice crystal size and morphology dependent on amount of co-solvent, organic solvents introduce safety risks |
| Vial modification | Vial pre-treatment such as scoring, scratching or roughening favors ice nucleation | No | − | + | + | + | − | No | x | Only marginal increase in nucleation temperature detectable |
| Freezing Method | Ramp (K/min) | Fill Volume (mL) |
|---|---|---|
| Shelf-ramped freezing without hold step | 0.1 | 1 |
| 2 | 1 | |
| 0.1 | 2 | |
| 2 | 2 | |
| Hold temperature (°C) | Fill volume (mL) | |
| Shelf-ramped freezing with holding step | 0 | 1 |
| −5 | 1 | |
| 0 | 2 | |
| −5 | 2 | |
| Shelf temperature (°C) | Fill volume (mL) | |
| Precooled | −30 | 1 |
| −45 | 1 | |
| −30 | 2 | |
| −45 | 2 | |
| Nucleation temperature (°C) | Fill volume (mL) | |
| Ice fog method LyoCoN | −2 | 1 |
| −4 | 1 | |
| −8 | 1 | |
| −2 | 2 | |
| −4 | 2 | |
| −8 | 2 |
| Parameter | Value |
|---|---|
| Av | 3.8 cm2 |
| Ap | 3.14 cm2 |
| ΔHsubl | 2834.6 kJ/kg |
| Freezing Method | Ramp (K/min) | Heat Flux Cooling (W/m2) | Heat Flux Nucleation (W/m2) | ||
|---|---|---|---|---|---|
| 1 mL | 2 mL | 1 mL | 2 mL | ||
| Shelf-ramped freezing without hold step | 0.1 | −100 | −150 | −607 | −804 |
| 2 | −500 | −745 | −1493 | −1502 | |
| Hold temperature (°C) | |||||
| Shelf-ramped freezing with holding step | 0 | −265 | −410 | −1256 | −1549 |
| −5 | −320 | −510 | −1040 | −1483 | |
| Shelf temperature (°C) | |||||
| Precooled | −30 | −2695 | −2511 | −1490 | −1294 |
| −45 | −2691 | −2663 | −1656 | −1780 | |
| Nucleation temperature (°C) | |||||
| Ice fog method LyoCoN | −2 | −329 | −440 | −842 | −1217 |
| −4 | −367 | −409 | −1044 | −1153 | |
| −8 | −350 | −420 | −1136 | −1263 | |
| Freezing Method | Ramp (K/min) | Dry Layer Resistance (m/s) | ||
|---|---|---|---|---|
| Ldry = 0 m | Ldry = 0.0035 m | Ldry = 0.007 m | ||
| Shelf-ramped freezing without hold step | 0.1 | 39,174 ± 7424 | 142,585 ± 92,982 | 248,952 ± 180,984 |
| 2 | 49,805 ± 38,025 | 86,119 ± 35,193 | 87,732 ± 33,526 | |
| Hold temperature (°C) | ||||
| Shelf-ramped freezing with holding step | 0 | 31,378 ± 8179 | 54,557 ± 7559 | 55,304 ± 6815 |
| −5 | 40,899 ± 13,360 | 83,425 ± 15,071 | 88,669 ± 23,175 | |
| Shelf temperature (°C) | ||||
| Precooled | −30 | 15,494 ± 15,469 | 71,046 ± 17,543 | 72,881 ± 15,836 |
| −45 | 16,719 ± 115 | 51,754 ± 2428 | 52,018 ± 2295 | |
| Nucleation temperature (°C) | ||||
| Ice fog method LyoCoN | −2 | 28,353 ± 4273 | 43,422 ± 3607 | 43,853 ± 3168 |
| −4 | 21,851 ± 16,929 | 56,767 ± 16,984 | 56,838 ± 16,912 | |
| −8 | 33,161 ± 1047 | 55,990 ± 3296 | 79,471 ± 5610 | |
| PAT Tool | Necessary Equipment | Objective | Rec. | Remarks |
|---|---|---|---|---|
| WTM | WTMplus sensor Transponder | Product temperature determination | Major advantages over wired sensors but invasive | |
| Comp. pressure | Pirani gauge Capacitive sensor | Pressure control | Pressure control can be obtained by either sensor Pirani: gas-type-dependent Capacitive: gas-type-independent | |
| Primary drying endpoint | Measures endpoint of the whole batch | |||
| MTM | Two-chamber freeze dryer with closable intermediate valve Analysis tool | Model parameter determination Rp | Noninvasive online measurement, value valid until 2/3 of primary drying | |
| Primary drying endpoint | Pressure rise can induce melt back if the recipe is too aggressive Optimized MTM for reduced measurement time | |||
| Heat flux | Heat flux sensor Datalogger Readout software | Nucleation temperature determination | Only measurement possible; combination with controlled nucleation required | |
| Model parameter determination Kv | Value significantly underestimated; more experience must be gained | |||
| Primary drying endpoint | Value in good agreement with WTM but exact positioning necessary | |||
| Ice ruler | Ice ruler Camera Analysis tool | Primary drying endpoint | Sublimated ice mass in good agreement with ice occupation Analysis algorithm required | |
| LyoCoN | LyoCoN reservoir | Nucleation temperature | Nucleation temperature and pressure have to be optimized for formulation |
Disclaimer/Publisher’s Note: The statements, opinions and data contained in all publications are solely those of the individual author(s) and contributor(s) and not of MDPI and/or the editor(s). MDPI and/or the editor(s) disclaim responsibility for any injury to people or property resulting from any ideas, methods, instructions or products referred to in the content. |
© 2023 by the authors. Licensee MDPI, Basel, Switzerland. This article is an open access article distributed under the terms and conditions of the Creative Commons Attribution (CC BY) license (https://creativecommons.org/licenses/by/4.0/).
Share and Cite
Juckers, A.; Knerr, P.; Harms, F.; Strube, J. Effect of the Freezing Step on Primary Drying Experiments and Simulation of Lyophilization Processes. Processes 2023, 11, 1404. https://doi.org/10.3390/pr11051404
Juckers A, Knerr P, Harms F, Strube J. Effect of the Freezing Step on Primary Drying Experiments and Simulation of Lyophilization Processes. Processes. 2023; 11(5):1404. https://doi.org/10.3390/pr11051404
Chicago/Turabian StyleJuckers, Alex, Petra Knerr, Frank Harms, and Jochen Strube. 2023. "Effect of the Freezing Step on Primary Drying Experiments and Simulation of Lyophilization Processes" Processes 11, no. 5: 1404. https://doi.org/10.3390/pr11051404