Review

An Overview of Carbon Emission Mitigation in the Food Industry: Efforts, Challenges, and Opportunities

Department of Food Science and Biotechnology, National Chung Hsing University, No. 145 Xingda Road, South District, Taichung 40227, Taiwan
*
Author to whom correspondence should be addressed.
Processes 2023, 11(7), 1993; https://doi.org/10.3390/pr11071993
Submission received: 4 June 2023 / Revised: 27 June 2023 / Accepted: 30 June 2023 / Published: 1 July 2023

Abstract

:
The food system plays a significant role in anthropogenic greenhouse gas (GHG) emissions, contributing to over one-third of these emissions. However, there has been limited attention given in the literature on how the food industry can effectively address the carbon issue. This review aims to bridge this research gap through providing a comprehensive overview of anthropogenic GHG emissions and exploring the role of carbon markets in mitigating climate change, with a specific emphasis on the food industry. It delves into the introduction of emission hotspots within the food industry, examines ongoing efforts in GHG emissions mitigation, and addresses the challenges associated with GHG verification and offsetting. Notably, emission hotspots are primarily found in the farm, manufacturing, and post-production stages of the food industry. The emissions from the farm stage, which are often overlooked, make a significant contribution to overall emissions. Carbon verification encounters limitations due to a lack of standardized methodologies, inaccurate data, and insufficient reporting of emissions. Currently, achieving carbon neutrality without relying on carbon offsets presents a significant challenge for the entire food industry. Comprehensive mitigation strategies and collaboration across agricultural producers and the food manufacturing industry are considered potential solutions to achieve genuine sustainability.

1. Introduction

Global warming, as recognized by the United Nations, is a key factor contributing to climate change. Given the mounting threat of climate change, all industries have necessitated immediate limits on their greenhouse gas (GHG) emissions [1]. Carbon markets are a mechanism for putting a price on carbon emissions, which incentivizes industries to reduce their GHG output and ultimately contributes to global efforts to mitigate climate change. Considering that over one-third of man-made GHG emissions originated from the food system in 2015 [2], the food manufacturing industry should also implement corresponding measures to tackle this issue.
As major contributors to GHG emissions, it is crucial for the food manufacturing industry to establish climate goals and verify their emissions. In addition to addressing their own emissions, it is essential to account for and include emissions across the entire value chain when setting emission goals [3]. Despite this significant contribution, there has been little emphasis on how the food industry can respond to the carbon issue, and the majority of food scientists remain uninformed on the topic.
The United Nations Framework Convention on Climate Change (UNFCCC) serves as a crucial platform for addressing climate change and its global impact. In 2021, the momentous Conference of the Parties (COP) 26 took place, marking a significant milestone with the adoption of the historic Glasgow Climate Agreement. Within the framework of these meetings, extensive discussions were held on the environmental impacts of the food industry and potential remedies [4]. This dedicated attention has propelled the food industry’s role in reducing GHG emissions to the forefront.
As awareness continues to grow, it becomes increasingly imperative for the food industry to prioritize the reduction of carbon emissions in response to the ever-evolving carbon market. However, the process of estimating GHG emissions is intricate, demanding meticulous consideration of numerous parameters. Conducting thorough GHG verification is essential for accurately quantifying these emissions and identifying areas of concern or hotspots [5,6,7]. Despite the availability of various international standards for measuring, managing, and reporting GHG emissions, such as the widely recognized GHG Protocol, the general understanding and application of these guidelines within the food industry remains limited [1]. Bridging this gap and enhancing comprehension is necessary to ensure the effective implementation of emission reduction strategies.
The objective of this review is to offer a comprehensive overview of GHG emissions mitigation, specifically emphasizing the food industry. Our aim is to delve into key areas such as identifying emission hotspots within the food industry, exploring ongoing efforts in GHG emissions mitigation, discussing the barriers associated with offsetting these emissions, and addressing the challenges surrounding GHG verification. Through providing food scientists with a platform for knowledge sharing, we strive to shed light on the various challenges and opportunities related to carbon offsetting and the development of carbon-neutral food within the food industry. Our goal is to facilitate a deeper understanding of these topics and contribute to the advancement of sustainable practices in the field.

2. Carbon Market: A Way to Support Climate Action

Man-made GHG emissions are the primary driving force of climate change, as they act like greenhouse glass through trapping infrared radiation from the sun and preventing heat from escaping into space. Excess GHG emissions are responsible for rising average temperatures and radical shifts in weather patterns worldwide for an extended period [8]. Climate change, caused by elevated temperature, leads to stronger heat waves, heavier precipitation events, more prolonged droughts that fuel wildfires, ocean acidification, rising sea levels, and declining biodiversity [9].
Climate extremes have dire consequences for food and water security. Floods and droughts limit access to vital resources, leading to increased malnutrition and insecurity in terms of food and water. Meanwhile, extreme heat events result in increased human morbidity and deaths [9]. Since 1950, natural forces alone have been insufficient to explain climate change, and anthropogenic forces are believed to be predominantly responsible for the observed temperature anomaly [10]. GHGs emitted by human activities are to blame for the elevated global temperature, making humans not only climate refugees but also climate persecutors.
Under the Kyoto Protocol, six GHGs were identified as significant contributors to climate change, namely, carbon dioxide, nitrous oxide, methane, perfluorocarbons, hydrofluorocarbons, and sulfur hexafluoride. Among these, the food system alone accounts for approximately 21–37 percent of man-made GHG emissions, including agricultural production, processing, transportation, and food waste [2,11]. The food industry is a significant contributor to global GHG emissions and is now receiving more attention. As the carbon market gains prominence, the reduction of carbon emissions will become an increasingly relevant topic for the food industry.
To address climate issues, representatives from 197 countries established the UNFCCC, convened regularly for COP. Figure 1 illustrates a chronological sequence of various human efforts in addressing climate change. The concepts of carbon markets, carbon taxes, carbon offsets, and carbon neutrality were subsequently introduced. The first global carbon market was developed under the United Nations’ 1997 Kyoto Protocol at COP 3. However, the initial implementation of the carbon market concept was fraught with difficulties and eventually imploded with extensive allegations of fraud and abuse of power. The carbon market mechanism was strengthened with the introduction of the Paris Agreement at COP 21, but flaws persisted until modifications were made by national representatives at COP 26. In October 2023, the European Union will introduce the Carbon Boundary Adjustment Mechanism (CBAM), which imposes a carbon tariff on importers whose goods surpass the carbon standards of the importing country [12]. CBAM initially targets five industries, including cement, electric power, fertilizer, steel, and aluminum, with the possibility of including more industries after its formal implementation in 2026. The food industry, as a significant contributor to global GHG emissions, is now receiving increased attention. Discussions on its environmental impacts and potential solutions took place at the UN Food Systems Summit and the UNFCCC COP 26 sessions [13]. Therefore, reducing carbon emissions in response to the carbon market will become an increasingly relevant and crucial topic for the food industry.
The carbon market is a policy tool that constrains man-made GHGs through assigning economic value to carbon dioxide (CO2), thereby creating a new environmental commodity that can be traded internationally. Business owners are required to pay the associated costs for their GHG emissions. Carbon dioxide is the primary man-made GHG blamed for inducing global warming [14], and it serves as the tradable unit in the carbon market. Other non-CO2 GHGs can be transacted on the carbon market at their CO2-equivalent values, calculated based on the notion of “global warming potential”.

3. Emission Hotspots in the Food Industry

The evolving carbon market is placing greater emphasis on GHG verification, which is considered the most technically demanding aspect of the emissions trading system. GHG verification entails assessing an organization’s precise GHG emissions, reporting GHG emissions, and identifying emission hotspots through a set of standardized procedures. Through identifying these emission hotspots, companies can steer toward and adopt more efficient and cost-effective emission abatement strategies [15].
The food system, spanning from farming to post-production, is responsible for producing massive amounts of man-made GHG emissions [16]. During the farm stage, emissions primarily arise from agricultural and livestock production, as well as corresponding land use changes (LUCs). In the manufacturing phase, GHGs primarily come from food manufacturing processes, including processing, packaging, and transportation. Post-production processes, such as retail, consumer travel, household consumption, and food waste disposal, also contribute to GHG generation. According to a study conducted by Tubiello et al. [17], there was a significant decrease of approximately 30 percent in GHG emissions from LUCs in the food system between 1990 and 2018. It can be inferred that emissions from energy consumption beyond the farm stage, particularly from the food manufacturing industry, will increasingly account for a larger proportion of the entire food system’s emissions in the foreseeable future.
The contemporary food system heavily relies on fossil fuels. It is responsible for approximately 30 percent of the world’s energy consumption and significant GHG emissions, with the food manufacturing and post-production stages alone accounting for 70 percent of the total energy usage within the system [18]. During the food manufacturing stage, emissions from packaging and transportation have exhibited the highest upward trend, with a 67% increase from 1990 to 2015. It is worth noting that transportation emissions mainly arise from automobiles and trains, rather than ships and aircraft [2].
Conducting GHG verification is essential for quantifying these emissions and identifying hotspots. Several international standards are applicable for measuring, managing, and reporting GHG emissions, including the Greenhouse Gas Protocol (GHG Protocol), ISO 14064 [19], ISO 14067 [20], PAS 2050 [21], and PAS 2060 [22]. These documents serve distinct purposes and focus on different areas. A comparison of GHG verification guidelines between the GHG Protocol and ISO 14064 presented in Figure 2. The GHG Protocol, being the first developed protocol for GHG accounting, provides a comprehensive framework that addresses the concept of Scope 1, Scope 2, and Scope 3 emissions. It enables the understanding and identification of direct and indirect GHG sources across the entire food industry’s value chain. Scope 1 refers to direct emissions that a company can control, while Scope 2 encompasses indirect emissions generated from purchased energy sources. On the other hand, Scope 3 comprises indirect emissions from sources throughout a company’s value chain that are beyond its direct control. Scope 3 emissions can be further divided into fifteen distinct categories. ISO 14064 is developed based on the GHG Protocol. ISO 14067 serves as a supplementary component to ISO 14064 and focuses on providing guidelines for quantifying and reporting product carbon footprints. ISO 14064 classifies a company’s emission sources into six categories, which differ from the Scope 1–3 classifications but share some relevance. Figure 2 illustrates a comparison between the two, showing that Scope 1 corresponds to Category 1 (ISO 14064), Scope 2 corresponds to Category 2 (ISO 14064), and Categories 3–5 (ISO 14064) align with the 15 categories of Scope 3 emissions. PAS 2050 is designed specifically to assess the GHG emissions of product life cycles, while PAS 2060 can be pursued to achieve carbon neutrality for specific products or operations [23]. The usefulness of these approaches depends on the specific goals, resources, and commitment to sustainability and emissions reduction of food industry stakeholders.
These guidelines provide a framework for the food industry to develop strategies for reducing emissions. The GHG Protocol’s GHG verification guideline categorizes emission sources across the entire food manufacturing industry’s value chain into three scopes. Taking milk powder production as an example (Figure 3), the upstream of Scope 3 covers GHG emissions generated during raw milk production and transportation to the milk factory. Scope 1 encompasses emissions that the food factory directly controls, such as milk processing, milk powder packaging, and logistics for sending products to retail locations. Scope 2 refers to emissions from energy outsourced by the food factory, and the downstream of Scope 3 involves emissions generated by retail locations, consumers, and packaging disposal after the final product leaves the factory.
Figure 3 provides a detailed illustration of emissions sources ranging from Scope 3 upstream to Scope 3 downstream. Scope 3 upstream emissions include GHG emissions generated during feed crop cultivation, mechanized farming, as well as nitrous oxide and methane emissions from manure and cattle digestion. Furthermore, emissions result from mechanical milking and the transportation of raw milk to the factory. On the other hand, emissions arising from pasteurizing and spray-drying raw milk into milk powder, packaging, and transporting the final products using company-owned vehicles are classified as Scope 1 emissions. The emissions associated with the factory’s purchased energy sources are categorized as Scope 2 emissions. Scope 3 downstream emissions arise from selling activities such as lighting and air conditioning in retail locations, customer activities involving the brewing of milk powder, and the disposal of packaging waste.
Considering the high energy consumption and heavy reliance on petroleum and coal in the food manufacturing industry [24], it is commonly assumed that the product processing and post-production stages are the primary sources of emissions in the food system. However, in reality, it is the farm stage that serves as the main contributor to GHG emissions. This is mainly attributed to significant agricultural production (e.g., methane emissions from enteric fermentation in livestock), land use (e.g., CO2 released from land management practice), and LUC activities (e.g., CO2 emissions resulting from deforestation for land conversion).
Reports from the 50 largest global food companies, such as Nestlé headquartered in Switzerland, as well as Cargill and Coca-Cola, both headquartered in the USA, indicate that almost 90 percent of all disclosed emissions are attributable to Scope 3 emissions, with crop cultivation, land use, and LUC being the largest sources. Unfortunately, Scope 3 disclosure is often insufficient and unreliable, and over 30 percent of disclosed Scope 3 emissions are not addressed by companies’ emissions mitigation goals [1,3]. As a result, it is practically challenging for food manufacturing companies to intervene in farm management and minimize Scope 3 emissions.

4. Efforts in GHG Emissions Mitigation

Food factories should give priority to reducing emissions in Scope 1 and Scope 2, as these emissions are the more controllable aspects within the factories’ operations. However, it is important to note that some transportation-related GHGs may be classified as Scope 3 emissions. Taking bread products as an example, Figure 4 illustrates the variations in emission sources during transportation for products sold locally and for export. When bread products are transported to the local market using the factory’s vehicles, the emissions resulting from the transportation process are classified as Scope 1 emissions. Similarly, when bread products are exported, the emissions generated from transporting goods to airports using company-owned vehicles are also categorized as Scope 1 emissions. Meanwhile, it is important to note that emissions from transporting products abroad by means of aircraft are classified as Scope 3 downstream emissions. Consequently, potential strategies for food manufacturers to reduce GHG emissions should encompass addressing emissions within Scope 1, Scope 2, and a portion of Scope 3, including emissions from the upstream farm stage and downstream consumer travel.

4.1. Emissions from Scope 1, Scope 2, and Scope 3 Downstream

4.1.1. Energy Management

The food manufacturing industry heavily relies on energy, primarily derived from the combustion of fossil fuels, making effective energy management crucial for reducing emissions. Two complementary strategies can be considered to achieve this goal. The first strategy entails the exploration of innovative and clean energy sources to achieve energy decarbonization, while the second strategy focuses on improving energy efficiency in processing and transportation [25,26].

Strategies for Achieving Energy Decarbonization

In order to expedite energy decarbonization, COP 26 is urging nations to expand renewable energy sources and phase out inefficient fossil fuels swiftly [27]. In response, many international food manufacturing companies have made significant changes, such as transitioning to procuring renewable electricity or implementing on-site renewable energy solutions [28]. For example, Nestlé has whittled down an equivalent of 27,000 truck trips annually via utilizing electric trains for transporting its water products [29]. Similarly, Cargill has made notable strides in sustainability through procuring renewable energy sources, such as solar and wind energy, to meet 60 percent of its energy demand, resulting in a reduction of over 53,000 metric tons of GHG emissions. They have also developed a husk–coal blend that has dramatically decreased coal consumption, leading to a decrease of nearly 17,600 metric tons of GHG emissions [30]. In 2020 and 2021, PepsiCo procured renewable electricity, encompassing solar and wind power, resulting in a 25 percent reduction in GHG emissions within Scopes 1 and 2 compared to the 2015 baseline [31]. Kellogg Company decreased its dependence on fossil energy through utilizing renewable power from sources such as wind and solar, 40.3% of the electricity consumed in Kellogg-owned manufacturing facilities worldwide was generated from renewable sources in 2022 [32].
Energy decarbonization presents a simpler avenue for food manufacturers to achieve carbon neutrality in Scope 2 compared to improving energy efficiency. Despite this advantage, many regions, including Vietnam, face challenges in accessing renewable electricity, which hinders the implementation of alternative solutions such as installing solar panels. High capital costs, inadequate electrical output, and extensive space requirements further complicate the adoption of these measures [33].

Improving Energy Efficiency in Processing

Process heat is reported to account for 60 to 70 percent of total energy consumption in food manufacturing facilities [24]. The food manufacturing industry widely adopts process optimization as a strategy to reduce power consumption, employing various approaches such as adjusting production schedules, staggering production time, improving equipment controls, and adopting continuous processing methods [34]. Through implementing basic process optimization techniques like insulation and routine maintenance inspections, the baking industry has the potential to save nearly 30 percent of power consumption, highlighting the effectiveness of adopting enhanced thermal management and waste heat recovery strategies as an approach to reducing power consumption [35,36]. Pinch analysis, a commonly used technique for improving thermal management, determines the minimum requirements for process heating and cooling [37]. It is estimated that pinch analysis can save approximately 50 percent of thermal energy in milk powder production [38].
Waste heat recovery, on the other hand, involves the recycling of squandered heat that would otherwise be wasted, and can be attained through the installation of heat exchangers and storage containers [39]. For instance, dairy plants can utilize waste heat to warm up feed water in a boiler, resulting in a 46 percent reduction in CO2 emissions and a 34 percent saving in energy expenses [40]. Another prevalent technique is combined heat and power, which integrates waste heat recovery with a conventional engine to generate electricity and heat simultaneously with high efficacy [39]. In a case report of an olive processing facility operating five days a week throughout the year, the implementation of combined heat and power technology, which combines the gasification of olive stone for heat generation and utilizes the synthesis gas in an internal combustion engine for energy production, led to a significant decrease in power consumption. This reduction was equivalent to a 50 percent reduction in CO2 emissions, and the calculated payback period was only 3.6 years [41].
Other techniques, such as high-pressure processing, ohmic heating, and microwave heating, also show great potential in enhancing food processing efficacy and diminishing energy consumption. Specifically, microwave heating has proven to be an efficient method for dehydration, defrosting, and pasteurization [42,43]. It can also be incorporated into hybrid processing techniques like microwave-assisted freezing [44].

Improving Logistics Strategies and Energy Efficiency in Transportation

Effective logistic strategies, such as a short food supply chain, have been shown to enhance the energy efficiency of food distribution [45]. The short food supply chain emphasizes localized production and employs dispersed manufacturing techniques, thereby reducing the distance between food production and consumption sites. This approach involves transporting only non-replaceable ingredients and sourcing the remaining components locally. Implementing this approach has been associated with decreased energy requirements for transportation, storage, and refrigeration, as reported in studies [46,47]. Nonetheless, a comparative analysis of energy expenditure between local and conventional food transportation systems has demonstrated comparable results, and even occasional instances where the conventional system outperforms the localized one [48].
Consumer transportation also contributes to GHG emissions, highlighting the significant role that consumers can play in reducing their carbon footprint [49]. While online purchasing is often perceived as less environmentally friendly than in-person shopping, a surprising study revealed that it could be more eco-friendly for vendors to deliver products to multiple households than for consumers to make numerous car trips [47]. This is because service vans can efficiently distribute goods to multiple residences in a single well-planned round trip, resulting in a potential reduction of onsite-purchasing-related emissions by 25 to 75 percent [50].
It is evident that proximity between producers and customers does not guarantee lower GHG emissions. Interestingly, online grocery shopping may reduce emissions and improve the energy efficiency of the food distribution system.

4.1.2. Environmental Impact of Food Packaging Choices

Food packaging plays an important role in ensuring the safe transportation of food over long distances. However, its environmental impact must be assessed according to considering factors, such as materials and weight that can influence GHG emissions. The selection of packaging material is particularly crucial since it can have unexpected and severe environmental consequences [51]. For example, replacing glass with plastic for infant food packaging can decrease GHG emissions by around 30 percent, while substituting metal cans with retort cups for tuna packaging resulted in a decrease in total GHG emissions of 10 to 22 percent [52,53]. Similarly, switching from recycled glass and non-recyclable bottles with recyclable stainless-steel barrels for beer packaging resulted in a reduction in GHG emissions by 93% and 96%, respectively [54].
Aside from the choice of packaging materials, the weight of food packaging can also influence the amount of GHG emissions generated [51]. The use of ultralight glass bottles, for instance, can help lessen production and transport-related emissions [55]. Similarly, reducing the weight of a wine bottle by 30 percent can lead to an overall decrease in GHG emissions of 4 to 23 percent [56].
Regarding the environmental impact of different packaging materials, plastic-based packaging generally has been shown to produce emissions of over 3 kg CO2 eq/kg, while cellulosic fiber-based packaging has emissions of under 1.5 kg CO2 eq/kg. Yet, fiber-based packaging may require more materials than plastic-based alternatives to achieve a similar level degree of protection [57]. The heavier weight of fiber-based packaging could partly offset its environmental advantages. Nevertheless, through optimizing design and thickness and using recycled materials in production, there are still opportunities to reduce the environmental impact of fiber-based packaging. Through making informed choices about packaging, the food industry can work towards reducing the overall environmental impact.

4.1.3. Carbon Capture and Utilization during Food Processing

Carbon capture and utilization (CCU) is recognized as a critical technology for reducing CO2 emissions. It involves capturing and repurposing CO2 to create valuable new products [58]. Currently, approximately 230 metric tons of CO2 are captured and utilized annually, with the majority used for urea production (about 130 metric tons) and improving oil recovery (about 80 metric tons) [59]. The food manufacturing industry, with its significant demand for CO2, holds promise as a viable sector for implementing CCU technology.
Carbon dioxide is extensively used in various food processing procedures in the food manufacturing industry. It is available commercially in different forms, such as high-pressure cylinder gas, low-pressure chilled liquid, and dry ice, and is commonly used as a chilling agent for food refrigeration. CO2 is utilized in various applications. It serves as a carbonating agent for beverages, an eluent in supercritical fluid extraction to produce decaffeinated coffee, a precipitant for casein, a producer of deoxygenated water, an atmosphere modifier for preserving the aroma and vitamins of packaged fruits and vegetables, and a stunning agent for animals before slaughter [60,61,62].
In the beverage industry, approximately 70 percent of all food-grade CO2 is needed. Considering the food manufacturing industry’s imposition of stringent purity requirements for CO2, captured CO2 can find application in various suitable areas, depending on its origin and level of purity [63,64]. For instance, CO2 captured from ammonia factories can be used in urea production, while CO2 captured from fermentation can be utilized in the beverage industry [58]. Carbon dioxide captured during alcoholic fermentation is especially valuable for the food manufacturing industry to carbonate drinks due to its high purity and compatible aroma [64]. Through reusing captured CO2, gas emissions from fermentation can be reduced, and fossil-based CO2 purchases can be minimized [65]. Another potential application of captured CO2 is in the production of succinic acid, where CO2 acts as a pH modifier, flavor enhancer, and antimicrobial agent [66].
In recent years, the food manufacturing industry has encountered a shortage of CO2 due to increased demand from the vaccine industries during the COVID-19 outbreak and the trend of reducing CO2 emissions [67]. Certain vaccines, such as the Pfizer-BioNTech vaccine, require storage at temperatures as low as −70°C, which exceeds the capacity of most typical freezers; the preferred option is the utilization of dry ice [68]. The increased demand for dry ice made from compressed and cooled liquid carbon dioxide thereby led to a shortage of carbon dioxide supply. To address the CO2 shortage issue, food manufacturers should explore the possibility of broadening their range of CO2 sources through CCU and purification techniques to obtain food-grade CO2 as a prospective solution. Although the brewery industry has been developing CCU technology to capture CO2 released during alcoholic fermentation, the current technology can only produce about a quarter of the required amount. Some breweries have resorted to importing CO2 through transoceanic shipments to alleviate the shortage, but unfortunately, this solution resulted in a significant increase in CO2 emissions and higher procurement costs [69,70].

4.2. Emissions from Scope 3 Upstream

The food industry is responsible for a significant portion of GHG emissions, mainly resulting from agricultural production and land use. It should be emphasized that these activities fall within the scope of Scope 3, and food manufacturing companies do not have direct control over them, making it difficult for them to mitigate their share of emissions. One way for companies to address this issue is to set appropriate performance criteria in their agricultural production contracts. These can include requirements for field surveillance of production activities and measuring GHG emissions, aiming to encourage upstream agricultural producers to reduce emissions [71]. Adopting emerging technologies is another approach for food manufacturers to transcend the traditional boundaries of the agriculture and food manufacturing industries for emission mitigation.

4.2.1. Environmental Considerations of Plant-Based Food

Plant-based foods require substantially less energy, water, and land compared to animal-derived protein products, resulting in reduced GHG emissions [47]. However, it is important not to overlook other environmental concerns associated with plant-based foods. Plant-based milk derived from soy, coconut, almonds, oats, or rice, for instance, generally has lower GHG emissions than dairy milk, but certain ingredients can pose additional environmental concerns [72]. Cultivating nuts, particularly almonds, in water-scarce regions can further deplete water resources [73]. Similarly, extensive cultivation of monoculture coconut can result in increased land use, biodiversity loss, and excessive use of fertilizers [74]. The production of rice also releases enormous amounts of methane, which has potent greenhouse effects [54]. Thus, while plant-based foods generally have lower carbon emissions than animal-based foods, it is necessary to consider other environmental impacts as well.

4.2.2. Pros and Cons of Cultured Meat Development

Cultured meat is a revolutionary technology claimed to have a small impact on the environment, particularly in terms of GHG emissions [75]. This technology enables the production of meat via cell culture in a bioreactor, eliminating the need for conventional livestock systems [76,77]. The application of cultured meat technology has resulted in the production of hamburger beef with very few cattle cells [78].
The biological concepts of cultured meat manufacturing are fully comprehended and evolved, and yet the technology for extensive manufacturing is still in its infancy [76]. A study by Lynch and Pierrehumbert [79] highlighted that cultured meat is not a long-term solution for climate change compared to beef. Initially, cultured meat produces fewer greenhouse gas emissions than beef, but this advantage diminishes over time due to its reliance on energy consumption that mainly produces CO2. Owing to the cumulative effect of CO2, cultured meat manufacturing can lead to greater warming compared to methane. Thus, to make cultured meat a promising GHG mitigation option, a high degree of decarbonized energy production is crucial.

4.2.3. Exploitation of Microbial Protein

Microbial foods derived from yeasts, fungi, and bacteria can be produced in bioreactors, minimizing the need for extensive land use. These microorganisms are cultivated using unique substrates such as carbon monoxide, methane, and waste streams from the food manufacturing industry, allowing for a sustainable source of protein [80,81,82]. Recent literature suggests that the utilization of microbial protein, exemplified through the use of Fusarium venenatum, offers meat substitutes that closely resemble the flavor and texture of chicken or beef, thereby holding significant potential in reducing GHG emissions [83,84]. Microbial biomass derived from waste water through nutrient recovery and anaerobic digestion results in a significant reduction of 96% GHG emissions, a substantial decrease of 99% in land use, and an 85% reduction in fresh water consumption compared to beef [85]. It has also been demonstrated that replacing one-fifth of ruminant proteins with microbial proteins cultivated on side streams of sugarcane mills could lessen GHG emissions related to deforestation and land use by half [86].

4.2.4. Mitigation Measures Taken by Agricultural Producers

In the food system, significant carbon emissions are generated in the Scope 3 upstream during the supply of agricultural raw materials. To mitigate these emissions, agricultural producers can adopt various measures, including soil carbon sequestration, livestock diet modification, and methane vaccination. Soil, which contains approximately 75 percent of the carbon reservoir in terrestrial ecosystems, surpasses the combined amount found in the atmosphere and vegetation [87,88]. Therefore, sequestering carbon from the atmosphere into soils is considered an essential strategy for emission reduction. In the case of a vineyard, vines are perennial crops that retain carbon in their permanent woody structures and the soil. Soil carbon sequestration can be enhanced through sustainable practices such as no-till farming and maintaining grass cover. The use of compost derived from vineyard residues can further contribute to the sequestration of carbon in the soil [89]. However, concerns about potential carbon loss from soils and its subsequent re-emission into the atmosphere remain [90].
The livestock sector has long sought ways to mitigate methane emissions from ruminants, and two effective approaches are diet modification and methane vaccination. In the former approach, incorporating nitrate and methane inhibitors into the diet, along with increasing the concentration of dietary lipids, have proven to be successful strategies for greatly mitigating enteric methane emissions [91,92]. The latter approach involves implementing methane vaccination, which has been found to be feasible for decreasing 5–20 percent of methane emissions through inhibiting methanogenic microorganisms in the rumen.

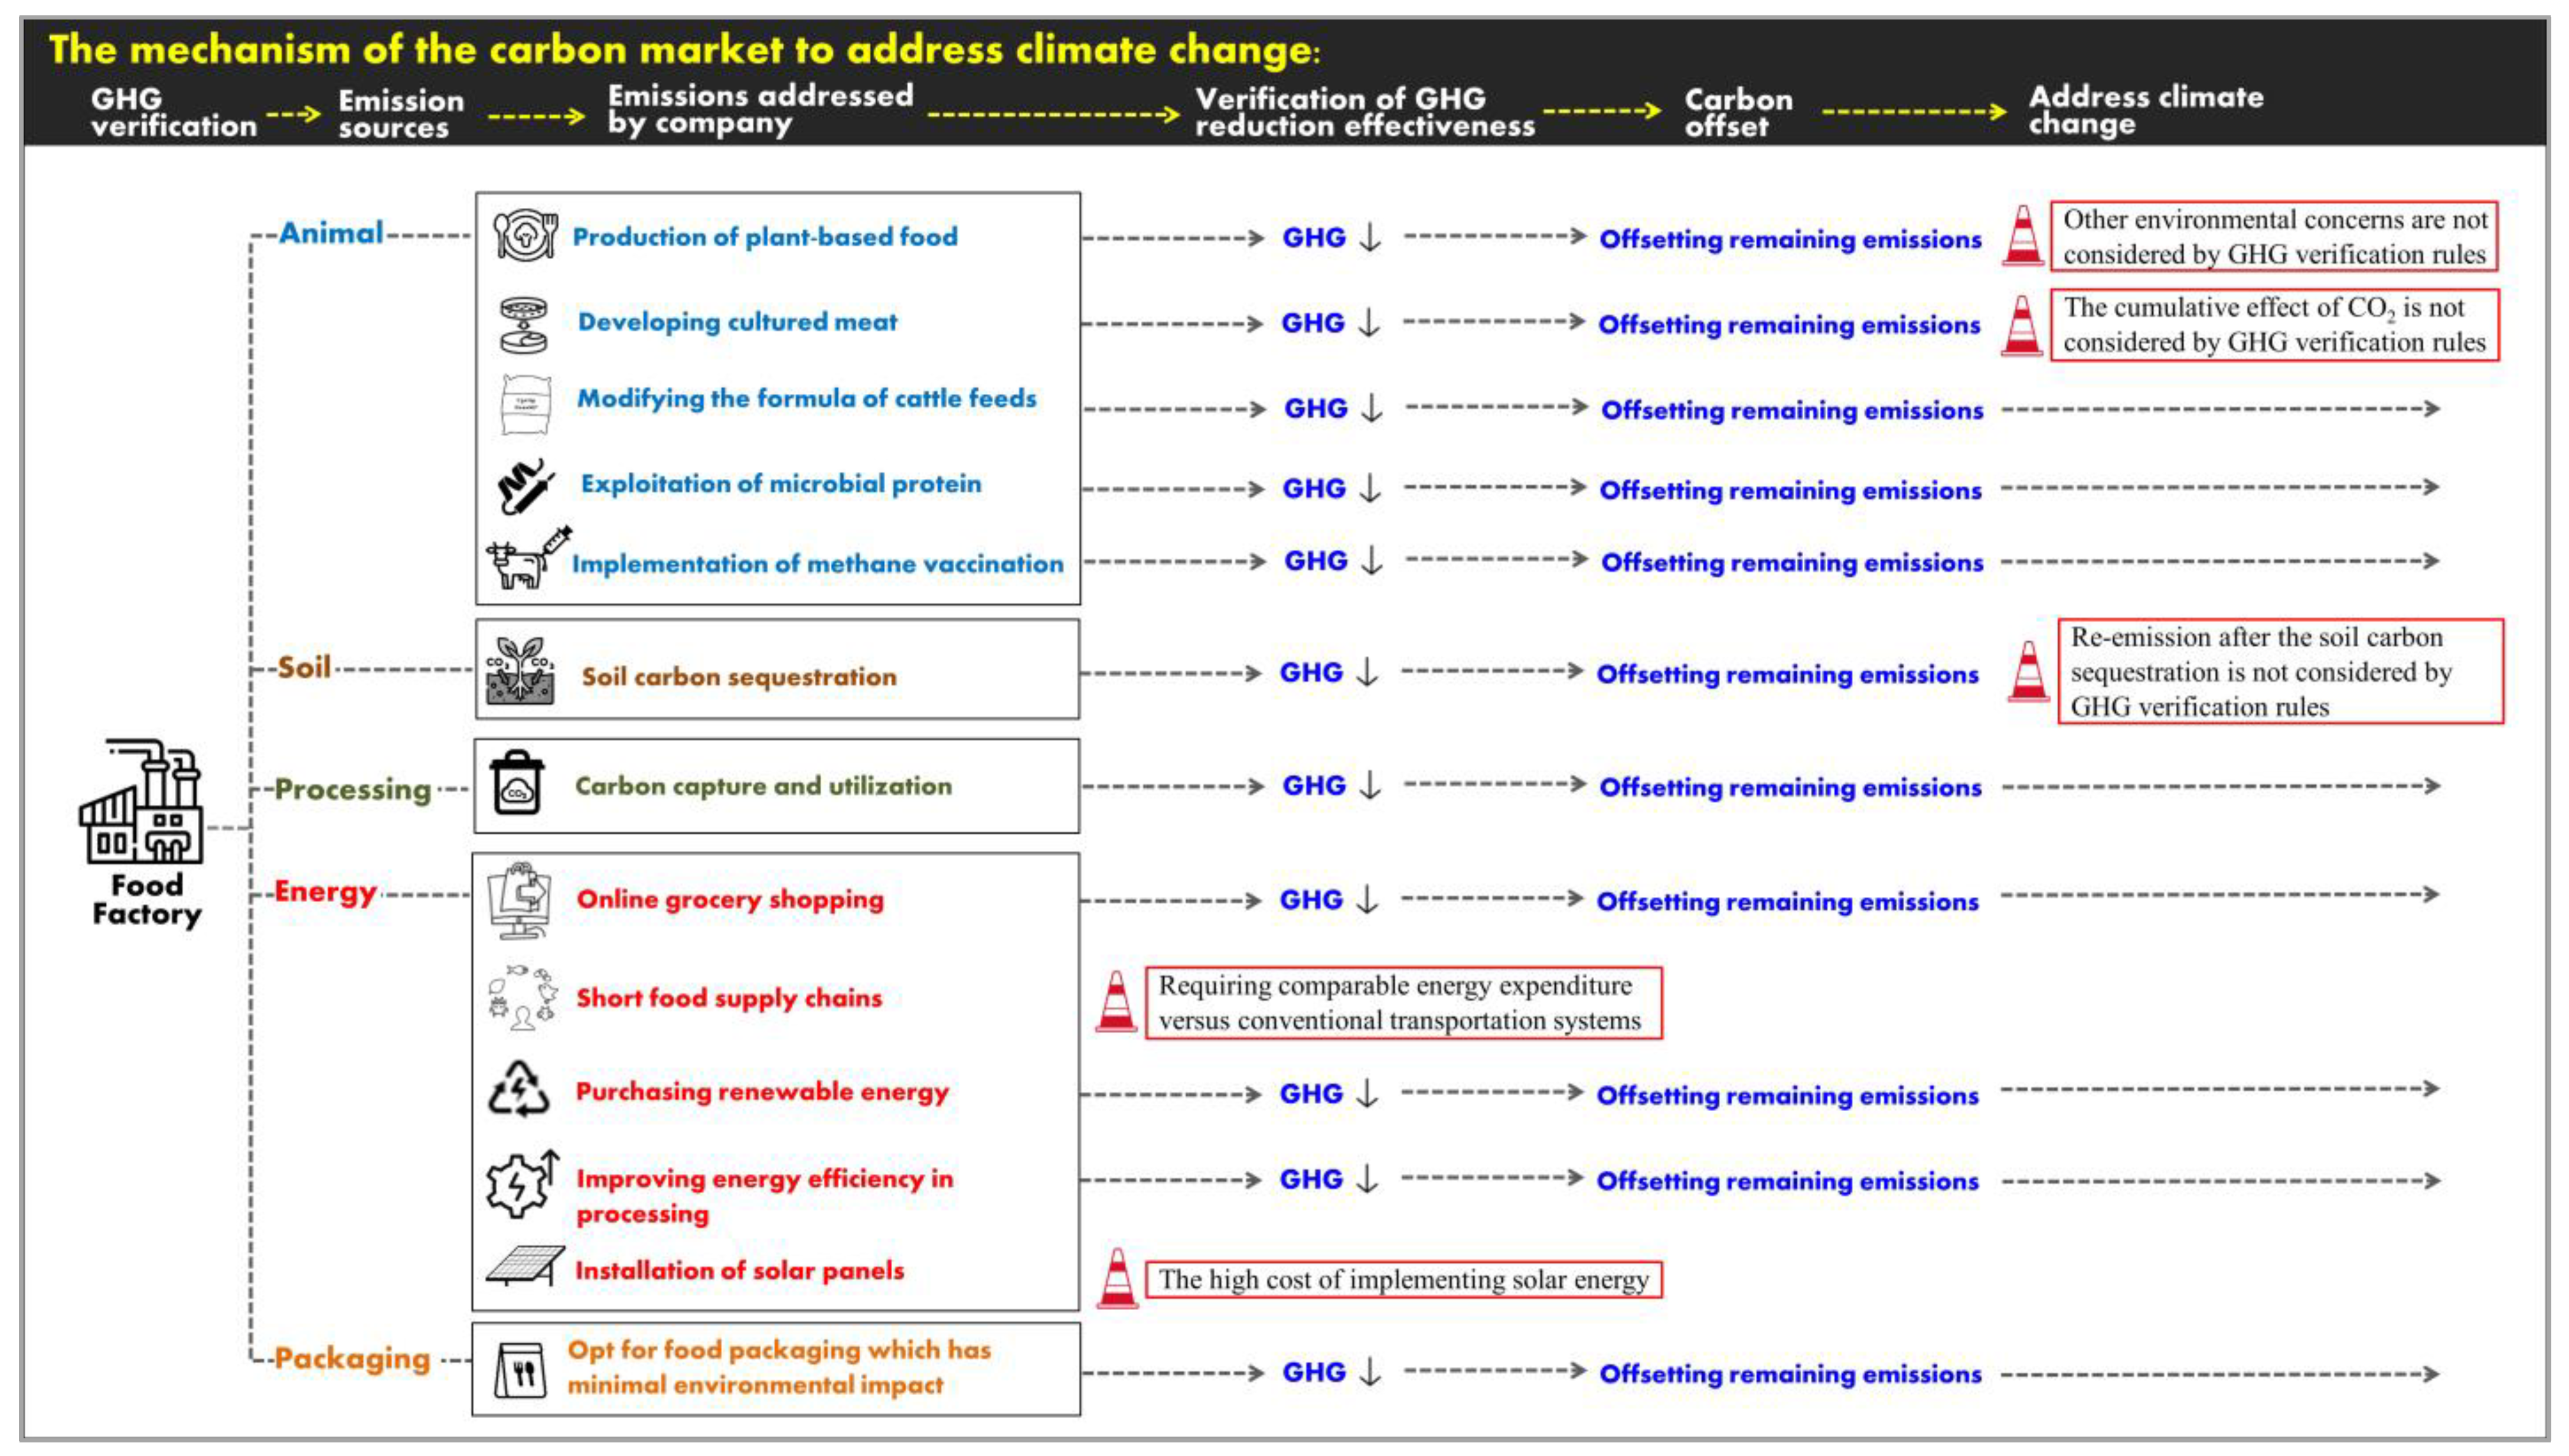
4.3. Possible Concerns during Implementing GHG Mitigation Measures

To address climate change, the introduction of carbon markets has prompted the food industry to adopt various emission reduction measures. While some of these measures have the potential to transform the food system and significantly reduce GHG emissions in the foreseeable future, it is important to recognize their limitations. Figure 5 illustrates the mechanism of the carbon market in reducing GHG emissions to address climate change. It also explores the involvement of food factories in this mechanism and their potential to contribute to addressing climate change. In the carbon market mechanism, the first step involves conducting a carbon inventory of emissions sources in food factories, which include animals, soil, processing, energy, and packaging. Subsequently, the food factories implement emission reduction measures, followed by a reassessment of GHG emissions to determine the extent of reduction achieved. Any remaining emissions that cannot be reduced are offset through carbon offsetting methods, ultimately contributing to addressing climate change. Figure 5 also provides a summary of the limitations of selected mitigation measures, indicating potential constraints that may hinder their effectiveness in addressing climate change.
If the costs of implementing these measures surpass carbon taxes, food manufacturers may be discouraged from voluntarily adopting them to reduce emissions, opting to simply pay the taxes. For instance, installing solar panels requires high capital costs, which may deter their selection as a viable mitigation measure for addressing the carbon market (Strategies for Achieving Energy Decarbonization section). It is crucial to highlight that smaller companies face even greater challenges in terms of financial constraints compared to larger corporations, making it more difficult for them to implement high-cost emission reduction measures. Furthermore, there are alternative measures available to reduce emissions, such as choosing low-carbon food packaging, developing cultured meat, implementing soil carbon sequestration, and producing plant-based food. Opting for low-carbon food packaging and offsetting the remaining emissions has the potential to mitigate climate change (Section 4.1.2). The development of cultured meat, implementation of soil carbon sequestration, and production of plant-based food appear to offer emission reduction benefits. Nevertheless, GHG verification methods cannot account for the cumulative effects of CO2 generated from cultured meat production (Section 4.2.2) and the amount of gas released into the atmosphere following carbon sequestration in the soil (Section 4.2.4). Since these verification methods solely focus on quantifying GHG emissions, it becomes difficult to discern if GHG abatement measures give rise to other environmental issues beyond the greenhouse effect, such as those caused by plant-based milk (Section 4.2.1). Therefore, while some measures may seemingly demonstrate emission reduction effects based on GHG verification, they are ultimately insufficient for effectively helping to address climate change.

5. Challenges in GHG Verification for the Food Industry

The carbon market is widely acknowledged as the predominant regulatory instrument for mitigating anthropogenic GHG emissions. Still, it is not immune to criticism, particularly with regard to the lack of a standardized methodology to verify GHG emissions, inaccuracies in data, and inadequate reporting of Scope 3 emissions. These concerns have the potential to create substantial barriers to carbon footprint reduction.

5.1. Unraveling the Veil of Uncertainties in Carbon Footprint

The term “carbon footprint” was coined by British Petroleum in 2004 when they introduced the first carbon footprint calculator as part of a marketing campaign [93]. Their calculators have gained widespread popularity as effective measures to reduce emissions. Estimating carbon footprints involves two main components: activity data that reflects human actions and emission factors that quantify the amount of GHGs released from those activities. Yet, obtaining accurate data is a daunting task given the multitude of factors involved.
The estimation of GHG emissions is a complicated process that requires consideration of numerous parameters. Specifically, when it comes to assessing emissions within Scope 3 of the food system, particularly those resulting from agricultural production and LUC, collecting data from these two sources necessitates careful consideration of multiple factors. These factors include emission levels per unit of land, as well as the capacity for gas production or uptake, which can lead to discrepancies in soil carbon emissions [94]. It is worth noting that when calculating emissions for a particular beef product, various influencing factors can result in a variation of up to 50 times in the calculated GHG emissions [54]. This highlights the challenges associated with accurately estimating emissions in the food system.
Although there have been different methods for assessing emissions in the past, it is clear that there is a need for a more convenient and user-friendly method of assessing carbon footprints. An example of an estimation system is the COMET-Farm tool [95], which enables farmers to calculate comprehensive GHG budgets at the farm scale for participation in mitigation projects [71]. The COMET-Farm tool allows farmers to select their current management practices and also the future practices they intend to implement. After completing the selection, the tool generates a report that compares the differences in GHG emissions between current and future management practices. Viewing from a different perspective, the presence of multiple carbon footprint estimation systems in the market suggests a lack of standardization in the estimation process.
There is a common assumption that accurate carbon footprints can be easily derived through utilizing model-based estimation systems. However, the practical calculation of carbon footprints involves a multitude of factors, which often necessitates the use of estimated and averaged values for the sake of convenience during the calculation process. It is important to note that the uncertainties associated with using such average emission factors are not always explicitly communicated.

5.2. Reporting Integrity of Scope 3 Emissions

When it comes to implementing the GHG verification process, the food manufacturing industry encounters significant hurdles, especially when dealing with Scope 3 emissions. Despite the fact that a substantial portion of emissions originates from Scope 3, many food manufacturing companies have incomplete and inconsistent reporting of GHG emissions from this scope. For example, although LUC emissions within Scope 3 are crucial contributors to GHG emissions in the food system, only 10% of the top 50 global food manufacturing companies explicitly report these emissions [1].
Given the alarming magnitude of Scope 3 emissions, it is necessary to strengthen or ensure the completeness of Scope 3 emissions reporting. Scope 3 emissions are divided into various categories (Figure 2), and one way to bolster the completeness of Scope 3 emissions reporting is to make the reporting of the most significant Scope 3 categories mandatory. The process of determining the categories to be included is crucial and can be achieved through implementing a cut-off criterion that establishes a threshold for significance. The GHG Protocol is a widely recognized accounting standard for GHG emissions. It considers categories with emissions exceeding 1% of a company’s total GHG emissions (on the basis of metric tonnes of carbon dioxide equivalents) to be significant [96]. For the top 50 food manufacturing companies, it is evident that emissions from the “purchased goods and services” category, which includes emissions from the production of agricultural commodities and associated LUCs, exceed 1% of these firms’ total emissions. In addition, the “processing of sold products” category and the “use of sold products” category, which includes emissions generated when consumers use the products, also exceed 1% of total emissions. As a result, all three categories are regarded as significant and require mandatory reporting [1].
Regarding reporting emissions, the “purchased goods and services” category poses significant challenges, primarily due to the lack of record-keeping practices among numerous agricultural producers and small family farms. This creates obstacles for food manufacturing companies in obtaining accurate GHG emissions data, which can be further compounded by the substantial funding required for verifying these emissions [97]. Despite these challenges, reporting emissions within the “purchased goods and services” category can have certain advantages, such as fostering collaborative emissions reduction efforts between food manufacturing companies and agricultural producers [98].
Reporting emissions within the “use of sold products” category poses unique challenges, especially when tracking emissions generated by consumers [97]. Given the difficulties that food manufacturing companies encounter in effectively engaging with consumers to reduce emissions, the benefits of reporting emissions within this category may be limited. Mandatory disclosure of categories that are difficult to verify and provide little benefit could lead to the inefficient allocation of limited resources, such as capital.
To be frank, the current development of a cut-off criterion fails to consider the specific needs of the food manufacturing industry. To ensure effective GHG verification and avoid unnecessary resource wastage, food manufacturers should consider directly specifying which categories must be mandatorily disclosed, rather than solely relying on a cut-off standard to identify significant categories. One suggestion is to prioritize mandatory reporting in the “purchased goods and services” category within the food industry. This category not only has the highest emissions among all categories but also the greatest potential for emission reduction. This approach would consolidate verification resources under this category, eliminating redundant waste and enhancing verification efficiency.

6. Pathways and Realities in Achieving Carbon Neutrality

In today’s era of heightened environmental awareness, the food industry has embraced the goal of achieving carbon neutrality or even net zero emissions. Carbon neutrality involves removing CO2, while net zero emissions entail the elimination of all greenhouse gases, including CO2 and other GHGs. A growing number of products claim to achieve carbon neutrality and give rise to the concept of “carbon-neutral food”. The idea of carbon-neutral food encompasses not only the reduction of GHG emissions but also the offsetting of remaining emissions.

6.1. Journey towards Carbon-Neutral Food

Over the past decade, many food companies have been striving towards the goal of achieving carbon-neutral food. However, some companies have faced real-world challenges and had to abandon their efforts, while others have accomplished their carbon neutrality objectives.
Nestlé’s chocolate brand has aimed for carbon neutrality by 2025 through reducing emissions by 50% and offsetting the remainder. They have supported this commitment through launching initiatives to protect forests in their cocoa supply chain, collaborating with farmers on regenerative practices, and reducing factory energy consumption while using renewable electricity sources like solar power [99]. As another example, Arla, a leading global dairy producer, has been committed to achieving carbon net zero worldwide by 2050. They have employed a range of strategies to reduce their carbon footprint, such as prioritizing renewable energy and waste reduction [100]. Additionally, Arla has implemented offsetting methods to address any remaining emissions.
Dole, one of the major producers of bananas and pineapples, had previously aimed to achieve carbon neutrality by 2021 through the implementation of programs focused on reducing GHG emissions from Dole’s farms and offsetting the remaining emissions [101]. Nevertheless, they encountered challenges during the implementation, particularly in terms of allocating costs for offsetting emissions, uncertainties surrounding consumer demand for carbon-neutral fruit, and the impact of the financial crisis [102]. Consequently, Dole made the decision to abandon their carbon neutrality goal [101].
Coopedota, in accordance with the PAS 2060 standard, has become the first cooperative to achieve carbon-neutral certification for its coffee [97]. Coffee, being a perennial crop, possesses significant potential for carbon sequestration, which can effectively reduce the costs associated with offsetting emissions [103]. It is important to note that soil carbon sequestration is not considered in the PAS 2060 GHG verification process [104]. Nevertheless, Coopedota has successfully implemented several effective strategies to meet the requirements for carbon neutrality, offering valuable insights for the food industry.
One of the challenges in obtaining carbon neutrality certification is the limited availability of data and information at the farm stage. Coopedota also faced similar challenges and addressed them through a strategic approach involving collaboration with farmers who had already adopted the Rainforest Alliance certification and possessed extensive experience in data collection [97]. This collaboration enabled Coopedota’s farmers to access reliable information during coffee cultivation and management, thereby enhancing their capabilities. Coopedota also implemented various emission mitigation strategies at the farm stage, including the application of site-specific fertilizer and slow-release nitrogen fertilizers, as well as the enhancement of resource use efficiency [105]. At the mill stage of coffee production, they incorporated renewable energy sources like biogas. Additionally, they improved energy efficiency via adopting more efficient automatic ovens and via composting pulp waste instead of fermenting it, resulting in minimized emissions [106].
It is worth noting that Coopedota had certain inherent advantages in their implementation. For instance, Coopedota’s coffee farms, established for over 50 years, can exclude the considerable emissions resulting from LUC according to PAS 2050 guidelines, as LUC occurring over a period exceeding 20 years is exempt from carbon footprint assessment [97,104]. Despite the above efforts and advantages, achieving carbon neutrality remained elusive, and Coopedota ultimately offset the remaining emissions through purchasing carbon credits. This highlights the substantial challenges involved in successfully achieving carbon neutrality in the food industry.

6.2. Carbon-Neutral Foods: Fact or Fiction?

Considering the aforementioned pursuit of carbon-neutral food, it is evident that achieving carbon neutrality presents significant difficulties. However, the presence of many food products claiming to be carbon neutral in the market raises concerns about greenwashing. The term “greenwashing” refers to behavior or activities, such as exaggerated claims and carbon offsetting practices, that mislead people into believing that a company is doing more to protect the environment than it truly is. This includes making vague environmental assertions that do not align with actual practices, which are a form of greenwashing behavior employed by certain companies. In early 2023, Arla faced allegations and received an injunction from a Swedish court due to making exaggerated claims on their product packaging [107]. The court specifically prohibited Arla from using the phrase “net-zero climate footprint” in their marketing for products sold in the country. This decision was based on the court’s concern about consumers’ interpretation of Arla’s commitment to achieving net zero through climate-compensating activities, which may take up to a century to fully offset the GHG emissions of their products.
Carbon offsetting practices, often criticized as a form of greenwashing, are frequently viewed as enabling companies to simply pay for their emissions without making substantial changes to their production processes or adopting environmentally friendly solutions [108]. Moreover, it should be noted that the effectiveness of carbon offsetting practices, which heavily rely on tree planting, is not guaranteed to provide compensatory effects. Forestry projects are susceptible to various factors that can jeopardize their success, including drought, logging, and fires, which can potentially release temporarily sequestered carbon. Objectively speaking, offsetting is not a solution to climate change since it does not directly reduce emissions. While it can serve as a temporary stopgap measure to reduce carbon footprint numbers, it is essentially a numbers game, and its true significance deserves further consideration. This criticism raises a valid question: Can true carbon neutrality be achieved without relying on carbon offsetting practices?
All the cases mentioned above have actually implemented carbon offsetting practices. In the case of Coopedota coffee, which possesses inherent advantages such as LUC, Coopedota still needed to purchase carbon credits for offsetting in order to obtain carbon neutrality certification. This highlights the fact that even with notable accomplishments, carbon offsetting may remain an integral part of the process to attain carbon neutrality certification.
Clearly, at the current stage, achieving carbon neutrality without relying on carbon offsetting presents a significant challenge for the entire food industry. Even before delving into the debate about whether a product can truly achieve carbon neutrality without offsetting, there is a fundamental issue of a lack of universally accepted standards and accurate reference points for measuring carbon footprints. This inconsistency and lack of consensus make it impossible to ascertain the true accuracy of a product’s carbon footprint calculation.
Considering these concerns, the European Consumer Organization has urged the European Union to prohibit the use of carbon-neutral claims for food and drink products [109].

7. Conclusions and Future Directions

Given the substantial GHG emissions originating from the food system, it is imperative for the food industry to actively reduce its GHG emissions. The industry’s active engagement in pursuing carbon neutrality, as demonstrated through the development of various carbon-neutral food products, showcases its ambitious endeavors to mitigate emissions. Vigilance is crucial to guard against greenwashing as the food industry strives for genuine sustainability. To make a meaningful impact, the food industry’s members should prioritize genuine sustainability and surpass superficial greenwashing practices.
Both GHG verification and GHG emission mitigation are crucial factors in achieving genuine sustainability. Standardized methodologies and accurate databases for calculating the carbon footprint are of utmost importance in GHG verification. Additionally, enhancing the completeness of Scope 3 emissions reporting is necessary, considering the alarming magnitude of Scope 3 emissions.
When implementing measures to mitigate GHG emissions, the food industry must address not only direct emissions (Scope 1) and indirect emissions from energy consumption (Scope 2), but also the significant carbon footprint embedded in Scope 3, particularly in agricultural production and LUC emissions. The food industry has already taken steps to mitigate emissions in Scope 1 and Scope 2, including transitioning to decarbonized energy sources, improving energy efficiency in processing and transportation, minimizing the environmental impact of food packaging, and adopting carbon capture technology. Encouraging and collaborating with agricultural producers to substantially reduce emissions is another crucial approach to address Scope 3 emissions.
Emissions in Scope 1 and Scope 2 are areas that food factories have better control over and can effectively reduce. However, small food companies face limitations in reducing emissions within these scopes due to the high cost associated with implementing such measures. For instance, upgrading to more energy-efficient equipment or installing solar panels requires substantial financial resources. To address Scope 1 emissions, changing food packaging to more environmentally friendly options may be the most feasible and cost-effective approach for small companies. Considering that agriculture in Scope 3 upstream is generally the largest emission source for companies, the most effective emission reduction strategy for small companies is to collaborate with experienced farmers who have already implemented emission reduction practices or directly procure low-carbon raw materials. When small food companies embark on emission reduction initiatives, it is worth noting that their primary focus should be on emissions control rather than aiming for net-zero emissions. This is because achieving net-zero emissions is a challenging goal even for larger companies.
Actively implementing comprehensive measures to reduce emissions, improve the accuracy of carbon footprint calculation, strengthen Scope 3 emissions reporting, and foster collaboration within the entire food system is essential. These collective efforts by the food industry are considered potential solutions to addressing climate change. In the future, they can pave the way for the food industry to achieve genuine sustainability, moving away from greenwashing practices and becoming a catalyst for positive change.

Author Contributions

Conceptualization, C.-F.C. and T.-C.L.; writing—original draft preparation, T.-C.L., Y.-C.W. and C.-F.C.; writing—review and editing, T.-C.L., Y.-C.W. and C.-F.C.; supervision, C.-F.C. All authors have read and agreed to the published version of the manuscript.

Funding

This research received no external funding.

Data Availability Statement

Not applicable.

Conflicts of Interest

All contributing authors declare no conflict of interest.

References

  1. Hansen, A.D.; Kuramochi, T.; Wicke, B. The status of corporate greenhouse gas emissions reporting in the food sector: An evaluation of food and beverage manufacturers. J. Clean. Prod. 2022, 361, 132279. [Google Scholar] [CrossRef]
  2. Crippa, M.; Solazzo, E.; Guizzardi, D.; Monforti-Ferrario, F.; Tubiello, F.N.; Leip, A.J.N.F. Food systems are responsible for a third of global anthropogenic GHG emissions. Nat. Food 2021, 2, 198–209. [Google Scholar] [CrossRef] [PubMed]
  3. Reavis, M.; Ahlen, J.; Rudek, J.; Naithani, K. Evaluating Greenhouse Gas Emissions and Climate Mitigation Goals of the Global Food and Beverage Sector. Front. Sustain. Food Syst. 2022, 5, 530. [Google Scholar] [CrossRef]
  4. COP26: Participants Recognise Need for Sustainable Food Systems to Ensure Global Food Security and Achieve Climate Objectives. Available online: https://agriculture.ec.europa.eu/news/cop26-participants-recognise-need-sustainable-food-systems-ensure-global-food-security-and-achieve-2021-11-09_en (accessed on 22 June 2023).
  5. Demir, E.; Bektaş, T.; Laporte, G. A comparative analysis of several vehicle emission models for road freight transportation. Transp. Res. Part D Transp. Environ. 2011, 16, 347–357. [Google Scholar] [CrossRef]
  6. Prakash, J.; Habib, G.A. technology-based mass emission factors of gases and aerosol precursor and spatial distribution of emissions from on-road transport sector in India. Atmos. Environ. 2018, 180, 192–205. [Google Scholar] [CrossRef]
  7. Jóhannesson, S.E.; Heinonen, J.; Davíðsdóttir, B. Data accuracy in Ecological Footprint’s carbon footprint. Ecol. Indic. 2020, 111, 105983. [Google Scholar] [CrossRef]
  8. VijayaVenkataRaman, S.; Iniyan, S.; Goic, R. A review of climate change, mitigation and adaptation. Renew. Sustain. Energy Rev. 2012, 16, 878–897. [Google Scholar] [CrossRef]
  9. Climate Change 2022: Impacts, Adaptation and Vulnerability. Available online: https://www.ipcc.ch/report/ar6/wg2/downloads/report/IPCC_AR6_WGII_SummaryForPolicymakers.pdf (accessed on 15 May 2023).
  10. AR4 Climate Change 2007: The Physical Science Basis. Available online: https://www.ipcc.ch/site/assets/uploads/2018/02/ar4-wg1-spm-1.pdf (accessed on 18 April 2023).
  11. Global Warming of 1.5 °C. Available online: https://www.ipcc.ch/site/assets/uploads/sites/2/2019/06/SR15_Full_Report_High_Res.pdf (accessed on 14 May 2023).
  12. Carbon Border Adjustment Mechanism. Available online: https://taxation-customs.ec.europa.eu/green-taxation-0/carbon-border-adjustment-mechanism_en. (accessed on 8 May 2023).
  13. 2022 Global Food Policy Report: Climate Change and Food Systems. Available online: https://reliefweb.int/report/world/2022-global-food-policy-report-climate-change-and-food-systems (accessed on 21 February 2023).
  14. Steamy Relationships: How Atmospheric Water Vapor Amplifies Earth’s Greenhouse Effect. Available online: https://climate.nasa.gov/explore/ask-nasa-climate/3143/steamy-relationships-how-atmospheric-water-vapor-amplifies-earths-greenhouse-effect (accessed on 19 May 2023).
  15. Wang, J.; Jin, S.; Bai, W.; Li, Y.; Jin, Y. Comparative analysis of the international carbon verification policies and systems. Nat. Hazards 2016, 84, 381–397. [Google Scholar] [CrossRef] [Green Version]
  16. Tubiello, F.N.; Karl, K.; Flammini, A.; Gütschow, J.; Obli-Laryea, G.; Conchedda, G.; Pan, X.; Qi, S.Y.; Heiðarsdóttir, H.H.; Wanner, N.; et al. Pre- and post-production processes increasingly dominate greenhouse gas emissions from agri-food systems. Earth Syst. Sci. Data 2022, 14, 1795–1809. [Google Scholar] [CrossRef]
  17. Tubiello, F.N.; Rosenzweig, C.; Conchedda, G.; Karl, K.; Gütschow, J.; Xueyao, P.; Laryea, G.O.; Wanner, N.; Qiu, S.Y.; Barros, J.D.; et al. Greenhouse gas emissions from food systems: Building the evidence base. Environ. Res. Lett. 2021, 16, 065007. [Google Scholar] [CrossRef]
  18. Energy. Available online: https://www.fao.org/energy/home/en (accessed on 19 May 2023).
  19. ISO 14064-1:2018. Available online: https://www.iso.org/standard/66453.html (accessed on 4 June 2023).
  20. ISO 14067:2018. Available online: https://www.iso.org/standard/71206.html (accessed on 21 March 2023).
  21. Wang, S.; Wang, W.; Yang, H. Comparison of product carbon footprint protocols: Case study on medium-density fiberboard in China. Int. J. Environ. Res. Public Health 2018, 15, 2060. [Google Scholar] [CrossRef] [Green Version]
  22. PAS 2060 Carbon Neutrality. Available online: https://www.bsigroup.com/en-GB/pas-2060-carbon-neutrality/ (accessed on 24 June 2023).
  23. Carbon Neutral Verification. Available online: https://www.carbontrust.com/what-we-do/assurance-and-labelling/carbon-neutral-verification (accessed on 13 May 2023).
  24. Ladha-Sabur, A.; Bakalis, S.; Fryer, P.J.; Lopez-Quiroga, E. Mapping energy consumption in food manufacturing. Trends Food Sci. Technol. 2019, 86, 270–280. [Google Scholar] [CrossRef]
  25. Szczepaniak, I.; Szajner, P. Challenges of Energy Management in the Food Industry in Poland in the Context of the Objectives of the European Green Deal and the “Farm to Fork” Strategy. Energies 2022, 15, 9090. [Google Scholar] [CrossRef]
  26. Shabir, I.; Dash, K.K.; Dar, A.H.; Pandey, V.K.; Fayaz, U.; Srivastava, S.; Nisha, R. Carbon footprints evaluation for sustainable food processing system development: A comprehensive review. Future Foods 2023, 7, 100215. [Google Scholar] [CrossRef]
  27. Glasgow Climate Pact. Available online: https://unfccc.int/sites/default/files/resource/cop26_auv_2f_cover_decision.pdf (accessed on 17 April 2023).
  28. Acampora, A.; Ruini, L.; Mattia, G.; Pratesi, C.A.; Lucchetti, M.C. Towards carbon neutrality in the agri-food sector: Drivers and barriers. Resour. Conserv. Recycl. 2023, 189, 106755. [Google Scholar] [CrossRef]
  29. Nestlé and European Clean Trucking Alliance Call for More Sustainable Road Freight. Available online: https://www.nestle.com/media/news/nestle-european-clean-trucking-alliance-sustainable-road-freight (accessed on 15 July 2020).
  30. Cargill Songyuan is Ushering in a Greener Energy Future with Rice Husk and Renewables. Available online: https://www.cargill.com/sustainability/cargill-songyuan-is-ushering-in-a-greener-energy-future (accessed on 9 May 2023).
  31. Renewable Energy. Available online: https://www.pepsico.com/our-impact/esg-topics-a-z/renewable-energy (accessed on 23 November 2022).
  32. Renewable Electricity. Available online: https://betterdays.kelloggcompany.com/renewable-electricity (accessed on 16 June 2023).
  33. Müller, H.; Brandmayr, S.; Zörner, W. Development of an evaluation methodology for the potential of solar-thermal energy use in the food industry. Energy Procedia 2014, 48, 1194–1201. [Google Scholar] [CrossRef] [Green Version]
  34. González-Ramírez, J.E.; Leducq, D.; Arellano, M.; Alvarez, G. Energy consumption optimization of a continuous ice cream process. Energy Convers. Manag. 2013, 70, 230–238. [Google Scholar] [CrossRef]
  35. Muster-Slawitsch, B.; Brunner, C.; Fluch, J. Application of an advanced pinch methodology for the food and drink production. Wiley Interdiscip. Rev. Energy Environ. 2014, 3, 561–574. [Google Scholar] [CrossRef]
  36. Pask, F.; Sadhukhan, J.; Lake, P.; McKenna, S.; Perez, E.B.; Yang, A. Systematic approach to industrial oven optimisation for energy saving. Appl. Therm. Eng. 2014, 71, 72–77. [Google Scholar] [CrossRef]
  37. Ahmed, J.; Rahman, M.S. Handbook of Food Process Design, 2nd ed; Wiley-Blackwell: Hoboken, NJ, USA, 2012; pp. 299–333. [Google Scholar]
  38. Walmsley, T.G.; Atkins, M.J.; Walmsley, M.R.; Philipp, M.; Peesel, R.H. Process and utility systems integration and optimisation for ultra-low energy milk powder production. Energy 2018, 146, 67–81. [Google Scholar] [CrossRef]
  39. Meyers, S.; Schmitt, B.; Chester-Jones, M.; Sturm, B. Energy efficiency, carbon emissions, and measures towards their improvement in the food and beverage sector for six European countries. Energy 2016, 104, 266–283. [Google Scholar] [CrossRef]
  40. Singh, S.; Dasgupta, M.S. CO2 heat pump for waste heat recovery and utilization in dairy industry with ammonia based refrigeration. Int. J. Refrig. 2017, 78, 108–120. [Google Scholar] [CrossRef]
  41. Celma, A.R.; Blázquez, F.C.; López-Rodríguez, F. Feasibility analysis of CHP in an olive processing industry. J. Clean. Prod. 2013, 42, 52–57. [Google Scholar] [CrossRef]
  42. Barba, F.J.; Orlien, V.; Mota, M.J.; Lopes, R.P.; Pereira, S.A.; Saraiva, J.A. Implementation of emerging technologies. In Innovation Strategies in the Food Industry, 1st ed.; Charis, M.G., Ed.; Academic Press: Cambridge, MA, USA, 2016; Volume 12345, pp. 130–139. [Google Scholar]
  43. Atuonwu, J.C.; Leadley, C.; Bosman, A.; Tassou, S.A.; Lopez-Quiroga, E.; Fryer, P.J. Comparative assessment of innovative and conventional food preservation technologies: Process energy performance and greenhouse gas emissions. Innov. Food Sci. Emerg. Technol. 2018, 50, 174–187. [Google Scholar] [CrossRef] [Green Version]
  44. Xanthakis, E.; Huen, J.; Eliasson, L.; Jha, P.K.; Le-Bail, A.; Shrestha, M. Evaluation of microwave assisted freezing (MAF) impact on meat and fish matrices. In Proceedings of the 5th IIR Conference on Sustainability and the Cold Chain, Beijing, China, 6–8 May 2018. [Google Scholar]
  45. Mundler, P.; Rumpus, L. The energy efficiency of local food systems: A comparison between different modes of distribution. Food Policy 2012, 37, 609–615. [Google Scholar] [CrossRef]
  46. Torquati, B.; Taglioni, C.; Cavicchi, A. Evaluating the CO2 emission of the milk supply chain in Italy: An exploratory study. Sustainability 2015, 7, 7245–7260. [Google Scholar] [CrossRef] [Green Version]
  47. Sovacool, B.K.; Bazilian, M.; Griffiths, S.; Kim, J.; Foley, A.; Rooney, D. Decarbonizing the food and beverages industry: A critical and systematic review of developments, sociotechnical systems and policy options. Renew. Sustain. Energy Rev. 2021, 143, 110856. [Google Scholar] [CrossRef]
  48. Cleveland, D.A.; Radka, C.N.; Müller, N.M.; Watson, T.D.; Rekstein, N.J.; Van, M. Wright, H.; Hollingshead, S.E. Effect of localizing fruit and vegetable consumption on greenhouse gas emissions and nutrition, Santa Barbara County. Environ. Sci. Technol. 2011, 45, 4555–4562. [Google Scholar] [CrossRef]
  49. Paciarotti, C.; Torregiani, F. The logistics of the short food supply chain: A literature review. Sustain. Prod. Consum. 2021, 26, 428–442. [Google Scholar] [CrossRef]
  50. Coronavirus vs. Climate Change. Available online: https://spectrum.ieee.org/covid19-pandemic-reduce-greenhouse-gas-emissions (accessed on 22 March 2023).
  51. Xu, Z.; Sun, D.W.; Zeng, X.A.; Liu, D.; Pu, H. Research developments in methods to reduce the carbon footprint of the food system: A review. Crit. Rev. Food Sci. Nutr. 2015, 55, 1270–1286. [Google Scholar] [CrossRef]
  52. Humbert, S.; Rossi, V.; Margni, M.; Jolliet, O.; Loerincik, Y. Life cycle assessment of two baby food packaging alternatives: Glass jars vs. plastic pots. Int. J. Life Cycle Assess. 2009, 14, 95–106. [Google Scholar] [CrossRef] [Green Version]
  53. Poovarodom, N.; Ponnak, C.; Manatphrom, N. Comparative carbon footprint of packaging systems for tuna products. Packag. Technol. Sci. 2012, 25, 249–257. [Google Scholar] [CrossRef]
  54. Poore, J.; Nemecek, T. Reducing food’s environmental impacts through producers and consumers. Science 2018, 360, 987–992. [Google Scholar] [CrossRef] [PubMed] [Green Version]
  55. Martins, A.A.; Araújo, A.R.; Graça, A.; Caetano, N.S.; Mata, T.M. Towards sustainable wine: Comparison of two Portuguese wines. J. Clean. Prod. 2018, 183, 662–676. [Google Scholar] [CrossRef]
  56. Point, E.; Tyedmers, P.; Naugler, C. Life cycle environmental impacts of wine production and consumption in Nova Scotia, Canada. J. Clean. Prod. 2012, 27, 11–20. [Google Scholar] [CrossRef]
  57. Schenker, U.; Chardot, J.; Missoum, K.; Vishtal, A.; Bras, J. Short communication on the role of cellulosic fiber-based packaging in reduction of climate change impacts. Carbohydr. Polym. 2021, 254, 117248. [Google Scholar] [CrossRef]
  58. Mikulčić, H.; Skov, I.R.; Dominković, D.F.; Alwi, S.R.W.; Manan, Z.A.; Tan, R.; Duić, N.; Hidayah Mohamad, S.N.; Wang, X. Flexible Carbon Capture and Utilization technologies in future energy systems and the utilization pathways of captured CO2. Renew. Sustain. Energy Rev. 2019, 114, 109338. [Google Scholar] [CrossRef]
  59. CO2 Carbon Capture and Utilisation. Available online: https://www.iea.org/reports/co2-capture-and-utilisation (accessed on 13 May 2023).
  60. Aresta, M.; Dibenedetto, A. Artificial carbon sinks: Utilization of carbon dioxide for the synthesis of chemicals and technological applications. In Greenhouse Gas Sinks, 1st ed.; Reay, D.S., Hewitt, C.N., Smith, K.A., Grace, J., Eds.; CABI: Wallingford, UK, 2007; pp. 98–114. [Google Scholar]
  61. The Beverage Industry Is the Largest User of the Carbon Dioxide Market. Available online: https://ccu-news.info/the-beverage-industry-is-the-largest-user-of-the-carbon-dioxide-market (accessed on 28 November 2022).
  62. Food and Drink Processing and Packing. Available online: https://www.processsensing.com/en-us/industries/food-and-beverage-processing.htm (accessed on 1 October 2022).
  63. Spigarelli, B.P.; Kawatra, S.K. Opportunities and challenges in carbon dioxide capture. J. CO2 Util. 2013, 1, 69–87. [Google Scholar] [CrossRef]
  64. IL Recupero della CO2 di Fermentazione (CO2 recovery from fermentation). Available online: http://www.viten.net/files/d6d/d6def1c7bdc441b61e9f82a986286ca3.pdf (accessed on 19 June 2022).
  65. Galileo. Available online: https://www.enomet.it/prodotti-enomet/galileo (accessed on 23 September 2020).
  66. Zhang, Q.; Cheng, C.L.; Nagarajan, D.; Chang, J.S.; Hu, J.; Lee, D.J. Carbon capture and utilization of fermentation CO2: Integrated ethanol fermentation and succinic acid production as an efficient platform. Appl. Energy 2017, 206, 364–371. [Google Scholar] [CrossRef]
  67. What the CO2 Shortage Means for Beer, Hard Seltzer and Other Drinks? Available online: https://www.winemag.com/2022/11/02/carbon-dioxide-shortage (accessed on 26 December 2022).
  68. Short CO₂ Supply May Complicate COVID-19 Vaccine Rollout. Available online: https://cen.acs.org/business/Short-CO2-supply-complicate-COVID/98/i45 (accessed on 7 February 2023).
  69. New System to Capture and Reuse CO2 from Fermentations. Available online: https://www.internationalwinechallenge.com/Canopy-Articles/new-system-to-capture-and-reuse-co2-from-fermentations.html (accessed on 23 December 2022).
  70. New Zealand Breweries See CO2 Rationing as Shortage Hits. Available online: https://www.reuters.com/business/new-zealand-breweries-see-co2-rationing-shortage-hits-2023-01-10/ (accessed on 20 January 2023).
  71. Paustian, K.; Lehmann, J.; Ogle, S.; Reay, D.; Robertson, G.P.; Smith, P. Climate-smart soils. Nature 2016, 532, 49–57. [Google Scholar] [CrossRef] [Green Version]
  72. Macdiarmid, J.I. The food system and climate change: Are plant-based diets becoming unhealthy and less environmentally sustainable? Proc. Nutr. Soc. 2022, 81, 162–167. [Google Scholar] [CrossRef]
  73. Clark, M.A.; Springmann, M.; Hill, J.; Tilman, D. Multiple health and environmental impacts of foods. Proc. Natl. Acad. Sci. USA 2019, 116, 23357–23362. [Google Scholar] [CrossRef] [PubMed] [Green Version]
  74. Magrach, A.; Sanz, M.J. Environmental and social consequences of the increase in the demand for ‘superfoods’ world-wide. People Nat. 2020, 2, 267–278. [Google Scholar] [CrossRef]
  75. Post, M.J. Cultured meat from stem cells: Challenges and prospects. Meat Sci. 2012, 92, 297–301. [Google Scholar] [CrossRef]
  76. Munteanu, C.; Mireşan, V.; Răducu, C.; Ihuţ, A.; Uiuiu, P.; Pop, D.; Neacşu, A.; Cenariu, M.; Groza, I. Can cultured meat be an alternative to farm animal production for a sustainable and healthier lifestyle? Front. Nutr. 2021, 8, 749298. [Google Scholar] [CrossRef] [PubMed]
  77. Stephens, N.; Di Silvio, L.; Dunsford, I.; Ellis, M.; Glencross, A.; Sexton, A. Bringing cultured meat to market: Technical, socio-political, and regulatory challenges in cellular agriculture. Trends Food Sci. Technol. 2018, 78, 155–166. [Google Scholar] [CrossRef]
  78. Growing Beef. Available online: https://mosameat.com/growing-beef (accessed on 11 April 2023).
  79. Lynch, J.; Pierrehumbert, R. Climate impacts of cultured meat and beef cattle. Front. Sustain. 2019, 3, 5. [Google Scholar] [CrossRef] [Green Version]
  80. Martínez, J.B.G.; Egbejimba, J.; Throup, J.; Matassa, S.; Pearce, J.M.; Denkenberger, D.C. Potential of microbial protein from hydrogen for preventing mass starvation in catastrophic scenarios. Sustain. Prod. Consum. 2021, 25, 234–247. [Google Scholar] [CrossRef]
  81. Acosta, N.; Sakarika, M.; Kerckhof, F.M.; Law, C.K.Y.; De Vrieze, J.; Rabaey, K. Microbial protein production from methane via electrochemical biogas upgrading. J. Chem. Eng. 2020, 391, 123625. [Google Scholar] [CrossRef]
  82. Sharma, S.; Hansen, L.D.; Hansen, J.Ø.; Mydland, L.T.; Horn, S.J.; Øverland, M.; Eijsink, V.G.H.; Vuoristo, K.S. Microbial protein produced from brown seaweed and spruce wood as a feed ingredient. J. Agric. Food Chem. 2018, 66, 8328–8335. [Google Scholar] [CrossRef]
  83. Jahn, L.J.; Rekdal, V.M.; Sommer, M.O. Microbial foods for improving human and planetary health. Cell 2023, 186, 469–478. [Google Scholar] [CrossRef]
  84. Fellows, P.J. Food biotechnology. In Food Processing Technology, 4th ed.; Fellows, P.J., Ed.; Elsevier: Amsterdam, The Netherlands, 2016; Chapter 6; pp. 387–430. [Google Scholar]
  85. Durkin, A.; Finnigan, T.; Johnson, R.; Kazer, J.; Yu, J.; Stuckey, D.; Guo, M. Can closed-loop microbial protein provide sustainable protein security against the hunger pandemic? Curr. Res. Biotechnol. 2022, 4, 365–376. [Google Scholar] [CrossRef]
  86. Humpenöder, F.; Bodirsky, B.L.; Weindl, I.; Lotze-Campen, H.; Linder, T.; Popp, A. Projected environmental benefits of replacing beef with microbial protein. Nature 2022, 605, 90–96. [Google Scholar] [CrossRef]
  87. Hsu, C.C.; Tsai, H.; Huang, W.S.; Huang, S.T. Carbon Storage along with Soil Profile: An Example of Soil Chronosequence from the Fluvial Terraces on the Pakua Tableland, Taiwan. Land 2021, 10, 447. [Google Scholar] [CrossRef]
  88. Elbasiouny, H.; Abowaly, M.; Abu_Alkheir, A.; Gad, A. Spatial variation of soil carbon and nitrogen pools by using ordinary Kriging method in an area of north Nile Delta, Egypt. Catena 2014, 113, 70–78. [Google Scholar] [CrossRef]
  89. Chiriaco, M.V.; Belli, C.; Chiti, T.; Trotta, C.; Sabbatini, S. The potential carbon neutrality of sustainable viticulture showed through a comprehensive assessment of the greenhouse gas (GHG) budget of wine production. J. Clean. Prod. 2019, 225, 435–450. [Google Scholar] [CrossRef]
  90. Carbon Market Incentives to Conserve, Restore and Enhance Soil Carbon. Available online: https://www.nature.org/content/dam/tnc/nature/en/documents/Carbon-Market-Incentives-Report.pdf (accessed on 8 May 2023).
  91. Duthie, C.A.; Rooke, J.A.; Troy, S.; Hyslop, J.J.; Ross, D.W.; Waterhouse, A.; Roehe, R. Impact of adding nitrate or increasing the lipid content of two contrasting diets on blood methaemoglobin and performance of two breeds of finishing beef steers. Animal 2016, 10, 786–795. [Google Scholar] [CrossRef] [PubMed] [Green Version]
  92. Creating a Sustainable Food Future. Available online: https://www.wri.org/research/creating-sustainable-food-future (accessed on 11 May 2023).
  93. Why BP Carbon Footprint Calculator Is Misleading Your Eco Footprint? Available online: https://8billiontrees.com/carbon-offsets-credits/bp-carbon-footprint-calculator (accessed on 29 March 2023).
  94. Stępniewski, W.; Horn, R.; Martyniuk, S. Managing soil biophysical properties for environmental protection. Agric. Ecosyst. Environ. 2002, 88, 175–181. [Google Scholar] [CrossRef]
  95. What Is COMET-Farm? Available online: http://cometfarm.nrel.colostate.edu (accessed on 14 May 2023).
  96. Corporate Standard. Available online: https://ghgprotocol.org/corporate-standard (accessed on 8 May 2023).
  97. Birkenberg, A.; Birner, R. The world’s first carbon neutral coffee: Lessons on certification and innovation from a pioneer case in Costa Rica. J. Clean. Prod. 2018, 189, 485–501. [Google Scholar] [CrossRef]
  98. Hertwich, E.G.; Wood, R. The growing importance of scope 3 greenhouse gas emissions from industry. Environ. Res. Lett. 2018, 13, 104013. [Google Scholar] [CrossRef]
  99. KitKat to Be Carbon Neutral by 2025, Boosting Sustainability Efforts. Available online: https://www.nestle.com/media/news/kitkat-carbon-neutral-2025-sustainability-efforts (accessed on 11 May 2023).
  100. Sustainable Operations. Available online: https://www.arla.com/sustainability/sustainable-operations (accessed on 17 March 2023).
  101. Kilian, B.; Jiménez, G.A. Dole’s carbon-neutral fruits—Teaching note. J. Bus. Res. 2012, 65, 1811–1814. [Google Scholar] [CrossRef]
  102. Kilian, B.; Hettinga, J.; Jiménez, G.A.; Molina, S.; White, A. Case study on Dole’s carbon-neutral fruits. J. Bus. Res. 2012, 65, 1800–1810. [Google Scholar] [CrossRef]
  103. Di Vita, G.; Pilato, M.; Pecorino, B.; Brun, F.; D’Amico, M. A review of the role of vegetal ecosystems in CO2 capture. Sustainability 2017, 9, 1840. [Google Scholar] [CrossRef] [Green Version]
  104. Specification, P.A. PAS 2050–Specification for the assessment of the life cycle greenhouse gas emissions of goods and services. Br. Stand. Inst. 2008, 978, 580. [Google Scholar]
  105. Pan, S.Y.; He, K.H.; Lin, K.T.; Fan, C.; Chang, C.T. Addressing nitrogenous gases from croplands toward low-emission agriculture. NPJ Clim. Atmos. Sci. 2022, 5, 43. [Google Scholar] [CrossRef]
  106. Sustainability in the Coffee Growing Business: Coopedota and the Path towards Carbon Neutral Coffee. Available online: https://www.lenoirlacroix.ca/wp-content/uploads/2017/02/245_ESTUDIO_de_Caso_Caficultura_ingles_IMPRENTA_VF.pdf (accessed on 2 April 2019).
  107. Swedish Court Bans Arla’s Net-Zero Advertising Claim. Available online: https://www.just-food.com/news/swedish-court-bans-arlas-net-zero-advertising (accessed on 23 April 2023).
  108. Pinkse, J.; Busch, T. The emergence of corporate carbon norms: Strategic directions and managerial implications. Thunderbird Int. Bus. Rev. 2013, 55, 633–645. [Google Scholar] [CrossRef]
  109. Climate-Neutral Claims on Food Must Be Banned, Shows Consumer Groups Report. Available online: https://www.beuc.eu/press-releases/climate-neutral-claims-food-must-be-banned-shows-consumer-groups-report (accessed on 26 April 2023).
Figure 1. A chronological sequence of various human efforts in addressing climate change.
Processes 11 01993 g001
Figure 2. A comparison of GHG verification guidelines between GHG Protocol and ISO 14064.
Processes 11 01993 g002
Figure 3. Possible emission sources during milk powder production according to the GHG Protocol’s GHG verification guideline.
Processes 11 01993 g003
Figure 4. Variations in emission sources during transportation for bread products sold locally and for export.
Processes 11 01993 g004
Figure 5. Limitations of selected mitigation measures in helping address climate change.
Processes 11 01993 g005
Disclaimer/Publisher’s Note: The statements, opinions and data contained in all publications are solely those of the individual author(s) and contributor(s) and not of MDPI and/or the editor(s). MDPI and/or the editor(s) disclaim responsibility for any injury to people or property resulting from any ideas, methods, instructions or products referred to in the content.

