Article

Experimental Study on Cyclic Hydraulic Fracturing of Tight Sandstone under In-Situ Stress

1
State Key Laboratory of Coal Mine Disaster Dynamics and Control, Chongqing University, Chongqing 400044, China
2
State Key Laboratory of Geomechanics and Geotechnical Engineering, Institute of Rock and Soil Mechanics, Chinese Academy of Sciences, Wuhan 430071, China
*
Author to whom correspondence should be addressed.
Processes 2023, 11(3), 875; https://doi.org/10.3390/pr11030875
Submission received: 3 March 2023 / Revised: 10 March 2023 / Accepted: 12 March 2023 / Published: 15 March 2023
(This article belongs to the Special Issue Advances in Numerical Modeling for Deep Water Geo-Environment)

Abstract

:
Sandstone oil–gas reservoirs in the Junggar Basin, China have great development potential. However, their ultra-deep formation depth leads to high crustal stress and high breakdown pressure. Therefore, in this research, we studied the cyclic hydraulic fracturing of tight sandstone with different combinations of “high-pressure duration + low-pressure duration” under high-stress conditions. Through laboratory experiments, the pump pressure curves, hydraulic fracture morphology, acoustic emission counts, and peak frequency of the samples were obtained. The results showed that: (1) Compared with conventional hydraulic fracturing, the breakdown pressure of cyclic hydraulic fracturing was reduced by more than 30%, the minimum threshold of cyclic pump pressure required for sample breakdown was between 60%Pb and 70%Pb, and cyclic hydraulic fracturing more easily formed complex and diverse hydraulic fractures. (2) In cyclic hydraulic fracturing, under the same upper limit of cyclic pump pressure, the shorter the high-pressure duration, the fewer the cycles required for sample breakdown. (3) Under the same “high-pressure duration + low-pressure duration” condition, the lower the upper limit of the cyclic pump pressure, and the greater the number of cycles required for sample breakdown. (4) The AE cumulative counts curves fluctuated greatly during cyclic hydraulic fracturing, rising in an obvious step-wise manner and the AE peak frequency was banded and mainly divided into three parts: low frequency, medium frequency, and high frequency.

1. Introduction

With China’s increasing efforts in the development of tight sandstone oil–gas reservoirs, their productivity has increased year by year, and the development target has shifted from shallow layers to deep layers. The high stress of the reservoir has brought greater challenges to on-site hydraulic fracturing. The depth of the Jurassic Qigu Formation sandstone reservoir in the Junggar Basin is between 5000 and 8000 m, the three-dimensional crustal stress is between 80 and 140 MPa, and the horizontal stress difference is between 12 and 20 MPa, resulting in reservoir breakdown pressure of between 115 and 184 MPa. These conditions require high performance of fracturing equipment. The application of cyclic hydraulic fracturing can reduce the breakdown pressure of the reservoir to a certain extent, so it is very important to understand the mechanism of reservoir rock fracture and fracture extension under cyclic hydraulic fracturing. The indoor hydraulic fracturing experiment is an important means of revealing the mechanism of crack initiation, expansion, and extension.
Scholars have conducted a large number of conventional hydraulic fracturing experiments. Guo et al. studied the influence of natural fracture development degree, crustal stress conditions, fracturing treatment parameters, and temporary plugging on fracture propagation of tight sandstone outcrops under true triaxial conditions [1]. Duan et al. investigated the influence of natural fracture development degree, horizontal crustal stress conditions, and fracturing treatment parameters on the hydraulic fracture propagation pattern of tight sandstone outcrops under true triaxial conditions [2]. Lou et al. investigated the micro-response of two types of natural sandstone outcrop cores with different sizes to the formation and expansion of hydraulic fractures under no lateral pressure and confining pressure [3]. He et al. studied the initiation, expansion, and closure of hydraulic fractures in hollow cylindrical sandstone [4]. Zhu et al. studied the hydraulic-fracturing process of tight sandstone under high differential stress [5]. Ma et al. studied the liquid CO2 and water hydraulic fracturing of tight sandstone under different confining pressures and analyzed their different fracturing mechanisms [6]. Muqtadir et al. studied the effect of fracturing fluid on the breakdown pressure of tight sandstone [7]. Yang et al. studied the effect of water and SC-CO2 on the fracture morphology of tight sandstone under different stress magnitudes [8]. Cai et al. studied the fracture behavior of sandstone caused by liquid-nitrogen fracturing [9].
From the working mode of the pump, the above fracturing tests were all conventional hydraulic fracturing. In short, whether it was tight sandstone gas exploitation, shale gas exploitation, or geothermal exploitation, current research has been mostly in the conventional hydraulic fracturing mode. The pump pressure continues to increase until the sample breakdown. The breakdown pressure is large, and the sample tends to produce a single main fracture. It is difficult to produce the complex fracture that is actually needed.
Zhuang et al. proposed a new concept of cyclic hydraulic fracturing. The test results showed that 80% of the average breakdown pressure can cause sample breakdown through cyclic injection [10]. Goyal. et al. proved that cyclic injection can help reduce the breakdown pressure by using cylindrical dry-hot rock samples [11]. Other studies have been valuable for the protection of energy and environmental security [12,13,14,15]. Zhou et al. carried out cyclic hydraulic fracturing tests on rectangular concrete samples with multiple perforation clusters, and the results showed that more cracks could be produced by injecting the perforation cluster through the cyclic pump [16]. Liu et al. studied the effect of different cycle times and injection rates on the initiation and propagation of cyclic hydraulic fractures in granite under true triaxial conditions [17]. Zhou et al. used large cement samples to study the influence of different combinations of crustal stress, cycle number, and cycle mode on the complexity of the hydraulic fracture network [18]. Zhuang et al. proved that cyclic hydraulic fracturing can reduce the breakdown pressure by 20% and produce more complex fractures by alternating high and low injection rates or pressurization [19]. Diaz et al. studied the evolution of acoustic emission activity, hydraulic energy, fracture area, and fracture development under repeated maximum cyclic pressure with different cycle durations [20]. Jia et al. combined laboratory experiments and numerical simulation models to study the failure mechanisms, seismic risk, and permeability enhancement performance of circulating fluid injection [21]. Patel et al. evaluated the possibility of using pre-fracturing cyclic injection to reduce rock breakdown pressure and increase the damage around hydraulic fractures under the condition of true triaxial stress [22]. Zhuang et al. studied the impact of granite on hydraulic performance and induced seismic activity during hydraulic fracturing in six different water injection schemes [23].
The above research was based on the concept of cyclic hydraulic fracturing, and hydraulic fracturing tests under different circulating modes have been carried out, but the matching of different upper limits of cyclic pump pressure and different high-pressure durations has not been considered. Therefore, this research adopted a new cyclic hydraulic fracturing mode, set different upper limits of cyclic pump pressure, and combined different high-pressure durations to make the pump pressure rise, maintain, and fall in one cycle, and so on, and used an acoustic emission recording instrument to monitor the whole process in real time. Compared with conventional hydraulic fracturing, the fracture initiation and propagation law and fracturing effect of cyclic hydraulic fracturing were analyzed and combined with the pump pressure curves, hydraulic fracture morphology, cumulative counts of acoustic emission, and peak frequency of acoustic emission.

2. Materials and Methods
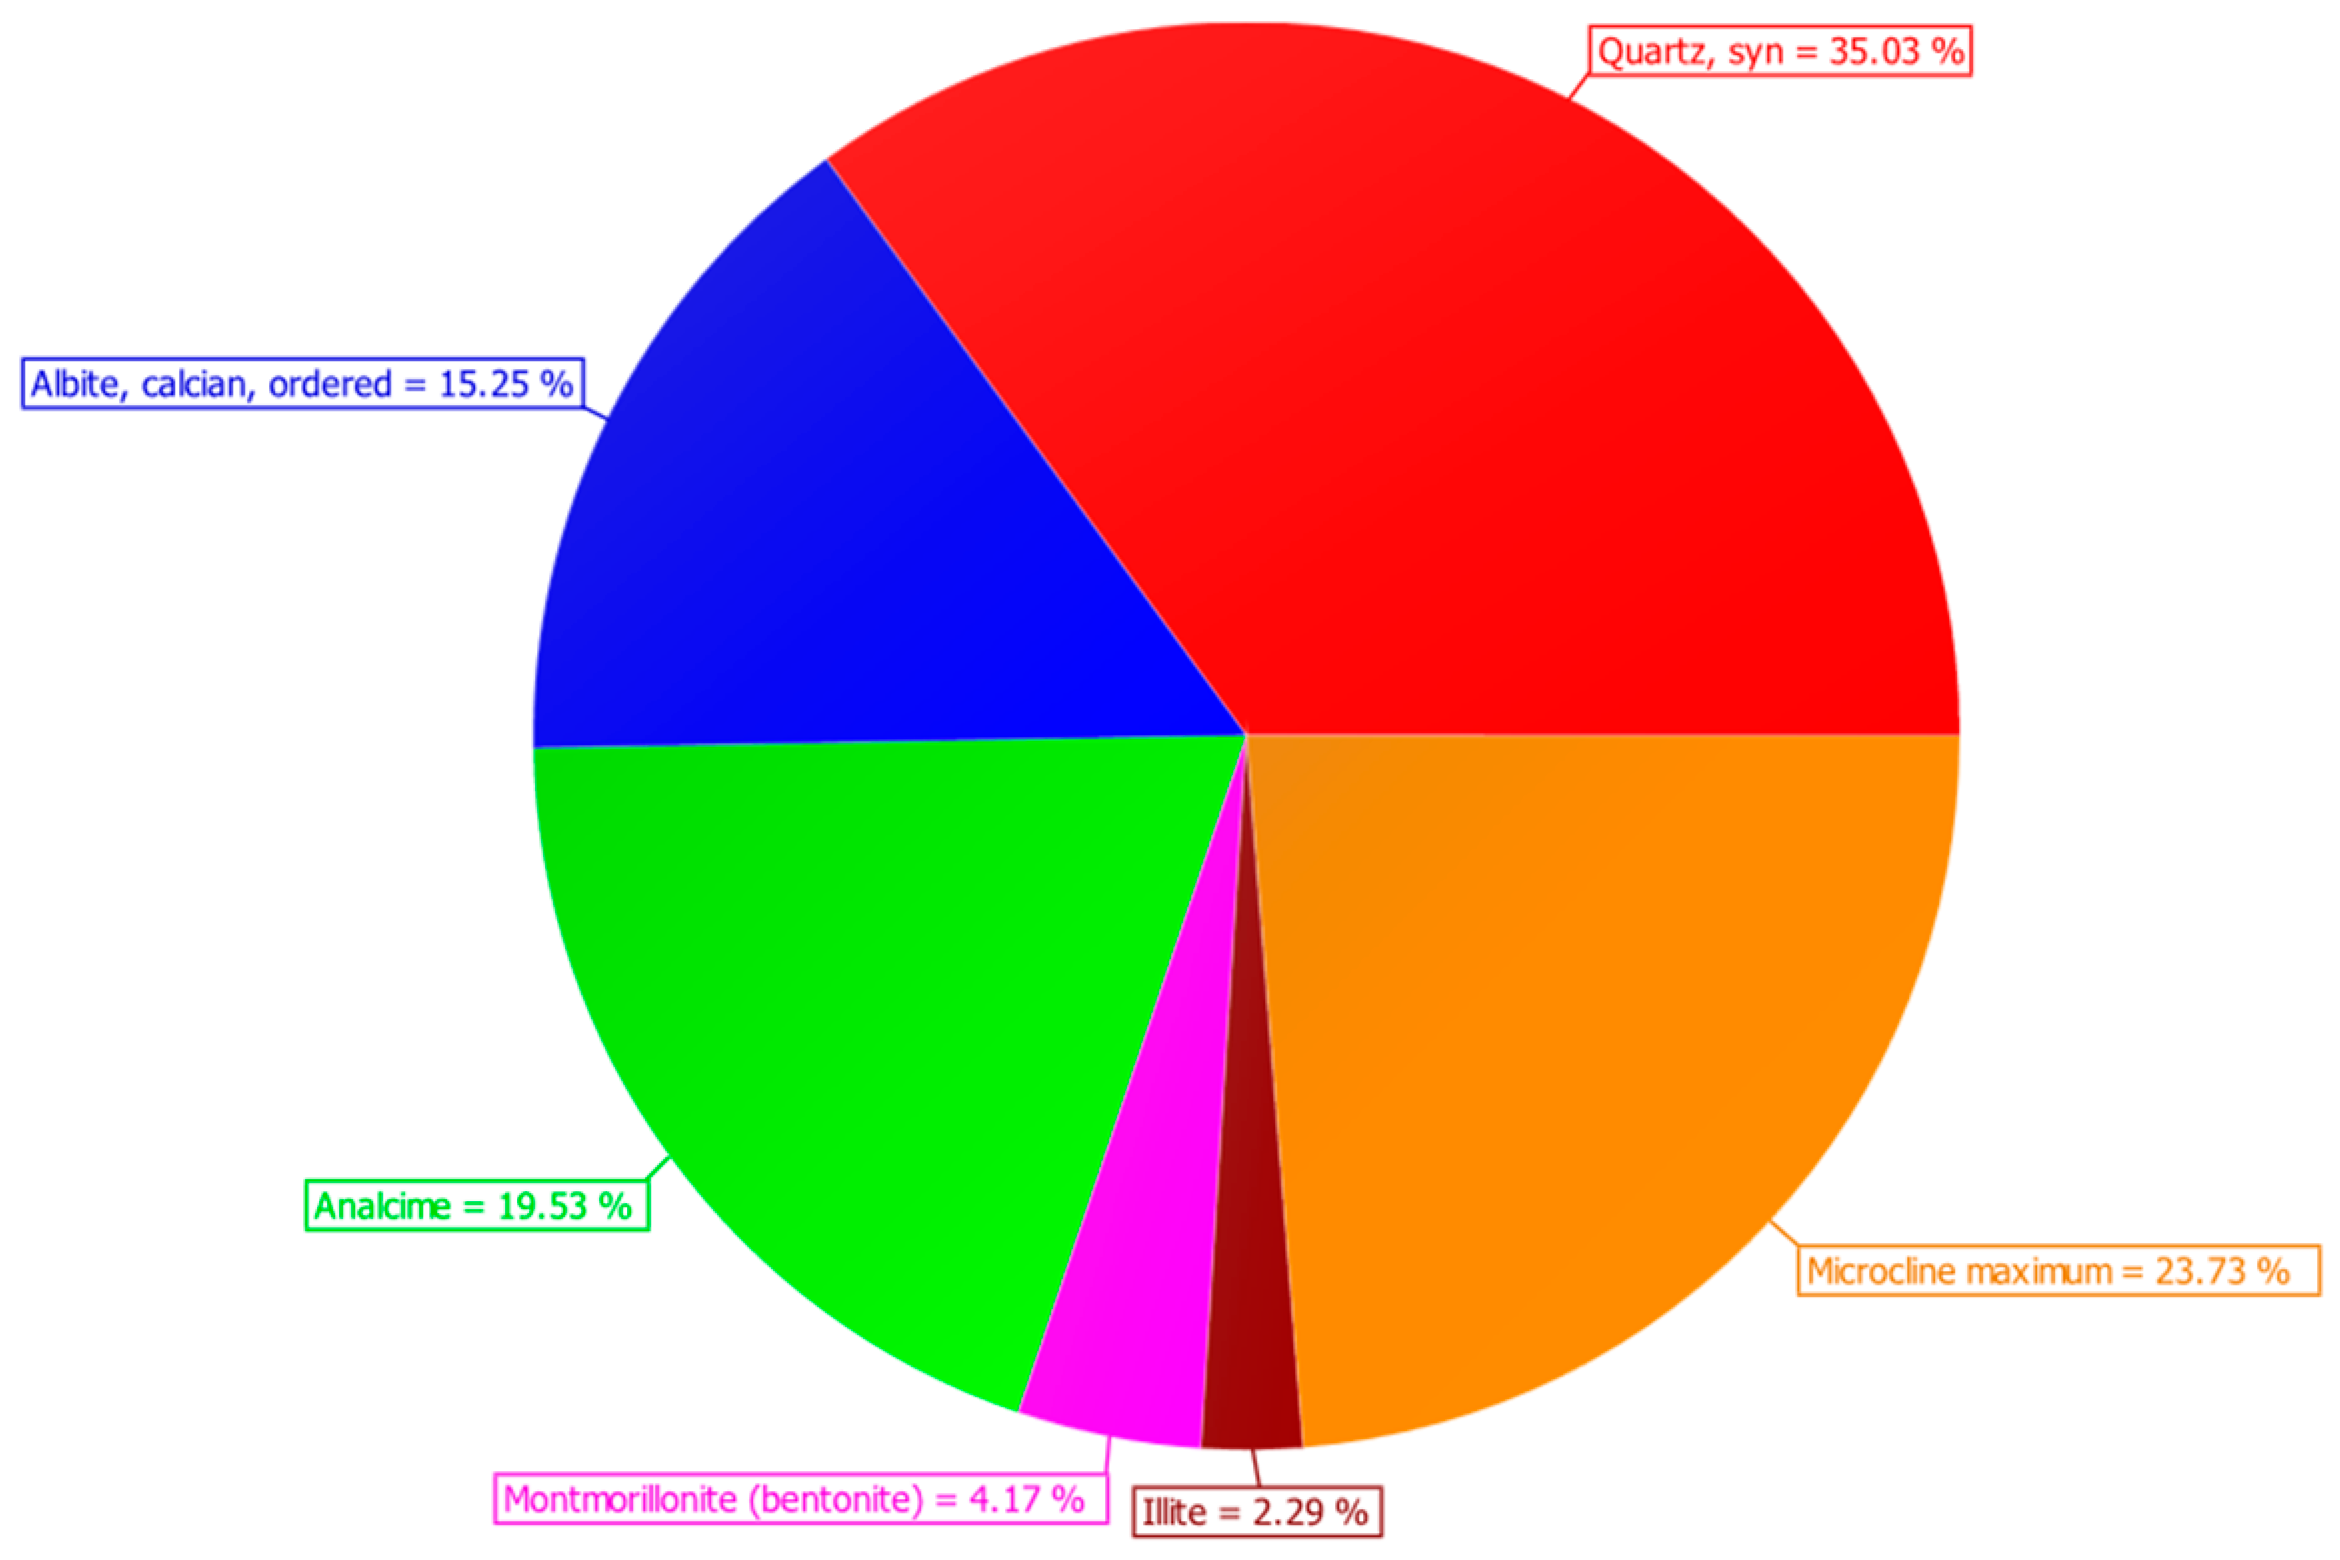
2.1. Test Material

In this study, sandstone samples were collected from the outcrops of the Jurassic Qigu Formation in Urumqi, Xinjiang, China. The outcrop samples were red sandstone with partially visible sedimentary weak surfaces. As shown in Figure 1, through XRD mineral analysis, the mineral composition was mainly quartz, accounting for 35.03%, followed by microcline, calcite, and anorthite, accounting for 23.93%, 19.53%, and 15.25%, respectively. Finally, montmorillonite and illite, accounted for 4.17% and 2.29%, respectively.
The basic mechanical parameters of sandstone are shown in Table 1. The mechanical properties of samples are anisotropic. When the force changes from parallel to perpendicular to the bedding plane, the wave velocity, uniaxial compressive strength, and tensile strength of the sandstone core increase, while the Young’s modulus, Poisson’s ratio, and fracture toughness decrease.

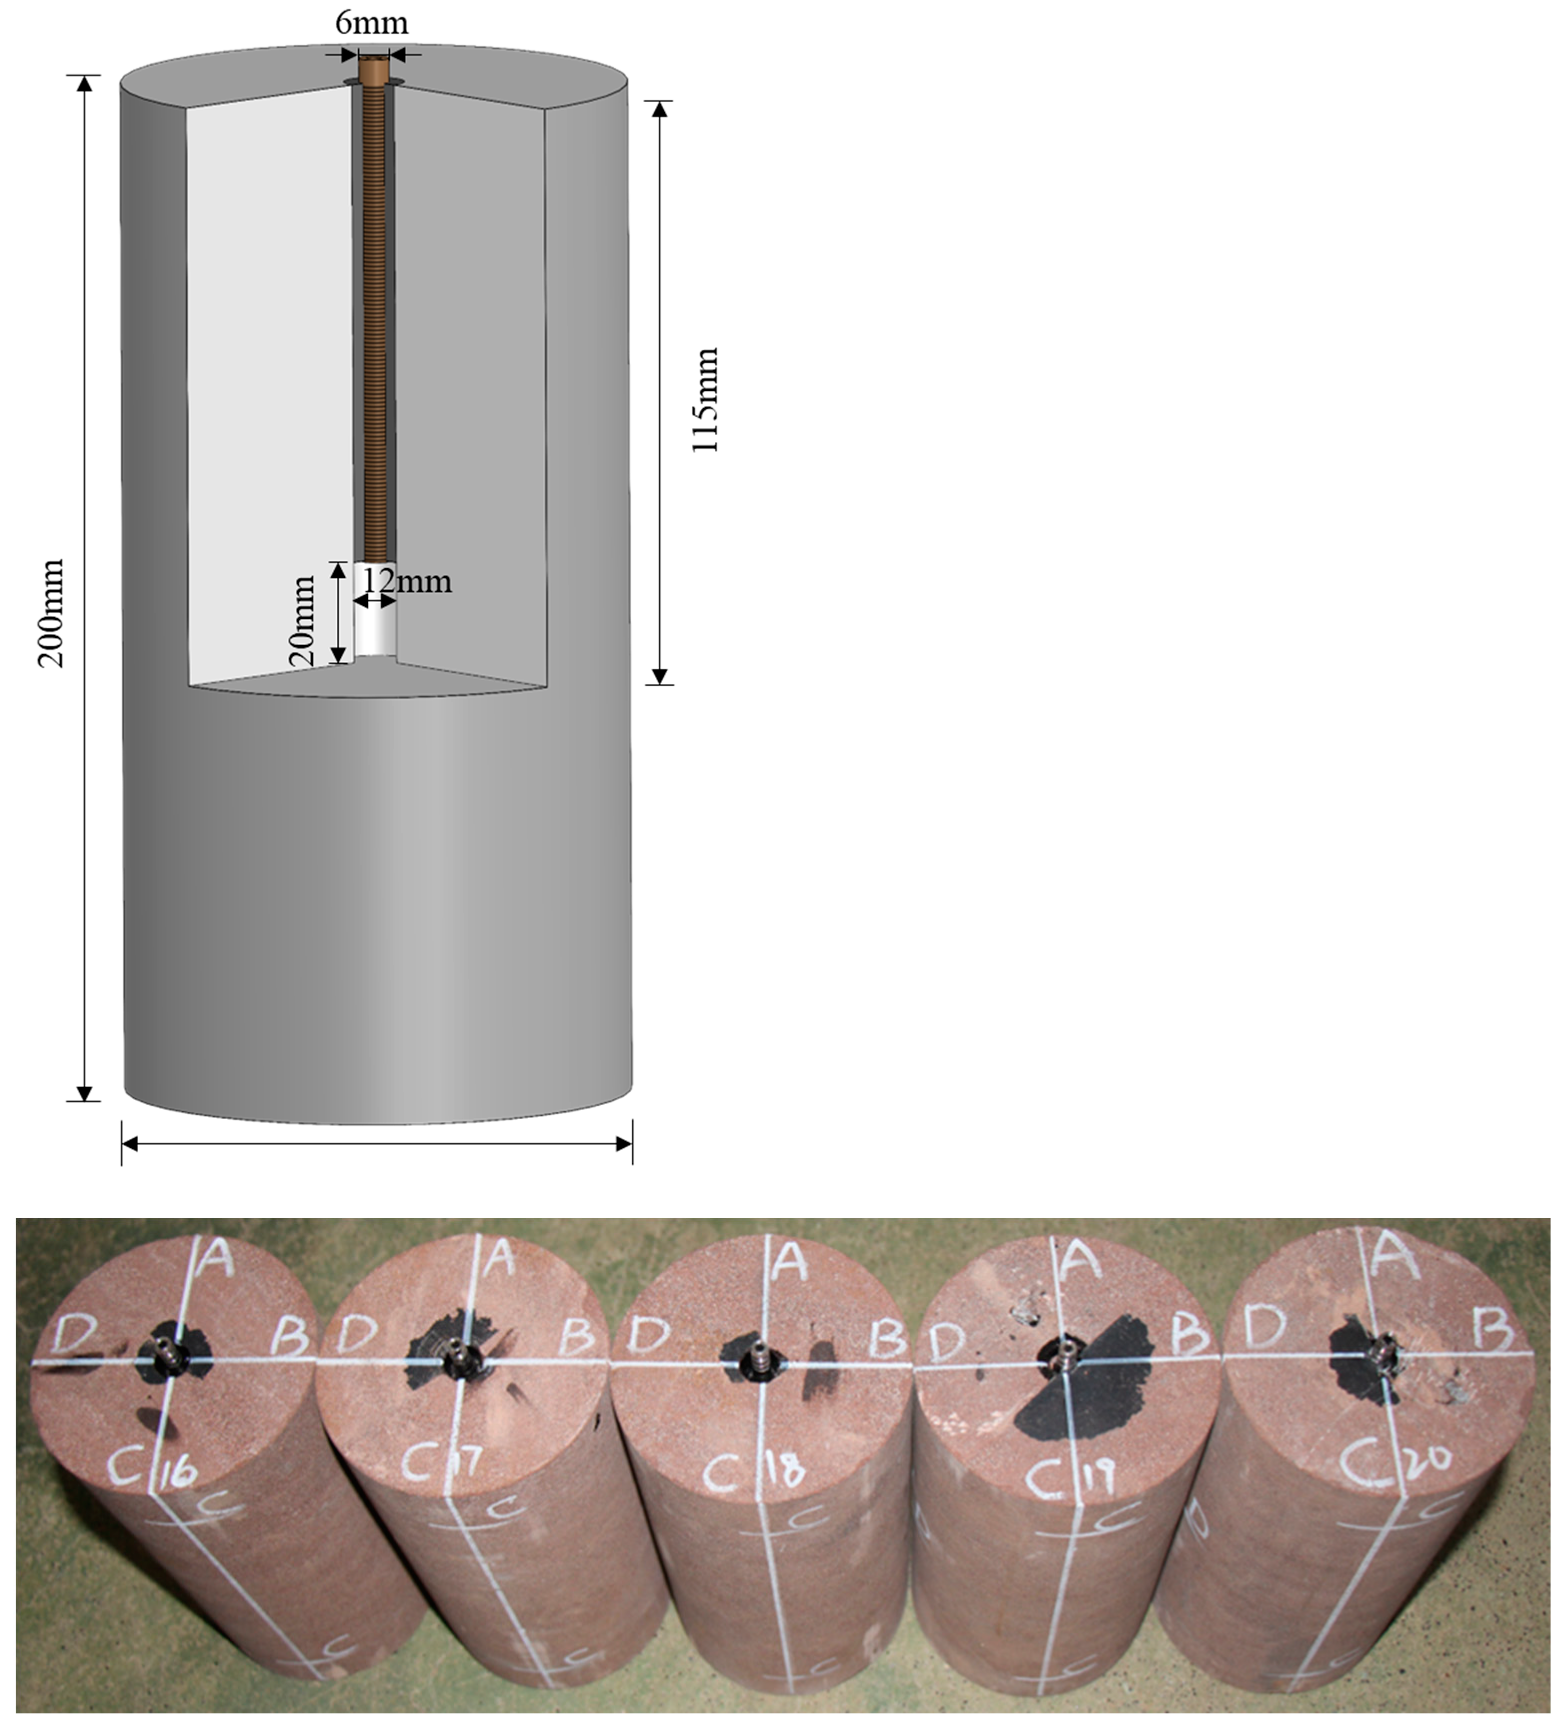
2.2. Sample Preparation
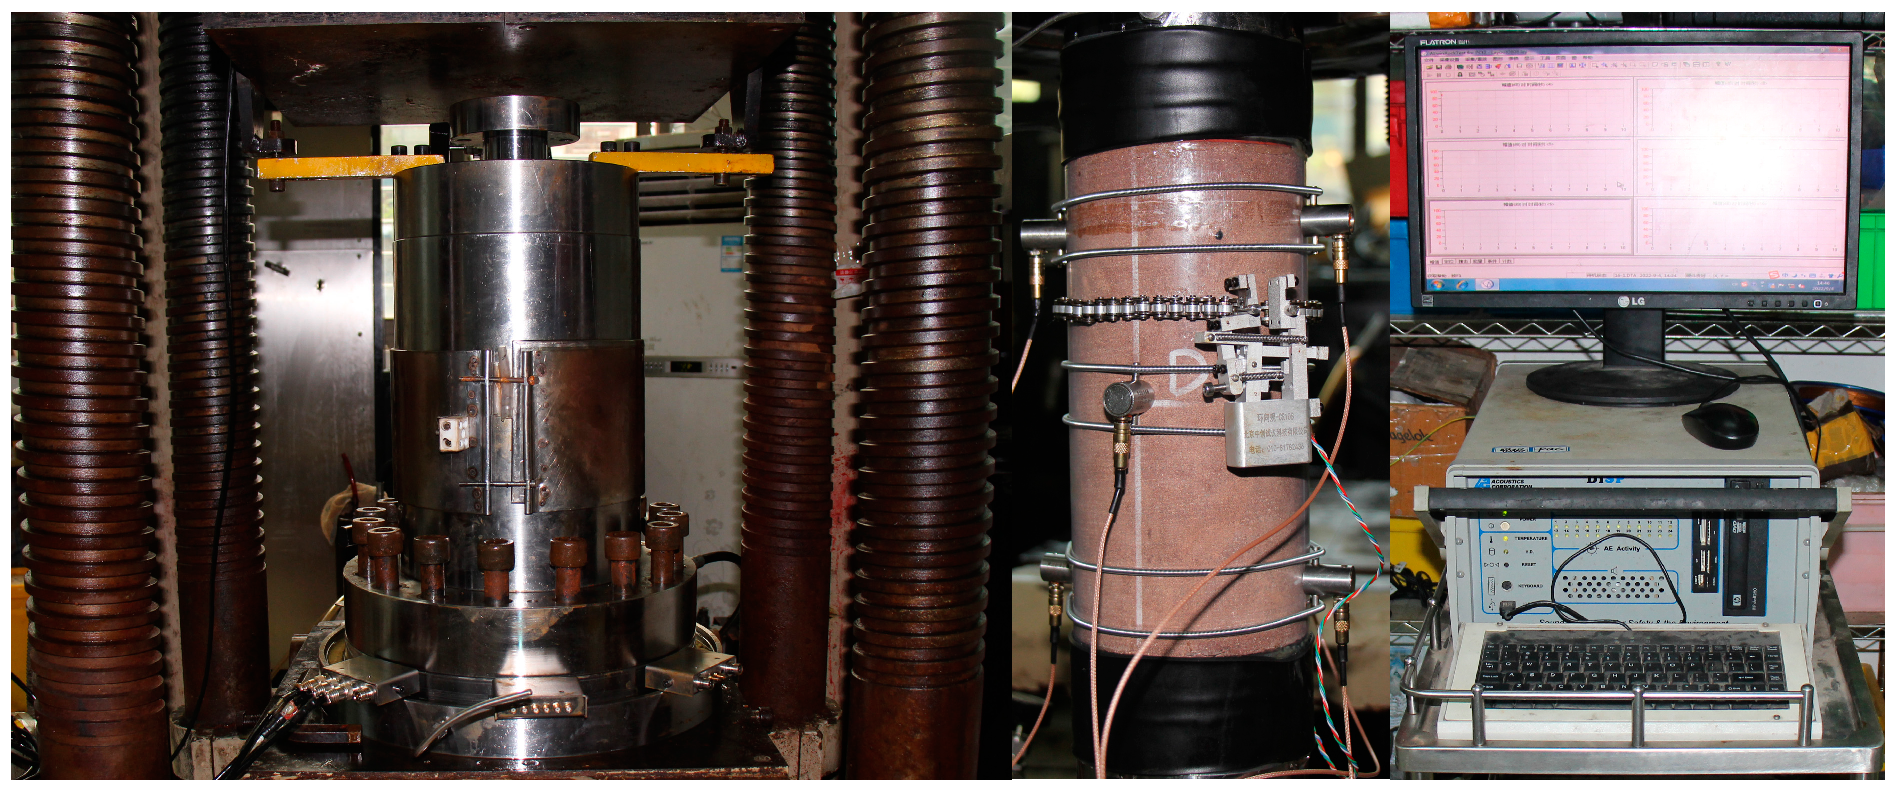
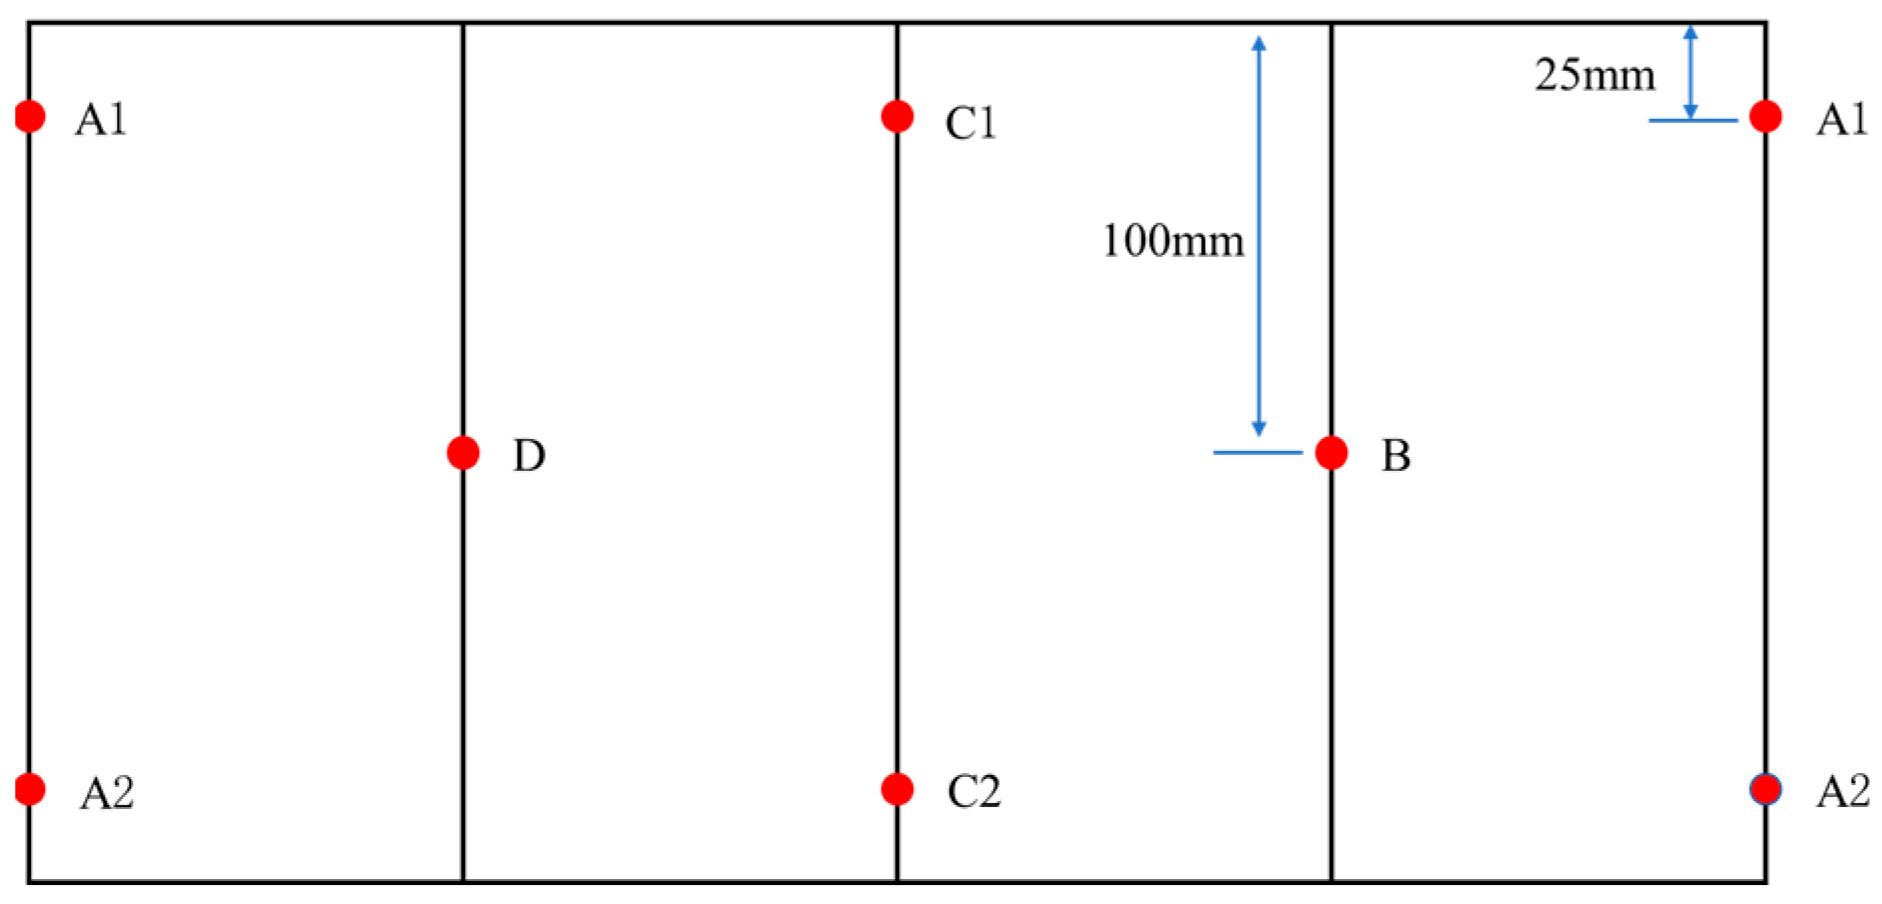
As shown in Figure 2, according to the dimensions of the triaxial chamber, a standard cylindrical specimen with a diameter of 100 mm and a height of 200 mm was used in this experiment. The two ends of the sample were polished with a diamond-face grinder to ensure that the non-parallel error of the two ends did not exceed 0.05 mm, and the end face was perpendicular to the axis of the sample, with a maximum deviation of 0.25°. This step was essential to ensuring the good sealing of the sample and to eliminate any potential liquid leakage during the test. A diamond bit with an outer diameter of 12 mm was used to drill a 115 mm deep round hole in the center of the sample. Kraft K-9741 epoxy resin was used to bond the 95 mm long, 6 mm outer diameter, and 3 mm inner diameter stainless steel pipe to the wellbore wall. A 20 mm open-hole section was reserved at the end of the wellbore for open-hole hydraulic fracturing. In order to reduce non-uniformity, the samples used in the test were selected from multiple samples without obvious macroscopic cracks or defects.

2.3. Test Apparatus

The laboratory hydraulic fracturing simulation test was conducted using the XTR01-01 micro-computer-controlled electro-hydraulic servo rock triaxial tester of the Institute of Rock and Soil Mechanics, Chinese Academy of Sciences. As shown in Figure 3, the equipment is mainly composed of four parts: triaxial loading system, fracturing fluid injection system, data acquisition system, and acoustic emission monitoring system. The maximum axial load of the test system is 2000 kN, and the maximum confining pressure is 60 MPa. The pressure servo booster can operate in constant flow, constant pressure, and programmable program modes, and can control the maximum water pressure of 140 MPa. In addition, in order to prevent fluid leakage and loss, a rubber O-ring was installed in the groove at the end of the wellbore. The acoustic emission monitoring system is composed of acoustic emission sensor, preamplifier, and data-acquisition module. AEwin software was used to visualize and analyze the recorded data. The acoustic emission probe arrangement is shown in the Figure 4. During the hydraulic fracturing test, two people simultaneously clicked the “start” button of the hydraulic fracturing program and the “start” button of acoustic emission to ensure that the pump pressure and acoustic emission data were monitored synchronously.

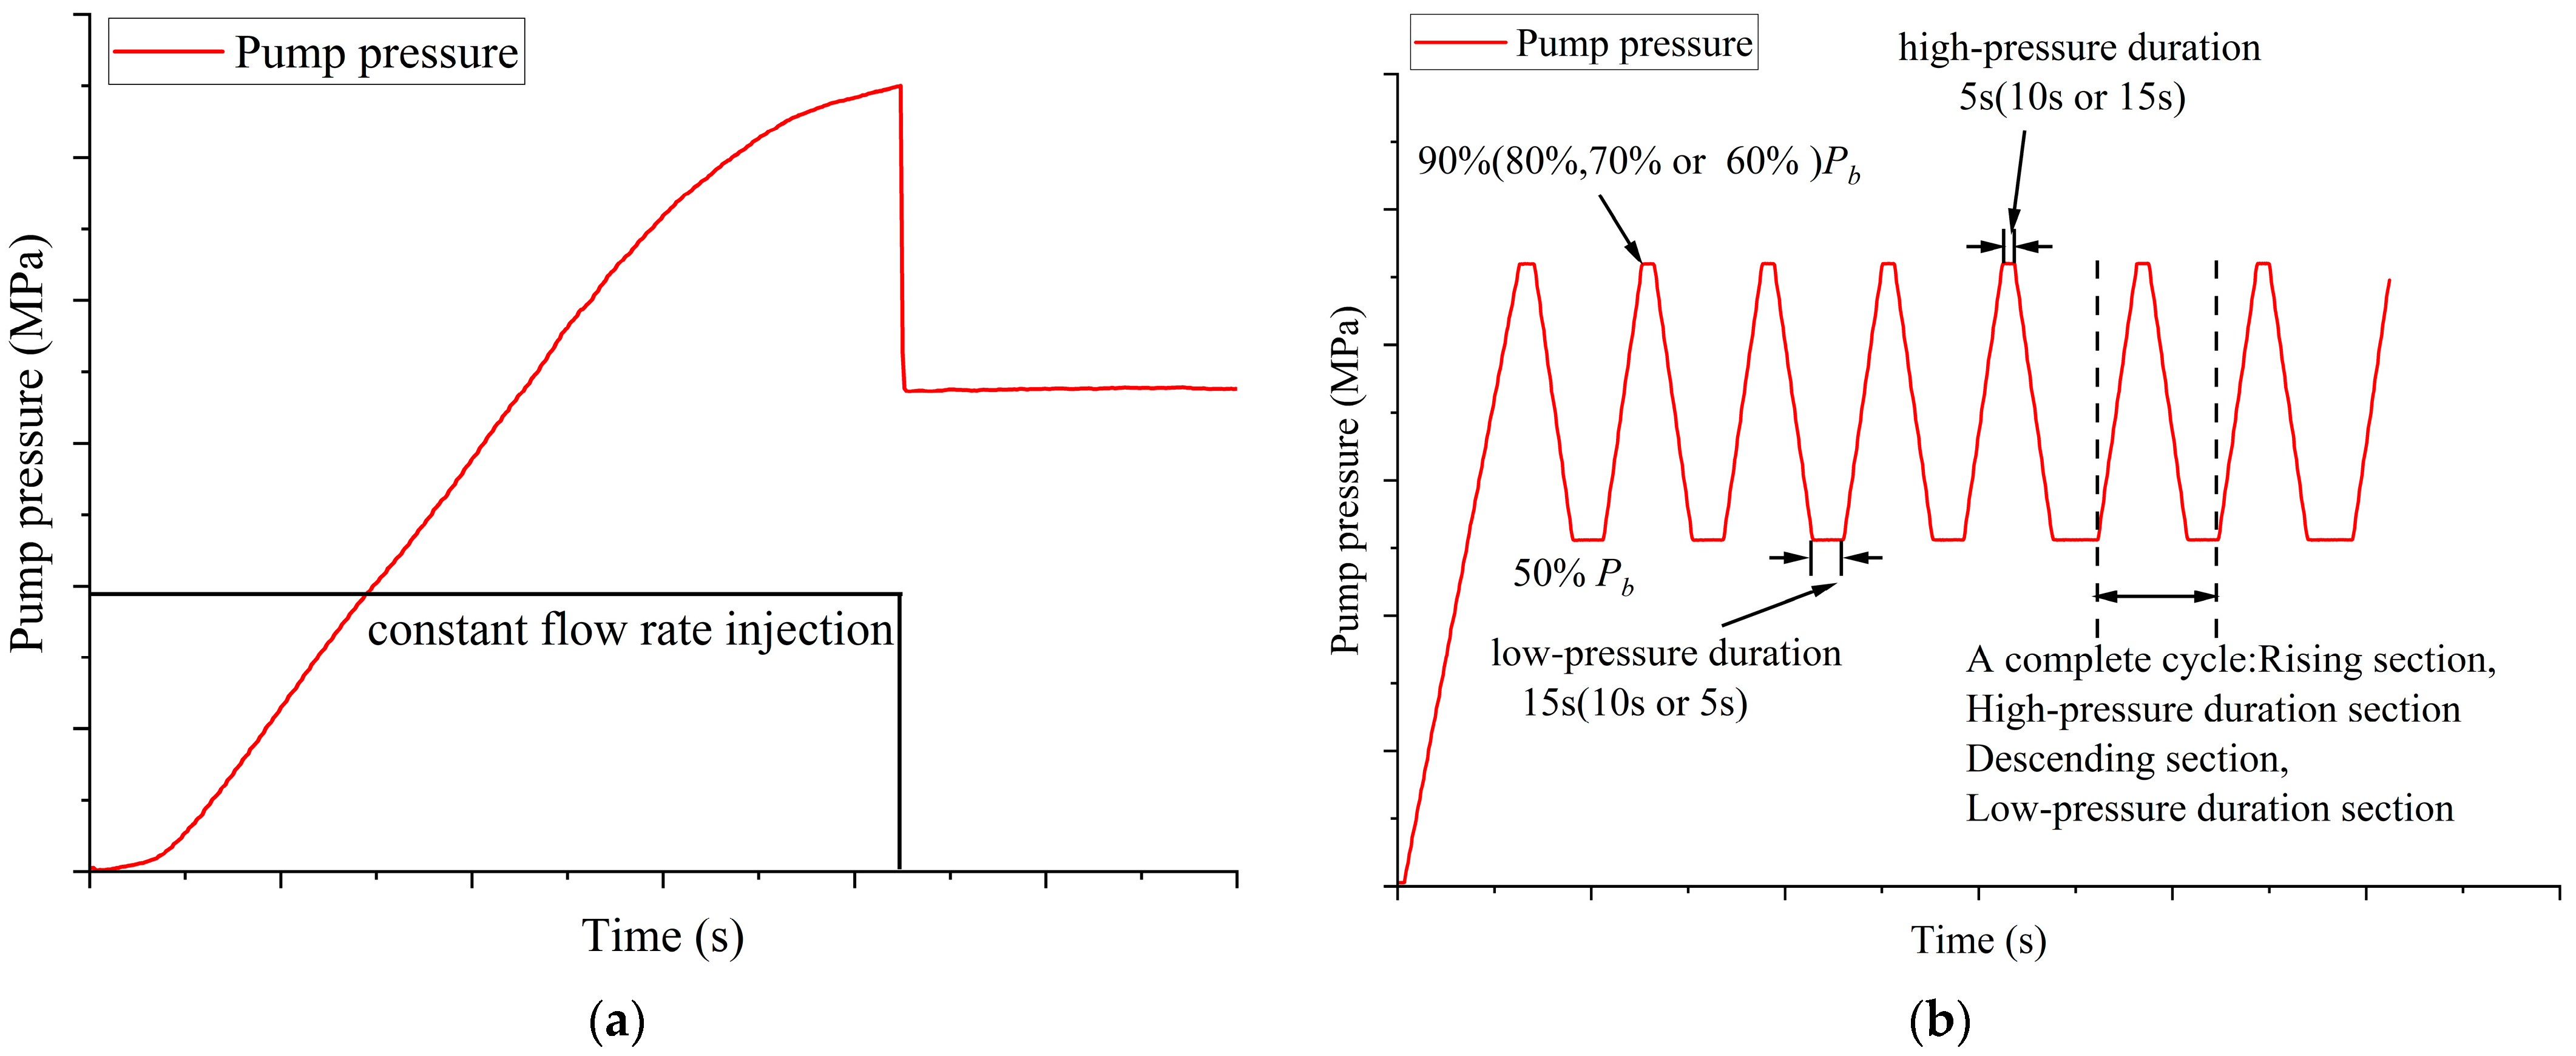
2.4. Experimental Design

According to the original crustal stress test results of the underground core, the actual vertical crustal stress of the formation was 142.99 MPa, and the minimum horizontal crustal stress was 126.10 MPa. In order to avoid potential damage to the sample due to the application of high stress, the triaxial stress applied in the test was reduced by 2.5 times at the same time. To reduce the filtration effect, a linear gel with green fluorescent tracer and a viscosity of 40 mPa·s was used as the fracturing fluid. In addition, the radial deformation and acoustic signals of the sample were simultaneously collected during the experiment.
As shown in Figure 5, in this conventional hydraulic fracturing test, three tests were carried out using the constant displacement injection mode, and the fluid injection rate was 10 mL/min until the sandstone breakdown. The average breakdown pressure of the three samples was defined as the breakdown pressure Pb, which was used to design the upper limit of the cyclic pump pressure in the cyclic hydraulic fracturing.
In the test of cyclic hydraulic fracturing, the upper limit of the cyclic pump pressure was set at 90%Pb, 80%Pb, 70%Pb, and 60%Pb, respectively, and the lower limit of the cyclic pump pressure is set at 50% Pb. In the first cycle, the time for the pump pressure to rise from 0 MPa to the upper limit of the cyclic pump pressure was set to 60 s. In the subsequent cycles, the time from the 50%Pb to the upper limit of the cyclic pump pressure (rising section) was set to 20 s, and the time from the upper limit of the cyclic pump pressure to the 50%Pb (descending section) was also set to 20 s. To explore the impact of the pump-pressure duration, the “high-pressure duration + low-pressure duration” in each cycle was set to 20 s in total, with three combinations of “15 s + 5 s”, “10 s + 10 s”, and “5 s + 15 s”. The rising section 20 s + the high-pressure duration + the falling section 20 s + the low-pressure duration was regarded as a complete cycle, with a total time of 60 s. The maximum number of cycles was set to 60, that is, 1 h at most, when the test was stopped regardless of whether there has been sandstone-sample breakdown.
The specific experimental parameters of all tests, including breakdown pressure, rupture state, and number of cycles are summarized in Table 2. The equivalent cycles represent the number required for the sample breakdown.

3. Results and Discussion

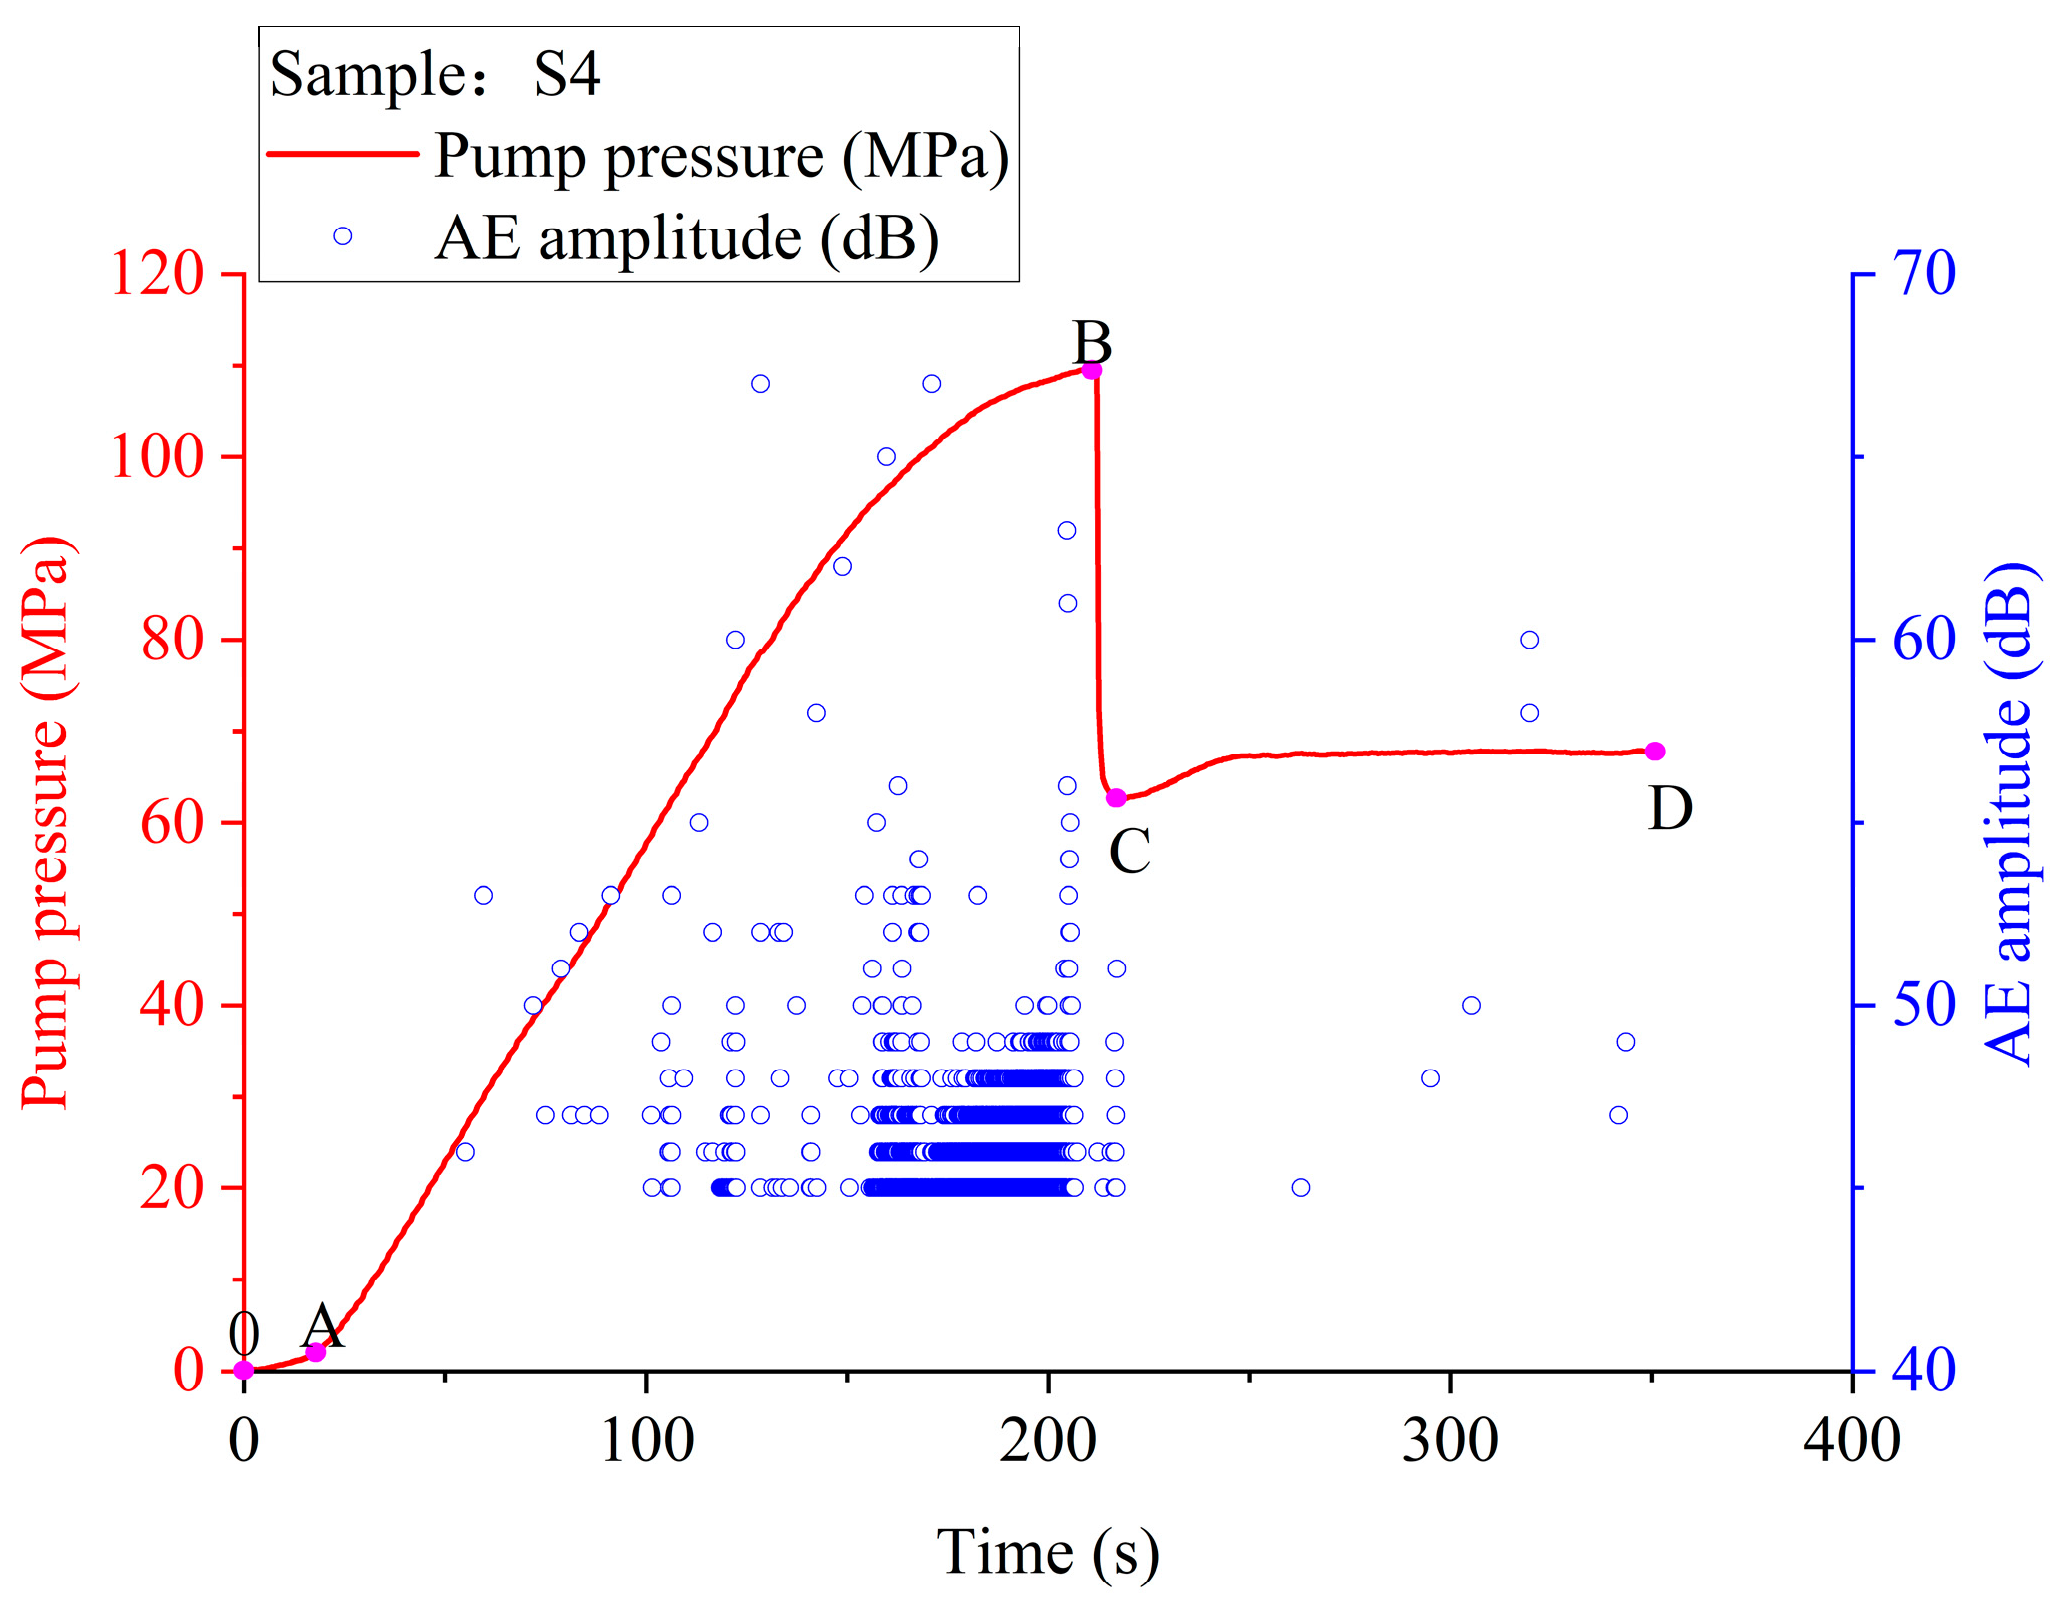
3.1. Breakdown Pressure

As shown in Table 2, in conventional hydraulic fracturing, the three test results were similar, therefore, only sample S4 is described here. The relationship between pump pressure, AE amplitude, and injection time is shown in Figure 6. Four different stages can be identified in the pump pressure–time curve: the OA section of the wellbore pipeline-filling stage, the AB section of the wellbore pressurization stage, the BC section of the macrocrack propagation stage, and the CD section of the post-breakdown stage. The sample entered the OA section from the beginning of fluid injection. With the injection of fracturing fluid, the pump pressure rose slowly until all accessible pores and microfractures near the open-hole section of the wellbore were filled with fracturing fluid. It then entered the AB section where the slope of the pump pressure curve remained almost unchanged at first before decreasing significantly when it approached the B point. It then entered the BC section, where, with the initiation and expansion of the main induced hydraulic crack until it penetrated the surface of the sample, the pump pressure curve reached its maximum value and then dropped sharply. Finally, it entered the CD section, and under the constraint of the high confining pressure of 50MPa, the induced fracture was rapidly squeezed and closed.
The breakdown pressures of samples S1, S3, and S4 were 99.13 MPa, 97.16 MPa, and 110.01 MPa, respectively. Therefore, the average breakdown pressure Pb of the three samples was 102.10 MPa; the 90%Pb was 92.07 MPa, the 80%Pb was 81.84 MPa, the 70%Pb was 71.61 MPa, the 60%Pb was 61.38 MPa, and the 50%Pb was 51.05 MPa.
It can be seen from Table 2, when the 90%Pb was 92.07 MPa, under the three combinations of “high-pressure duration + low-pressure duration” as “15 s + 5 s”, “10 s + 10 s”, and “5 s + 15 s”, the cycles required for sample breakdown had a certain regularity.
As shown in Figure 7, when the upper limit of the cyclic pump pressure was 90%Pb, under the condition of “high-pressure duration 15 s + low-pressure duration 5 s”, sample S5 was subjected to 32 cycles. In the 32nd cycle, the pump pressure suddenly dropped when it rose from 51.05 MPa to 58.8 MPa, and then dropped to the extension pressure. Under the condition of “high-pressure duration 10 s + low-pressure duration 10 s”, sample S6 was subjected to 25 cycles in total. At the end of the 25th cycle, when the pump pressure was ready to rise at 2.05 MPa/s according to the setting procedure, the pump pressure suddenly dropped from 50%Pb. Under the condition of “5 s for high-pressure duration + 15 s for low-pressure duration”, sample S7-1 was subjected to seven cycles in total. In the 7th cycle, when the pump pressure dropped from 90%Pb to 72.6 MPa, it suddenly rose slightly to 76.4 MPa, and then dropped almost vertically to 50 MPa.
From this, we can get the following understanding: with high-pressure duration decreasing from 15 s to 10 s to 5 s, the cycles required for sample breakdown decreased from 32 to 25 to 7. That is, in this cycle mode, the shorter the high-pressure duration, the fewer the number of cycles required for sample breakdown, the more conducive the sample to the expansion and fracture of test-sample cracks. There was a positive correlation between the high-pressure duration and the cycles required for breakdown, as shown in Figure 8.
The reason why cyclic hydraulic fracturing can reduce the breakdown pressure is due to fatigue damage. On the one hand, as shown in Figure 9, the maximum radial strain of samples S5, S6, and S7-1 was 0.18%, 0.07%, and 0.06%, respectively. When the high-pressure duration was longer, the fracturing fluid carried more energy for rock deformation, so the energy used to generate hydraulic fractures decreased. On the other hand, low-pressure duration had little effect on rock fatigue damage, while high-pressure duration played a major role. After removing the low-pressure duration, the shorter the high-pressure duration, the more effective the impacts carried out in the same time. The stress change in the rock was greatly affected by the cycle interval, leading to more efficient fatigue damage.
It can be seen from Table 2, under the condition of “5 s for high-pressure duration + 15 s for low-pressure duration” in cyclic hydraulic fracturing, when the upper limit of the cyclic pump pressure successively decreased from 90%Pb to 60%Pb, the cycles required for breakdown had a certain regularity.
As shown in Figure 10, when the upper limit of the cyclic pump pressure was 90%Pb. The pumping curve of specimen S7-1 has been described above and is not repeated here. When the upper limit of the cyclic pump pressure was 80%Pb, sample S10 conducted 35 cycles in total. In the 35th cycle, the pump pressure dropped almost vertically from 80%Pb to 37.5 MPa, and then suddenly rose sharply to 49.5 MPa. When the upper limit of the cyclic pump pressure was 70%Pb, sample S13-1 had carried out 37 cycles in total. In the 37th cycle, the pump pressure dropped almost vertically from 70%Pb to 31.9 MPa, and then suddenly rose sharply to 48.9 MPa. When the upper limit of the cyclic pump pressure was 60%Pb, sample S14-1 had been tested for 60 cycles without breakdown.
It can be seen that when the upper limit of the cyclic pump pressure decreased from 90%Pb to 60%Pb, the cycles required for sample breakdown increased, from 7 to 35 to 37, even without fracture. That is, in this cycle mode, the lower the upper limit of the cyclic pump pressure, the more unfavorable it was for the crack propagation and breakdown of the sample. There was a negative correlation between the upper limit of the cyclic pump pressure and the cycles required for breakdown, as shown in Figure 11.
The higher the upper limit of the cyclic pump pressure, the greater the fatigue damage to the sample caused by the frequent fluctuation of the pump pressure and the circulation of stopping liquid injection. When the upper limit of the cyclic pump pressure dropped to 60%Pb, sample S14-1 did not break down after 60 cycles of more than 3600 s. This is because the maximum fluid pressure was too small, making it difficult to cause enough micro-damage to the sample to cause macro-fracture. For field applications, a longer cyclic fracturing is considered impractical and has no economic value. Therefore, there is a minimum upper limit threshold of cyclic pump pressure that can break down the sample during cyclic hydraulic fracturing, which should be between 60%Pb and 70%Pb.

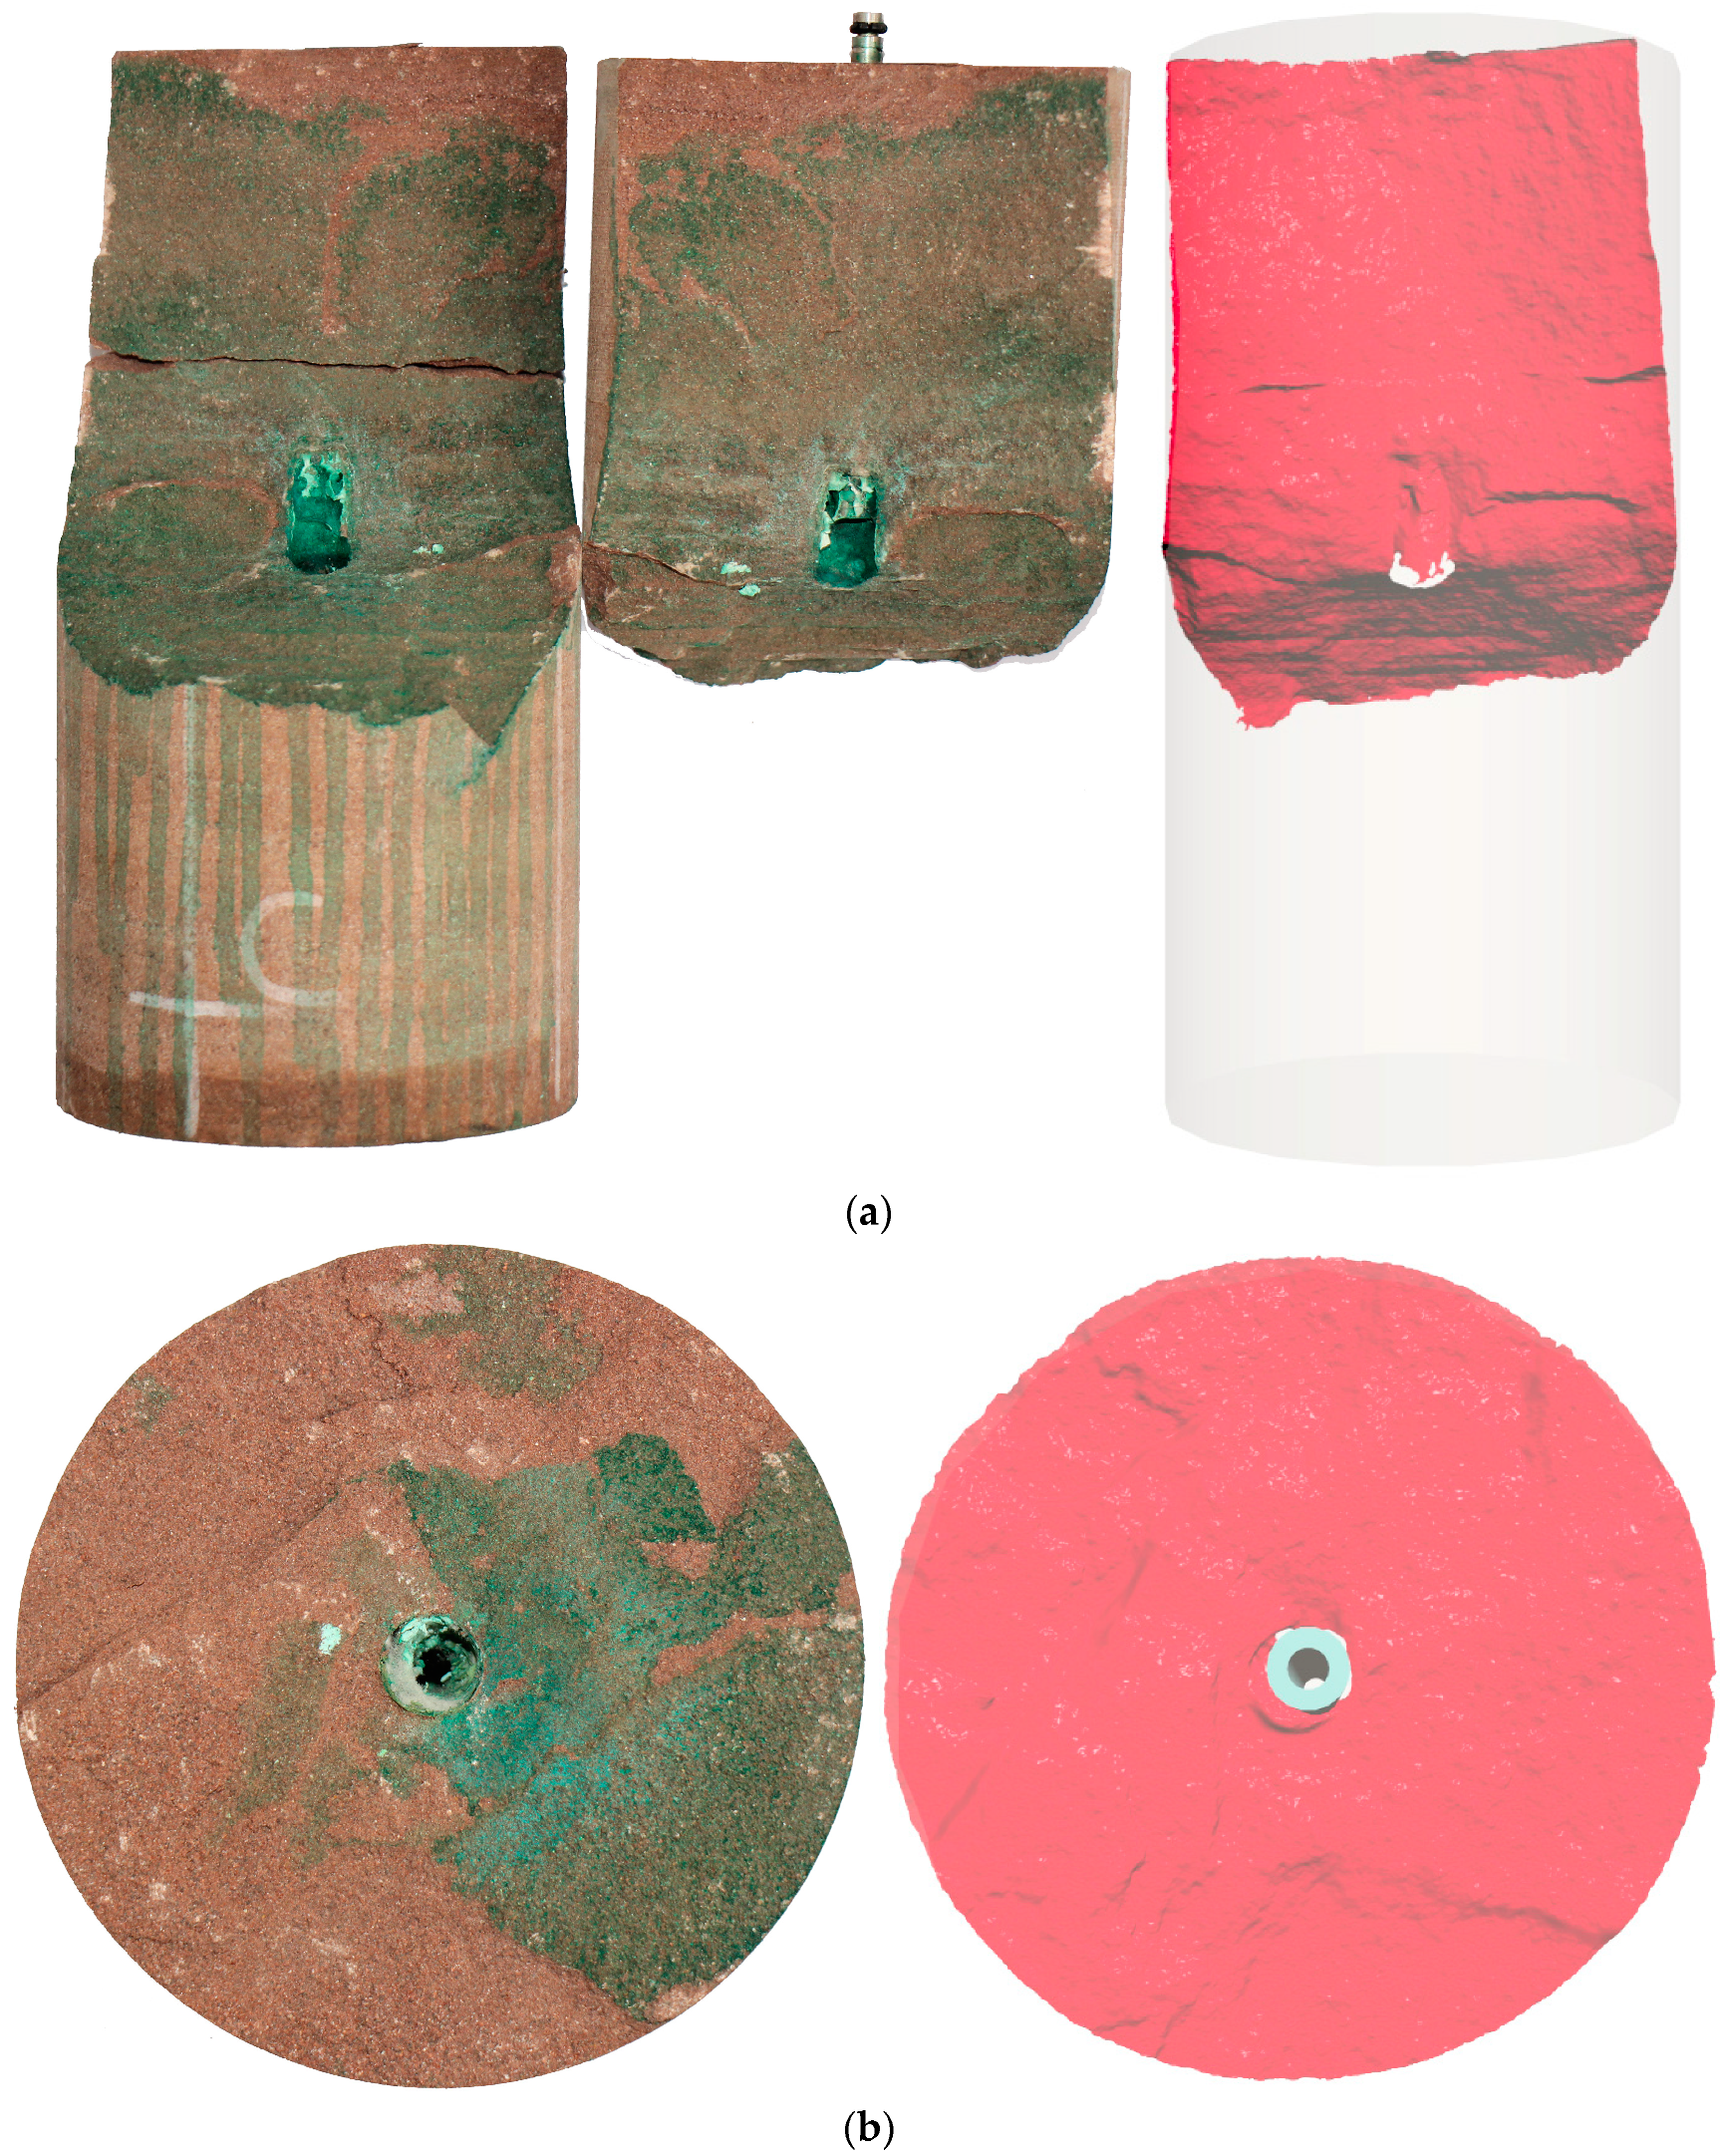
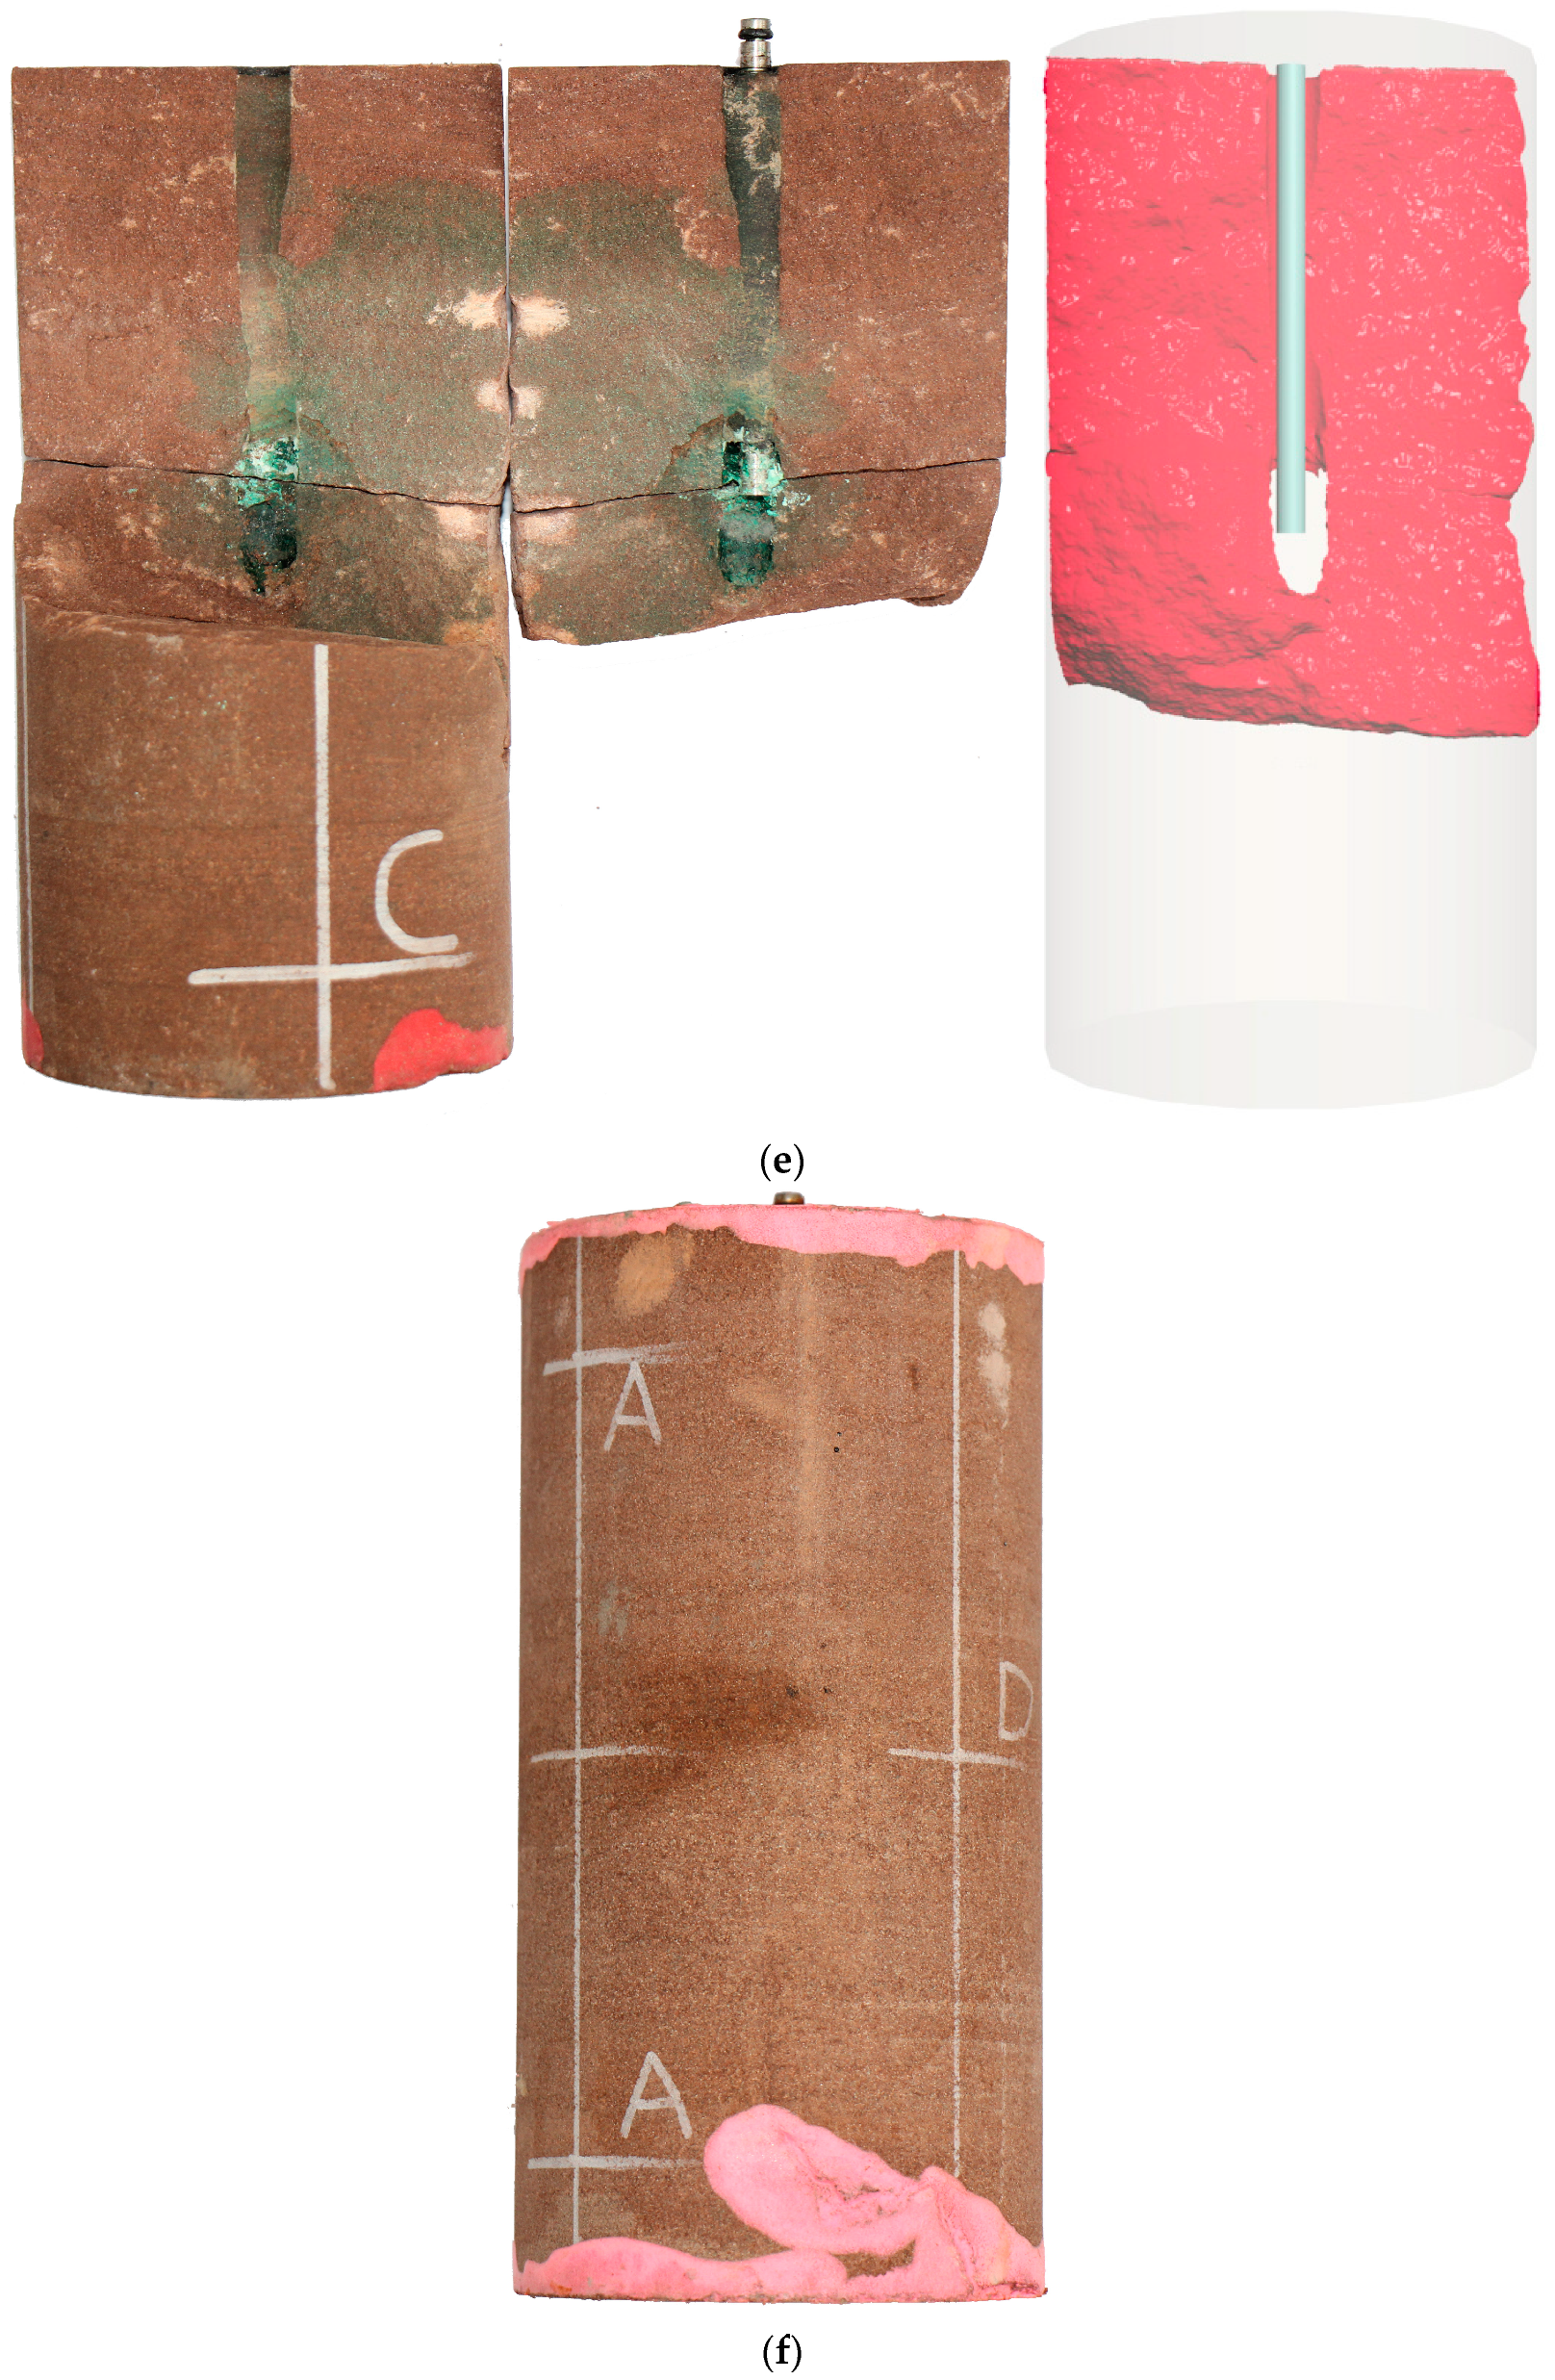
3.2. Hydraulic Fracture Morphology

The Brazil splitting test showed that the average tensile strength of the sandstone layer was 1.70 MPa, while the average tensile strength of the sandstone matrix was 2.41 MPa. As shown in Figure 12, in conventional hydraulic fracturing, at the injection rate of 10 mL/min, sample S4 only activated a horizontal bedding plane near the open-hole section and extended outward until it penetrated the sample. During this process, the fracturing fluid leaked mainly into the bedding fracture. Finally, sample S4 only activated a horizontal bedding plane without forming a complex fracture.
The post-fractured view and the scanning reconstruction diagram of the hydraulic fracture morphology of all samples in cyclic hydraulic fracturing are shown in Figure 13. When the upper limit of the cyclic pump pressure was 90%Pb, sample S5 formed an obvious longitudinal main fracture after the 32nd cycle under the condition of “high-pressure duration 15 s + low-pressure duration 5 s”. Because the injection rate was greater than the fluid loss, the main fracture could pass through the bedding plane and continue to expand in the direction of axial stress; thus the oblique downward extension activated a horizontal bedding plane. On the scan reconstruction diagram of hydraulic fracture morphology, an approximate “L”-shaped fracture appeared, forming a relatively complex fracture. Under the condition of “high-pressure duration 10 s + low-pressure duration 10 s”, after the end of the 25th cycle, part of a horizontal bedding surface was activated in sample S6, forming a long horizontal bedding joint. On the scanning reconstruction diagram of the hydraulic fracture morphology, there is approximately a horizontal “1” type fracture, which formed a fracture with greater undulation than in sample S4. Under the condition of “5 s for high-pressure duration + 15 s for low-pressure duration”, sample S7-1 formed a transverse fracture zone after the 7th cycle and activated a horizontal bedding plane. On the hydraulic fracture morphology diagram, there is approximately a horizontal “1” type fracture, which was a relatively simple fracture.
Under the condition of “5 s for high-pressure duration + 15 s for low-pressure duration”, when the upper limit of the cyclic pump pressure was 90%Pb, the rupture joints of sample S7-1 have already been described and not repeated here. When the upper limit of the cyclic pump pressure was 80%Pb, a longitudinal crack zone was formed on sample S10 after the 35th cycle. On the hydraulic fracture morphology diagram, an approximately vertical “1” type fracture is displayed, forming a relatively complex fracture network. When the upper limit of the cyclic pump pressure was 70%Pb, a longitudinal crack zone was formed on sample S13-1 after the 37th cycle. Similarly to sample S10, an approximately vertical “1” type fracture is shown on the hydraulic fracture morphology diagram, forming a relatively complex fracture network. When the upper limit of the cyclic pump pressure was 60%Pb, sample S14-1 was still intact after 60 cycles, and no visible cracks were formed on the surface.
To sum up, conventional hydraulic fracturing can only form a single transverse fracture. In addition to forming a single transverse or longitudinal fracture, cyclic hydraulic fracturing can also form complex and diverse fractures in which transverse and longitudinal fractures exist simultaneously. Even if a similar horizontal fracture is formed, the fracture relief obtained by cyclic hydraulic fracturing is obviously higher and more complex.

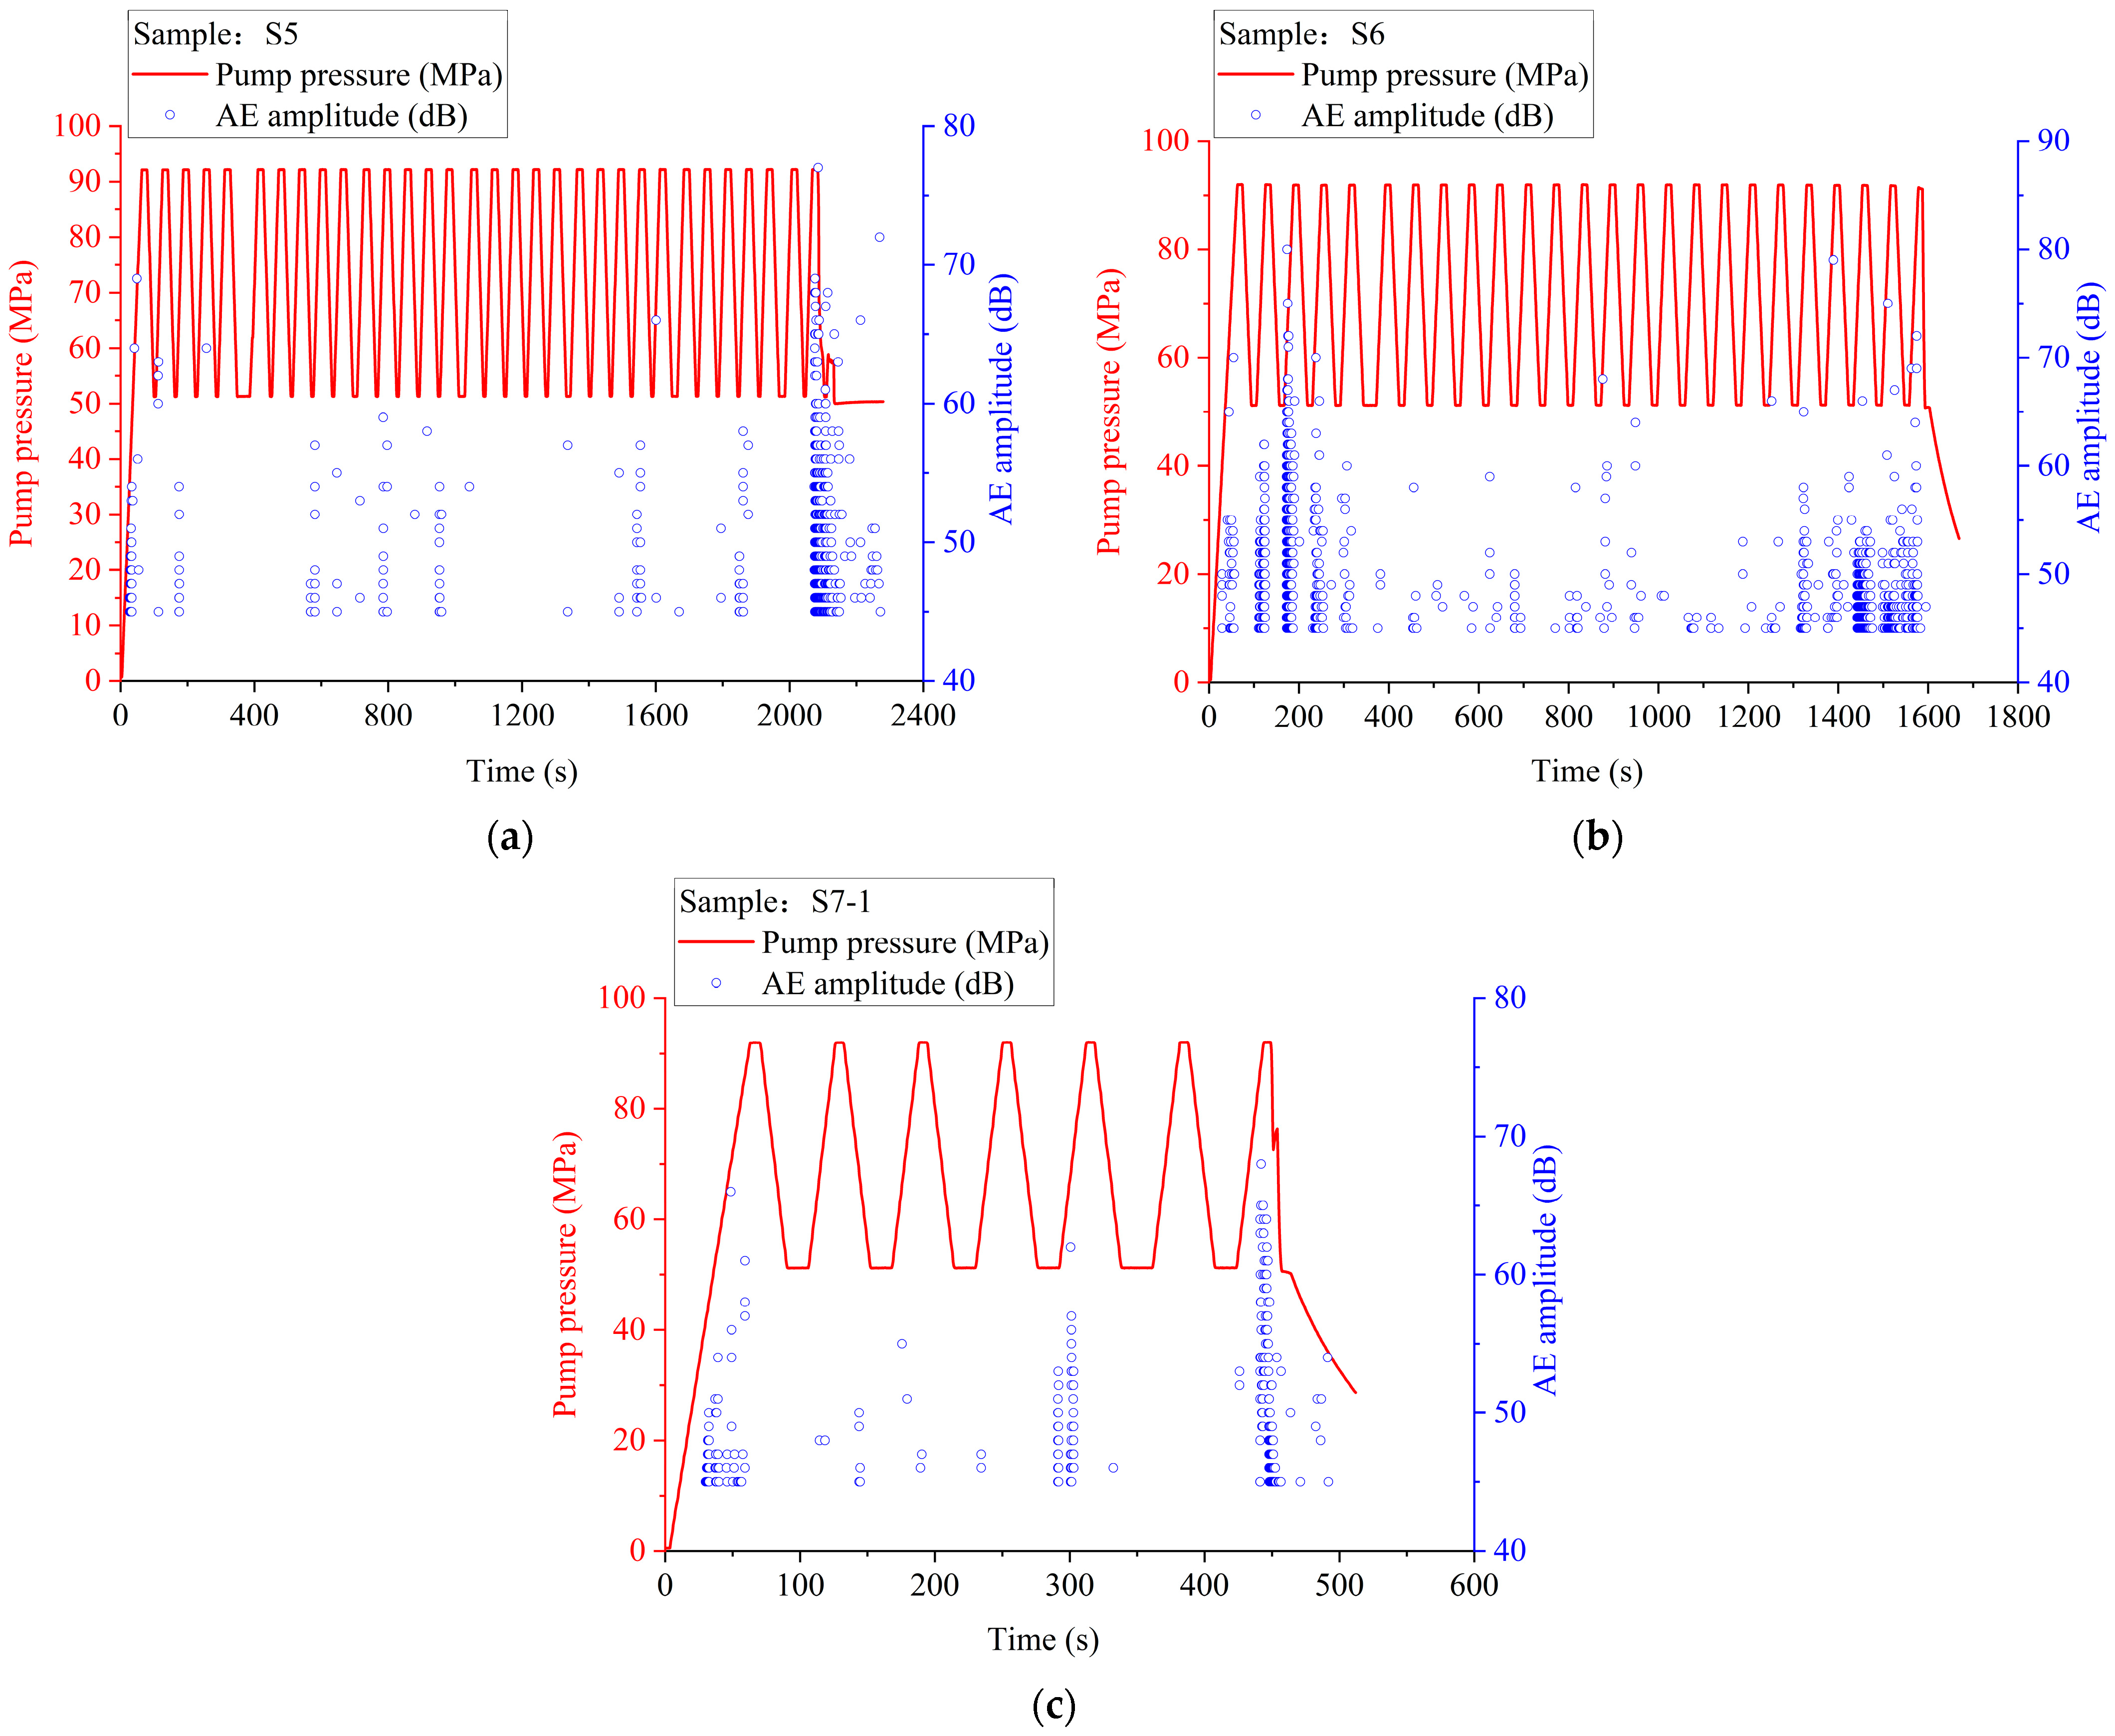
3.3. Acoustic Emission Behavior
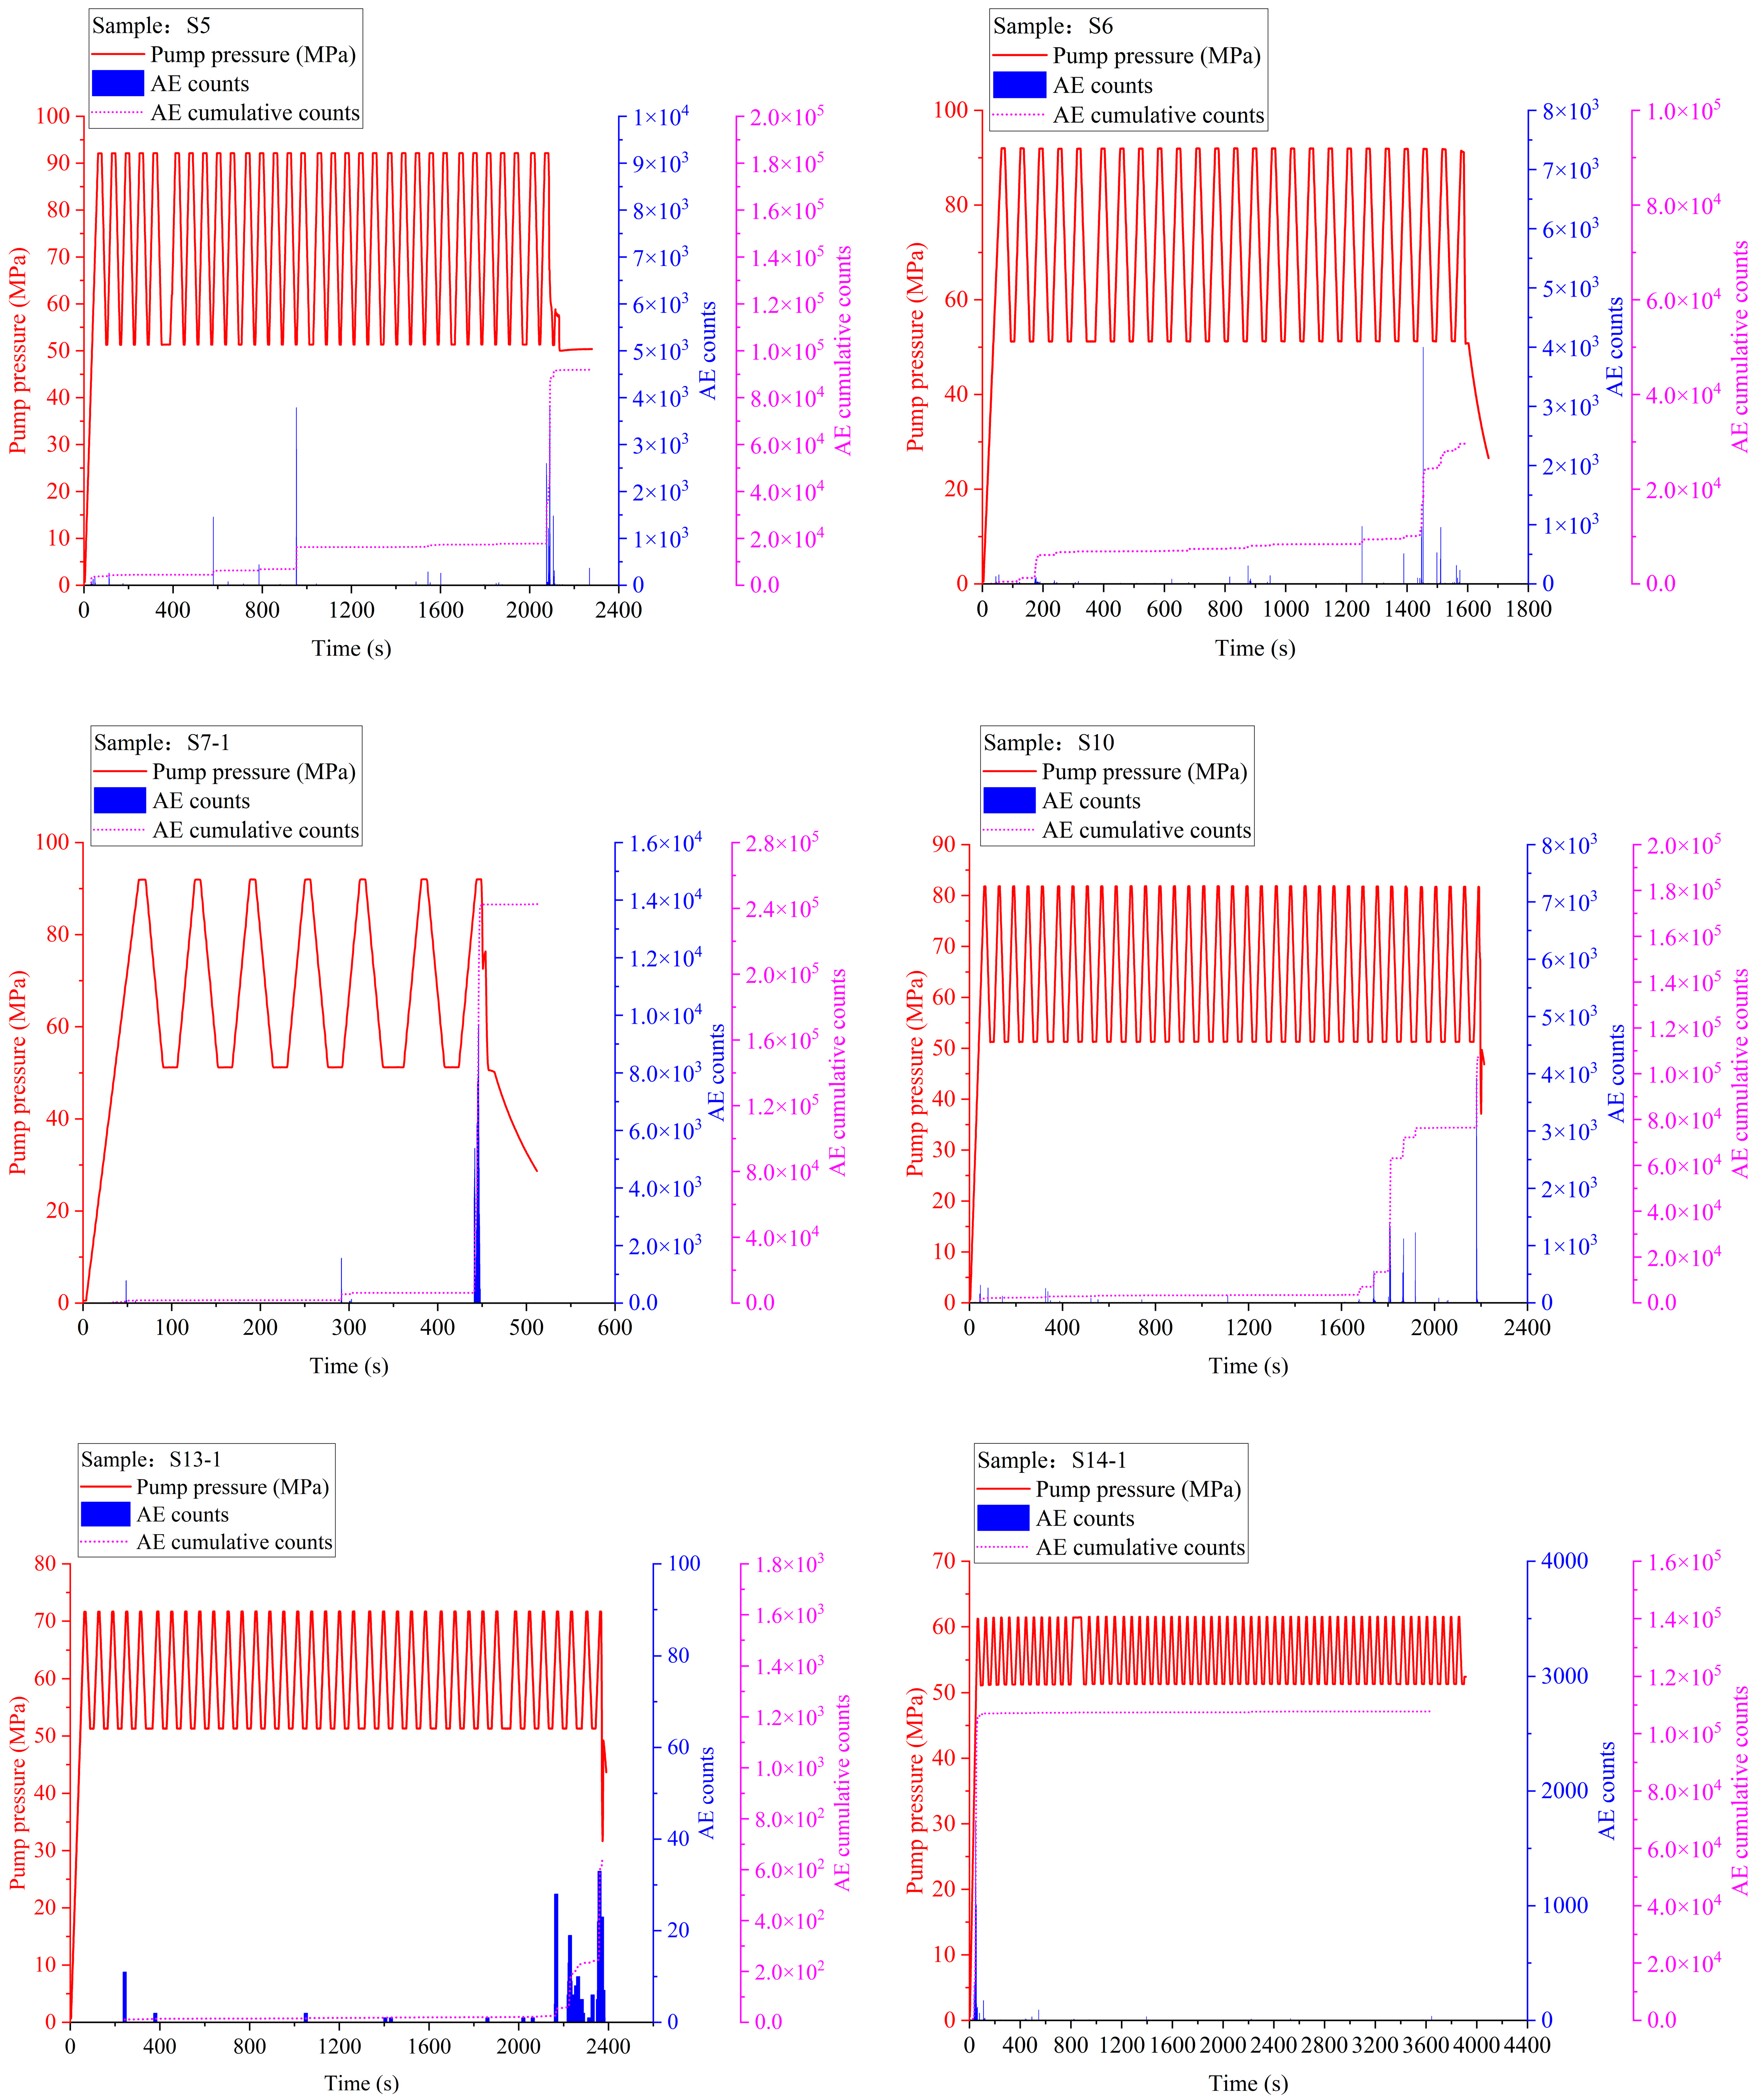
In this experiment, the Disp-24 AE detection system was used for real-time monitoring of the sandstone hydraulic fracturing. The AE detection threshold was set to 45 dB, the center frequency of the sensor was 150 kHz, and the sampling rate was 1 MPS.

3.3.1. AE Counts

The internal damage and fracture of rock produce acoustic emission signals. In the acoustic-emission-signal waveform, the larger the acoustic emission counts, the more serious the internal rock damage, and the faster the crack propagation. The AE counts represent the number of times the threshold was exceeded within the signal. During the initiation and propagation of sandstone hydraulic fractures, the AE cumulative counts increased continuously, and the water injection pressure changed accordingly.
The relationship between the AE cumulative counts and injection time of the samples is shown in Figure 14. In the early stage of fracturing, the AE counts were equal to 0, because the fracturing fluid filled the closed space between the pipeline, the wellbore, and the bottom of the open-hole section of the sample, and there was no microcrack initiation. When the fracturing fluid was filled, the pressure began to increase significantly, and cracks formed inside the sample, resulting in the release of elastic energy. When the fracturing fluid filled the fracture, the pressure increased again, the AE cumulative counts increased, and the curve was concave. This was because of the generation and closure of microcracks, with the AE counts becoming more frequent and active, and the AE cumulative counts curve rising, which meant more severe microcrack growth and greater damage. When the microcracks increased sharply, reached the limit of sample breakdown, macrocracks suddenly appeared and the most severe AE counts during the whole fracturing process occurred. There was no AE response after the fracture of the sample, because the formation of macrocracks in the sample has made it impossible to maintain the pressure to produce micro-damage in the sample. In the whole hydraulic process, the change rule of acoustic emission cumulative counts and the pump pressure curve showed a good response.
It can be seen from Figure 13 that compared with conventional hydraulic fracturing, the AE cumulative counts curve of the sample fluctuated greatly during cyclic hydraulic fracturing, rising in an obvious step-wise manner, and the microcracks in the sample developed more thoroughly. With the continuous circulating injection of fracturing fluid, each time the AE cumulative counts increased, new hydraulic cracks continuously generated and expanded in the sample. Before the formation of macroscopic cracks, there were many microcracks in the sample. At this time, the sample was relatively complete and the AE cumulative counts only fluctuated slightly. When macrocracks formed and penetrated the whole sample, the sample became unstable and cracked. At this time, the AE cumulative counts accelerated and the fluctuation was the most obvious.

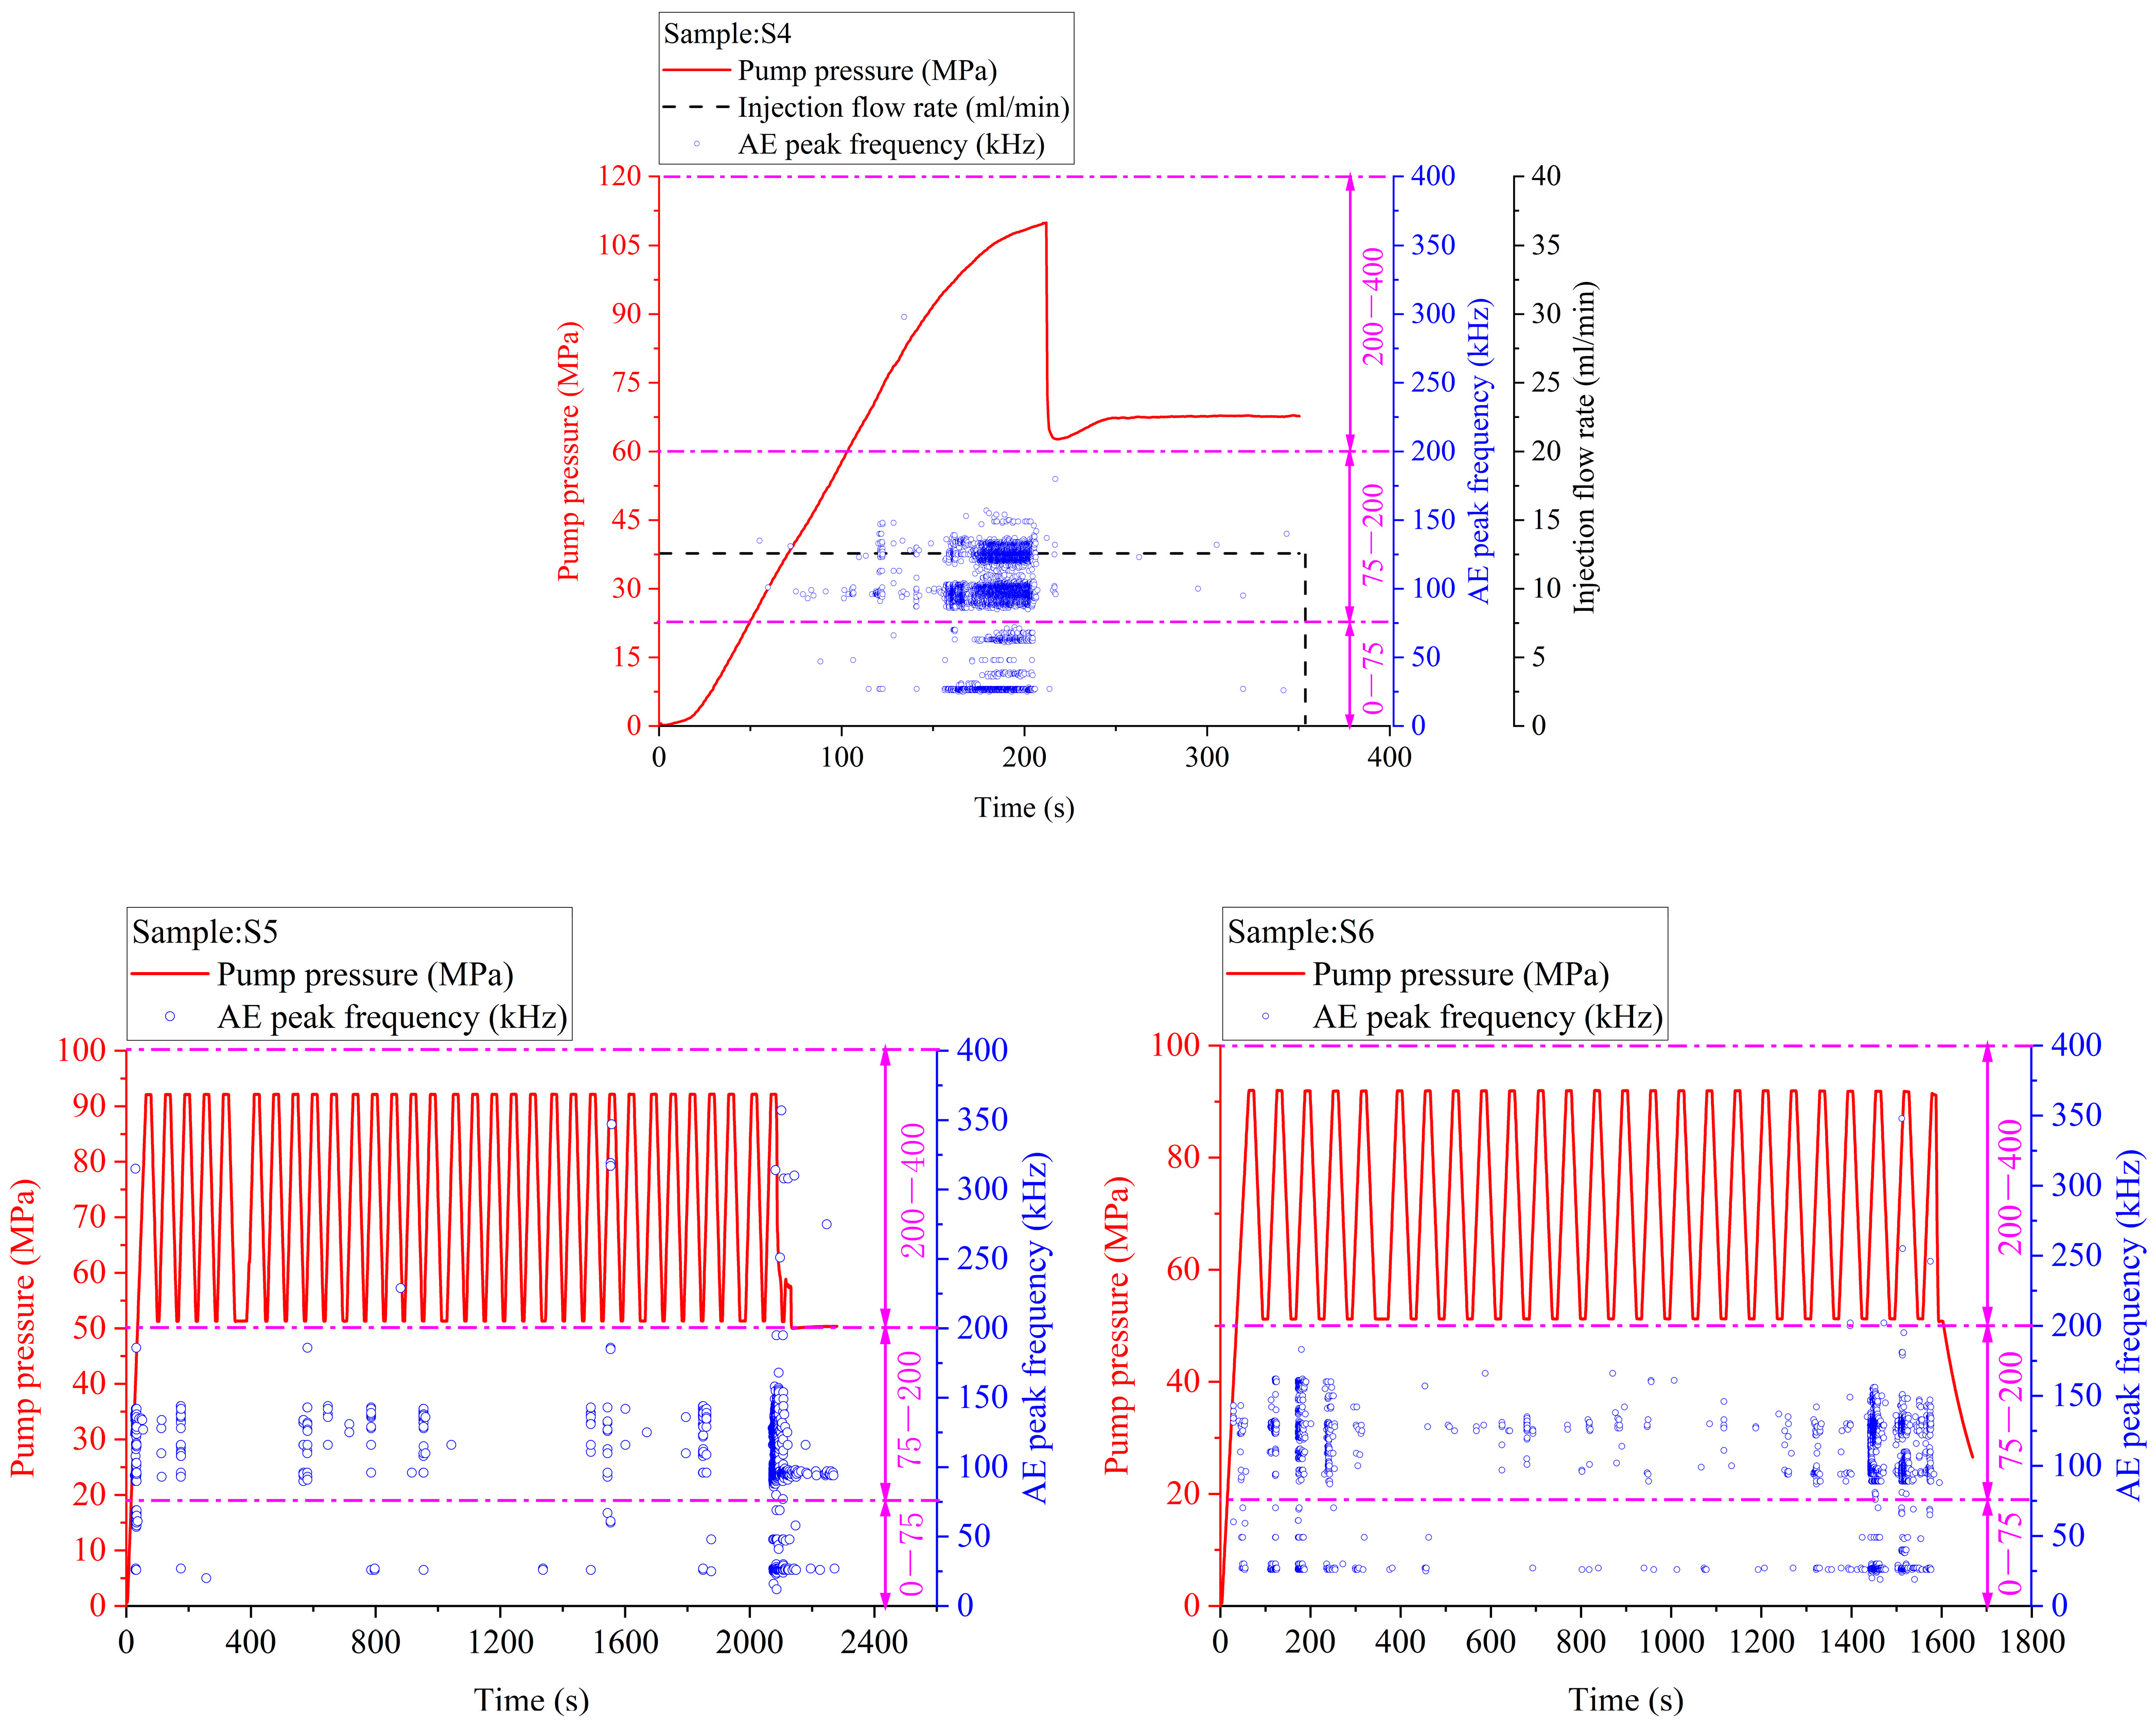
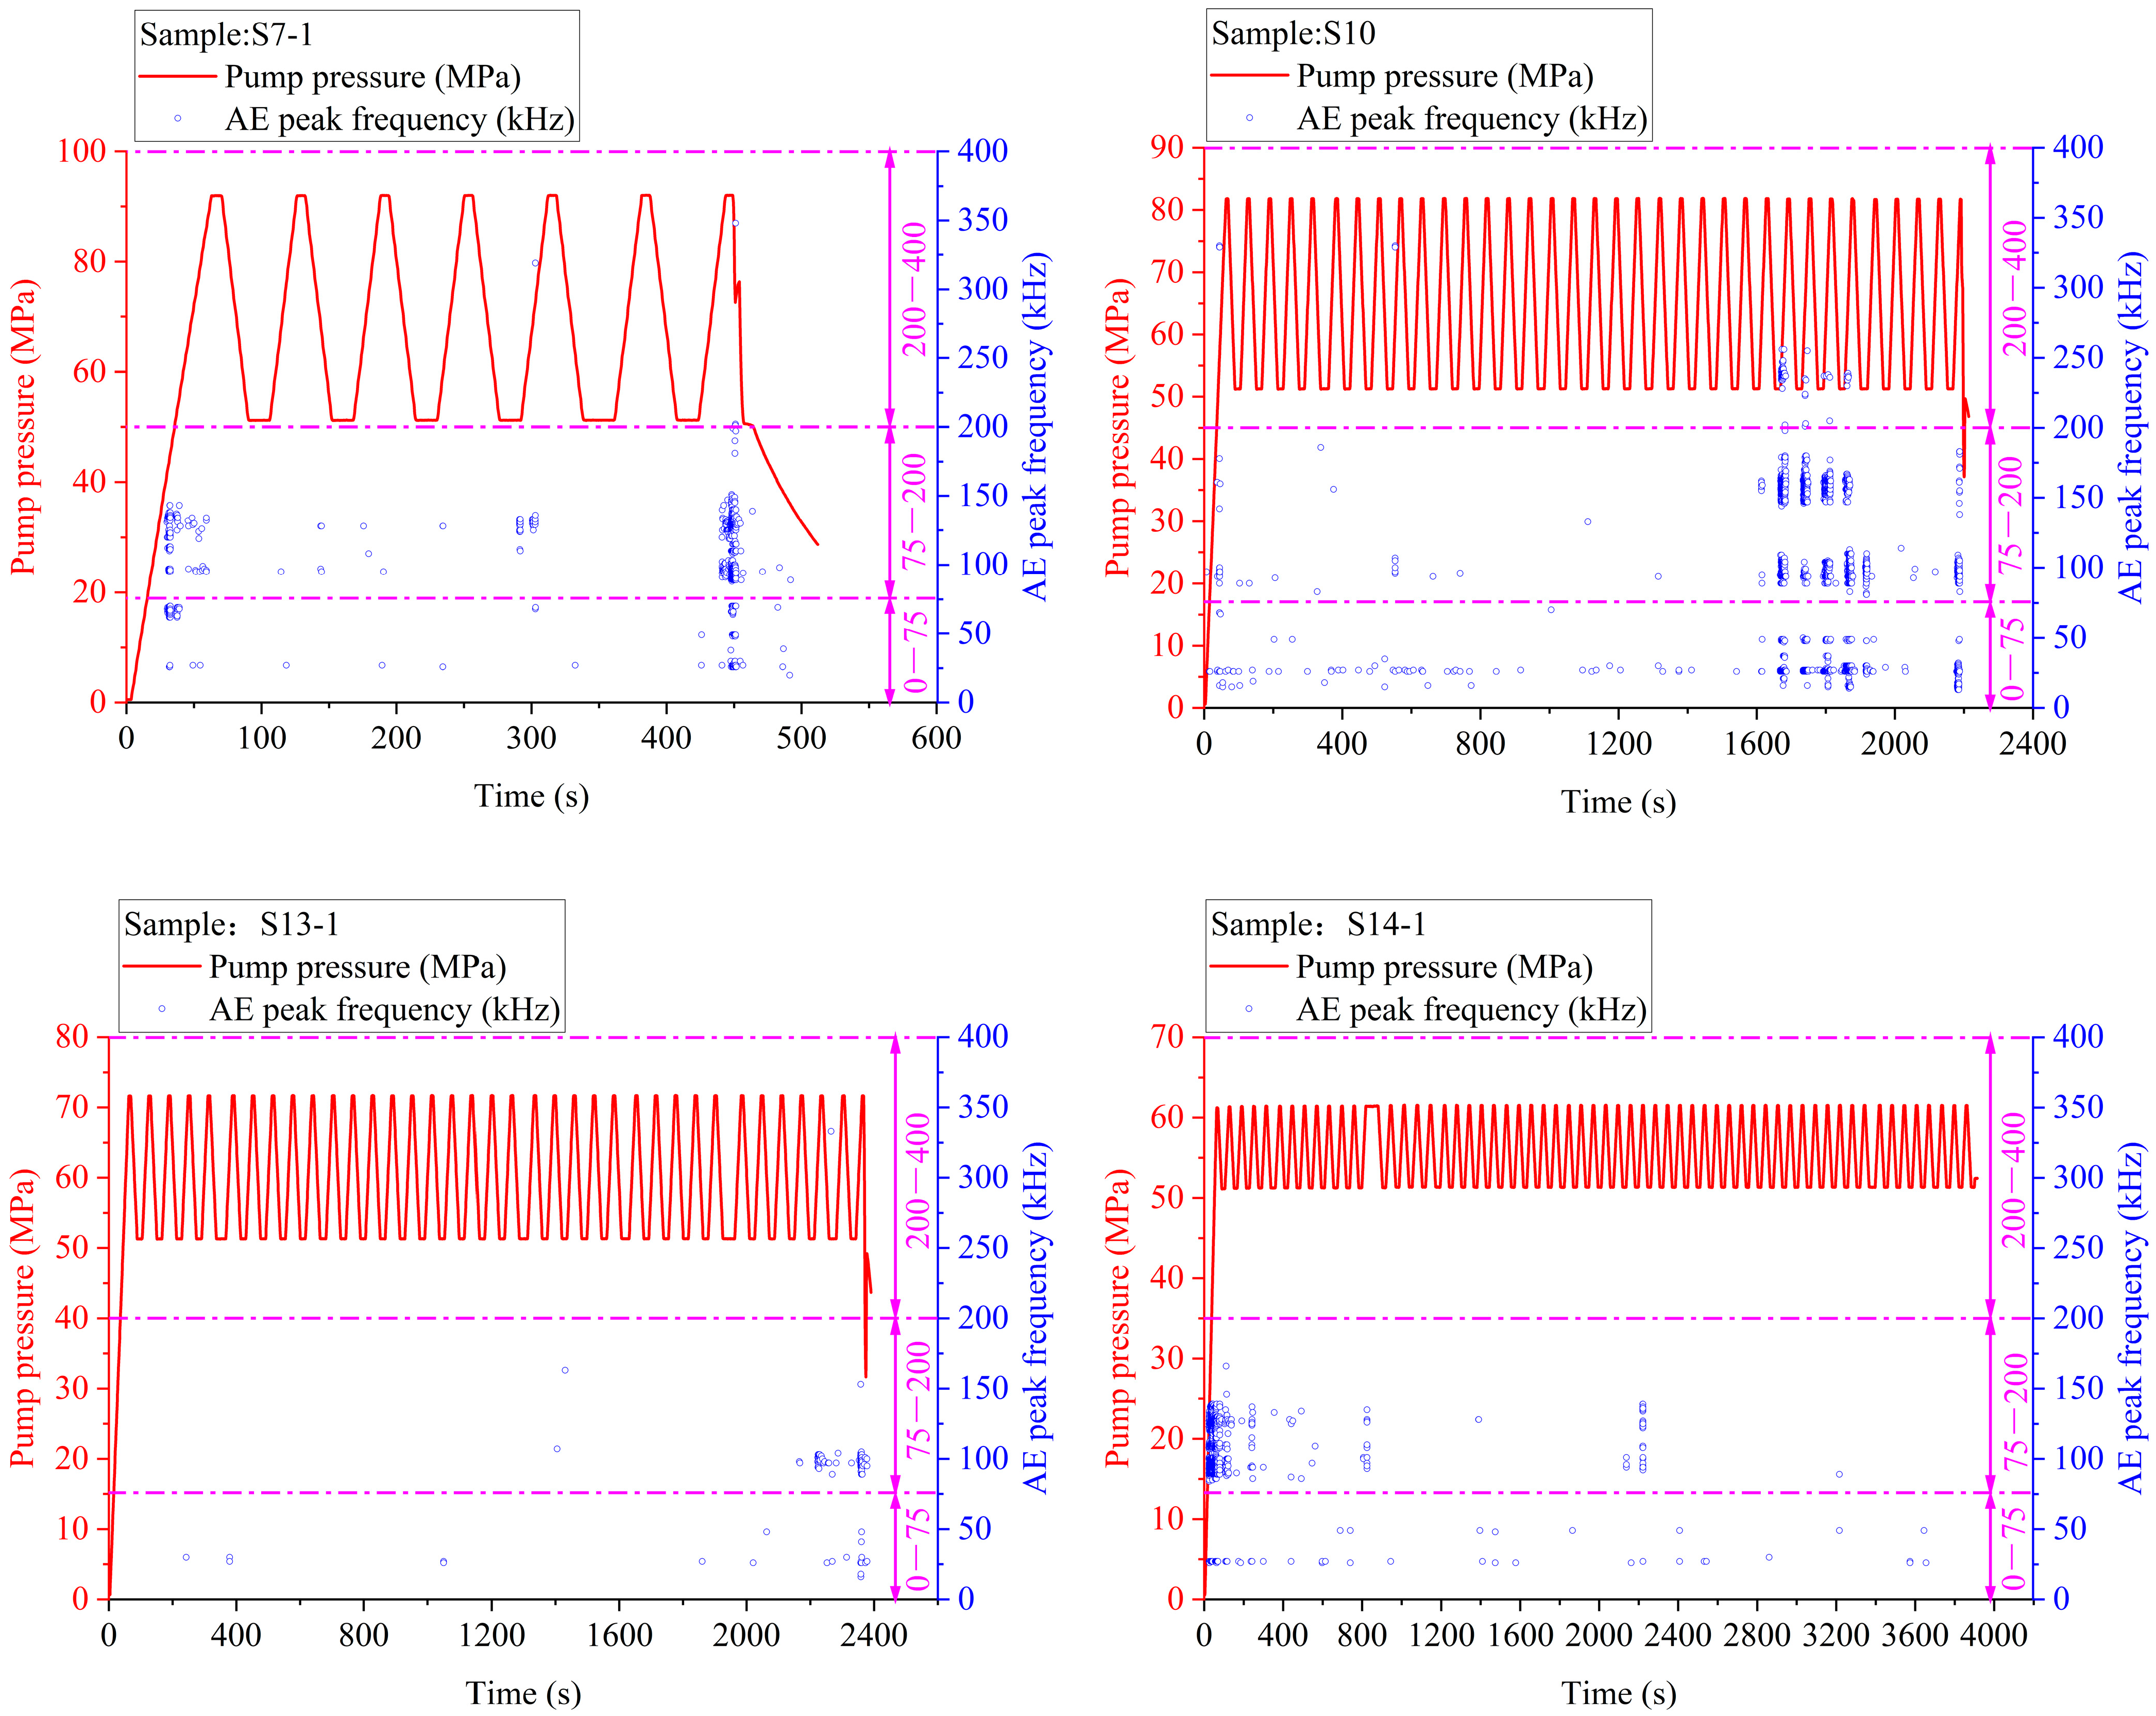
3.3.2. AE Peak Frequency

Frequency is the key parameter used to analyze the rock failure mechanisms and to reveal the internal stress state of the rock during loading [24]. Different acoustic emission frequencies reflect different crack-initiation mechanisms and types. The frequency of the maximum amplitude point in the spectrum is the peak frequency of the AE signal. The low frequency acoustic emission signal corresponds to the large-scale crack, while the high frequency acoustic emission signal is related to the small-scale crack [25]. The frequency characteristics of AE can be used to characterize the microfracturing process that leads to rock failure.
As shown in Figure 15, it can be observed that the peak frequency had a good correlation with the pump pressure curve. The AE peak frequency signal distribution of the sample had obvious coherent and horizontal band characteristics. These peak frequencies can be divided into low frequency, medium frequency, and high frequency, with the range of 0–75 kHz, 75–200 kHz, and 200–400 kHz, respectively. These peak-frequency bands correspond to different damage stages of the hydraulic-fracturing process of the sample.
Regardless of conventional hydraulic fracturing or cyclic hydraulic fracturing, low-frequency and medium-frequency events always exist and run through the whole experimental process, but high-frequency events only occur before the sample breaks or not. As shown in Table 3, the acoustic emission peak-frequency signals were mainly represented by low frequency and medium frequency, accounting for more than 98% of the peak frequencies. There were few or no high peak-frequency signal event points. From the average proportion of peak frequencies, the descending order was as follows: medium frequency > low frequency > high frequency. It can also be seen that the proportion of low frequency and high frequency events of conventional hydraulic fracturing samples was the smallest among the fracture samples, indicating that the proportion of corresponding large-scale and small-scale fractures was small, that is, cyclic hydraulic fracturing could produce more microfractures.
During the hydraulic-fracturing process, the number of AE events at low and medium frequencies increased significantly at the same time and appeared to be locally concentrated. This phenomenon is known as “simultaneous multi-frequency response” [26], which indicates that the specimen had fractured, which is consistent with the microfracture expansion pattern in the rock mass. In the initial stage of hydraulic fracturing, microcracks gradually appeared inside the rock mass, and at this stage, the microcracks were relatively isolated and the peak-frequency distribution was relatively single and discrete. With the increase in pump pressure, the microfractures gathered and gradually penetrated the internal pores of the rock mass and began to form fractures. When the cracks continued to extend until they penetrated the rock sample, a large area of cracks occurred inside the sample, the pump pressure dropped sharply, the number of AE events increased sharply, and the peak frequency distribution involved a larger area with a local concentration phenomenon.
During the cyclic hydraulic-fracturing process, the AE peak-frequency signal distribution of the specimens not only had obvious coherent and horizontal band characteristics, but also had strip characteristics in the vertical direction at some cyclic time periods, and three different peak frequencies always appeared at the same time, which was especially obvious at the beginning of the pump-pressure-rise stage and the last cycle when the specimen was about to rupture.

4. Conclusions

Based on the lithological characteristics of the sandstone formation, the pump pressure curves, post-rupture hydraulic fracture morphology, acoustic emission cumulative counts, and acoustic emission peak frequency during hydraulic fracturing of sandstone samples were analyzed, and the following conclusions can be drawn.
(1)
Compared with conventional hydraulic fracturing, cyclic hydraulic fracturing under high-ground-stress conditions can effectively reduce the specimen breakdown pressure by more than 30%, and the upper limit of the cyclic pump pressure of 70%Pb can make the specimen break down. The minimum threshold of the upper limit of the cyclic pump pressure which can make the specimen break down is between 60%Pb and 70%Pb.
(2)
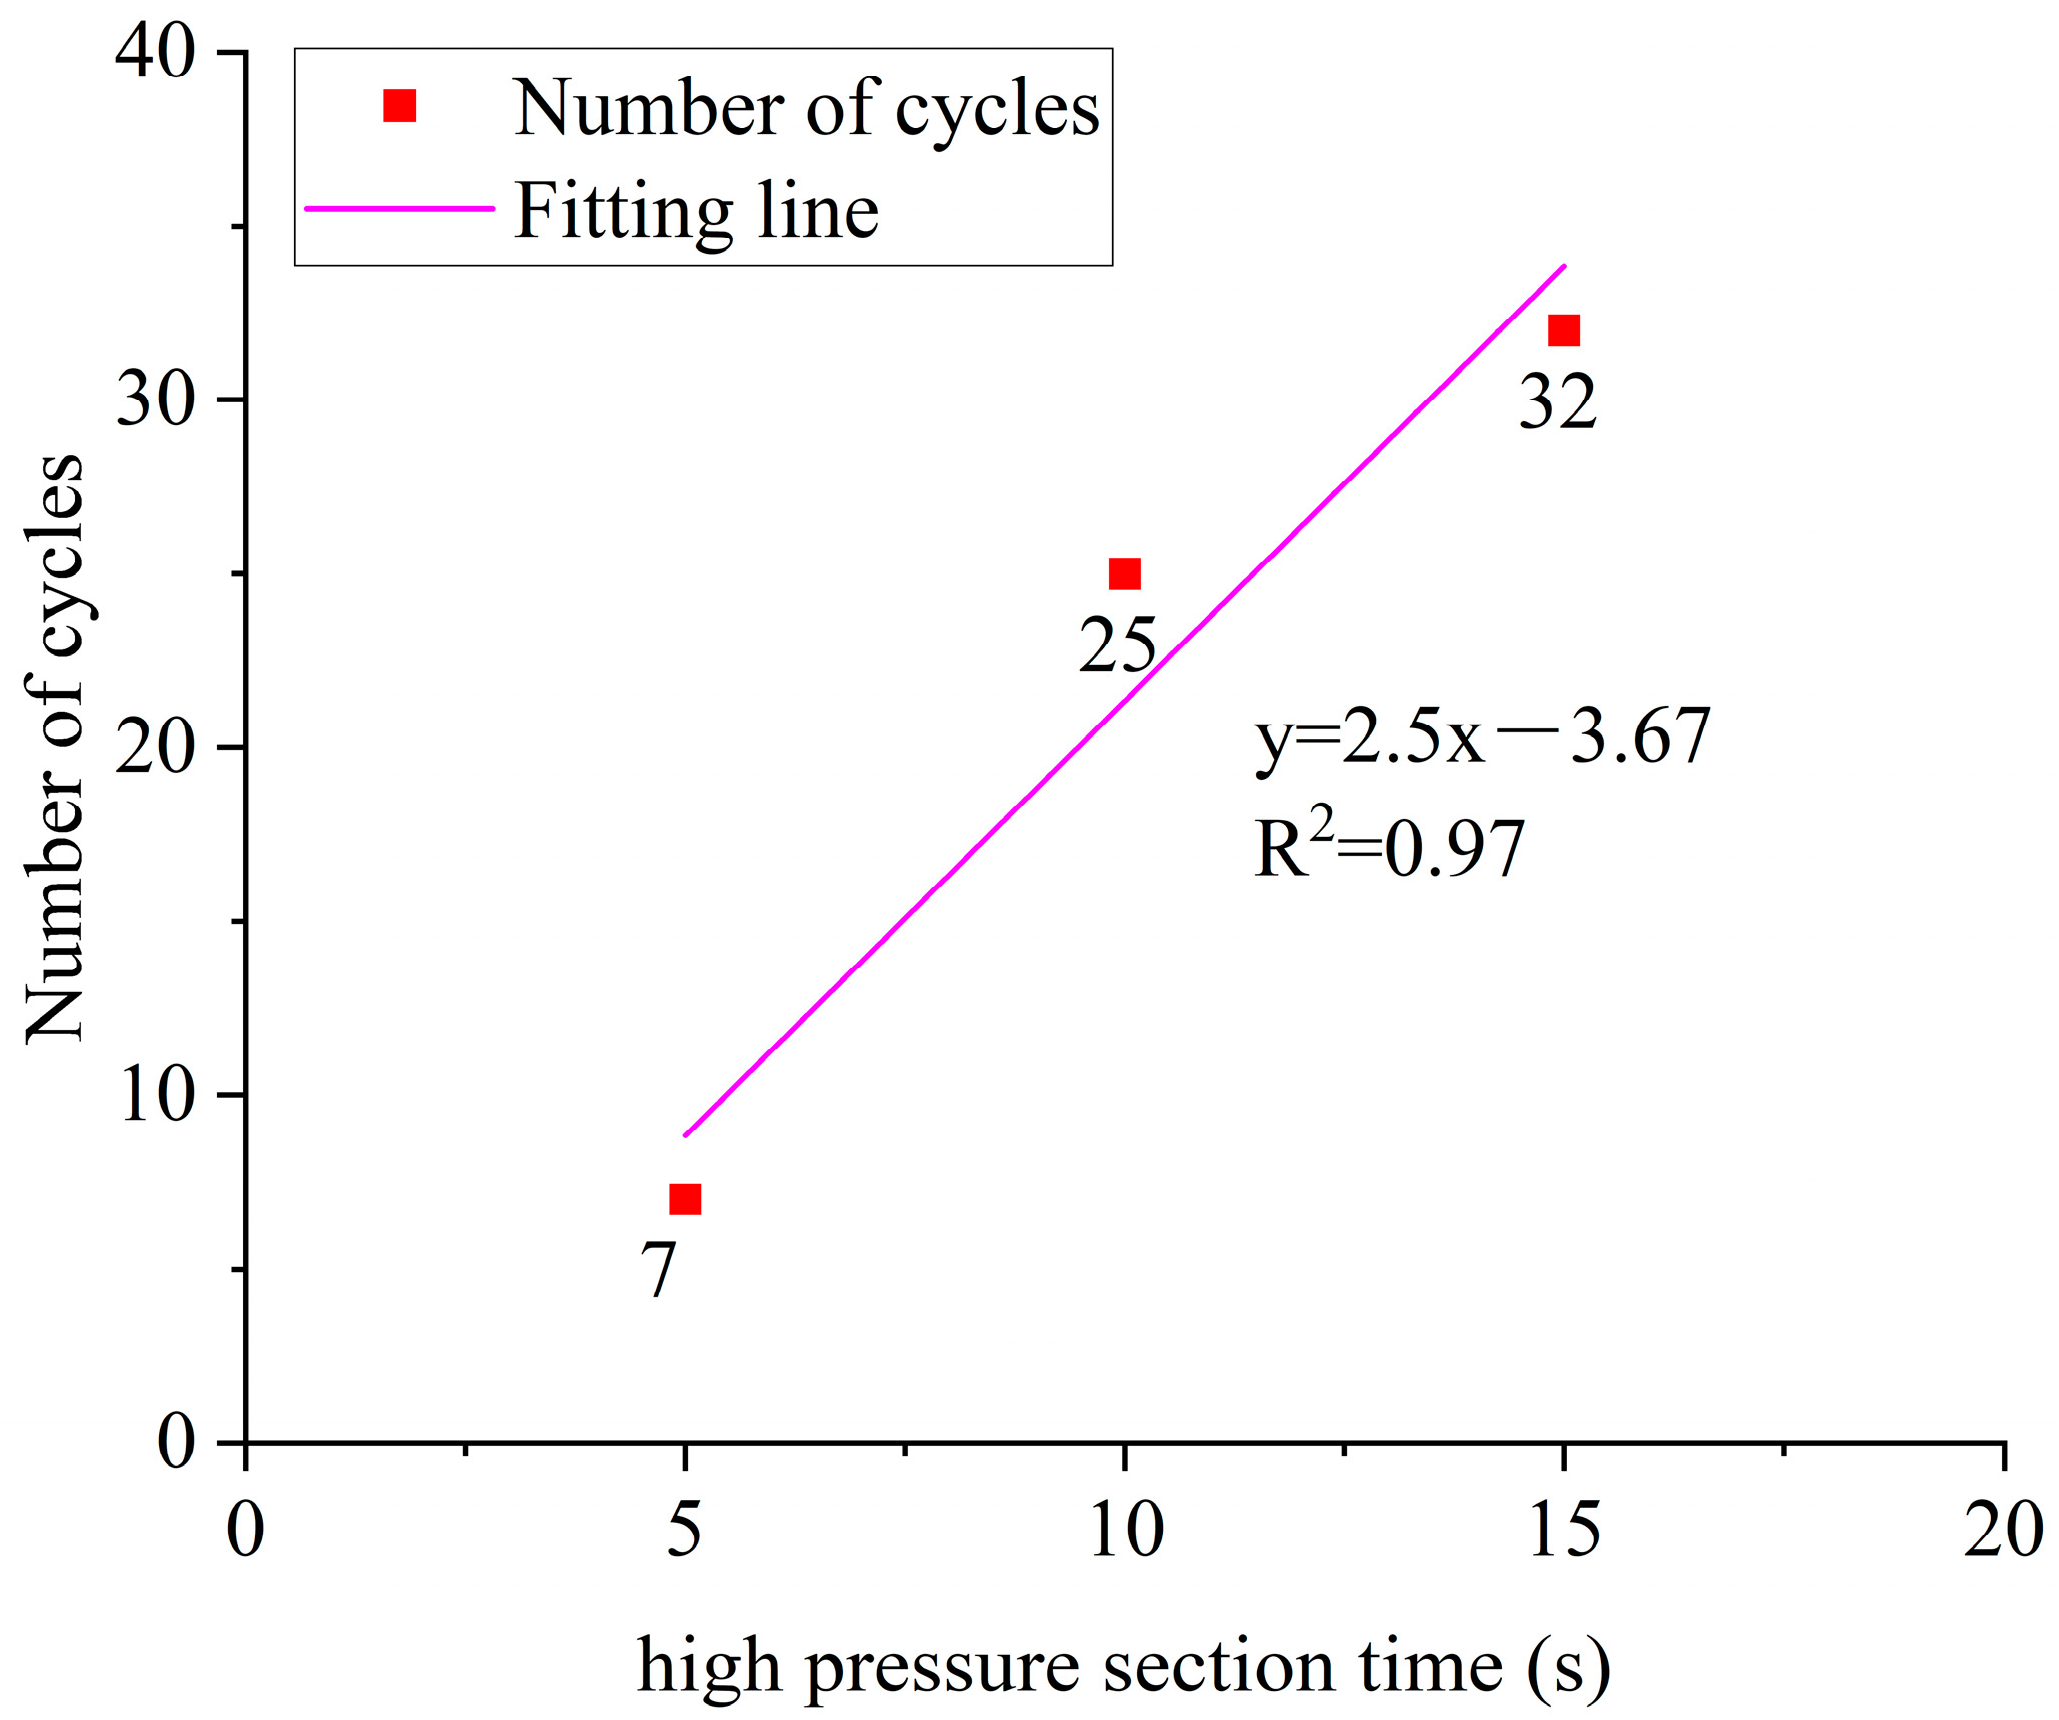
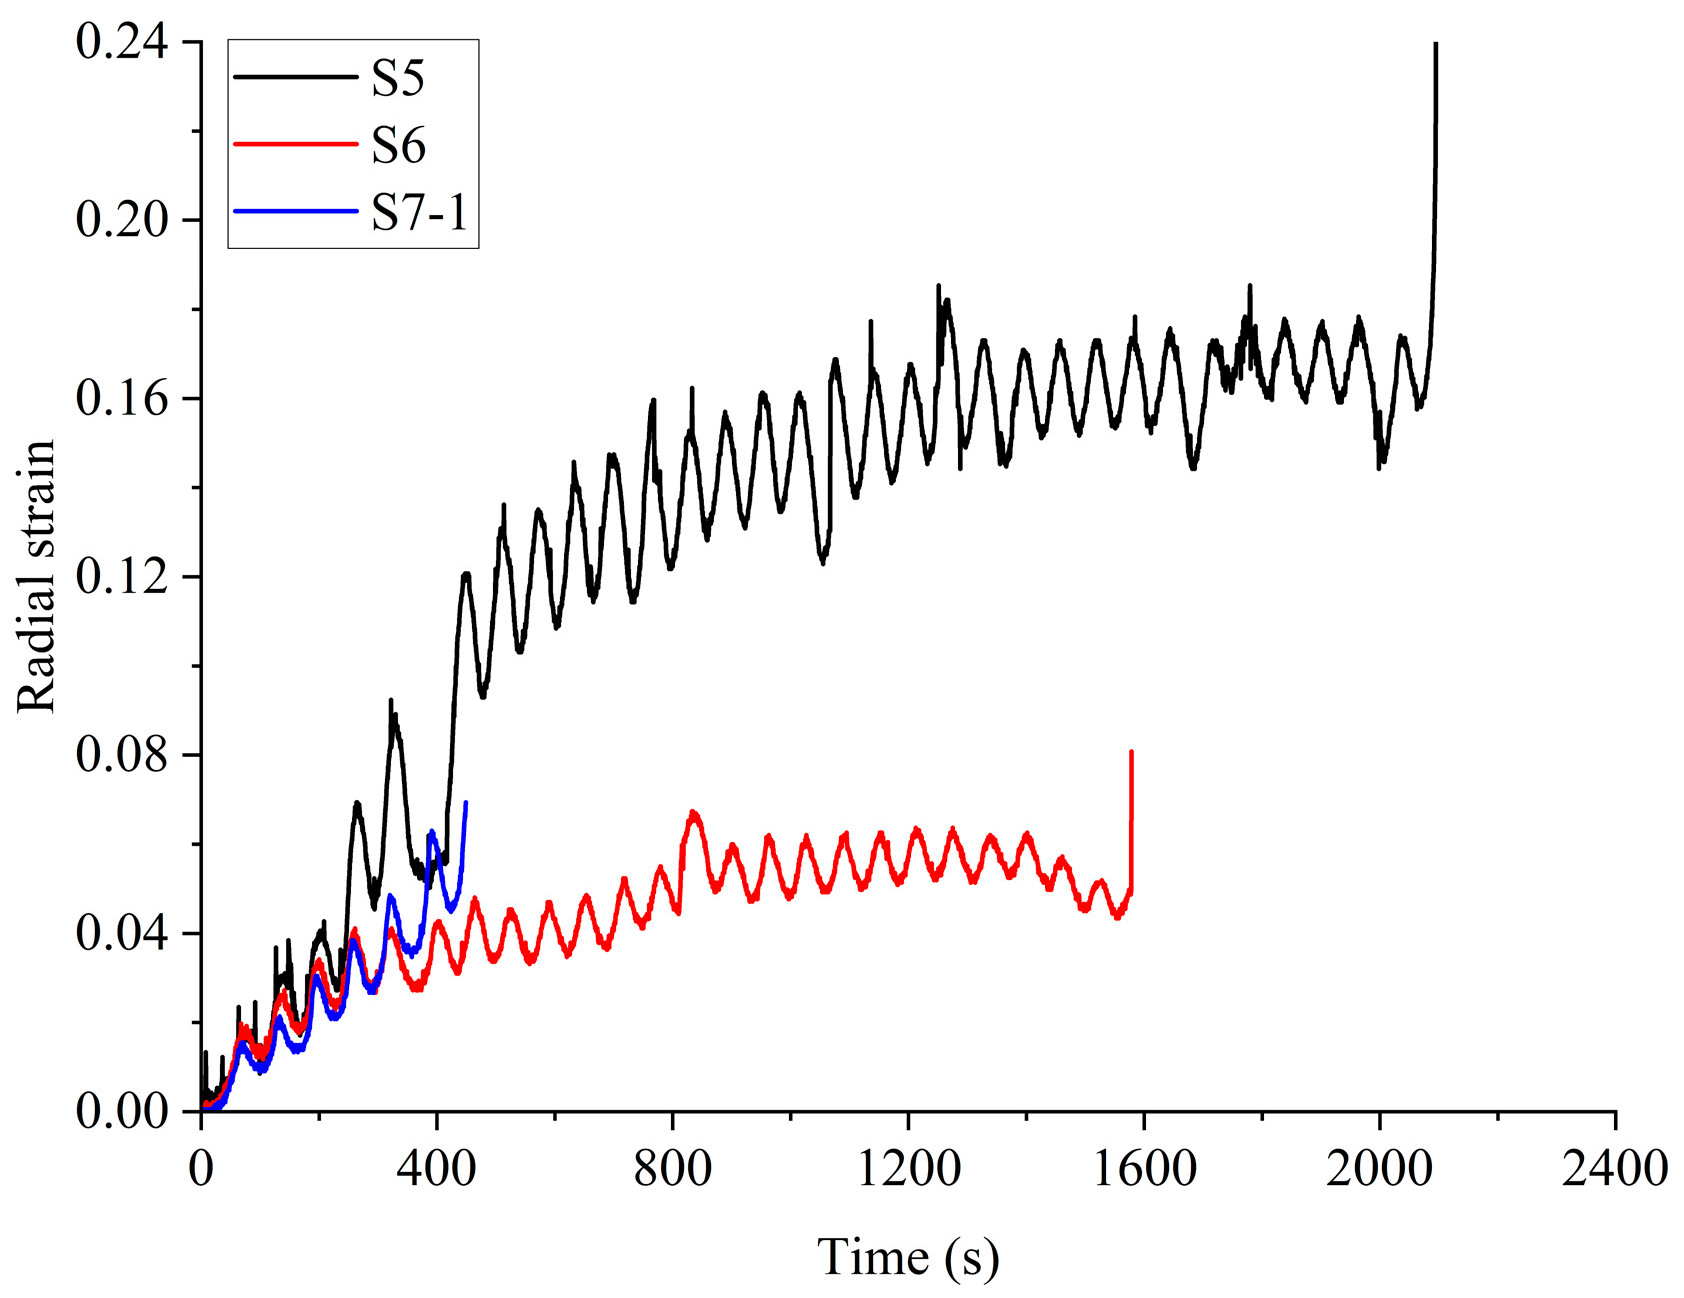
In cyclic hydraulic fracturing, when the upper limit of the cyclic pump pressure is the same, the high-pressure duration decreases from 15 s to 10 s and to 5 s, the cycles required for the specimen breakdown decreases from 32 to 25 to 7. This means that the shorter the high-pressure duration, the more easily the specimen expands and breaks down.
(3)
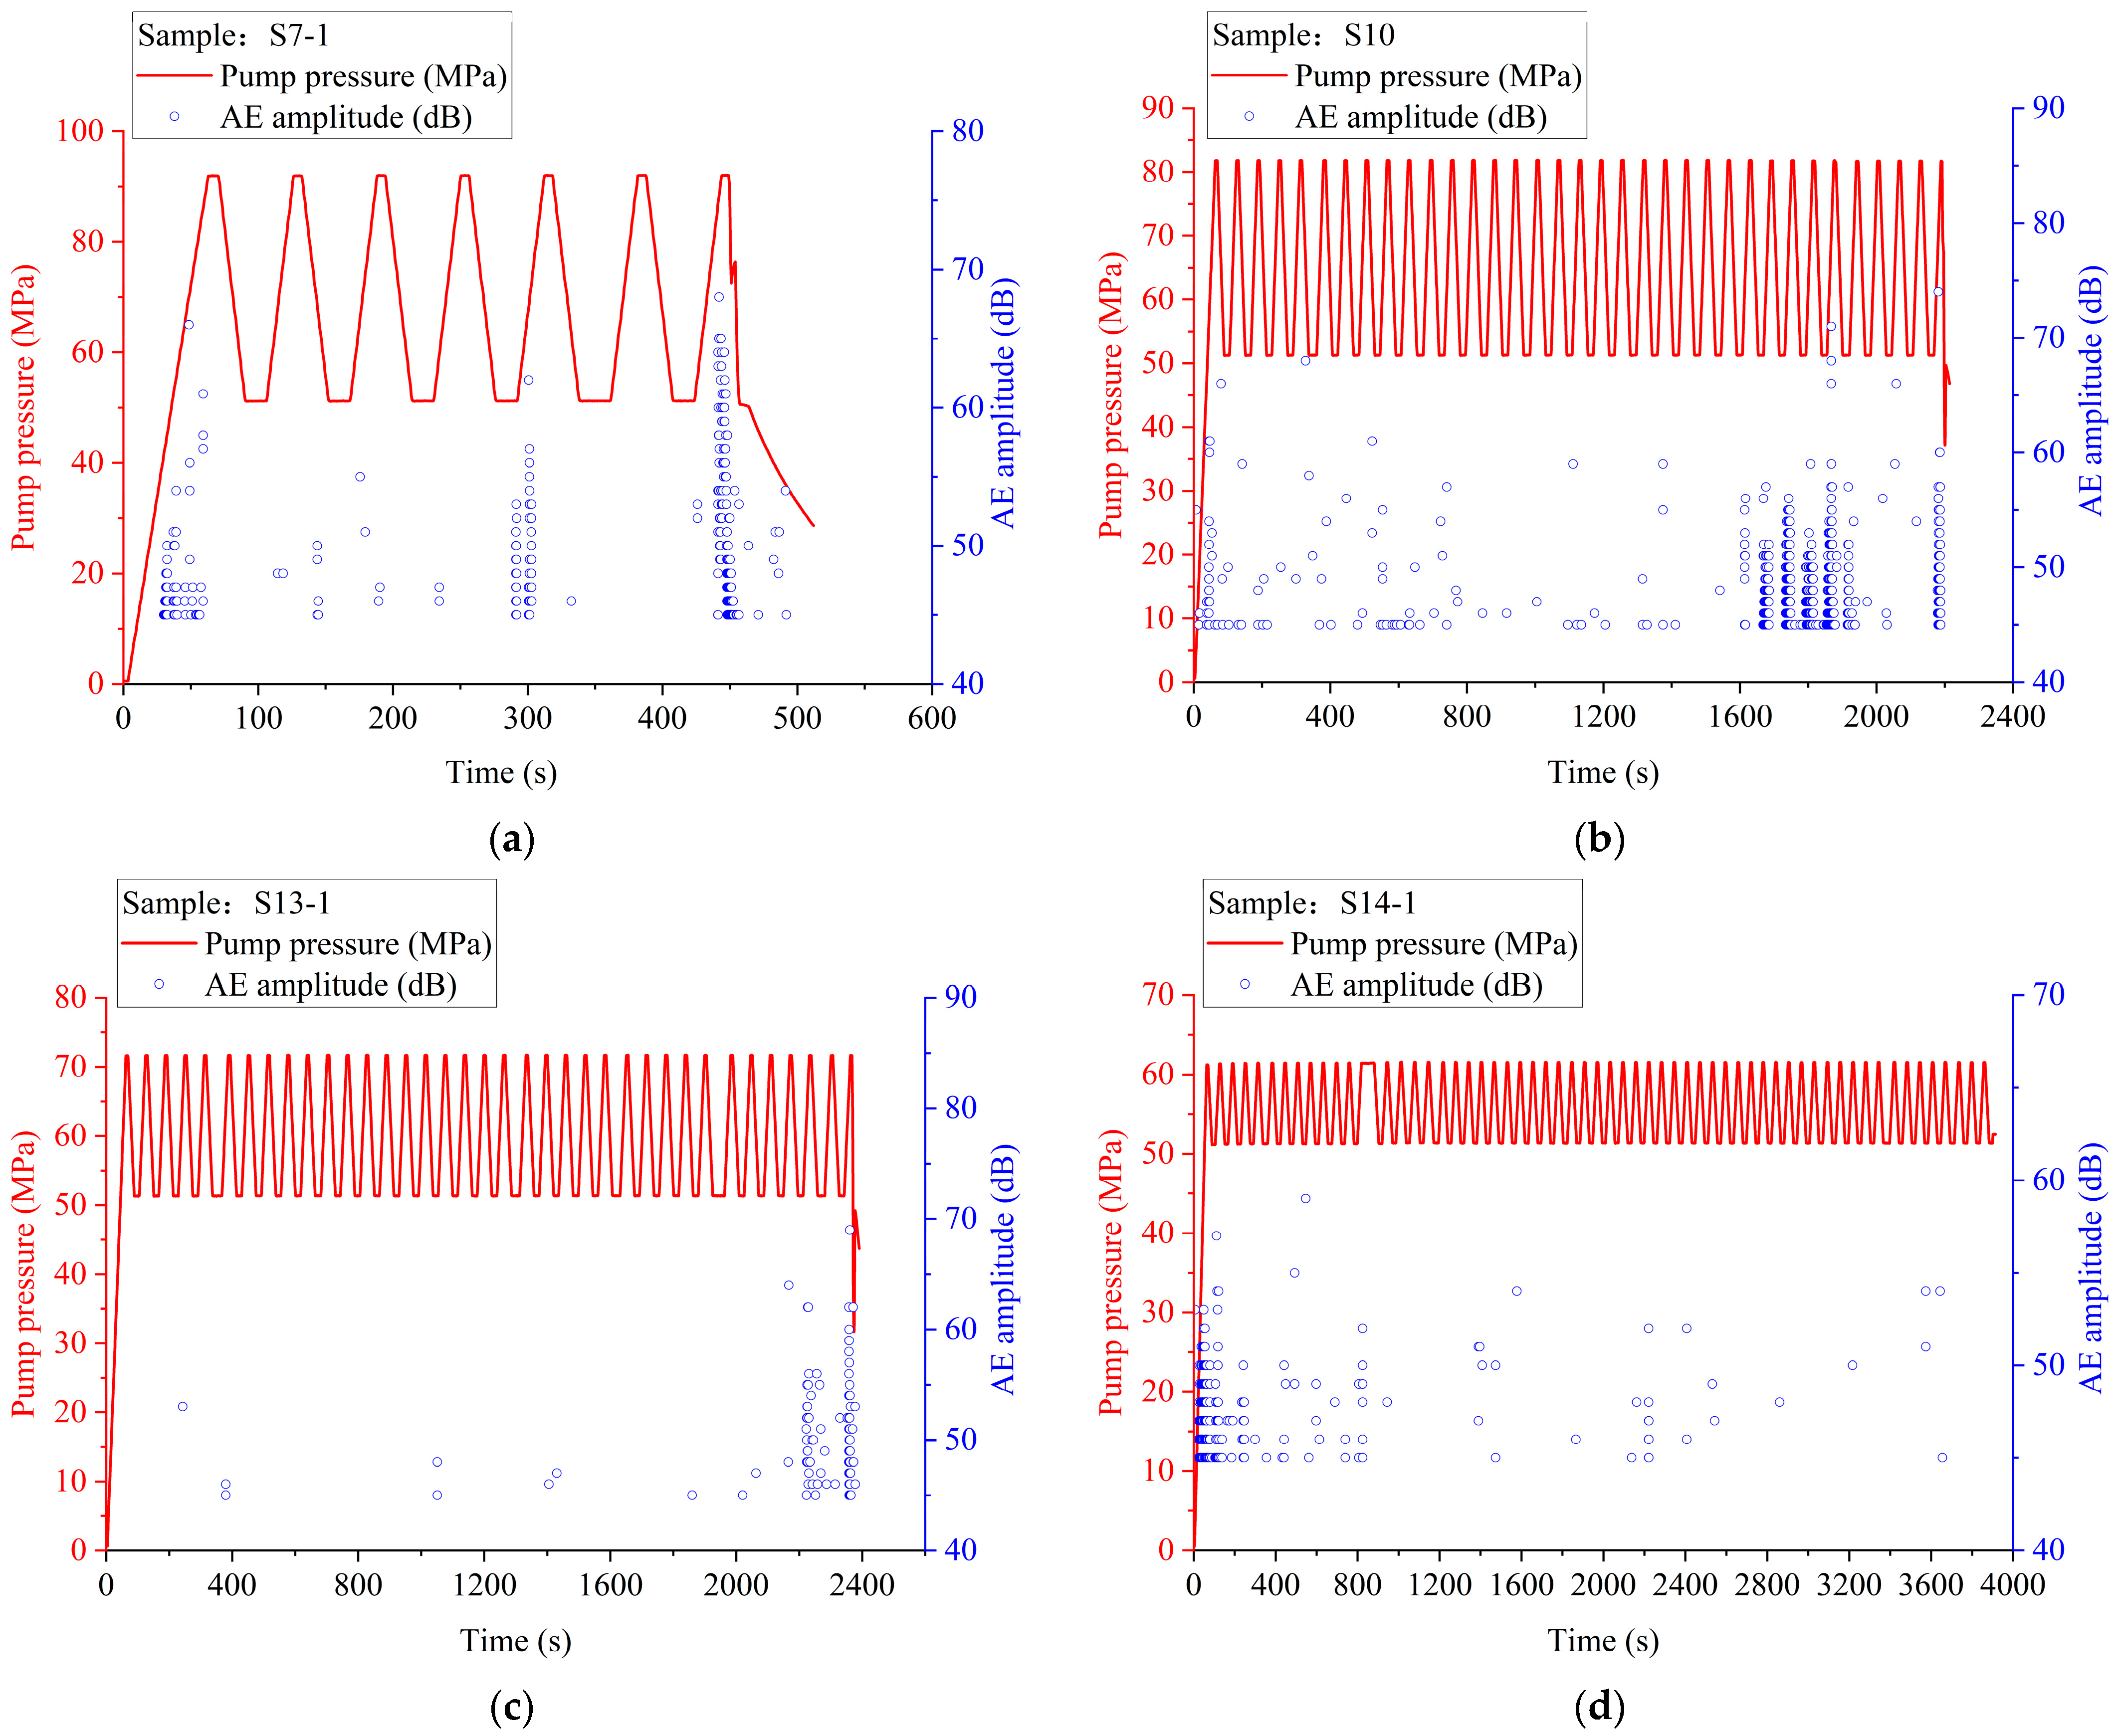
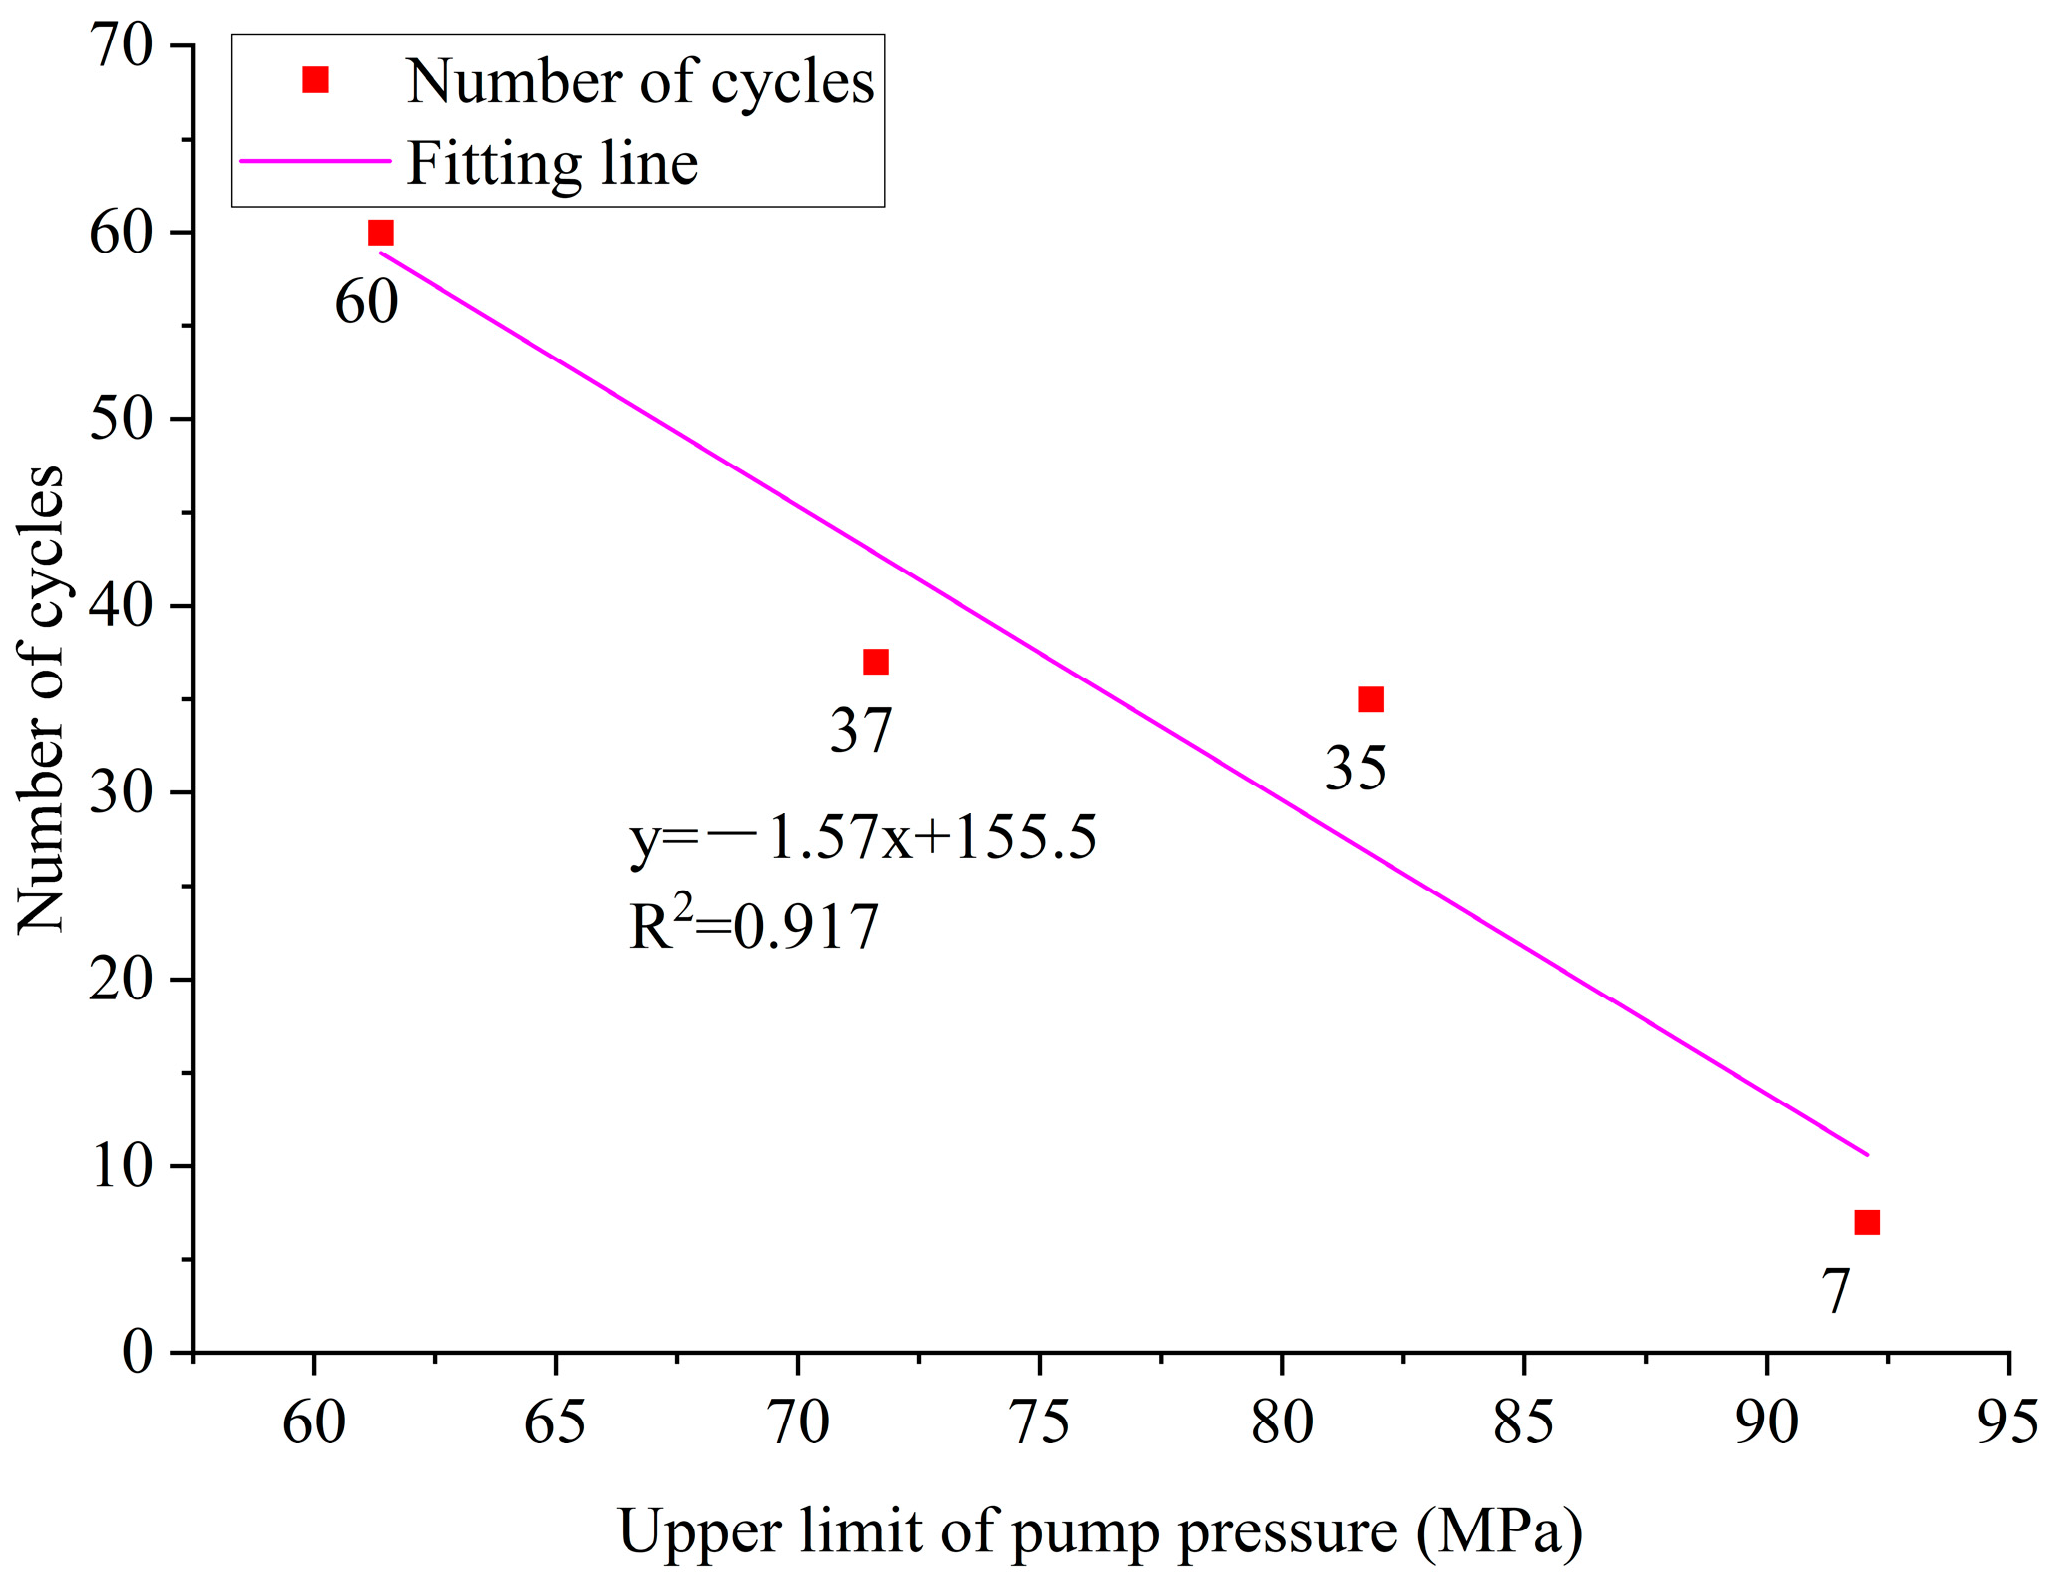
In cyclic hydraulic fracturing, under the same condition of “high-pressure duration + low-pressure duration”, the cycles required for breakdown increases as the upper limit of the cyclic pump pressure decreases from 90%Pb to 60%Pb, which means that the larger the upper limit of the cyclic pump pressure, the more favorable the extended rupture of the specimen.
(4)
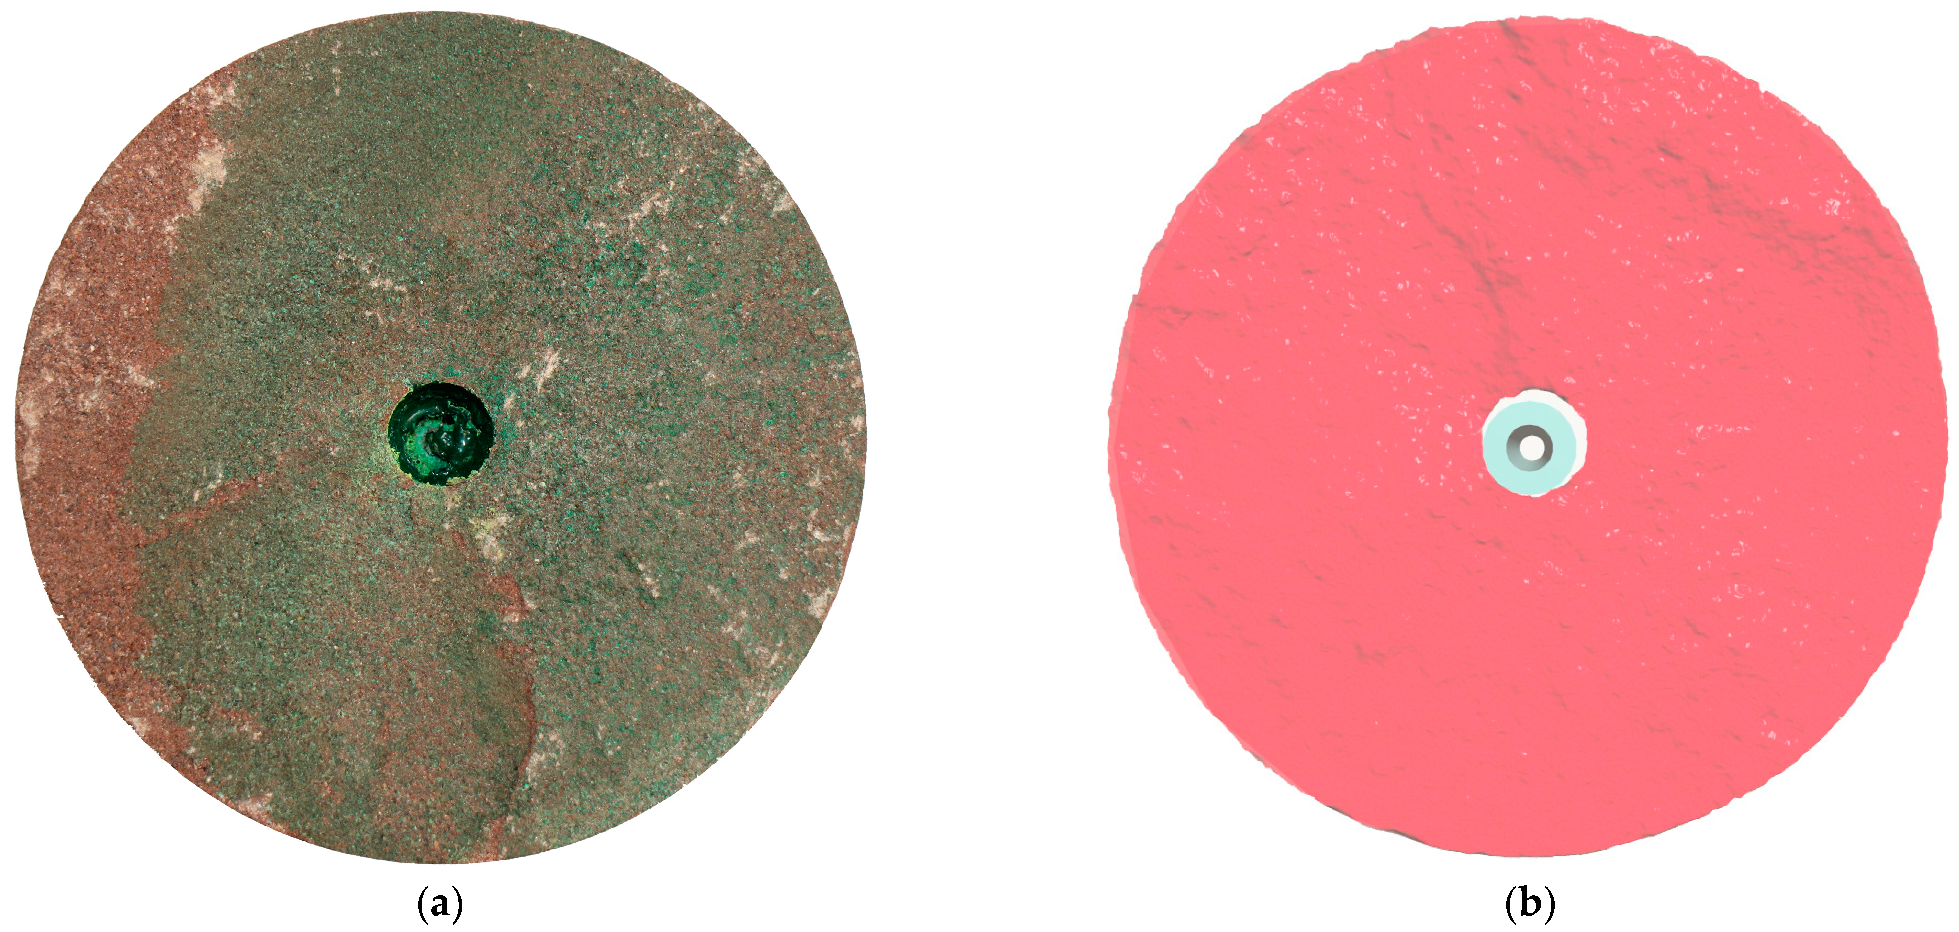
Compared with conventional hydraulic fracturing, the fracture morphology of cyclic hydraulic fracturing specimens is more complex and diverse, with higher undulations and larger sizes.
(5)
AE events show a good response to the pump pressure curves of sandstone samples, with AE counts sporadically presenting in the early stage and sharply increasing near the breakdown pressure; AE peak frequencies are distributed in horizontal bands, mainly divided into low, medium, and high parts, and AE peak frequencies in cyclic hydraulic fracturing are also characterized by bands in the vertical direction.
Hydraulic fracturing of rock is a complex process. In this study, we analyzed the pump pressure curves, post-rupture fracture morphology, and acoustic emission characteristic information of sandstone under conventional hydraulic fracturing and cyclic hydraulic fracturing through typical experiments, and summarized some important observations. However, there were some limitations in the study. For example, we did not apply different sizes of circumferential pressures to the samples, and we did not consider the effects of fracturing fluid flow-rate and fracturing fluid viscosity. These shortcomings should be considered in future studies.

Author Contributions

Conceptualization, X.W. and Y.G.; data curation, X.W., X.C. and Z.B.; formal analysis, X.W. and Y.G.; funding acquisition, X.C.; investigation, Z.B. and G.Z.; project administration, X.C.; resources, Y.G.; supervision, Y.G.; validation, H.Y. and W.G.; writing—original draft, X.W., Y.G. and Z.B.; writing—review and editing, X.W., Y.G. and G.Z. All authors have read and agreed to the published version of the manuscript.

Funding

This work was sponsored by the “National Natural Science Foundation of China” (No. 52104010), the “Sinopec Science and Technology Department Project” (No. P21056).

Data Availability Statement

Not applicable.

Conflicts of Interest

The authors declare no conflict of interest.

References

  1. Guo, T.; Tang, S.; Liu, S.; Liu, X.; Xu, J.; Qi, N.; Rui, Z. Physical simulation of hydraulic fracturing of large-sized tight sandstone outcrops. SPE J. 2021, 26, 372–393. [Google Scholar] [CrossRef]
  2. Duan, W.; Sun, B.; Pan, D.; Wang, T.; Guo, T.; Wang, Z. Experimental study on fracture propagation of hydraulic fracturing for tight sandstone outcrop. Energy Explor. Exploit. 2021, 39, 156–179. [Google Scholar] [CrossRef]
  3. Lou, Y.; Zhang, G.; Wang, X. Study on fracture mechanism of hydraulic fracturing in sandstone by acoustic emission parameters. In Proceedings of the ISRM European Rock Mechanics Symposium-EUROCK 2017, Ostrava, Czech Republic, 20–22 June 2017; OnePetro: Richardson, TX, USA, 2017. [Google Scholar]
  4. He, J.; Lin, C.; Li, X.; Zhang, Y.; Chen, Y. Initiation, propagation, closure and morphology of hydraulic fractures in sandstone cores. Fuel 2017, 208, 65–70. [Google Scholar] [CrossRef]
  5. Zhu, W.; Wang, S.; Chang, X.; Zhai, H.; Wu, H. Three-Dimensional Ultrasonic Imaging and Acoustic Emission Monitoring of Hydraulic Fractures in Tight Sandstone. Appl. Sci. 2021, 11, 9352. [Google Scholar] [CrossRef]
  6. Ma, D.; Cheng, C.; Ding, C.; Song, J.; Hu, D.; Zhou, H. Comparisons of fracturing mechanism of tight sandstone using liquid CO2 and water. J. Nat. Gas Sci. Eng. 2021, 94, 104108. [Google Scholar] [CrossRef]
  7. Muqtadir, A.; Elkatatny, S.; Mahmoud, M.; Abdulraheem, A.; Gomaa, A. Effect of the type of fracturing fluid on the breakdown pressure of tight sandstone rocks. In Proceedings of the SPE Kingdom of Saudi Arabia Annual Technical Symposium and Exhibition, Dammam, Saudi Arabia, 23–26 April 2018; OnePetro: Richardson, TX, USA, 2018. [Google Scholar]
  8. Yang, B.; Wang, H.; Shen, Z.; Olorode, O.; Wang, B.; Zheng, Y.; Yan, W.; Jia, Z. Full-Sample X-ray Microcomputed Tomography Analysis of Supercritical CO2 Fracturing in Tight Sandstone: Effect of Stress on Fracture Dynamics. Energy Fuels 2021, 35, 1308–1321. [Google Scholar] [CrossRef]
  9. Cai, C.; Tao, Z.; Ren, K.; Liu, S.; Yang, Y.; Feng, Y.; Su, S.; Hou, P. Experimental investigation on the breakdown behaviours of sandstone due to liquid nitrogen fracturing. J. Pet. Sci. Eng. 2021, 200, 108386. [Google Scholar] [CrossRef]
  10. Zhuang, L.; Kim, K.; Jung, S.; Nam, Y.; Min, K.-B.; Park, S.; Zang, A.; Stephansson, O.; Zimmermann, G.; Yoon, J. Laboratory evaluation of induced seismicity reduction and permeability enhancement effects of cyclic hydraulic fracturing. In Proceedings of the 51st US Rock Mechanics/Geomechanics Symposium, San Francisco, CA, USA, 25–28 June 2017; OnePetro: Richardson, TX, USA, 2017. [Google Scholar]
  11. Goyal, S.; Curtis, M.; Sondergeld, C.; Rai, C. A Comparative Study of Monotonic and Cyclic Injection Hydraulic Fracturing in Dry Tight Rocks Under Triaxial Stress. In Proceedings of the 55th US Rock Mechanics/Geomechanics Symposium, Alexandria, VA, USA, 18–25 June 2021; OnePetro: Richardson, TX, USA, 2021. [Google Scholar]
  12. Sun, X.; Luo, T.; Wang, L.; Wang, H.; Song, Y.; Li, Y. Numerical simulation of gas recovery from a low-permeability hydrate reservoir by depressurization. Appl. Energy 2019, 250, 7–18. [Google Scholar] [CrossRef]
  13. Chen, Z.; Guo, X.; Shao, L.; Li, S.; Gao, L. Sensitivity analysis of the frozen soil nonlinear latent heat and its precise transformation method. Geophys. J. Int. 2022, 228, 240–249. [Google Scholar] [CrossRef]
  14. Chen, Z.; Guo, X.; Shao, L.; Li, S.; Tian, X. Design of a three-dimensional earth pressure device and its application in a tailings dam construction simulation experiment. Acta Geotech. 2021, 16, 2203–2216. [Google Scholar] [CrossRef]
  15. Chen, Z.; Feng, Y.; Zhang, X.; Guo, X.; Shao, L.; Cao, Y.; Li, S.; Gao, L. Similarity criterion for the nonlinear thermal analysis of the soil freezing process: Considering the dual effect of nonlinear thermal parameters and boundary conditions. Acta Geotech. 2022, 17, 5709–5719. [Google Scholar] [CrossRef]
  16. Zhou, Z.-L.; Zhang, G.-Q.; Xing, Y.-K.; Fan, Z.-Y.; Zhang, X.; Kasperczyk, D. A Laboratory Study of Multiple Fracture Initiation from Perforation Clusters by Cyclic Pumping. Rock Mech. Rock Eng. 2018, 52, 827–840. [Google Scholar] [CrossRef]
  17. Liu, Y.; Xu, T.; Yuan, Y.; Feng, B.; Tang, X.; Liu, X.; Cui, Z. A laboratory study on fracture initiation and propagation of granite under cyclic-injection hydraulic fracturing. J. Pet. Sci. Eng. 2022, 212, 110278. [Google Scholar] [CrossRef]
  18. Zhou, Z.-L.; Zhang, G.-Q.; Dong, H.-R.; Liu, Z.-B.; Nie, Y.-X. Creating a network of hydraulic fractures by cyclic pumping. Int. J. Rock Mech. Min. Sci. 2017, 97, 52–63. [Google Scholar] [CrossRef]
  19. Zhuang, L.; Kim, K.Y.; Jung, S.G.; Diaz, M.; Min, K.-B.; Zang, A.; Stephansson, O.; Zimmermann, G.; Yoon, J.-S.; Hofmann, H. Cyclic hydraulic fracturing of pocheon granite cores and its impact on breakdown pressure, acoustic emission amplitudes and injectivity. Int. J. Rock Mech. Min. Sci. 2019, 122, 104065. [Google Scholar] [CrossRef]
  20. Diaz, M.B.; Kim, K.Y.; Jung, S.G. Effect of frequency during cyclic hydraulic fracturing and the process of fracture development in laboratory experiments. Int. J. Rock Mech. Min. Sci. 2020, 134, 104474. [Google Scholar] [CrossRef]
  21. Jia, Y.; Lu, Z.; Xiong, Q.; Hampton, J.C.; Zhang, Y.; He, P. Laboratory characterization of cyclic hydraulic fracturing for deep shale application in Southwest China. Int. J. Rock Mech. Min. Sci. 2021, 148, 104945. [Google Scholar] [CrossRef]
  22. Patel, S.M.; Sondergeld, C.H.; Rai, C.S. Laboratory studies of hydraulic fracturing by cyclic injection. Int. J. Rock Mech. Min. Sci. 2017, 95, 8–15. [Google Scholar] [CrossRef]
  23. Zhuang, L.; Jung, S.G.; Diaz, M.; Kim, K.Y.; Hofmann, H.; Min, K.-B.; Zang, A.; Stephansson, O.; Zimmermann, G.; Yoon, J.-S. Laboratory True Triaxial Hydraulic Fracturing of Granite under Six Fluid Injection Schemes and Grain-Scale Fracture Observations. Rock Mech. Rock Eng. 2020, 53, 4329–4344. [Google Scholar] [CrossRef]
  24. Scholz, C.H. The frequency-magnitude relation of microfracturing in rock and its relation to earthquakes. Bull. Seismol. Soc. Am. 1968, 58, 399–415. [Google Scholar] [CrossRef]
  25. Madariaga, R. High-frequency radiation from crack (stress drop) models of earthquake faulting. Geophys. J. Int. 1977, 51, 625–651. [Google Scholar] [CrossRef] [Green Version]
  26. Jiang, Z.; Li, Q.; Hu, Q.; Liang, Y.; Xu, Y.; Liu, L.; Wu, X.; Li, X.; Wang, X.; Hu, L.; et al. Acoustic emission characteristics in hydraulic fracturing of stratified rocks: A laboratory study. Powder Technol. 2020, 371, 267–276. [Google Scholar] [CrossRef]
Figure 1. The main mineral composition of tight sandstone.
Processes 11 00875 g001
Figure 2. Basic size parameters of tight sandstone specimens.
Processes 11 00875 g002
Figure 3. XTR01-01 micro-computer-controlled electro-hydraulic servo rock triaxial tester.
Processes 11 00875 g003
Figure 4. Diagram of acoustic emission probe arrangement.
Processes 11 00875 g004
Figure 5. Schematic diagram of pump pressure curve: (a) conventional hydraulic fracturing, (b) cyclic hydraulic fracturing.
Processes 11 00875 g005
Figure 6. The relationship between pump pressure, AE amplitude, and injection time of sample S4.
Processes 11 00875 g006
Figure 7. The relationship between pump pressure, AE amplitude, and injection time of samples: (a) S5, (b) S6, (c) S7-1.
Processes 11 00875 g007
Figure 8. The relationship between high-pressure duration and the cycles required for breakdown.
Processes 11 00875 g008
Figure 9. The relationship between radial strain and injection time of samples.
Processes 11 00875 g009
Figure 10. The relationship between pump pressure, AE amplitude, and injection time of samples: (a) S7-1, (b) S10, (c) S13, (d) S14-1.
Processes 11 00875 g010
Figure 11. The relationship between the upper limit of cyclic pump pressure and the cycles required for breakdown.
Processes 11 00875 g011
Figure 12. Hydraulic fracture morphology of sample S4: (a) Post-fractured view, (b) scanning reconstruction view.
Processes 11 00875 g012
Figure 13. Post-fractured view and scanning reconstruction of hydraulic fracture morphology of cyclic hydraulic fracturing samples: (a) S5, (b) S6, (c) S7-1, (d) S10, (e) S13-1, (f) S14-1.
Processes 11 00875 g013aProcesses 11 00875 g013bProcesses 11 00875 g013c
Figure 14. The relationship between the AE cumulative counts and injection time of the samples.
Processes 11 00875 g014aProcesses 11 00875 g014b
Figure 15. The relationship between the AE peak frequency and injection time of the samples.
Processes 11 00875 g015aProcesses 11 00875 g015b
Table 1. Basic physical and mechanical parameters of sandstone specimen.
Bedding Angle (°)Longitudinal Wave Velocity
(m·s−1)
Uniaxial Compressive Strength (MPa)Elastic Modulus (GPa)Poisson’s RatioUniaxial Tensile Strength (MPa)Fracture Toughness
(MPa·m1/2)
0202445.559.660.291.700.14
90231453.088.050.242.410.11
Table 2. Summary of experimental parameters and results.
Injection
Modes
Test
Number
Axial Stress (MPa)Confining Pressure (MPa)Fracturing Fluid Viscosity
(mPa·s)
Upper Limit of Pump PressureHigh-Pressure Duration TimeLow-Pressure Duration TimeBreakdown Pressure (MPa)Breakdown ObservedEquivalent Cycles
Conventional
hydraulic
fracturing
S156.55040///99.13/
S356.55040///97.16/
S456.55040///110.01/
Cyclic
hydraulic
fracturing
S556.5504090%Pb15 s5s92.0332
S656.5504090%Pb10 s10s92.0325
S7-156.5504090%Pb5 s15s92.037
S1056.5504080%Pb5 s15s81.8435
S13-156.5504070%Pb5 s15s71.6137
S14-156.5504060%Pb5 s15s/×60
Table 3. Percentage of peak frequency of the samples.
Test NumberLow FrequencyMedium FrequencyHigh Frequency
S411.9%88.1%0
S519.2%80.4%0.4%
S614.3%85.1%0.1%
S7-119.4%80.3%0.3%
S1038.6%59.7%1.7%
S13-116.7%82.6%0.7%
S14-11.2%98.8%0
Disclaimer/Publisher’s Note: The statements, opinions and data contained in all publications are solely those of the individual author(s) and contributor(s) and not of MDPI and/or the editor(s). MDPI and/or the editor(s) disclaim responsibility for any injury to people or property resulting from any ideas, methods, instructions or products referred to in the content.

