Article

Study on the Hydraulic Fracturing of the Inter-Salt Shale Oil Reservoir with Multi-Interfaces

1
State Key Laboratory of Geomechanics and Geotechnical Engineering, Institute of Rock and Soil Mechanics, Chinese Academy of Sciences, Wuhan 430071, China
2
School of Civil and Environmental Engineering, University of New South Wales, Sydney, NSW 2052, Australia
3
China Gezhouba Group Three Gorges Construction Engineering Co., Ltd., Yichang 443000, China
*
Author to whom correspondence should be addressed.
Processes 2023, 11(1), 280; https://doi.org/10.3390/pr11010280
Submission received: 20 December 2022 / Revised: 11 January 2023 / Accepted: 12 January 2023 / Published: 15 January 2023
(This article belongs to the Special Issue Advances in Numerical Modeling for Deep Water Geo-Environment)

Abstract

:
Hydraulic fracture morphology and propagation mode are difficult to predict in layers of the various lithological strata, which seriously affects exploitation efficiency. This paper studies the fundamental mechanical and microscopic properties of the two main interfaces in inter-salt shale reservoirs. On this basis, cement-salt combination samples with composite interfaces are prepared, and hydraulic fracturing tests are carried out under different fluid velocities, viscosity, and stress conditions. The result shows that the shale bedding and salt-shale interface are the main geological interfaces of the inter-salt shale reservoir. The former is filled with salt, and the average tensile strength is 0.42 MPa, c = 1.473 MPa, and φ = 19.00°. The latter is well cemented, and the interface strength is greater than that of shale bedding, with c = 2.373MPa and φ = 26.15°. There are three basic fracture modes for the samples with compound interfaces. Low-viscosity fracturing fluid and high-viscosity fracturing fluid tend to open the internal bedding interface and produce a single longitudinal crack, respectively, so properly selecting the viscosity and displacement is necessary. Excessive geostress differences will aggravate the strain incompatibility of the interface between different rock properties, which makes the interfaces open easily. The pump pressure curves’ morphological characters are different with different failure modes.

1. Introduction

With the continuous advancement of oil and gas exploration in deep-ground engineering, the focus gradually changes from conventional reservoirs to unconventional ones, from formations with a single lithology to ones with multiple lithologies, and from simple layered formations to complex ones. In recent years, more than 60% of the unconventional oil and gas in the newly found reservoirs in China are in multi-lithologic layered formations [1,2,3]. At present, an engineering method to improve the efficiency of layered reservoirs with multiple lithologies is hydraulic fracturing with horizontal well drilling [4,5,6,7,8]. However, due to the influence of the differences in lithology and the interfaces, the hydraulic fracture behavior and mechanism are quite complex. In particular, it is difficult to formulate a reasonable fracturing design [2,9]. Consider the inter-salt shale reservoir in the Jianghan Basin in China, which is characterized by multiple salt-shale interlayers. Consequently, the crack propagation behavior in inter-salt shale reservoirs tends to be contrary to predictions. It is particularly important to understand the mechanical properties of deep rock, soil, and crack propagation [10,11,12].
Literature studies carried out a lot of research to explore the initiation mode and propagation morphology of hydraulic fractures in multi-lithologic reservoirs. Advani et al. [13] investigated the fracture propagation in the composite layered rock by the finite element method and demonstrated the effects of friction across interfaces with the help of an elastic contact algorithm. Maji and Wang [14] studied the quasi-brittle behavior of the interface between concrete and rocks from the perspective of nonlinear fracture mechanics models. The fundamental aspects of interfacial fracture mechanics were discussed based on the laser speckle interferometry method and the scanning electron microscope. Li et al. [15] devised specimens consisting of two materials to focus on whether an initial crack in a weak medium would propagate into a hard medium under compression and shearing. The experiments indicated that compression loading causes penetration under some conditions. With the help of mixed mode fracture theory, the conditions under which a crack in a weak medium can pass through the interface and penetrate the hard medium have been built. Shen et al. [16] changed thickness values for the weak interfacial layer in 3-point bending experiments and built a simplified 3D finite element model to study the impact of a bi-material interface on crack propagation from the aspects of the strength, stiffness, and permeability of the interface layer. Wang [17] et al. adopted the digital speckle measurement technology in a three-point bending experiment to observe the strain field change in the crack development process through the interface. Combined with numerical calculation, they concluded that when a crack propagates across the interface, the crack breaks through the interface, kinks at the interface, or extends along the interface. Rho et al. [18] studied the effects of rock layering and interfaces on fracture height growth by numerical simulations of hydraulic fracture (HF) propagation through layered rocks. They concluded that when the contrast in properties between adjacent rock layers is large and abrupt, interfaces between layers tend to be low in tensile strength, low in friction coefficient, and high in hydraulic conductivity. Tan et al. [19] used discrete element software PFC 2D to establish a particle flow model of sandstone-mudstone interbedded reservoirs, considering the influences of several factors on the initiation and propagation of hydraulic fractures. Their result demonstrated that in-situ stress and the strength of interfaces are the essential factors that control the path of fracture propagation. Shear sliding occurs along the interfaces penetrated by hydraulic fractures. Zhao et al. [20] built a 3D hydraulic fracture model with multilayer commingled fracturing. They concluded that the high elastic modulus of neighbouring reservoirs promotes the longitudinal penetration of fractures in the multilayers. Zhu et al. [21] established a fluid flow model coupled with wellbore perforation fractures (WPF) based on Kirchhoff’s law to describe the flow distribution in different perforation clusters. The treatment parameters and the mudstone thickness are optimized. Qiu et al. [22] performed split Hopkinson pressure bar experiments for considering the interfacial roughness and the loading rate effect with bimaterial single cleavage triangle (BSCT) specimens to investigate the dynamic fracture of a rock-mortar interface under impact loading. Their results show that interfacial roughness and loading rate are closely related to interfacial fracture behavior. Liu et al. [23,24] studied the anisotropic mechanical behavior of fractured coal and clarified the influence of bedding on energy exploration. Tan et al. [19] carried out true triaxial hydraulic fracturing experiments on layered specimens made of different types of natural sandstone and coal to explore the propagation behavior of hydraulic fractures. Their result showed that, compared with operational parameters, the natural bedding in coals was the vital factor affecting the fracture propagation path. Tao et al. [25] created a mathematical model to predict the overall wellhead output in multi-layer tight gas reservoirs with composite lithology. Their results showed that the interlayer influence in multilayer commingled production systems can be negligible with the increment of layers.
Literature studies have focused little on the reservoirs with large lithological differences and multiple interface types. In this paper, the mechanical and microscopic properties of the two main interfaces in inter-salt shale reservoirs are studied. On this basis, cement-salt combination samples with composite interfaces are prepared, and hydraulic fracturing tests are carried out under different fluid velocities, viscosity, and stress conditions. At length, the interface properties and experiment results can provide an essential reference for engineers in fracturing design.

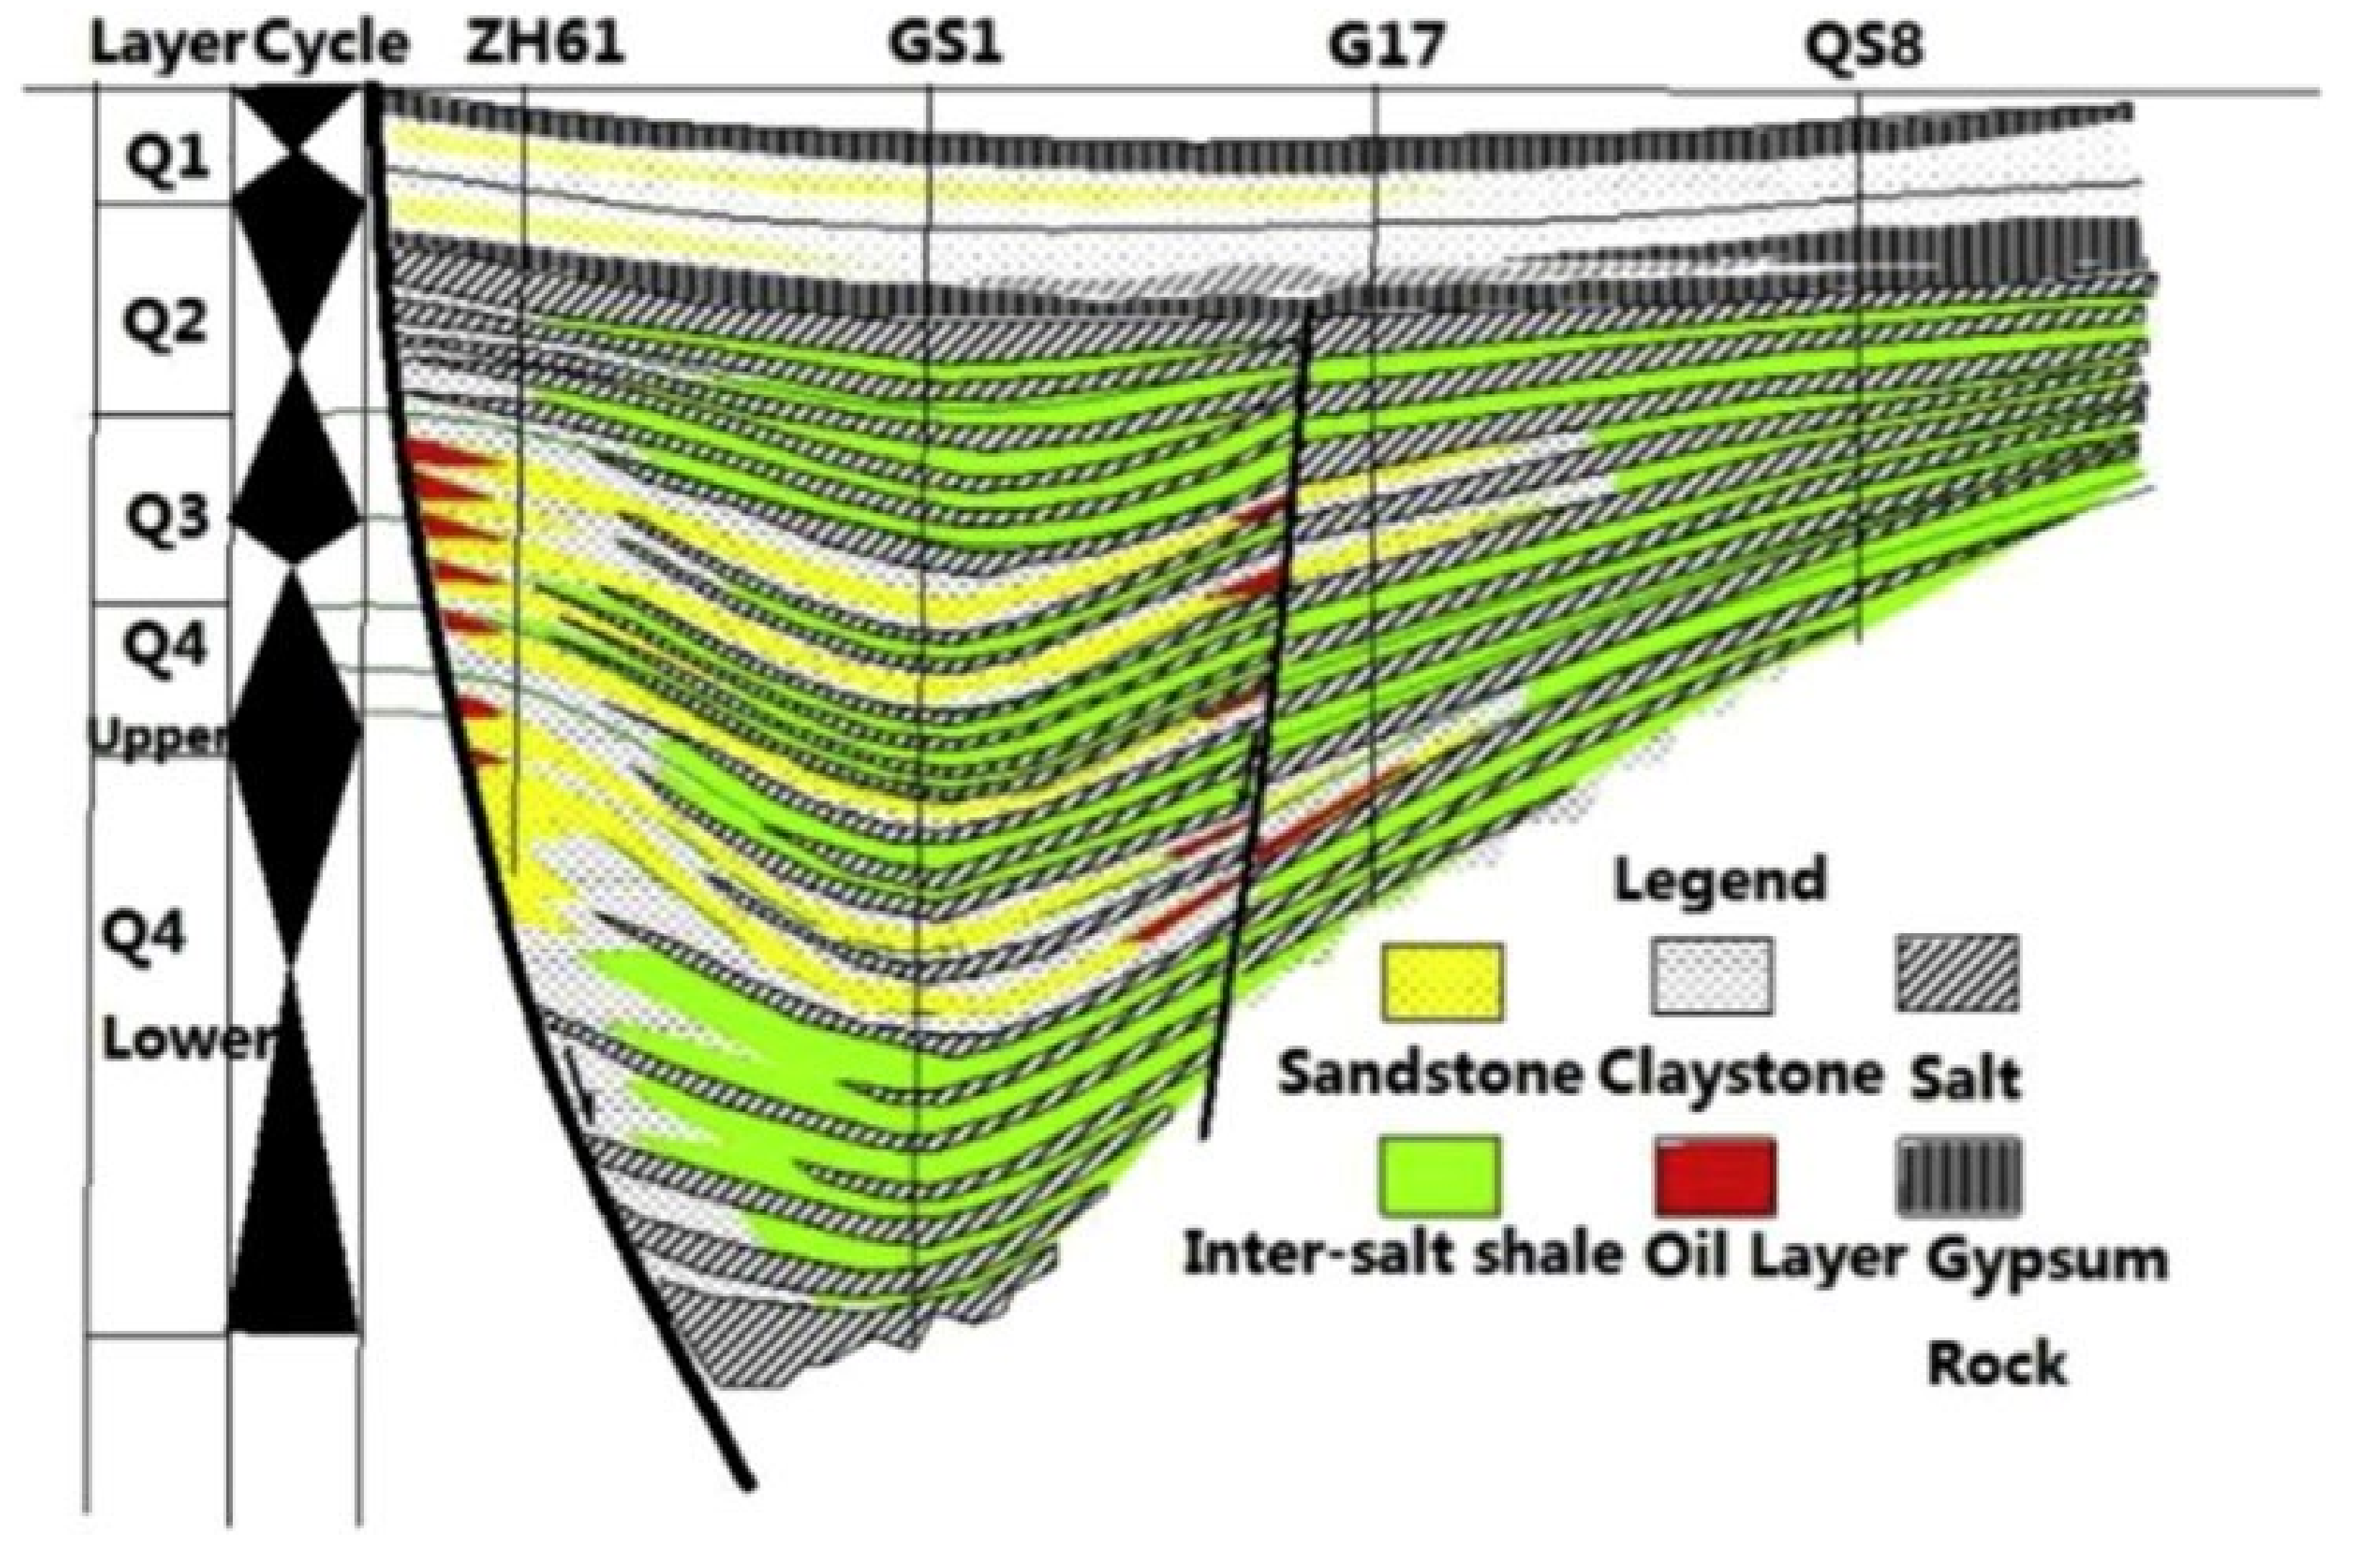
2. Geological Situation

Jianghan Basin, located in Hubei Province, China, is the Paleogene continental oil-bearing salt lake basin. It is subjected to the Cretaceous-Paleogene fault basin that formed during the Yanshan movement. Jianghan Basin contains seven sub depressions: Jiangling, Zhijiang, Qianjiang, Chentuokou, Xiaoban, Yunmeng, and Mianyang, which are made up of two reservoirs sets (Figure 1), the Xingouzui Formation and the Qianjiang Formation. The Qianjiang Depression is the sedimentation center of the Jianghan Basin, with an area of 2530 km2.
Qianjiang Depression is located in the middle of Jianghan Basin, which is on the Mesozoic and Paleozoic basement as a whole. The northern boundary is the Qianbei fault zone. From west to east, it is connected with Jingmen Depression, Lexianguan Horst, Hanshui Depression, and Yonglonghe Rise. In the northeast of the depression, it is Yuekou low uplift, and in the southwest, it is Yajiaoxingou low uplift. Both of these two uplifts are transitional to the Qianjiang depression in the form of the slope; the Tonghaikou fault and Tonghaikou uplift are the southeast boundaries of the Qianjiang depression. The Qianjiang Depression is the sag with the fastest subsidence speed and deepest basement burial depth in the whole Jianghan Basin. It is also the subsidence center, convergence center, and concentration center of the whole Jianghan Basin during the deposition of the Qianjiang Formation. The material source of the salt formation in the Qianjiang Formation is in the north, and it is a one-way supply. The high salinity and strong evaporation-sealing environment are the main sedimentary environments of the Qianjiang Formation, and the intermittently humid environment is also present during the deposition process.
In this sedimentary environment, the Qianjiang Formation is formed by the frequent interaction of shale and salt rhythm layers. The salt rhythm layer consists of salt and inter-salt shale layers, with 193 salt rhythm layers in total. Vertically, the Qianjiang Formation can be divided into four sections from bottom to top according to the stratigraphic sequence [27], namely, the fourth and third members of the Qianjiang Formation (Eq4 and Eq3), which are efficient and high-quality reservoirs. Due to the separation of the upper and lower salt layers and low permeability, a closed inter-salt shale oil system was formed. In the whole sedimentary process of the Qianjiang Formation strata, the three maximum lake flooding periods are the main development periods of organically rich shale. Among them, the organic matter maturity of Qianjiang Formation II is relatively low, which is not the key research region at present. The lower Qianjiang Formation III and IV with high maturity are the key strata for shale oil exploration. The samples selected this time are mainly from the lower Qianjiang Formation IV [26]. According to the sorting and classification of the samples taken underground, it is concluded that there are mainly two kinds of geological interfaces in the inter-salt shale oil reservoir, namely, the shale bedding and the salt-shale interface. Understanding fully the mechanical characteristics and action of hydraulic fracture has an important impact on fracturing efficiency and engineering parameter optimization.

3. Fundamental Behaviors of Materials

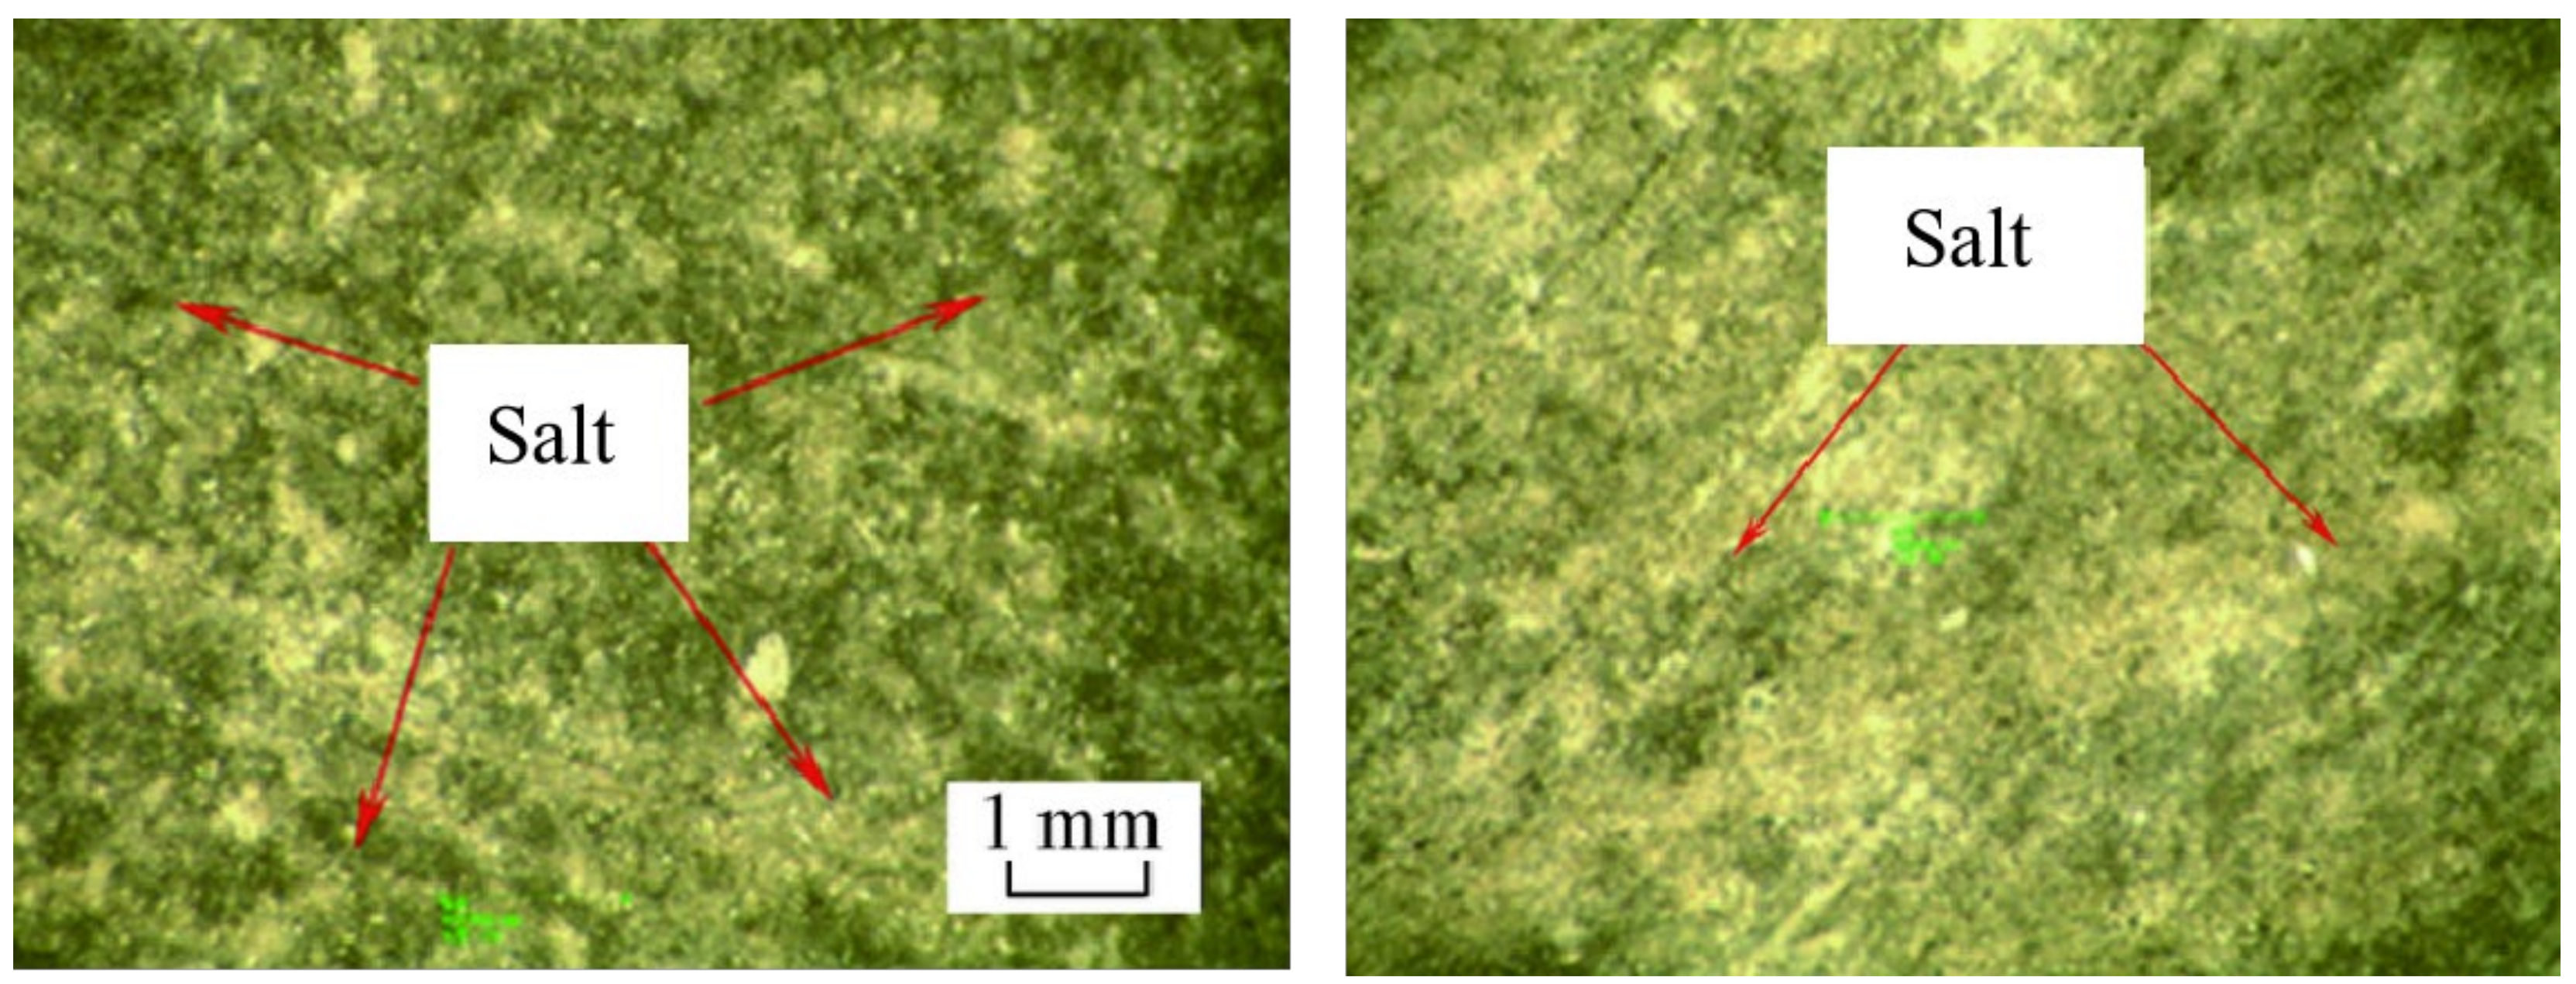
3.1. Micro Behaviors of the Shale Bedding

In general, after samples are processed as required, to prevent cracking, wrap them tightly with plastic wrap and store them in a sealed bag. After unpacking the sample and placing it in the room for 3 h, as shown in Figure 2, several huge cracks running through the sample are distributed on the surface, and some small rock slices at the corners fall off along the foliation surface. Careful observation shows that there are uneven multilayer structures on the section of the flakes, and white crystals are distributed on it. Through mineral component analysis, the white crystal is the salt rock.
The surface of falling rock slices was observed through a microscope. As shown in Figure 3, the salt on the foliation covers the entire bedding surface, and there is almost no blank area. The salt particles are fine and are not forming the large mineral vein. The overall distribution thickness was thin and uniform, with a little occasional local concentration.
Therefore, the shale bedding can actually be seen as a small salt-bearing interlayer. Considering the high permeability of the sample (0.1–0.25 MD) [28], the shale foliation filled with salt particles is partially opened. When the sample is in a humid environment, the salt crystals absorb water, causing the bedding to open further and the sample volume to gradually expand until the sample partially disintegrates.

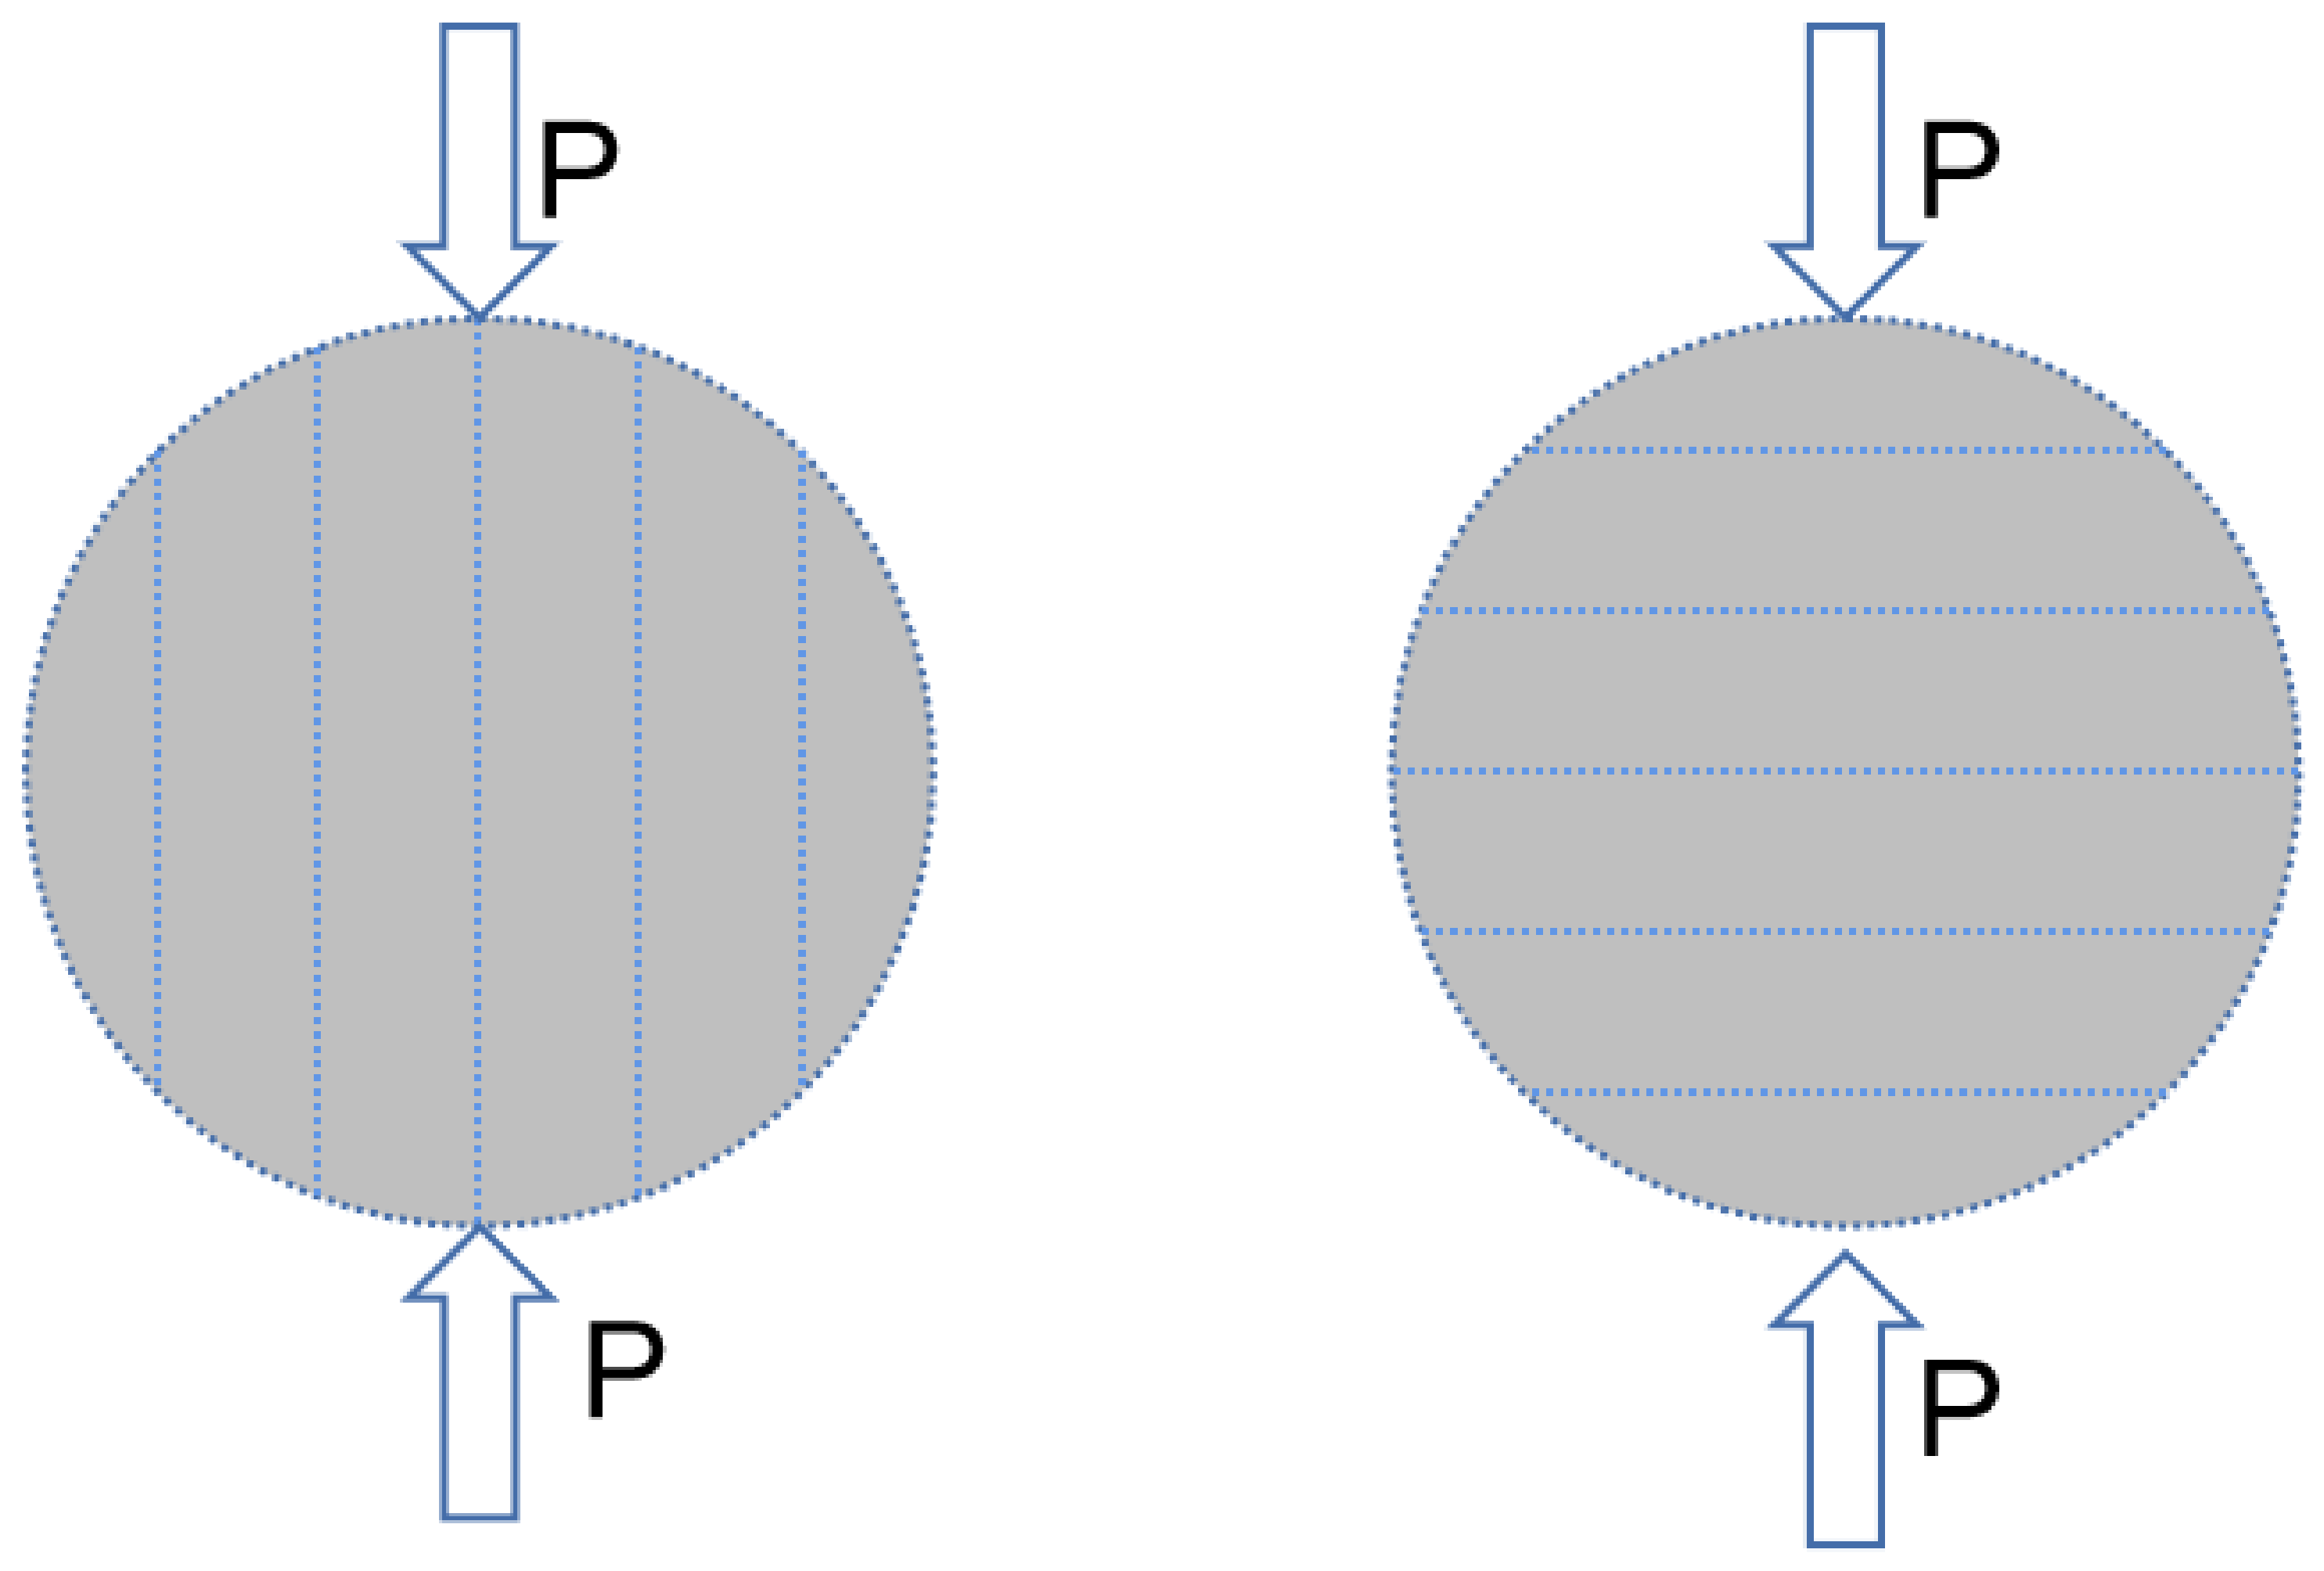
3.2. Tensile Strength of the Shale Bedding

The tensile strength of rock refers to the maximum stress that the rock can bear under tensile conditions. The Brazil splitting experiment and the splitting method [29] are used herein to test the tensile strength of samples. The testing equipment is the RMT-150C multifold machine system developed by the Wuhan Institute of Geotechnical Engineering, Chinese Academy of Sciences. The maximum output load of the test system is 1000 kN, the pressure accuracy is 0.01 MPa, and the maximum stroke is 50 mm. During the loading process, the load velocity can be controlled continuously.
The rock mass of the inter-salt shale reservoir is affected by foliation in many ways [30,31]. In order to study the influence of foliation on the opening capacity of reservoir fractures, Brazilian splitting experiments with two loading modes (Figure 4) were carried out, that is, the loading direction was either parallel to or perpendicular to the bedding. It means that bedding and rock matrix are subject to tensile stress, respectively.
Before the experiment, the cushion strip must be selected according to the hardness of the rock. The hardness of the cushion strip shall match that of the test piece. If the hardness of the cushion strip is too high, it is easy to cause penetration. The hardness of the cushion strip is too low, and it is easy to deform, both of which affect the accuracy of the results. Generally, for relatively hard rocks, steel wire with a diameter of 1 mm is often used as the cushion strip. For soft rocks, the cushion strip is generally made of cardboard or bakelite, and the ratio of its width to the diameter of the test piece is 0.08~0.1.
During the experiment, load at the rate of 0.1~0.3 MPa/s should be added until the specimen is damaged. If the rock is soft, the loading rate shall be reduced appropriately. Finally, the maximum failure loads of samples shall be recorded.
Table 1 shows the tensile test results of inter-salt shale samples. ∥ and ⊥ mean the bedding planes in the loading direction are parallel and vertical respectively. The average tensile strength of the sample matrix is 1.62 MPa, and the shale bedding is 0.42 MPa. The tensile strength of the matrix is about four times that of the bedding surface. It can be seen from Figure 5 of the cracked specimen that when the loading direction is parallel to the foliation, the foliation plane is subject to tensile stress, the specimen is damaged along it, and the foliation is pulled apart. When the matrix is stretched, the cracks germinate in the center and extend through the sample, but some cracks at the boundary will deflect slightly in the vertical direction (the yellow circle part in Figure 5), which is due to the guidance of the foliation at the boundary, which indicates that when the hydraulic fractures expand in the reservoir, their direction tends to deflect due to the disturbance of weak bedding.

3.3. Direct Shear Test Behaviors of the Shale Bedding

The direct shear test was also conducted on an RMT-150C rock testing machine. During the test, the system can automatically record the tangential force, normal force, and velocity data throughout the whole process. For the direct shear test, it is required to exert different normal loads on a group of samples (at least three samples), load the corresponding shear force with the horizontal pushing method until the sample is damaged, calculate the shear strength, draw the fitting curve of the relationship between normal stress and shear strength according to the Mohr theory [9,29,32], and get the cohesion and internal friction angle (Figure 6).
The samples taken from more than 3000 m underground can only be processed into a cube programmed to be 50 mm at most, and the specially made stainless steel shear box is matched with them. During the test, after the normal force is loaded to the predetermined value at the rate of 0.5 kN/s, keep it constant, exert the shear load in the horizontal displacement control mode at the loading rate of 0.002 mm/s, and finally terminate the test until the shear stress reaches the residual strength.
It can be seen that the shear strength of the sample increases with the increase in normal stress. When σn increases from 4 MPa to 12 MPa, the shear strength increases by 56.14% and 16%, respectively. Linear fitting of σn and corresponding τ demonstrates that the cohesion c = 1.47 MPa and the internal friction angle is 19°, which is lower than that of conventional rock materials [33].

3.4. Salt-Shale Interface Behaviors

Based on the direct shear test method mentioned above, the shear parameter of the salt-shale samples is shown in Figure 7 to analyze the shear interface behaviors of the salt-shale mixture.
Figure 7 shows that the shear strength increases with the σn, when the σn increases from 4 MPa to 8 MPa and finally to 12 MPa, the shear strength increases by 33.48% and 40.70%, respectively. After the linear fitting, it is calculated that the cohesion of the salt-shale interface is 2.237 MPa, 1.52 times that of shale foliation, and the internal friction angle is 26.34°. Compared with shale bedding, the strength of salt-shale interface is greater, and the shear section is rougher after destruction. The mineral particles and surface undulation are significantly enhanced, but the integrity is good. There is no sheared mineral debris on the surface. Therefore, when hydraulic fracturing is required, the bedding in the reservoir is easier to open, which is conducive to improving the fracturing efficiency of a single rhythm.

4. Tests Procedures

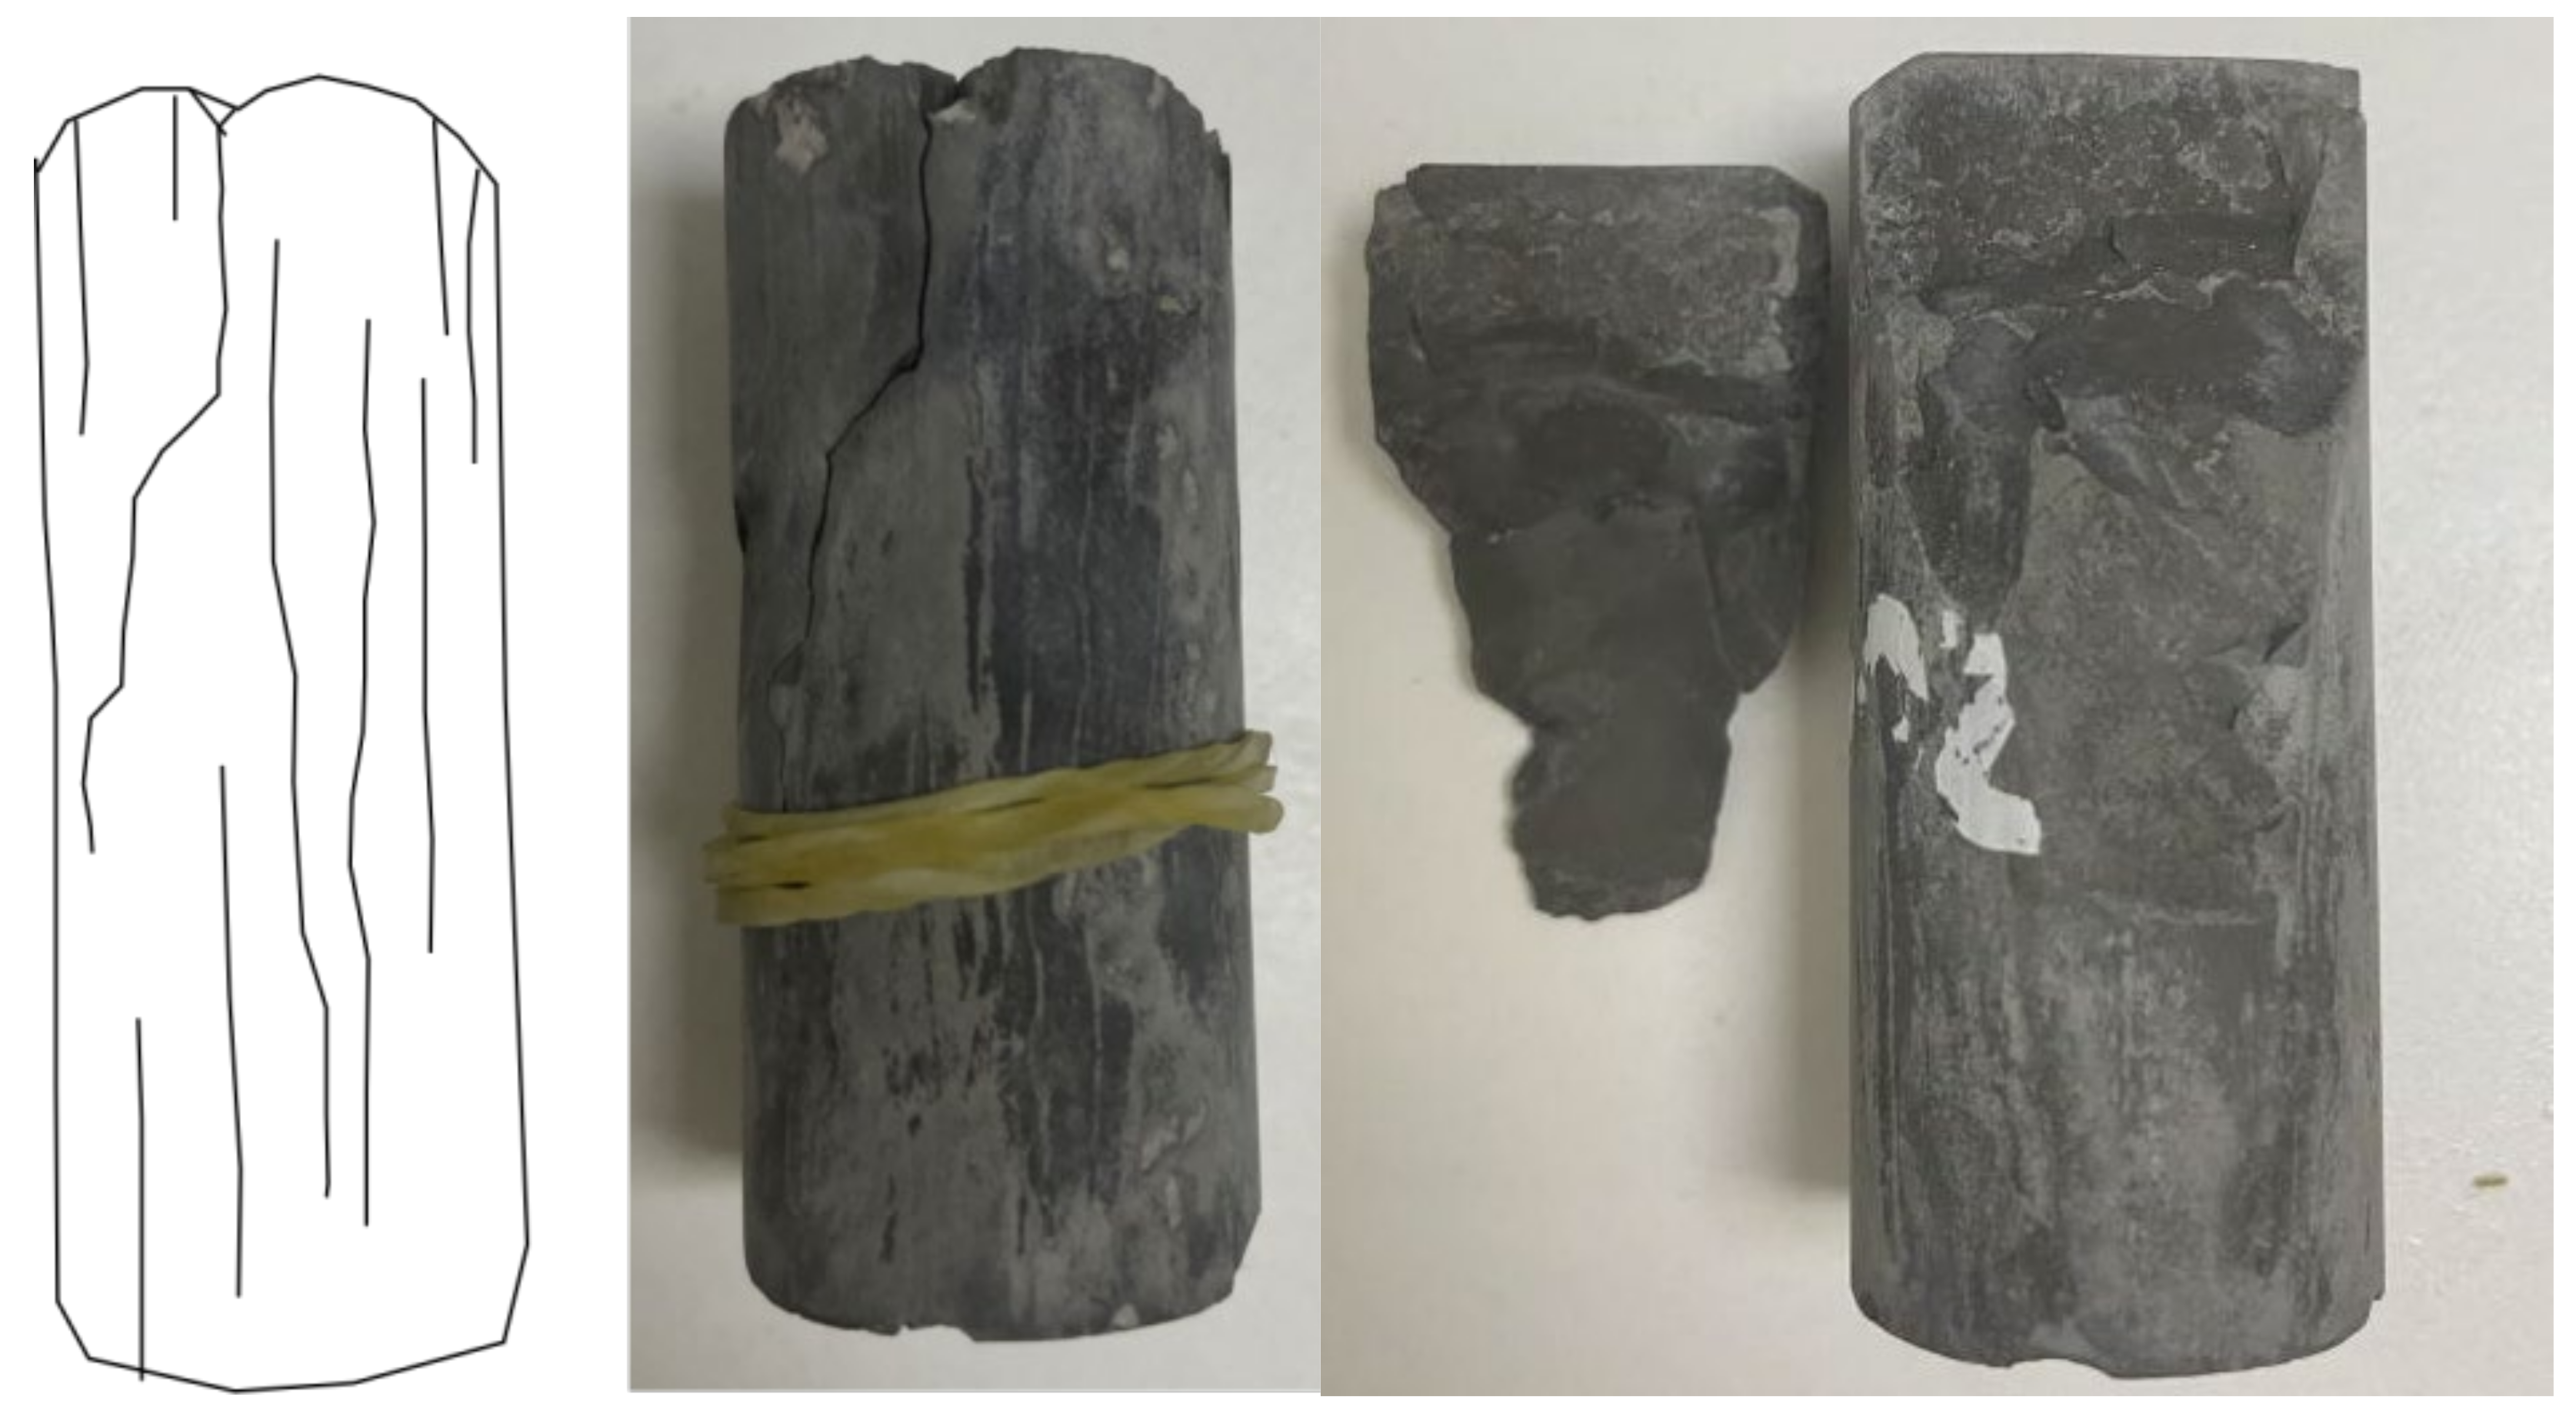
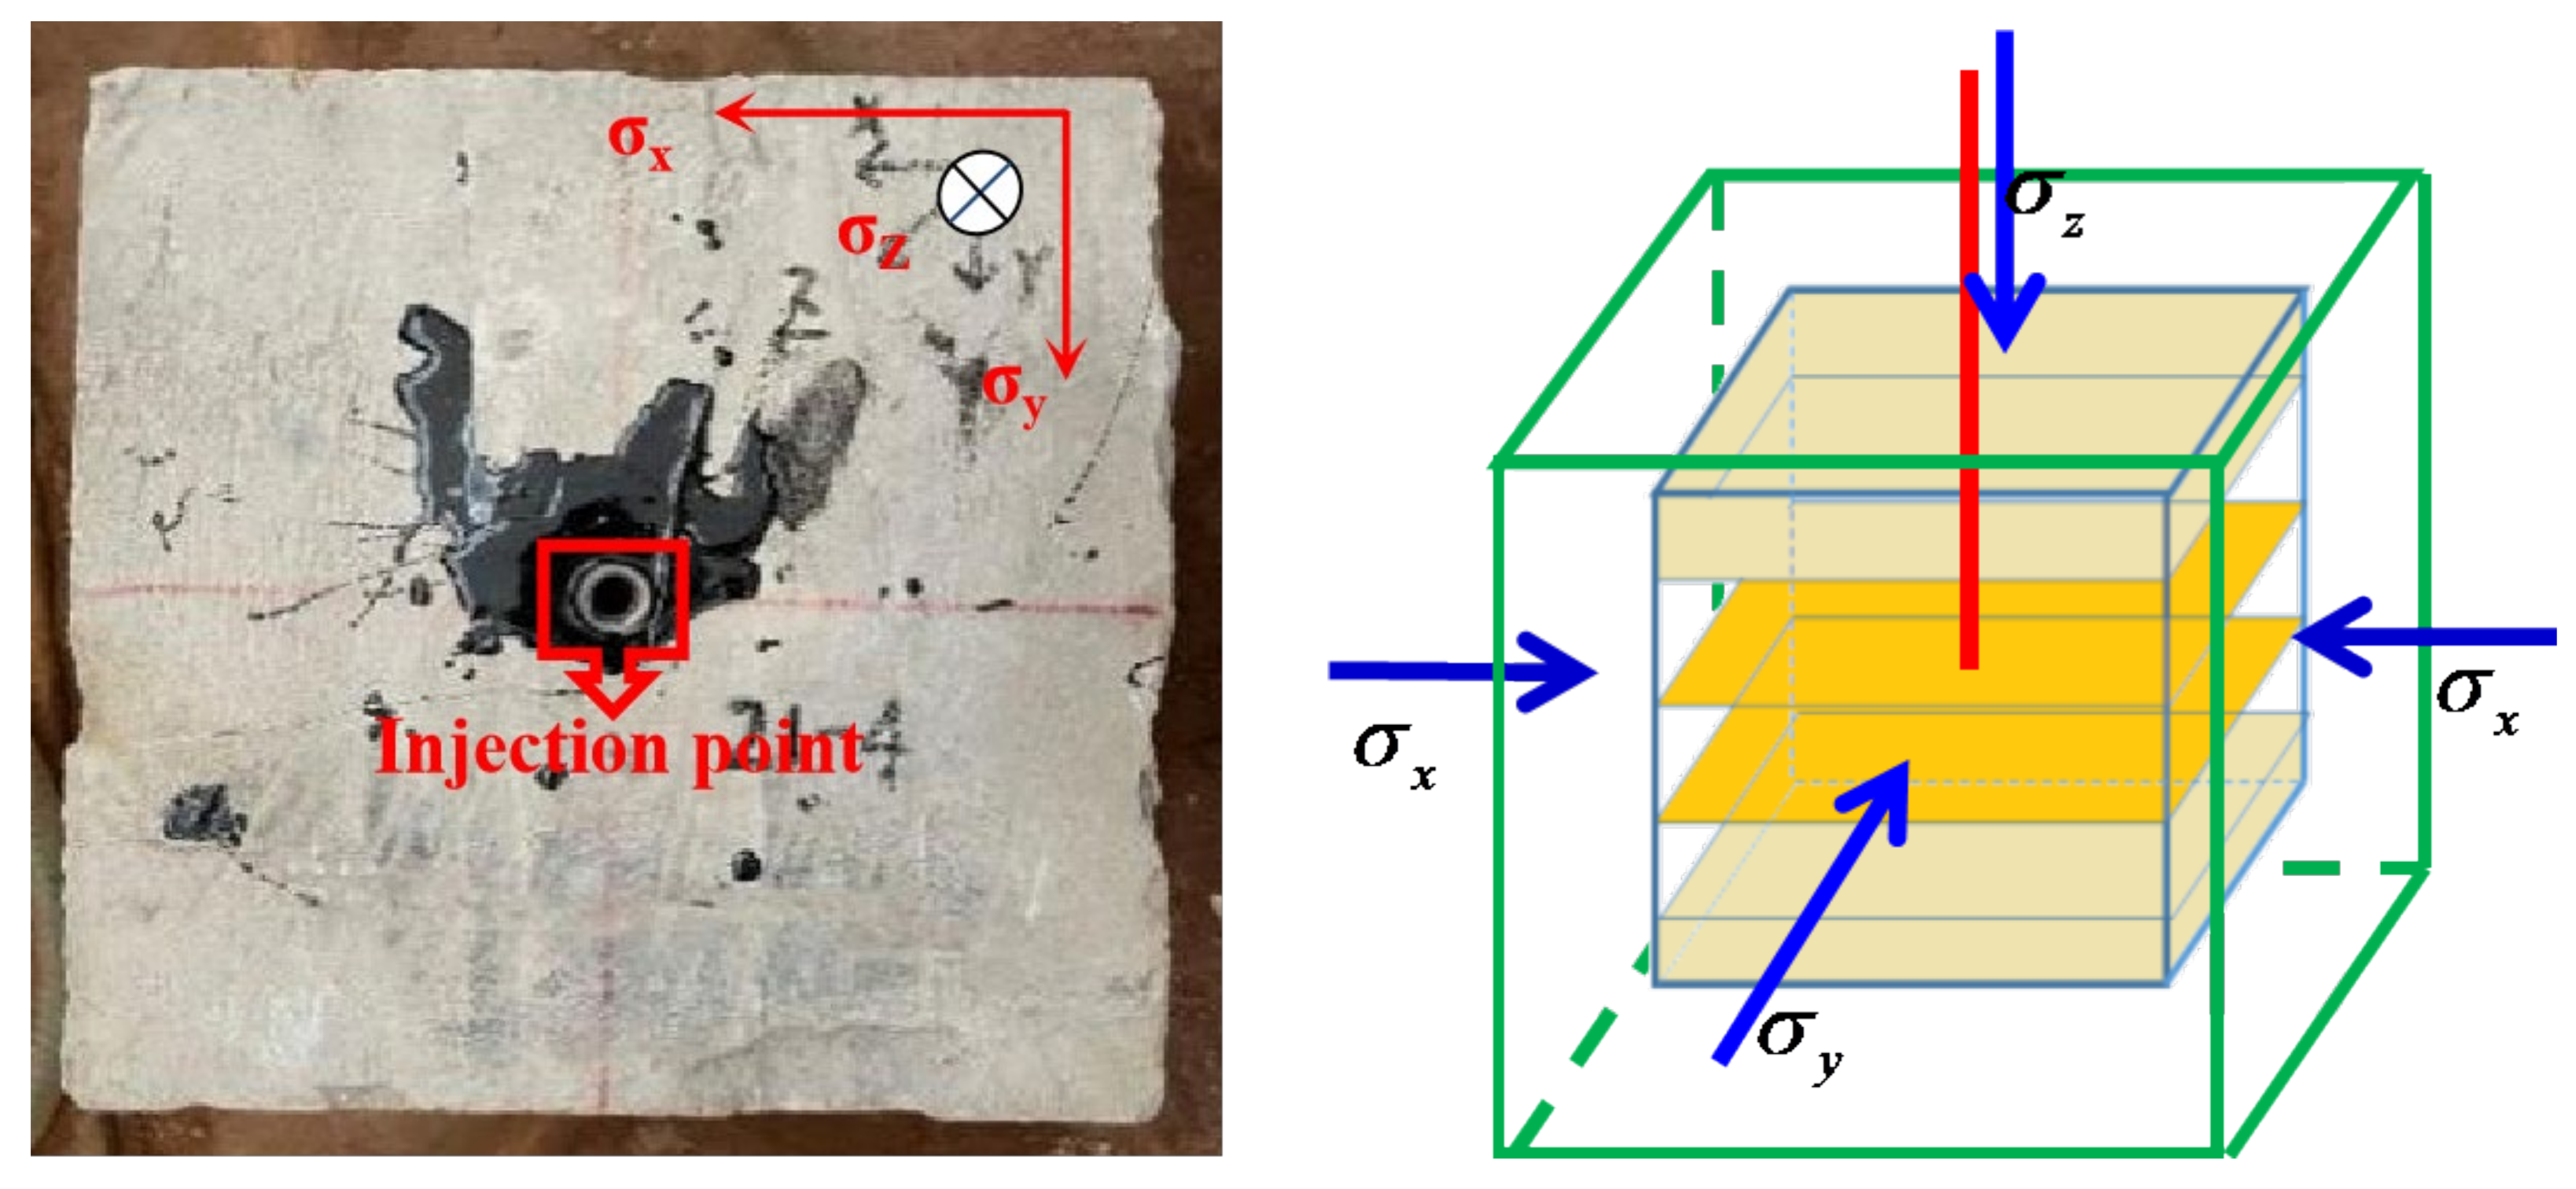
4.1. Sample Preparation for the Hydraulic Fracturing Test

In order to optimize the engineering parameters and improve the hydraulic fracturing effect of the inter-salt shale reservoir, according to the interface characteristics, the salt-cement composite samples were prepared to carry out hydraulic fracturing under multi-factor conditions to simulate on-site exploitation, thus providing a basis for fracturing design.
Figure 8 is the structural diagram of the fractured sample; the whole sample contains the fracturing core and cement crust, in which the fracturing core reflects the structural characteristics of the overlap of the salt and shale layers in the inter-salt shale reservoir. The upper and salt layers have a thickness of 25 mm and a side length of 200 mm, with cement in the middle to simulate the reservoir. Built-in concrete bedding and a salt-concrete interface are used to simulate the shale lamination and salt-shale interface, respectively. In addition, the strength of the paper-based interface (0.98 MPa, an internal friction angle of 17.97°) is roughly equivalent to the shale foliation surface. The cohesion of the salt-cement interface bonded by epoxy resin is 2.52 MPa, and the internal friction angle is 23.65° [34]. Therefore, the strength relationship of the sample interface is similar to that of the actual reservoir. In order to avoid failure of the test due to stress caused by uneven deformation of the sample, a stainless steel mold with large rigidity was used for pouring.

4.2. Test Process

The large true triaxial physical model testing machine is designed by the Wuhan Institute of Geotechnical Mechanics, Chinese Academy of Sciences. The machine can be loaded independently in the X, Y, and Z directions with a maximum load of 8000 kN and can realize the cubic hydraulic fracturing experiment with a maximum side length of 500 mm. This testing machine can ensure the uniform transmission of stress and achieve the same position of the specimen when loading with single or double forces, so as to avoid eccentric loading.
The loading mode of the sample is shown in Figure 9. The fracturing medium with a red indicator is injected from the wellhole at a certain rate until the huge fractures occur and the pump pressure drops. After the fracturing, peel off the concrete crust of the sample, take out the core inside, split the sample along the trace of the red indicator, and observe the crack morphology and crack propagation mode.

5. Results

Table 2 indicates the fracturing test parameters and results. Because of the creep property of salt [26,30], the horizontal geostress is close to each other, and the stress settings in X and Y directions are set to the same. At the same time, the three-way loading stress is generally small. This is because the internal deformation of the sample may not be coordinated during the solidification process, which causes the specimen to be fragile. After several attempts, the stress is set at about 5 MPa, and the sample integrity and experimental effect are the best. Slickwater and guar gum are used to carry out the fracturing experiments, and their viscosities are 3 and 95 mPa·s, respectively.
As shown in Figure 10, the crack initiation and propagation modes can be divided into the following three basic types according to the fracture morphology.
Mode I is shown in Figure 10a. The fracture starts from the bottom of the well and directly passes through the bedding planes and cement-salt interface. Finally, the macro longitudinal fracture directly penetrates the whole sample. The bedding plane and lithologic interface remain closed. Taking the shape of sample 21-9 (Figure 11a) as an example, the fracturing core was cut along A-B, and only the red trace (Figure 11a-2) was seen on the lower half of the crack surface (Figure 11a-2). The red curve on the salt plate (Figure 11a-3) was evidence of salt penetration, and no bedding surface was opened on the entire longitudinal fracture surface.
Mode II is as shown in Figure 10b. The crack, starting from the same position, continues to extend directly through the bedding plane to the cement-salt interface. Then the crack deflects and continues to expand in the interface, eventually forming an “I” shaped fracture. Taking sample 21-7 as an example (Figure 11d), the red line can be seen locally on the surface of the fracturing core (Figure 11d-1). When the the core is split along the longitudinal crack (A-B) to obtain the longitudinal crack surface (Figure 11d-2), it indicates that the internal bedding is still well cemented. The red indicator is mainly concentrated at the lower part of the crack surface, and the bottom has been completely dyed red. Open the cement-salt interface below (Figure 11d-3), and a red indicator can be observed, showing that the crack once expanded into the interface.
Mode III is shown in Figure 10c. The crack extends to the internal bedding surfaces on both sides and opens them. Taking sample 21-1 (Figure 11e-1) as an example, the bedding surface is opened and dyed red, so the crack expands along it.
According to the failure modes of the sample under different conditions, the fracturing fluid velocity, viscosity, stress, and pump pressure curves’ responses are analyzed.

5.1. Effect of Fracturing Fluid Viscosity and Velocity

The viscosity and velocity of the fracturing fluid are two important controllable parameters in hydraulic fracturing tests, which play an important role in the crack propagation and morphology of fractures. In this experiment, two kinds of viscosity and three kinds of velocity are mainly set. It can be seen from Table 2 that low-viscosity samples (samples 21-1 and 21-11) cause the opening of interface bedding, while high-viscosity fracturing fluids (samples 21-10 and 21-9) lead to a single longitudinal fracture (Mode I). This indicates that high-viscosity is not conducive to the opening of the interface, which may be due to the fact that low-viscosity percolates at the interface and shear slip occurs, which increases the complexity of hydraulic fractures but limits the fracture height.
It can be seen from Table 2 that when the velocity is high (3 mL/s), the cement bedding of the 21-10 and 21-7 samples closes, and the final fracture height of these two samples is relatively large. At the same time, by comparing samples 21-1 and 21-11, it can be found that although their failure modes are similar, due to the large velocity of 21-11, the upper part of the crack surface (Figure 11f) still has a red indicator, which indicates that the crack continues to expand longitudinally besides the continuous deepening of the concrete bedding. While the crack in sample 21-1 directly expands to the boundary along the bedding plane to cause damage. This means that properly increasing the velocity can promote the pressure in the seam and improve the penetration effect, but too high a velocity will reduce the complexity. It can be seen from the above analysis that properly selecting the viscosity and velocity of fracturing fluid can not only meet the fracture height but also advance the opening of the weak surface in the reservoir and boost the fracture volume.

5.2. Effect of Stress Difference between Vertical and Horizontal Direction

Table 2 shows that the samples of failure Mode II are those with large stress differences (the stress combination is 4-4-7 MPa). Comparing 21-7 and 21-10 shows that the high stress difference is conducive to the opening of the cement-salt interface. By comparing samples 21-1 and 21-10, the low stress difference causes the opening of an internal weak surface. While the high in-situ stress difference (21-10 sample) causes the opening of the concrete salt interface, which shows that a high stress difference has contrary effects on reservoir bedding surface and rock interface. For the former, high vertical pressure can open microfractures, close pores, and inhibit the opening of fractures in the shale. For the latter, the high stress difference will aggravate the incompatibility of interfaces between different rocks, thus making the cement-salt interfaces open easily.

5.3. Response Characteristics of the Pump Pressure Curve

As shown in Figure 12, the pump pressure curves of the samples with the same fracture mode are drawn together. All curves can be divided into three categories according to the shape of the pump pressure curves. For Mode I, the cement bedding plane is not opened during the expansion process, so the fracture is less affected and finally forms a single longitudinal main fracture. The fracturing curve has obvious fracture characteristics, and the curve fluctuation is small, such as the pump pressure curve of Sample 21-9. For the Mode II, the curve shape is similar to a “stump”. After the pressure rises, the curve is affected by the fracture opening and cement-salt plane disturbance and frequently fluctuates in a zigzag shape. The expansion of fracturing fluid along the bedding makes the curve also show the characteristics of low extension pressure and an inconspicuous fracture mode. For Mode III, the fracturing fluid opens the cement bedding and filters off along the weak surface, and the pump pressure is low, which is also characterized by less obvious fracture characteristics. At the same time, the curve also has strong volatility, such as the curve of Sample 21-1.

6. Conclusions

In this paper, the mechanical and microscopic properties of shale bedding and salt-shale interfaces, the main geological interfaces of inter-salt shale reservoirs, are studied. On this basis, cement-salt combination samples with composite interfaces are prepared, and hydraulic fracturing tests are carried out under different fluid velocity, viscosity, and stress conditions. The conclusions can be summarized as follows:
The main geological interfaces of inter-salt shale reservoirs can be divided into shale bedding and salt-shale. The former is evenly distributed with salt, which will loosen the rock mass. The average tensile strength of the bedding plane is 0.42 MPa, which is a quarter of the tensile strength of the shale matrix. The cohesion c = 1.473 MPa, and the internal friction angle is 19.00°. The bedding seriously affects the integrity and strength of the rock mass. The latter is relatively straight and well cemented, the interface strength is greater than that of shale bedding, and the internal friction angle is φ = 26.15°, cohesion c = 2.373 MPa.
There are three basic fracture modes for composite specimens: (1) the crack directly passes through the entire specimen. (2) The hydraulic fracture only extends to the cement-salt interface and then deflects, finally forming an “I”-shaped fracture. (3) A hydraulic fracture opens cement bedding planes.
Low-viscosity fracturing fluid is easy to cause the opening of the internal bedding interface, and high-viscosity tends to produce a single longitudinal crack. Properly increasing the velocity can enhance the pressure and improve the penetration effect, but increasing it too high will reduce the complexity of the fracture. It is necessary to select the viscosity and displacement properly.
An excessive stress difference between vertical and horizontal directions will aggravate the strain incompatibility of the interface between different rock properties, making the interface easy to open.
Under different failure modes, the response characteristics of the pump pressure curve are different. For Mode I, the curve has obvious fracture characteristics and little fluctuation. For Mode II, the curve shape is similar to a “tree stump” and fluctuates frequently, and the fracture mode is not obvious. For Mode III, the curve shows fluctuation while the fracture pressure is low, and the fracture characteristics are not obvious.

Author Contributions

Conceptualization, methodology, validation, formal analysis, D.L. and X.Z.; investigation, data curation, D.L., X.Z. and Z.C. writing-original draft preparation, D.L.; writing-review and editing, X.Z. and Z.C.; supervision, funding acquisition, Z.C. All authors have read and agreed to the published version of the manuscript.

Funding

National Key Laboratory Funding of Independent Research Project: S18406.

Institutional Review Board Statement

Not applicable.

Informed Consent Statement

Not applicable.

Data Availability Statement

Not applicable.

Conflicts of Interest

The authors declare no conflict of interest. The funder had no role in the design of the study; in the collection, analyses, or interpretation of data; in the writing of the manuscript; or in the decision to publish the results.

References

  1. Bian, B.; Iming, A.; Gao, T.; Liu, H.; Jiang, W.; Wang, X.; Ding, X. Petroleum Geology and Exploration of Deep-Seated Volcanic Condensate Gas Reservoir around the Penyijingxi Sag in the Junggar Basin. Processes 2022, 10, 2430. [Google Scholar] [CrossRef]
  2. Guo, X.; Yan, Q.; Wang, A. Assessment of methods for forecasting shale gas supply in China based on economic considerations. Energies 2017, 10, 1745. [Google Scholar] [CrossRef] [Green Version]
  3. Tan, P.; Jin, Y.; Hou, B.; Chang, Z.; Han, K.; Fan, M. Vertical Propagation Law of Hydraulic Fracture in Sandstone-Mudstone Interbedding Reservoirs Based on Discrete Element Method. In Proceedings of the 51st U.S. Rock Mechanics/Geomechanics Symposium, San Francisco, CA, USA, 25–28 June 2017. [Google Scholar]
  4. Sun, X.; Luo, T.; Wang, L.; Wang, H.; Song, Y.; Li, Y. Numerical simulation of gas recovery from a low-permeability hydrate reservoir by depressurization. Appl. Energy 2019, 250, 7–18. [Google Scholar] [CrossRef]
  5. Wan, B.; Liu, Y.; Zhang, B.; Luo, S.; Wei, L.; Li, L.; He, J. Investigation of the Vertical Propagation Pattern of the 3D Hydraulic Fracture under the Influence of Interlayer Heterogeneity. Processes 2022, 10, 2449. [Google Scholar] [CrossRef]
  6. Yang, Y.; Peng, J.; Chen, Z.; Zhou, X.; Zeng, Y.; Wang, Y.; Wang, X. Depositional Models of Deep-Water Gravity-Flow in Lacustrine Basin and Its Petroleum Geological Significance—A Case Study of Chang 6 Oil Group in Heshui Area, Ordos Basin, China. Front. Earth Sci. 2022, 9, 1262. [Google Scholar] [CrossRef]
  7. Zhang, G.; Wang, H.; Li, F.; Wang, D.; Li, N.; He, S. Effects of Hydration during Drilling on Fracability of Shale Oil Formations: A Case Study of Da’anzhai Section Reservoir in Sichuan Basin, China. Processes 2022, 10, 2313. [Google Scholar] [CrossRef]
  8. Zhao, Y.; Wang, L.; Ma, K.; Zhang, F. Numerical Simulation of Hydraulic Fracturing and Penetration Law in Continental Shale Reservoirs. Processes 2022, 10, 2364. [Google Scholar] [CrossRef]
  9. Dong, L.; Li, L.; Dong, W.; Wang, M.; Chen, X. Investigation on the Injection Pattern of Intermittent Natural Gas Flooding in Ultra-Low Permeability Reservoirs. Processes 2022, 10, 2198. [Google Scholar] [CrossRef]
  10. Chen, Z.; Feng, Y.; Zhang, X.; Guo, X.; Shao, L.; Cao, Y.; Li, S.; Gao, L. Similarity criterion for the nonlinear thermal analysis of the soil freezing process: Considering the dual effect of nonlinear thermal parameters and boundary conditions. Acta Geotech. 2022, 17, 5709–5719. [Google Scholar] [CrossRef]
  11. Chen, Z.; Guo, X.; Shao, L.; Li, S.; Gao, L. Sensitivity analysis of the frozen soil nonlinear latent heat and its precise transformation method. Geophys. J. Int. 2022, 228, 240–249. [Google Scholar] [CrossRef]
  12. Chen, Z.; Guo, X.; Shao, L.; Li, S.; Tian, X. Design of a three-dimensional earth pressure device and its application in a tailings dam construction simulation experiment. Acta Geotech. 2021, 16, 2203–2216. [Google Scholar] [CrossRef]
  13. Advani, S.; Lee, J.; Lee, T.-S.; Jinn, J.; Choudhry, S. Fracture mechanics modeling associated with layered rock and bi-material interfaces. In Proceedings of the 28th U.S. Symposium on Rock Mechanics (USRMS), Tucson, AZ, USA, 29 June–1 July 1987. [Google Scholar]
  14. Maji, A.K.; Wang, J. Nonlinear model for fracture at the concrete-rock interface. In Proceedings of the 33rd U.S. Symposium on Rock Mechanics (USRMS), Santa Fe, NM, USA, 3–5 June 1992. [Google Scholar]
  15. Li, L.; Wong, R.; Cao, F.; Tong, D.; Tian, L.; Chen, Q. Experimental and Numerical Investigation on Crack Propagation in Bi-materials of Marble and Concrete. In Proceedings of the ISRM International Symposium on Rock Mechanics—SINOROCK 2009, Hong Kong, China, 19–22 May 2009. [Google Scholar]
  16. Shen, G.; Shen, X.; Wang, S. Numerical and Experimental Studies on Fracture Propagation at a Bi-material Interface and Its Application to Hydraulic Fracturing. In Proceedings of the 48th U.S. Rock Mechanics/Geomechanics Symposium, Minneapolis, MN, USA, 1–4 June 2014. [Google Scholar]
  17. Wang, S.; Xing, C.; Zhang, D.; Shao, C.; Dong, K. The Fracture Behavior in the Vicinity of Interface Based on the Digital Speckle Experiment. In Proceedings of the SPE Asia Pacific Oil & Gas Conference and Exhibition, Perth, Australia, 25–27 October 2016. [Google Scholar]
  18. Rho, S.; Noynaert, S.; Bunger, A.; Zolfaghari, N.; Xing, P.; Abell, B.; Suarez-Rivera, R. Finite-element simulations of hydraulic fracture height growth on layered mudstones with weak interfaces. In Proceedings of the 51st U.S. Rock Mechanics/Geomechanics Symposium, San Francisco, CA, USA, 25–28 June 2017. [Google Scholar]
  19. Tan, P.; Jin, Y.; Ke, H. Analysis of hydraulic fracture initiation and vertical propagation behavior in laminated shale ormation. Fuel 2017, 206, 482–493. [Google Scholar] [CrossRef]
  20. Zhao, H.; Wang, X.; Liu, Z.; Yan, Y.; Yang, H. Investigation on the hydraulic fracture propagation of multilayers-commingled fracturing in coal measures. J. Pet. Sci. Eng. 2018, 167, 774–784. [Google Scholar] [CrossRef]
  21. Zhu, H.; Wang, H.; Tang, X.; Li, Y. Hydraulic fracture propagation in sand-mudstone interbedded reservoir integrated with different fluid flow of multi-perforated fractures. In Proceedings of the ARMA-CUPB Geothermal International Conference, Beijing, China, 5–8 August 2019. [Google Scholar]
  22. Qiu, H.; Wang, F.; Zhu, Z.; Wang, M.; Yu, D.; Luo, C.; Wan, D. Study on dynamic fracture behaviour and fracture toughness in rock-mortar interface under impact load. Compos. Struct. 2021, 271, 114174. [Google Scholar] [CrossRef]
  23. Liu, Y.; Lebedev, M.; Zhang, Y.; Wang, E.; Li, W.; Liang, J.; Feng, R.; Ma, R. Micro-cleat and permeability evolution of anisotropic coal during directional CO2 flooding: An in situ micro-CT study. Nat. Resour. Res. 2022, 31, 2805–2818. [Google Scholar] [CrossRef]
  24. Liu, Y.; Wang, E.; Jiang, C.; Zhang, D.; Li, M.; Yu, B.; Zhao, D. True Triaxial Experimental Study of Anisotropic Mechanical Behavior and Permeability Evolution of Initially Fractured Coal. Nat. Resour. Res. 2023, 1–19. [Google Scholar] [CrossRef]
  25. Tao, X.; Okere, C.J.; Su, G.; Zheng, L. Experimental and theoretical evaluation of interlayer interference in multi-layer commingled gas production of tight gas reservoirs. J. Pet. Sci. Eng. 2022, 208, 109731. [Google Scholar] [CrossRef]
  26. Fan, X.; Su, J.; Chang, X.; Huang, Z.; Zhou, T.; Guo, Y.; Wu, S. Brittleness evaluation of the inter-salt shale oil reservoir in Jianghan Basin in China. Mar. Pet. Geol. 2019, 102, 109–115. [Google Scholar] [CrossRef]
  27. Liu, X.; Wu, S.; Chen, F.; Zhang, L.; Du, X.; Guan, W.; Liang, W. Characteristics of reservoirs for inter-salt shale oil of Qianjiang Formation Qianjiang Sag, Jianghan Basin: A case study of the -10 rhythm. Pet. Geol. Exp. 2021, 43, 268–275. [Google Scholar]
  28. Yang, L.; Lu, H.; Fan, X.; Huang, Z.; Zhou, T. Salt Occurrence in Matrix Pores of Intersalt Shale Oil Reservoirs. Sci. Technol. Eng. 2020, 20, 1839–1845. [Google Scholar]
  29. Hondros, G. The evaluation of Poisson’s ratio and the modulus of materials of low tensile resistance by the Brazilian (indirect tensile) test with particular reference to concrete. Aust. J. Appl. Sci. 1959, 10, 243–268. [Google Scholar]
  30. Shen, Y.; Hu, Z.; Chang, X.; Guo, Y. Experimental Study on the Hydraulic Fracture Propagation in Inter-Salt Shale Oil Reservoirs. Energies 2022, 15, 5909. [Google Scholar] [CrossRef]
  31. Zeng, H.; Jin, Y.; Wang, D.; Yu, B.; Zhang, W. Numerical Simulation on Hydraulic Fracture Height Growth across Layered Elastic-Plastic Shale Oil Reservoirs. Processes 2022, 10, 1453. [Google Scholar] [CrossRef]
  32. Lecampion, B.; Bunger, A.; Zhang, X. Numerical methods for hydraulic fracture propagation: A review of recent trends. J. Nat. Sci. Eng. 2018, 49, 66–83. [Google Scholar] [CrossRef] [Green Version]
  33. Palmström, A.; Stille, H. Rock Engineering; ICE Publishing: London, UK, 2010. [Google Scholar]
  34. Zhang, X.; Bi, Z.; Chang, X.; Wang, L.; Yang, H. Experimental Investigation on Hydraulic Fracture Morphology of Inter-Salt Shale Formation. Front. Energy Res. 2021, 9, 893. [Google Scholar] [CrossRef]
Figure 1. Stratigraphic sequence of the Qianjiang Formation [26].
Processes 11 00280 g001
Figure 2. Observation on the internal lamination of a shale specimen.
Processes 11 00280 g002
Figure 3. The scanning of shale bedding.
Processes 11 00280 g003
Figure 4. Loading modes of the samples.
Processes 11 00280 g004
Figure 5. Samples before and after tests.
Processes 11 00280 g005
Figure 6. Shear parameters of the samples: (a) Shear resistance curves; (b) Strength fitting curves.
Processes 11 00280 g006
Figure 7. Shear parameter of the Salt-Shale samples: (a) Shear resistance curves, (b) Strength fitting curves.
Processes 11 00280 g007
Figure 8. Schematic diagram of sample structure.
Processes 11 00280 g008
Figure 9. Loading mode.
Processes 11 00280 g009
Figure 10. Basic fracture modes of specimens: (a) Mode I, (b) Mode II and (c) Mode III.
Processes 11 00280 g010
Figure 11. Basic fracture modes of specimens.
Processes 11 00280 g011aProcesses 11 00280 g011bProcesses 11 00280 g011c
Figure 12. Pump pressure curves of the composite specimens: (a) Mode I samples, (b) Mode II samples and (c) Mode III samples.
Processes 11 00280 g012
Table 1. Brazil splitting tests results.
Samples No.Depth/mSizeFailure Load/kNStrength/
MPa
Diameter/mmHeight/mm
1820-13645.7724.8812.440.230.48(∥)
1820-23645.7724.9612.470.801.67(⊥)
2180-13656.3624.8412.440.210.43(∥)
2180-23656.3624.9012.460.821.69(⊥)
2184-13656.4225.3815.840.290.46(∥)
2184-23656.4225.3818.231.131.56(⊥)
2185-13656.5224.9212.450.180.37(∥)
2185-23656.5224.8912.440.841.72(⊥)
2187-13656.5824.9312.460.190.38(∥)
2187-23656.5824.9512.470.851.73(⊥)
3366-13855.4824.8412.430.290.45(∥)
3366-23855.4824.8512.440.821.68(⊥)
3655-13873.3124.5418.270.230.33(∥)
3655-23873.3124.5419.801.091.41(⊥)
Table 2. Brazil-splitting test results.
Samples No.Injection
Velocity/(mL/s)
Viscosity (mPa·s)Stress State
(σxyz)
Fracture Mode
21-1134-4-5Mode III
21-11234-4-5Mode III
21-103954-4-5Mode I
21-2234-4-7Mode II
21-91954-4-5Mode I
21-73954-4-7Mode II
Disclaimer/Publisher’s Note: The statements, opinions and data contained in all publications are solely those of the individual author(s) and contributor(s) and not of MDPI and/or the editor(s). MDPI and/or the editor(s) disclaim responsibility for any injury to people or property resulting from any ideas, methods, instructions or products referred to in the content.

