Article

Mathematical Modeling of Eicosanoid Metabolism in Macrophage Cells: Cybernetic Framework Combined with Novel Information-Theoretic Approaches

1
Department of Bioengineering, University of California San Diego, La Jolla, CA 92093, USA
2
The Davidson School of Chemical Engineering, Purdue University, West Lafayette, IN 47907, USA
3
Department of Computer Science, Indiana University, Bloomington, IN 47405, USA
4
Department of Computer Science, Purdue University, West Lafayette, IN 47907, USA
5
Department of Computer Science and Engineering, Cellular and Molecular Medicine, San Diego Supercomputer Center and the Graduate Program in Bioinformatics and Systems Biology, University of California San Diego, La Jolla, CA 92093, USA
*
Authors to whom correspondence should be addressed.
These authors contributed equally to this work.
Processes 2023, 11(3), 874; https://doi.org/10.3390/pr11030874
Submission received: 18 January 2023 / Revised: 2 March 2023 / Accepted: 8 March 2023 / Published: 15 March 2023
(This article belongs to the Special Issue Pharmacodynamics Modeling of Anti-inflammatory Drugs)

Abstract

:
Cellular response to inflammatory stimuli leads to the production of eicosanoids—prostanoids (PRs) and leukotrienes (LTs)—and signaling molecules—cytokines and chemokines—by macrophages. Quantitative modeling of the inflammatory response is challenging owing to a lack of knowledge of the complex regulatory processes involved. Cybernetic models address these challenges by utilizing a well-defined cybernetic goal and optimizing a coarse-grained model toward this goal. We developed a cybernetic model to study arachidonic acid (AA) metabolism, which included two branches, PRs and LTs. We utilized a priori biological knowledge to define the branch-specific cybernetic goals for PR and LT branches as the maximization of TNFα and CCL2, respectively. We estimated the model parameters by fitting data from three experimental conditions. With these parameters, we were able to capture a novel fourth independent experimental condition as part of the model validation. The cybernetic model enhanced our understanding of enzyme dynamics by predicting their profiles. The success of the model implies that the cell regulates the synthesis and activity of the associated enzymes, through cybernetic control variables, to accomplish the chosen biological goal. The results indicated that the dominant metabolites are PGD2 (a PR) and LTB4 (an LT), aligning with their corresponding known prominent biological roles during inflammation. Using heuristic arguments, we also infer that eicosanoid overproduction can lead to increased secretion of cytokines/chemokines. This novel model integrates mechanistic knowledge, known biological understanding of signaling pathways, and data-driven methods to study the dynamics of eicosanoid metabolism.

1. Introduction

Inflammation, an important biological process, is part of the mammalian defense mechanism against infectious stimuli. It initiates a remedial response by activating signaling pathways and metabolic regulation, and plays a vital role in combating antigens, repairing injured tissue, and restoring homeostasis. The inflammatory response of the body fights off infecting pathogens by increasing the production of immune signaling proteins called cytokines and chemokines, as well as specific lipids known as eicosanoids. However, excessive levels of cytokines may result in chronic inflammatory diseases such as inflammation syndrome and asthma. Dysregulated cytokine production within tissues and organs leads to cytokine storms [1,2,3,4]. Recent studies have also shown that cytokine storms during infections like COVID-19 may be responsible for an unreasonable inflammatory response, causing multiple organ failure, and lung injury. The complexity of the cytokine storm has limited the development of therapeutic strategies to control the dysregulation of inflammatory reactions in COVID-19, and clinical trials targeting specific cytokines have been ineffective [5]. A few studies suggest that targeting eicosanoid metabolism could be a promising new approach to regulating cytokine storm in COVID-19 infection [1,6]. However, the causal relationship between the eicosanoid and cytokine secretion processes is unknown due to insufficient mechanistic information [4,7,8]. In this work, we develop a mathematical approach to understand this causal relationship towards developing a kinetic model to study the dynamics of eicosanoid metabolism.
Computational modeling of biological systems is challenging due to unknown underlying factors, the vast complexity of the regulatory processes (mechanistic knowledge), and lack of quantification of interactions and parameters [9,10,11,12]. Various mathematical models are based on some assumptions, and they incorporate known regulatory mechanisms and biological information [13,14,15,16,17,18,19,20,21,22]. However, cybernetic modeling provides a framework to capture unknown complex regulations as well. It implicitly accounts for regulatory mechanisms by formulating a biological “goal” for the system. The cybernetic model postulates that the regulation of metabolic reactions, signal transduction pathways, and gene transcription occur to achieve a biological “goal” in response to stimuli [9,10,11]. The cybernetic goal and the control variables, u and v , are thereby formulated mathematically to achieve the defined biological “goal” [9]. The cybernetic control variable u modulates the enzyme synthesis process, and v controls the enzyme activity [9]. The goal-oriented control policies of cybernetic models have been used to predict metabolic phenomena, including complex substrate uptake patterns, dynamic metabolic flux distributions, the behavior of gene knockout strains, and prostaglandin dynamics in mammalian cells [23,24,25,26,27,28]. In the work described here, we modeled the inflammatory response in mammalian cells, which involves the secretion of specific eicosanoids, a cytokine, and a chemokine.
Eicosanoids modulate numerous homeostatic and inflammatory processes linked to multiple diseases. They are formed due to the oxidation of arachidonic acid (AA), an omega-6 poly-unsaturated fatty acid. Their production includes enzymatic pathways, such as cyclooxygenase (COX), lipoxygenase (LOX), cytochrome P450 (CYP450) or non-enzymatic free radical mechanisms [29,30,31,32,33,34]. Drugs that block the formation of eicosanoids remain a predominant approach to ablate the inflammatory response. Non-steroidal anti-inflammatory drugs (NSAIDs) work by inhibiting the COX pathway and are one of the most consumed pharmacotherapeutic agents for treating chronic inflammatory diseases [31,32,33,34,35,36,37]. However, only a few studies have focused on modeling AA metabolism [19,36,38,39,40,41]. The developed models are based on a linear kinetics assumption and include control at the gene expression level only. A recent study incorporated complex regulation by employing a cybernetic modeling approach to study eicosanoid formation due to COX activation but assumed a linear form for the cybernetic goal [28]. A detailed outline of the work presented in this paper is provided in the following summary. We developed a cybernetic model to study the dynamics of eicosanoid metabolism accounting for the role of two signaling molecules, a cytokine Tumor Necrosis Factor Alpha (TNF α ) and a chemokine C-C Motif Chemokine Ligand 2 (CCL2), during the inflammatory response of mouse bone-marrow-derived macrophages (BMDM). The eicosanoid network of AA metabolism included two branches—Prostanoids (PRs) which are metabolites resulting from Cyclooxygenase (COX) activation along with Leukotrienes (LTs) and Hydroxyeicosatetraenoic acid (HETEs) from Lipoxygenase (LOX) activation. Our cybernetic model is based on the premise that the cells accomplish the biological goal of optimizing the inflammatory response. Given the complexity of mammalian systems, the system is comprised of branch-specific cybernetic goals for the AA network, which are mathematical representations of the biological goal. The biological goal of optimizing these markers was chosen based on existing biological knowledge that PRs are related to the production of TNF α , and LTs are related to CCL2 because of their similar role in cell motility during inflammation [42,43,44]. Thus, we defined the branch-specific cybernetic goals for PRs and LTs as maximizing the production rate of the cytokine TNF α and the chemokine CCL2, respectively. We formulated the cybernetic goals using time-series-analysis-based information-theoretic approaches, which are data-driven methods, to quantitatively capture the aforementioned unknown causal interactions. We showed that the cybernetic model combined with information-theoretic approaches successfully captures the eicosanoid profiles and dynamics. We also used qualitative arguments to show that eicosanoid overproduction can cause excess cytokine levels. The success of the cybernetic model signified that the cell is optimizing inflammation by maximizing the production rate of TNF α and CCL2.

2. Materials and Methods

In this section, we present the methodology adopted to develop the cybernetic framework integrated with information-theoretic approaches. Section 2.1 presents the kinetic model for the temporal evolution of eicosanoid formation. Upon stimulus or perturbation, the cells undergo transitions from an in initial state to a final state. In the case of an inflammatory stimulus, the cell transitions from a normal state to an inflamed state. While the initial normal and final inflamed states can be defined in a thermodynamic sense of having the Boltzmann most probable distribution, we do not have a perspective on the dynamics of the transition. The cybernetic method defines the mechanism by which it selects the trajectory that obeys standard conservation laws, chosen to achieve the end goal of the inflammatory state, as reflected by variables like TNF α or CCL2. The cybernetic formulation assesses an optimal trajectory computed through the cybernetic control variables, u and v . These variables are incorporated in the rate balance equations for the eicosanoids and their associated enzymes and are calculated using the mathematical form of the cybernetic goal. The mathematical representation of the cybernetic goal is expressed through an optimal utility function ( ρ i , defined in Section 2.1.3). Section 2.2 discusses the method for mathematically formulating the cybernetic goal using information-theoretic approaches. Section 2.3 and Section 2.4 describe the strategy for simulating the cybernetic model and validating it, respectively.

2.1. Development of the Cybernetic Formulation: Kinetic Model

For the purpose of this study, the eicosanoid network of AA metabolism included two branches—PRs due to COX activation and LTs and HETEs due to LOX stimulation (Figure 1) [45,46,47,48]. The measurements are made available by the LIPID MAPS consortium. Experimental data for eicosanoids is available for three experimental conditions: control, treatment with Adenosine triphosphate (ATP), (3-deoxy-d-manno-octulosonic acid)2-lipid A (KLA), and a combined treatment of ATP and KLA in mouse bone marrow-derived macrophages (BMDM). The measurements are available at time points 0, 0.25, 0.5, 1, 2, 4, 8, and 20 h. The biological response includes early fast and late slow response. To capture the full dynamics, the initial time intervals are shorter, and the later ones are larger. The data for all these conditions were taken from the LIPID MAPS database [45,46,47,48]. Details of the experimental procedure can be obtained from the LIPID MAPS website (protocol available at: www.lipidmaps.org/protocol (accessed on 1 January 2023).
The conversion of AA into metabolites P i , where P i is LTA 4 ,   5 -HETE ,   1 5 -HETE ,   or   PGH 2 (Figure 1), is described by Equation (1). The kinetics of this reaction is modeled as four separate mechanisms: a basal rate of synthesis, generation due to ATP stimulation, degradation rate, and the downstream fluxes in Equation (1). It is important to note that PGH2 and LTA4 are unstable intermediates and cannot be measured easily. We assume that the ATP concentration decreases exponentially from t = 0 as f ( t ) = e x p ( k d t ) , where k d is the decay rate (see Section 2.3). The KLA stimulation occurs at t = 4 h. The KLA activation is not modeled because its level is negligible at t 0 even though its effect has propagated to the downstream components, such as COX gene expression.
r A P i = d P i d t =   k i e i [ A A ] ( 1 + k A T P [ A T P ] ) g i P i ( d o w n s t r e a m   f l u x e s ) for   P i = { LTA 4 ,   5 -HETE , 15 -HETE ,   PGH 2 }
Here, k i is the reaction rate constant, e i is the relevant enzyme level, and g i is the degradation rate. The rate constants k A T P are associated with P i generation due to ATP activation. We refer to the Supplementary Section S1 for the full set of equations. PGH2 and LTA4 get converted into PRs and LTs, respectively. These components of the model employ the cybernetic framework to capture regulation between the different metabolic options [44].

2.1.1. Kinetic Equations for PRs Branch

The kinetic balance for PGH2 is given by Equation (2).
d [ P G H 2 ] d t = e P G H 2 k P G H 2 [ A A ] ( 1 + k A T P [ A T P ] ) g P G H 2 [ P G H 2 ] i = 1 4 v P R i r P R i k i n e P R i , for   P R i = { P G D 2 ,   P G E 2 ,     P G F 2 α ,     T x B 2 }
Here, e P G H 2 is the level of enzyme involved with catalyzing P G H 2 formation. k P G H 2 is the rate constant for P G H 2 . In the expression 1 + k A T P [ A T P ] , the first term captures the basal (control) response due to COX1, and the second term captures the response due to COX2 (inducible form). COX3, a splice variant of COX1, mediates the pharmacological action of paracetamol and other antipyretic analgesic drugs, which are weak inhibitors of COX1 and COX2 [49]. However, in our study, the experimental data used did not correspond to the application of drugs. Hence, we did not include COX3 explicitly in our model and assumed that its effect is absorbed in the basal response itself. e P R i is the enzyme level corresponding to a PR, P R i . The enzyme balance is discussed later in this section. Furthermore, v P R i is the cybernetic control variable for enzyme activity and the production rate of P R i is r P R i k i n e P R i .
r P R i k i n = k P R i [ P G H 2 ]
Here, k P R i is the rate constant associated with a PR, P R i , formation and r P R i k i n e P R i is regulated by v P R i . The downstream fluxes include the decay of P G H 2 due to its conversion to different P R i = { P G D 2 ,   P G E 2 ,   P G F 2 α ,   T x B 2 } (Figure 1), captured by r P R i k i n e P R i v P R i . The kinetic balance for P R i is given by Equation (4).
d [ P R i ] d t = v P R i e P R i k P R i [ P G H 2 ] g P R i [ P R i ] ( d o w n s t r e a m   f l u x e s ) ,
where, g P R i is the degradation rate of P R i . The downstream fluxes are null for PGE 2 ,   PGF 2 α , and TxB 2 (Figure 1). D i are the downstream products of PGD2 (Figure 1), which are non-enzymatic reactions; the rate balance equations (represented as ordinary differential equations (ODEs)) are given by:
d D i d t = k D i [ P G D 2 ] g i D i ( d o w n s t r e a m   f l u x e s )   for
D i = { P G J 2 ,   d P G J 2 ,   d P G D 2 }
Here, k D i is the rate constant of the reaction D i . The equations describing the LOX branch of the network are included in the Supplementary Section S1.

2.1.2. Enzyme Balance

In this section, we discuss the enzyme balance equations. The enzyme level, e i , for all enzymatic reactions is governed by Equation (6).
d e i d t = α + u i r e i k i n β e i ,     r e i k i n = k e i [ S i ] K e i + [ S i ]  
Here, α is the constitutive rate of synthesis. The cybernetic control variable u i regulates the inducible rate of enzyme synthesis, r e i k i n , which follows Michaelis-Menten kinetics, and β is the decay rate. S i is the substrate participating in the formation of the particular product. k e i is the rate constant, and K e i is the Michaelis-Menten constant. The scaled enzyme level, ε i , is governed by the following equation:
d ε i d t = β α + r e i k i n u i α + m a x ( r e i k i n ) β ε i       = β ( α + k e i [ M s ] u i K e i + [ M s ] ) β ε i
where   ε i = e i m a x ( e i ) ,   m a x ( e i ) = α + m a x ( r e i k i n ) β ,   m a x ( r e i k i n ) = k e i ,   α = α α + k e i ,   and   k e i = k e i α + k e i
The quantities on the right-hand side of Equation (7) denote the constitutive rate α , the maximum inducible rate k e i [ S i ] K e i + [ S i ] of enzyme synthesis is modulated by cybernetic variable u i , and the decrease of enzyme level through degradation by the rate constant β .

2.1.3. Cybernetic Goal Formulation and Cybernetic Control Variables u i and v i

The cybernetic goal maximizes the sum of optimal utility functions ( ρ i ) as shown in Equation (9) [10,11,29].
max i ρ i
where i indicates the metabolite considered. The weights ( w i ) denote the contribution of a metabolite towards its cybernetic goal. The weighted flux through a particular pathway of a product P i is w i r i k i n ε i . The optimal utility function ρ i is the ratio of w i r i k i n ε i to the concentration of P i , per Equation (10). The function accounts for feedback repression of enzyme synthesis [50].
ρ i = w i r i k i n ε i / P i
The cybernetic control variables u i and v i are computed using the Matching and Proportional laws, respectively:
u i = ρ i j = 1 n ( ρ j )   ,     v i = ρ i m a x j ( ρ j )
The cybernetic goal and optimal utility functions is formulated in Section 2.2.3 for PRs ( ρ P R i ) and LTs ( ρ L T i ) branches.

2.2. Development of Information-Theoretic Approaches for Formulating the Cybernetic Goal

The aim of this section is to mathematically formulate the cybernetic goal using information-theoretic approaches. The steps involve: (a) generating a fine-grained and evenly-spaced data set for eicosanoids, TNF α , and CCL2 using their sparse experimental observations (Section 2.2.1), (b) determining the cybernetic goal using the RSTE method we developed for causality derivation between AA and TNF α /CCL2 (Section 2.2.2), and (c) mathematically formulating the cybernetic goal using ρ i , which requires mutual information for the time series formulation we developed (Section 2.2.3 and Section 2.2.4).

2.2.1. Data Needed for the Information-Theoretic Approach

The measurements are available for PRs and LTs (lipidomic data) and TNF α (proteomic data), and CCL2 (transcriptomic data) at seven time points (0.25, 0.5, 1, 2, 4, 8, and 20 h) [45,46,47,48]. The data-driven methods on this sparse data set may not adequately capture the accurate level of interactions between the time series. In order to resolve this, we generate data at additional intermediate time points using the available measurements, resulting in a fine-grained, evenly spaced data set. We employed the Python function pchip, which uses the piecewise cubic Hermite interpolating polynomial (pchip) method, to generate data points at intermediate times. We generated 500 data points using the experimental conditions containing seven-time points. The next step is to determine the causal relationship for AA with TNF α and CCL2, which requires developing a causality inference procedure.

2.2.2. Rényi Symbolic Transfer Entropy (RSTE): Derivation of Causality

The methods for causality derivation include various Granger causality and transfer entropy measures developed for stationary time series [51]. The concept of transfer entropy to determine causality is applied in various fields, such as neuroscience [52,53,54], finance [51,55,56,57,58,59,60], and genomics [61,62]. However, these methods apply to stationary time series only, rendering them unsuitable for our non-stationary dataset Equation (12). Moreover, the symbolization of time series overcomes existing limitations of available transfer entropy estimators [63]. For further details, readers can refer to Supplementary Section S2.
Our novel technique, the RSTE method, can be used to derive causality for a non-stationary time series. For given bivariate time series X t and Y t , we define the corresponding symbol sequences { x ^ t } and { y ^ t } . The symbol sequence generation [64] requires parameters m and τ as inputs, where m is the embedding dimension and τ is the time lag. The RSTE formulation quantifying the flow of information from Y t to X t is defined as in Equation (12).
R S T E Y t X t = 1 1 q l o g 2 [ t = 1 N t δ ϕ q ( x ^ t ) p q ( x ^ t + δ |   x ^ t ) t = 1 N t δ ϕ q ( x ^ t ,   y ^ t ) p q ( x ^ t + δ | x ^ t , y ^ t ) ] ϕ q ( x ^ t ) = p q ( x ^ t ) t p q ( x ^ t )
where δ denotes a time step and ϕ q ( x ^ t ) is the escort distribution, which contains a weighting parameter q > 0 . p ( x ^ t + δ |   x ^ t ) is the conditional probability distribution of { x ^ t + δ } when { x ^ t } is known and p ( x ^ t + δ | x ^ t , y ^ t ) is the conditional probability distribution of { x ^ t + δ } when { x ^ t } and { y ^ t } both are known. p q ( x ^ t + δ |   x ^ t ) denotes that p ( x ^ t + δ |   x ^ t ) is raised to the power q . R S T E Y t   X t is in bits because the base is log 2 . Similarly, we define R S T E X t   Y t . The directionality index T S = R S T E X t   Y t R S T E Y t   X t quantifies the effective direction of information flow. It attains positive values for interactions where X t is the cause and negative values for Y t causing X t . For symmetric bidirectional couplings, T S   0 [65]. RSTE involves determining the parameters m ,   τ and q . We train the RSTE model on the ATP data for the AA network to determine the parameters.

2.2.3. Branch-Specific Cybernetic Goals for PRs and LTs Branches

We defined branch-specific cybernetic goals for the AA network. Cytokines and chemokines are well-known markers of inflammation [42,43]. Consequently, we hypothesized that the cybernetic goal for the AA network is to maximize the production rate of the cytokine TNF α and the chemokine CCL2. The presence of a causal relationship between AA to TNF α and CCL2 supports our hypothesis. It is biologically known that the pro-inflammatory TNFα and PRs relate to increased inflammation [42,43], and LTs associate better with chemokines such as CCL2 because of their role in cell motility during inflammation [44]. Consequently, we formulated the cybernetic goal for PRs and LTs to maximize the production rate of TNF α and CCL2, respectively. We account for these relationships quantitatively using weights ( w P R i and w L T i ). For the PRs branch, w P R i is based on a quantitative measure of statistical interactions between each of the PRs and TNF α . w L T i denotes the weights for each of the LTs, which is calculated for a LT and CCL2 combination. Their computation is shown later in Section 2.2.4, Equation (19), and Section 2.3, Equation (20). The weighted flux through a particular pathway of a PR ( P R i ) is w P R i r P R i k i n ε P R i . The optimal utility function ρ P R i is the ratio of w P R i r P R i k i n ε P R i to the concentration of P R i , per Equation (13), using Equation (10). The mathematical formulation of the cybernetic goals from Equation (9) for the PRs and LTs branches are shown in Equations (14) and (15), respectively.
ρ P R i = w P R i r P R i k i n ε P R i / P R i
max i = 1 4 ρ P R i
where P R i = { P G D 2 ,   P G E 2 ,   P G F 2 α ,   T x B 2 } .
max i = 1 3 ρ L T i
where L T i = { L T B 4 ,   6 t L T B 4 ,   12 L T B 4 } .
The cybernetic control variables u P R i and v P R i using Equation (11) are computed as shown in Equation (16).
v P R i = ρ P R i m a x j ( ρ j ) = w P R i r P R i k i n ε P R i / P R i m a x j = 1 , 2 , , n ( w P R j r P R j k i n ε P R j / P R j )   , u P R i = ρ i j = 1 n ( ρ j ) = w P R i r P R i k i n ε P R i / P R i j = 1 n ( w P R j r P R j k i n ε P R j / P R j )
The ρ L T i and cybernetic variables for L T i are included in the Supplementary Section S1. The w L T i , w P R i calculations for ρ L T i , ρ P R i computations are shown in Section 2.2.4 and Section 2.3. We devised a novel MI formulation to calculate w P R i , w L T i for a metabolite, for example, PGD2 and a cytokine TNFα.

2.2.4. Weight w i Calculation Using Mutual Information I T ( X t ; Y t )

Mutual information (MI) quantifies mutual dependence between two random variables; it signifies the statistical dependency of one variable on another [66]. The random variables X and Y can take values { a 1 ,   a 2 ,   a 3 ,   . .   ,   a S } and { b 1 ,   b 2 ,   b 3 ,   . .   ,   b S } (S denotes the number of values), respectively. Shannon’s mutual information definition I ( X ; Y ) [67] for X and Y, which utilizes joint probability function p a b ( a i , b j ) and marginal probability functions p a ( a i ) and p b ( b j ) , follows Equation (17).
I ( X ; Y ) = j = 1 S i = 1 S p a b ( a i , b j ) log p a b ( a i , b j ) p a ( a i ) p b ( b j )
Mutual information is a useful metric for determining the strength of dependencies in data sets [68,69,70,71]. However, for non-stationary time-series data, Equation (17) is not applicable due to intra- and inter-temporal correlations between time series at different times.
We developed an alternate algorithm, building upon Galka et al. [72], for estimating the MI calculation for bivariate time series corresponding to a single metabolite ( X t ) and a cytokine/chemokine ( Y t ). We use I T ( X t ; Y t ) to denote the MI formulation for bivariate time series. For detailed information on I T ( X t ; Y t ) , we refer to Supplementary Section S3. We use the time series X t = { x 1 ,   x 2 , , x N t } and Y t = { y 1 ,   y 2 , ,   y N t } where N t is the number of time points, generated in Section 2.2.1. The MI formulation for bivariate temporally correlated time series I T ( X t ; Y t ) , Equation (18), is defined as
I T ( X t ; Y t ) = N t p e f ( e i , f i ) l o g ( p e f ( e i , f i ) p e ( e i ) p f ( f i ) ) d e i d f i
The innovation series { e 1 ,   e 2 , . . ,   e N t } and { f 1 ,   f 2 , . . ,   f N t } correspond to time series X t = { x 1 ,   x 2 , , x N t } and Y t = { y 1 ,   y 2 , ,   y N t } . p e f is the joint probability distribution of ( e i , f i ) , and p e and p f are the marginal probabilities of e i and f i , respectively. The innovation series represents the difference between the observed value and the prediction made using a vector autoregression (VAR) time series predictor (Supplementary Section S3) [73]. The innovation series exhibits white noise features, such as wide-sense stationarity, confirmed by ADF (Augmented Dickey-Fulsler) and KPSS (Kwiatkowski–Phillips–Schmidt–Shin) tests [74]. Moreover, the data points formed an independent set, validated by the BDS (Brock–Dechert–Scheinkman) test for the independence of time series. The derivation of I T ( X t ; Y t ) in Equation (18) assumes that the innovation series follows identical distribution due to the unavailability of adequate data at each time point. The independence and identical distribution assumption of innovation series justify its use in the I T ( X t ; Y t ) formulation. I T ( X t ; Y t ) is estimated using the estimator developed by Kraskov et al. [65] and normalized as Equation (19) to compute normalized mutual information (NMI). It is important to note that the min-entropy normalization ensures that N M I ( X t ; Y t ) , Equation (19), attains values between 0 (minimum) and 1 (maximum).
N M I ( X t ; Y t ) = I T ( X t ; Y t ) min ( N t p e ( e i ) l o g p e ( e i ) d e i , N t p f ( f i ) l o g p f ( f i ) d f i )

2.3. Simulation Strategy for the Cybernetic Framework (Figure 2)

This section describes the strategy adopted to simulate the cybernetic model. We use N M I ( X t ; Y t ) , Equation (19), to calculate w i , which is defined as Equation (20). N M I ( X t ; Y t ) denotes the normalized mutual information for a PR-TNF α or LT-CCL2 combination. For instance, w P R i for PGD2 includes calculating N M I ( P G D 2 ;   T N F α ) for the PGD2 and TNF α combination because PRs are related to TNF α only. It also involves calculating N M I ( P R i ;   T N F α ) for each of the PRs and TNF α to compute the denominator. Similarly, N M I ( L T i ;   C C L 2 ) calculations are done for LTs. We scaled the normalized value of mutual information to calculate the weights w P R i and w L T i . Please note that PRs are PGD2, PGE2, PGF2a, TxB2 and LTs include LTB4, 12epi-LTB4, and 6trans-12epi-LTB4. The weights w P R i for different PRs are formulated as Equation (20) so that the sum of w P R i for all PRs add to one. This is also true for w L T i for LTs. We used this scaling to follow the standard notion of weights.
w P R i = N M I ( P R i ;     T N F α ) j N M I ( P R j ;   T N F α )
Using the ρ P R i   , ρ L T i calculations, we compute the cybernetic control variables employing Equation (16) and simulate the cybernetic model (Section 2.1 and Section 2.2) for the AA network. The AA metabolic network was simplified and divided into COX and LOX subnetworks for ease of computation to obtain the kinetic parameters. As an example of this simplification, thromboxane A2 (TXA2) synthase produces a bioactive lipid mediator TXA2, but TXA2 is rapidly and non-enzymatically degraded, making it difficult to measure. However, TXA2 is metabolized to a stable metabolite TXB2, which is measurable under our experimental conditions. Therefore, the simplified network included TXB2 but not TXA2. Similarly, we do not have measurements for the level of unstable intermediates PGH2 and LTA4. Therefore, in the parameter estimation process, we optimized the profile for PGH2 and LTA4 formation with the constraint that its maximum concentration remains ∼10 pmol/μg DNA based on the total amount of PGs and LTs, respectively. Next, the models for both pathways were described by 24 ODEs and 56 parameters. The rate constants were estimated using a three-step hybrid optimization approach (discussed in the next paragraph). We used the experimental data available for PRs and LTs as an 8-point time series for the control case (7 points for the treatment cases) over a 20-h time window. We used Equation (21) to determine the parameters to minimize the normalized fit-error between measured ( y i , j , e x p ) and simulated ( y i , j , p r e d ) data:
Min K , X o ( i = 1 n s p ( j = 1 n i ( y i , j , e x p y i , j , p r e d ( K , X 0 ) ) 2 max ( y i , j , e x p ) ) )
where K represents the parameters, X 0 denotes the initial condition of enzyme concentrations, ni is the number of time-points, 7 (indexed as j), and nsp is the total number of species (indexed as i). The ODEs in the model were solved using osde15s for stiff systems in MATLAB (2019, Natick, MA). Parameters (Supplementary Table S3) were optimized using a three-step hybrid optimization procedure that started with a heuristic search algorithm (Matlab® function “MultiStart”) seeded with an initial parameter set and ran up to 90 iterations to determine near-optimal parameter values. The result from the application of the heuristic optimization was then further refined using a two-step local optimization approach employing a string-searching algorithm (Matlab® function “patternsearch”) followed by a generalized constrained non-linear optimization utilizing a gradient search method (Matlab® function “fmincon”). Then, the eicosanoid profiles for the control, KLA primed, and ATP non-primed scenarios were simulated using the estimated parameters.
Figure 2. The mathematical framework of the cybernetic model employed to study the eicosanoid metabolism in the presence of the cytokine TNF α and chemokine CCL2. The experimental data is available for eicosanoids and signaling molecules for four different experimental conditions (CTRL, ATP, KLA, and KLA+ATP stimulation) at the LIPID MAPS website. The measurements available for PRs and LTs (lipidomic data) and TNF α (proteomic data), and CCL2 (transcriptomic data) at seven time points (0.25, 0.5, 1, 2, 4, 8, and 20 h). We employed the Python function pchip to generate data at intermediate time points. We derived causality for AA with TNF α and AA with CCL2 to justify the cybernetic goal. We used NMI to mathematically formulate the goal expressed as ρ P R i   ,   ρ L T i and computed cybernetic control variables using the goal. We trained the model for CTRL, ATP, and KLA experimental conditions. The final step was to validate the model by predicting an independent experimental condition of KLA+ATP stimulation, and performing F-Test. We also compared the simulated profiles of gene knockdown perturbation scenarios with the available experimental evidence.
Processes 11 00874 g002

2.4. Model Validation

To test the validity of the calculated parameters for the model, we used the estimated/optimized parameter values to predict a fourth independent data set, the eicosanoid profile in KLA-primed and ATP-stimulated BMDM cells. The goodness of fit of the simulated profiles with the experimental dataset was examined by performing the F-test [38]. The F-test calculation method and values are shown in Supplementary information (Section S2, Table S4). We also validate the model by comparing the gene knockdown simulation results with experimental observations (Section 2.4.1).

2.4.1. Perturbation Experiment: Gene Knockout (Chemical Knockdown in Supplementary, Section S4)

We simulate a gene knockdown study to suppress a specific enzyme in the eicosanoid network. The perturbation is quantified using the factor f , which takes values of 1, 0.5, and 0.1. We apply this perturbation to the ATP-stimulation experiment. The updated scaled enzyme ( ε i ) balance equation and initial condition ( ε i [ 0 ] ) as a result of perturbation f are shown in Equation (22). We simultaneously perturb the LTB4 and PGE2 branches; the results are discussed in the following section.
d ε i d t = f β ( α + k e i [ S i ] u i K e i + [ S i ] ) β ε i   ;                         ε i [ 0 ] = f α

3. Results

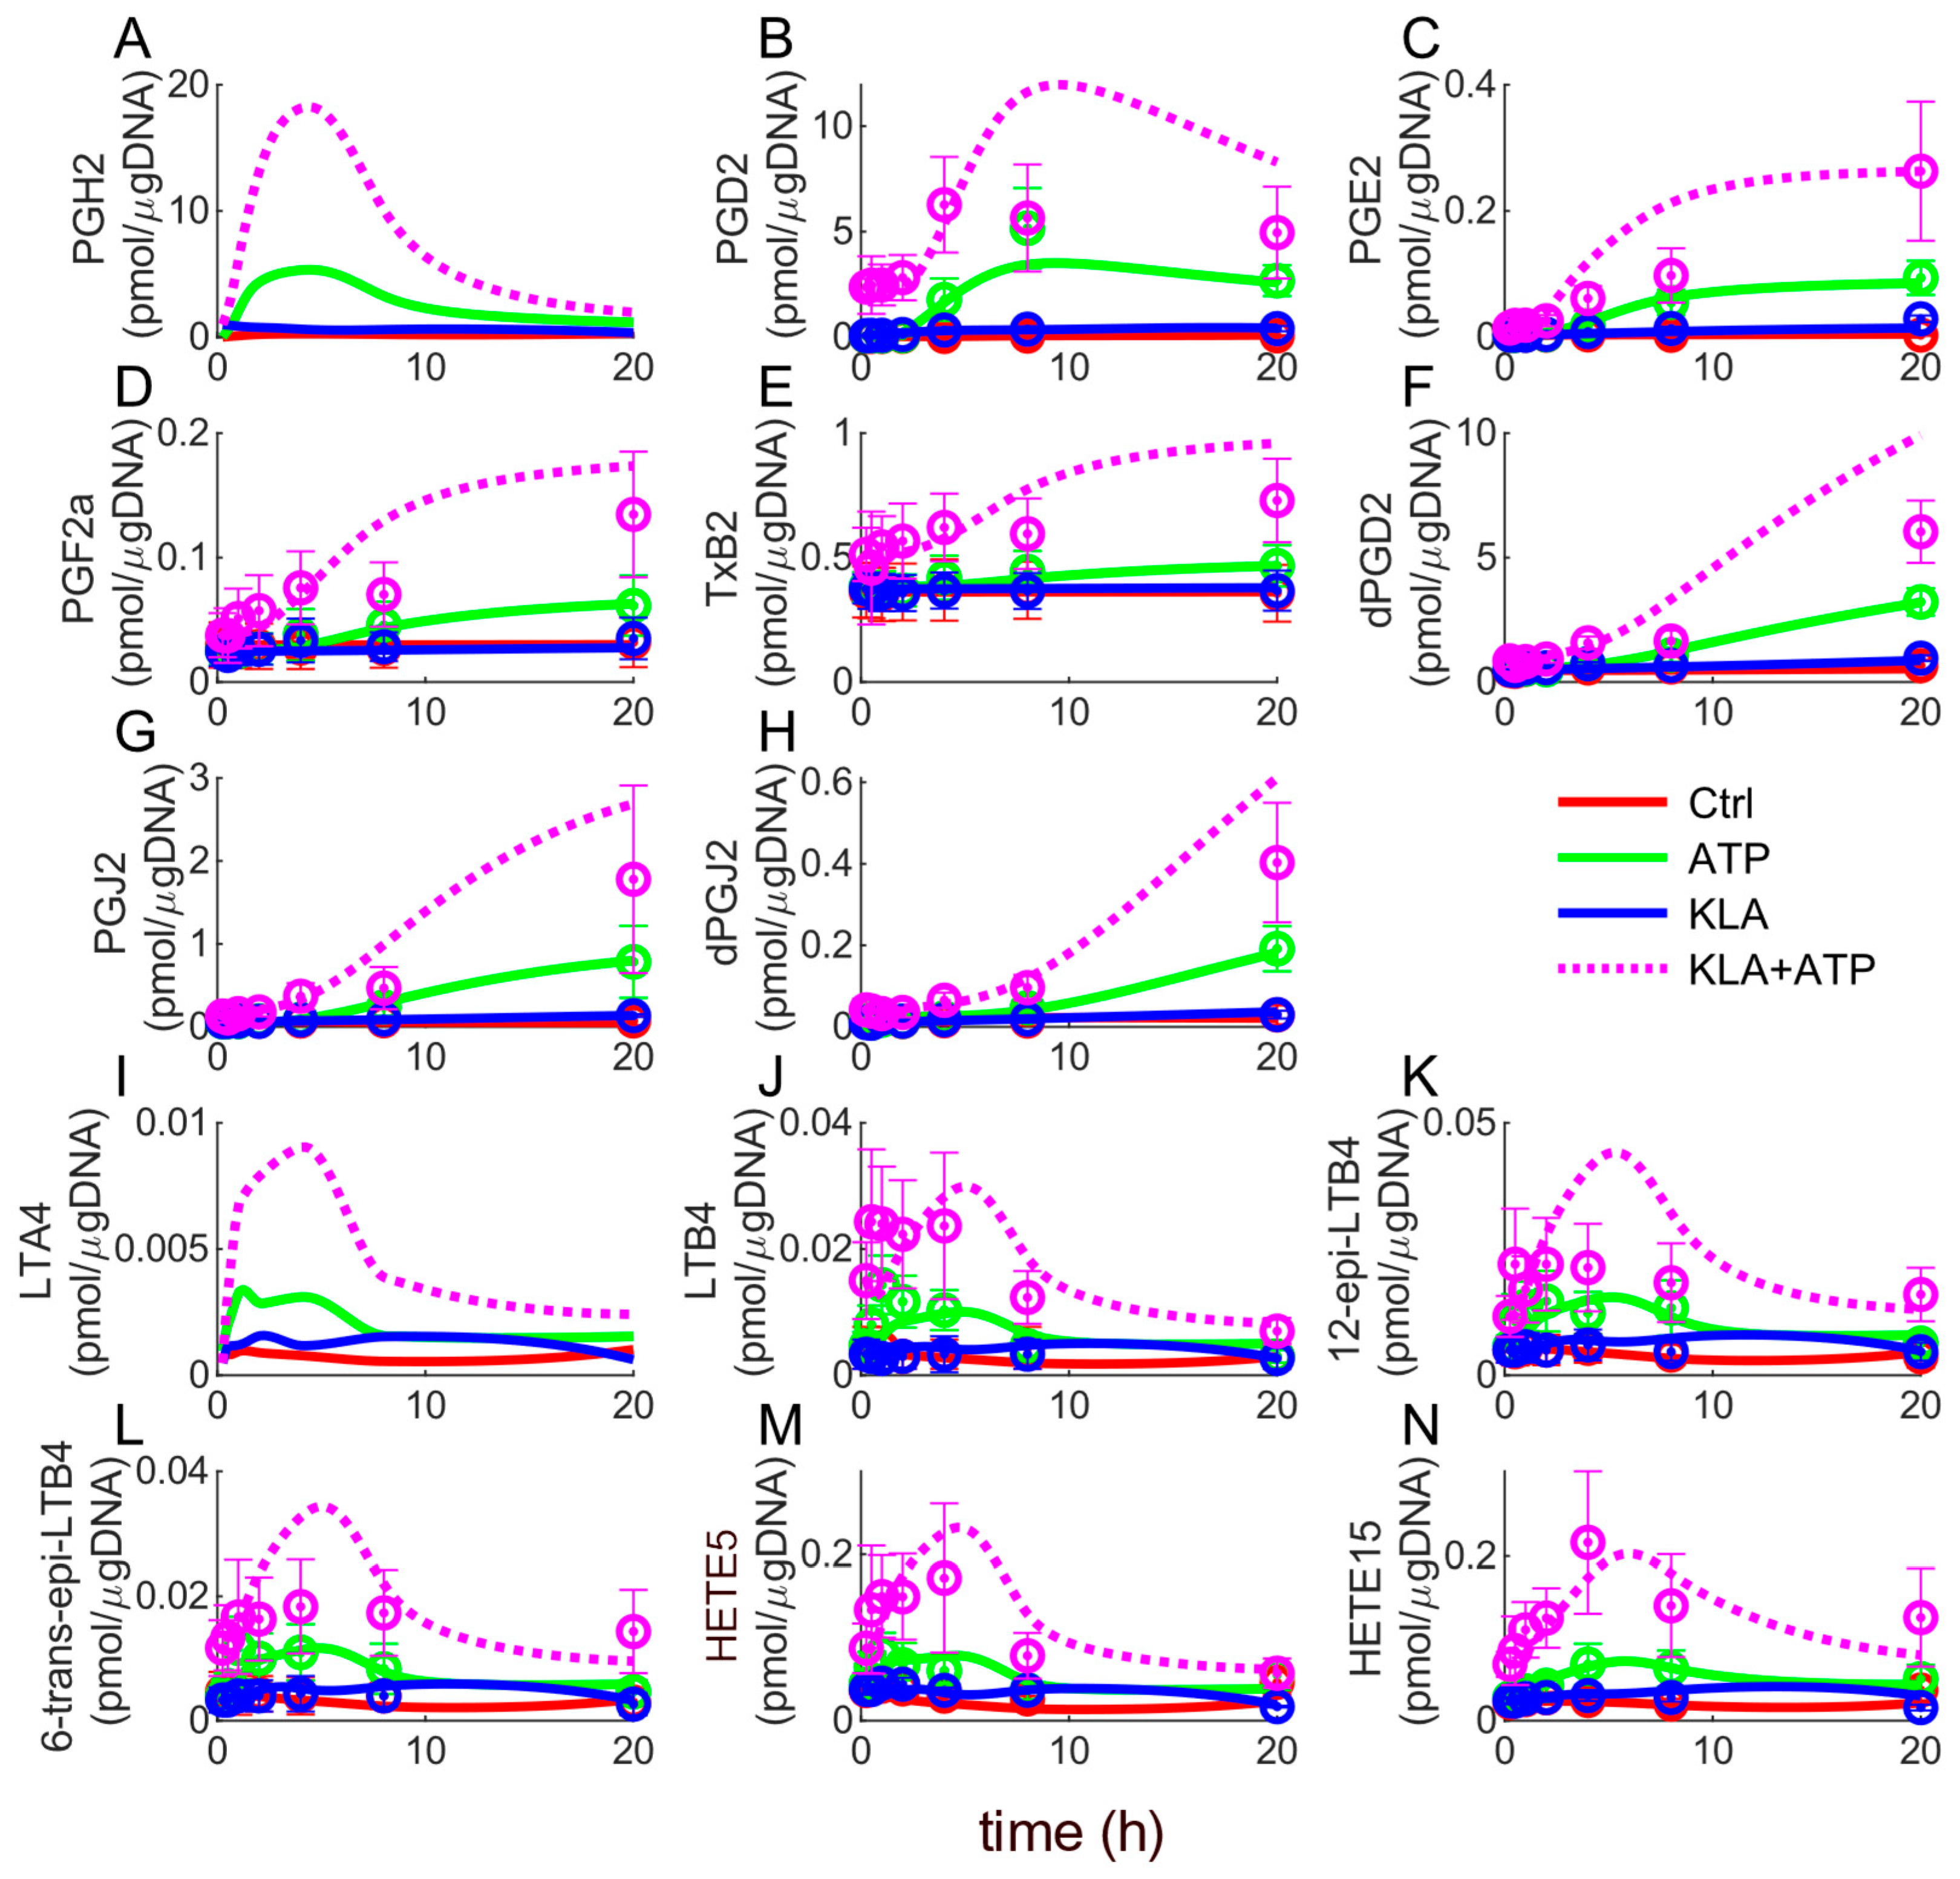
3.1. Simulated Profiles and Model Validation

The simulation results for the PRs and LTs metabolism in the presence of the cytokine TNF α and chemokine CCL2 are presented. The model development includes (1) determining the cybernetic goal, (2) computing the weights w P R i ,   w L T i and ρ P R i ,   ρ L T i for formulating the cybernetic goal, and (3) simulating the cybernetic rate balance equations. The RSTE method predicts that the cytokine and chemokine are released in response to AA secretion, signifying that AA production is the cause, while TNF α and CCL2 secretion are the effects. For the AA network, the RSTE model was trained on the ATP dataset with 77% prediction accuracy of connections with the optimized parameters m = 3 , q = 0.85 , and τ = 13 . These parameters were further used to predict causality for the metabolite data from the experimental condition KLA+ATP, resulting in 72% accurate predictions of the known causal relationships, which further proved that the trained RSTE model reasonably captures the known causal interactions in the system. We predicted causality between AA and the cytokine TNF α as well as AA and the chemokine CCL2 using the same parameters. The results imply that AA secretion is the cause of TNF α /CCL2 production. This outcome supports our hypothesis that the cybernetic goal for the AA network is to maximize the production of TNF α and CCL2. The RSTE values are included in Supplementary Table S2. Further, we used biological knowledge to infer that the cybernetic goals for PRs and LTs branches correspond to TNF α and CCL2, respectively. Thus, the branch-specific cybernetic goal is formulated to be the maximization of production rates of TNF α and CCL2. We quantify these interactions using weights w P R i and w L T i .
The w i values for PRs and LTs are shown in Supplementary Table S1. The w P R i ,   w L T i are used for ρ P R i ,   ρ L T i (ROI) calculations, which are employed for computing the cybernetic control variables. The model simulation results are shown in Figure 3 for PRs (Figure 3A–H) and LTs (Figure 3I–N); the plots indicate that our model adequately fits the three experimental conditions (CTRL, KLA, and ATP) for the AA metabolic network dynamics in mouse BMDM cells. For model validation, a fourth independent data set, a combined KLA-primed and ATP-stimulated case, was predicted using the parameter values determined from the model fit of the initial experimental conditions. The F-test was used as a measure of the fitness of the model, and values for all the metabolites are shown in Supplementary Table S4. The F-test values for the fitted data are smaller than F0.05 (21, 42) = 0.51 for all metabolites except PGE2, indicating that the fit-error is less than the experimental error. Even in the case of PGE2, although the F value is greater than F0.05 (21, 42), it is still less than F0.95 (21, 42) = 1.81, indicating statistically equal variance between the simulated and experimental data [38]. F-test values for the predicted case also display similar results, further validating the model.

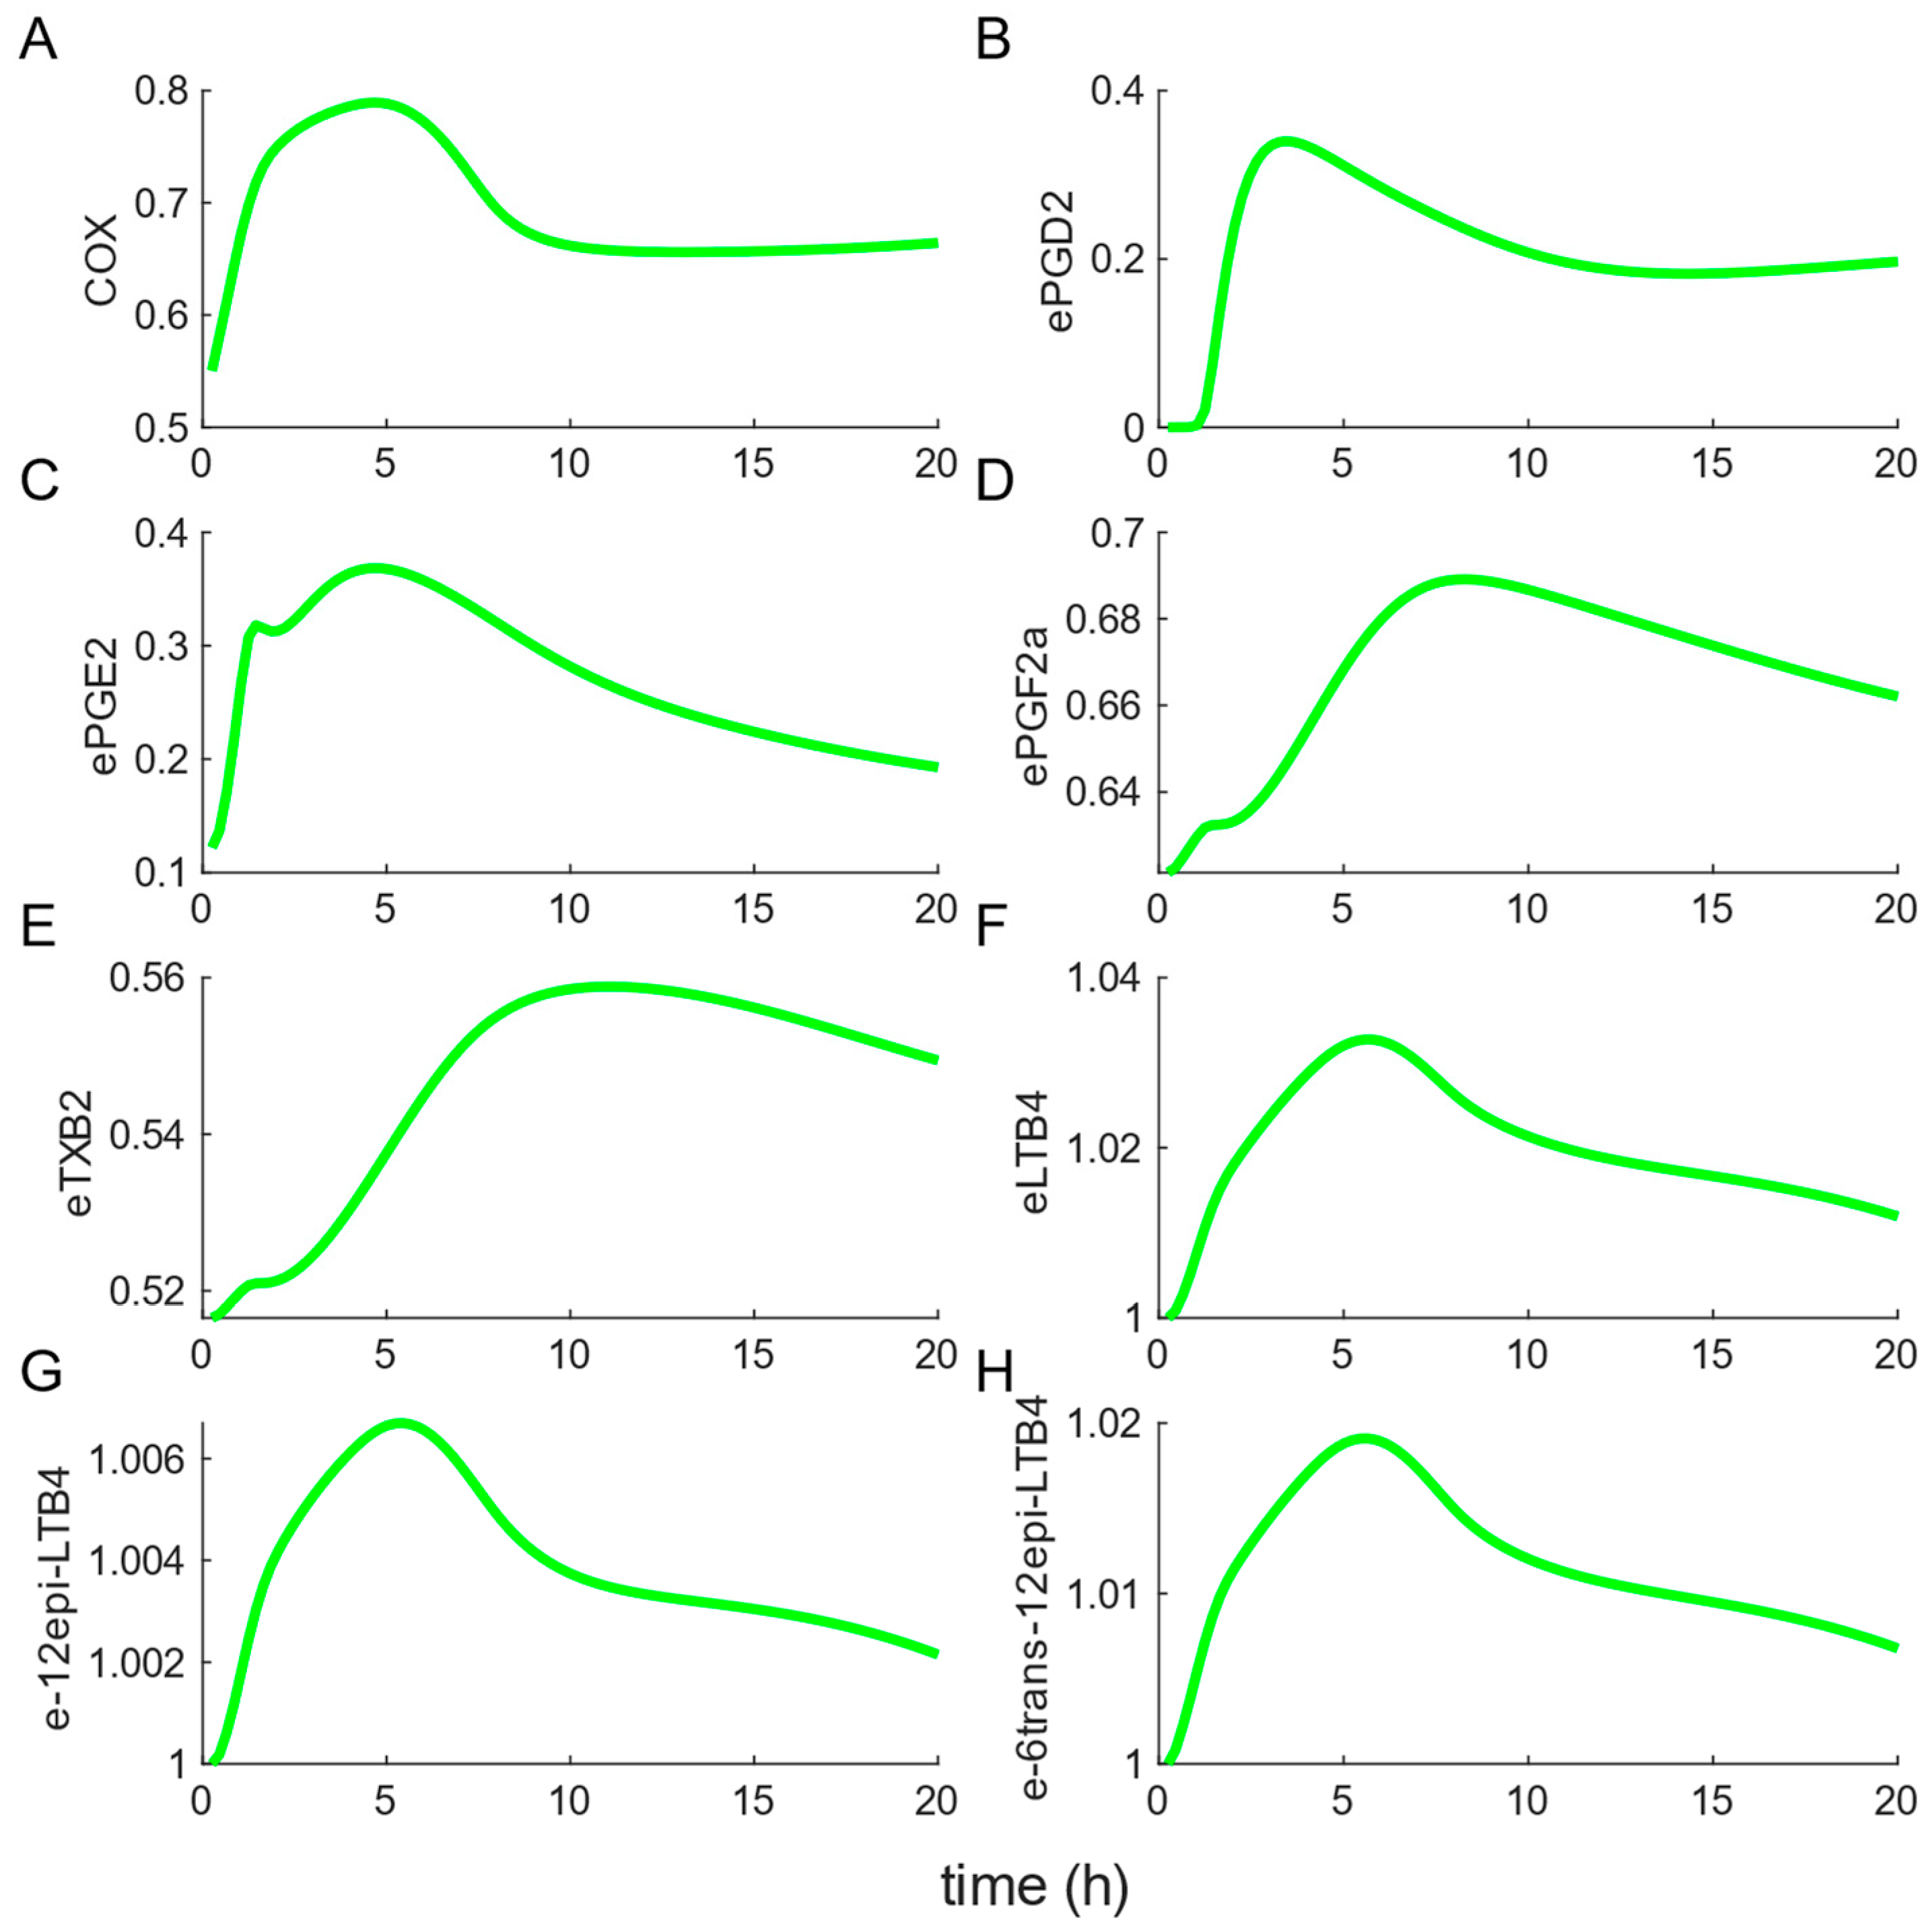
3.2. Model Outcome: Prediction of Enzyme Dynamics

The cybernetic model predicts the scaled levels of enzymes, using Equation (7), required for the relevant reactions (Figure 4). We only discuss the enzyme trends for the ATP condition because its metabolite concentration profiles are more dynamic (larger peak height) compared to those of the KLA treatment and CTRL conditions. The substrate profile governs the enzyme dynamics, which follows Michaelis-Menten kinetics (second term in Equation (7)). The COX (Figure 4A) enzyme reaches its maximum concentration within 8 h due to a peak in its corresponding substrate AA level. Similarly, the enzymes ePGD2 (Figure 4B), ePGE2 (Figure 4C), ePGF2a (Figure 4D), and eTXB2 (Figure 4E) follow their substrate PGH2 dynamics. The LOX (Figure 4F–H) branch enzyme profiles follow the same reasoning as the COX branch enzymes.

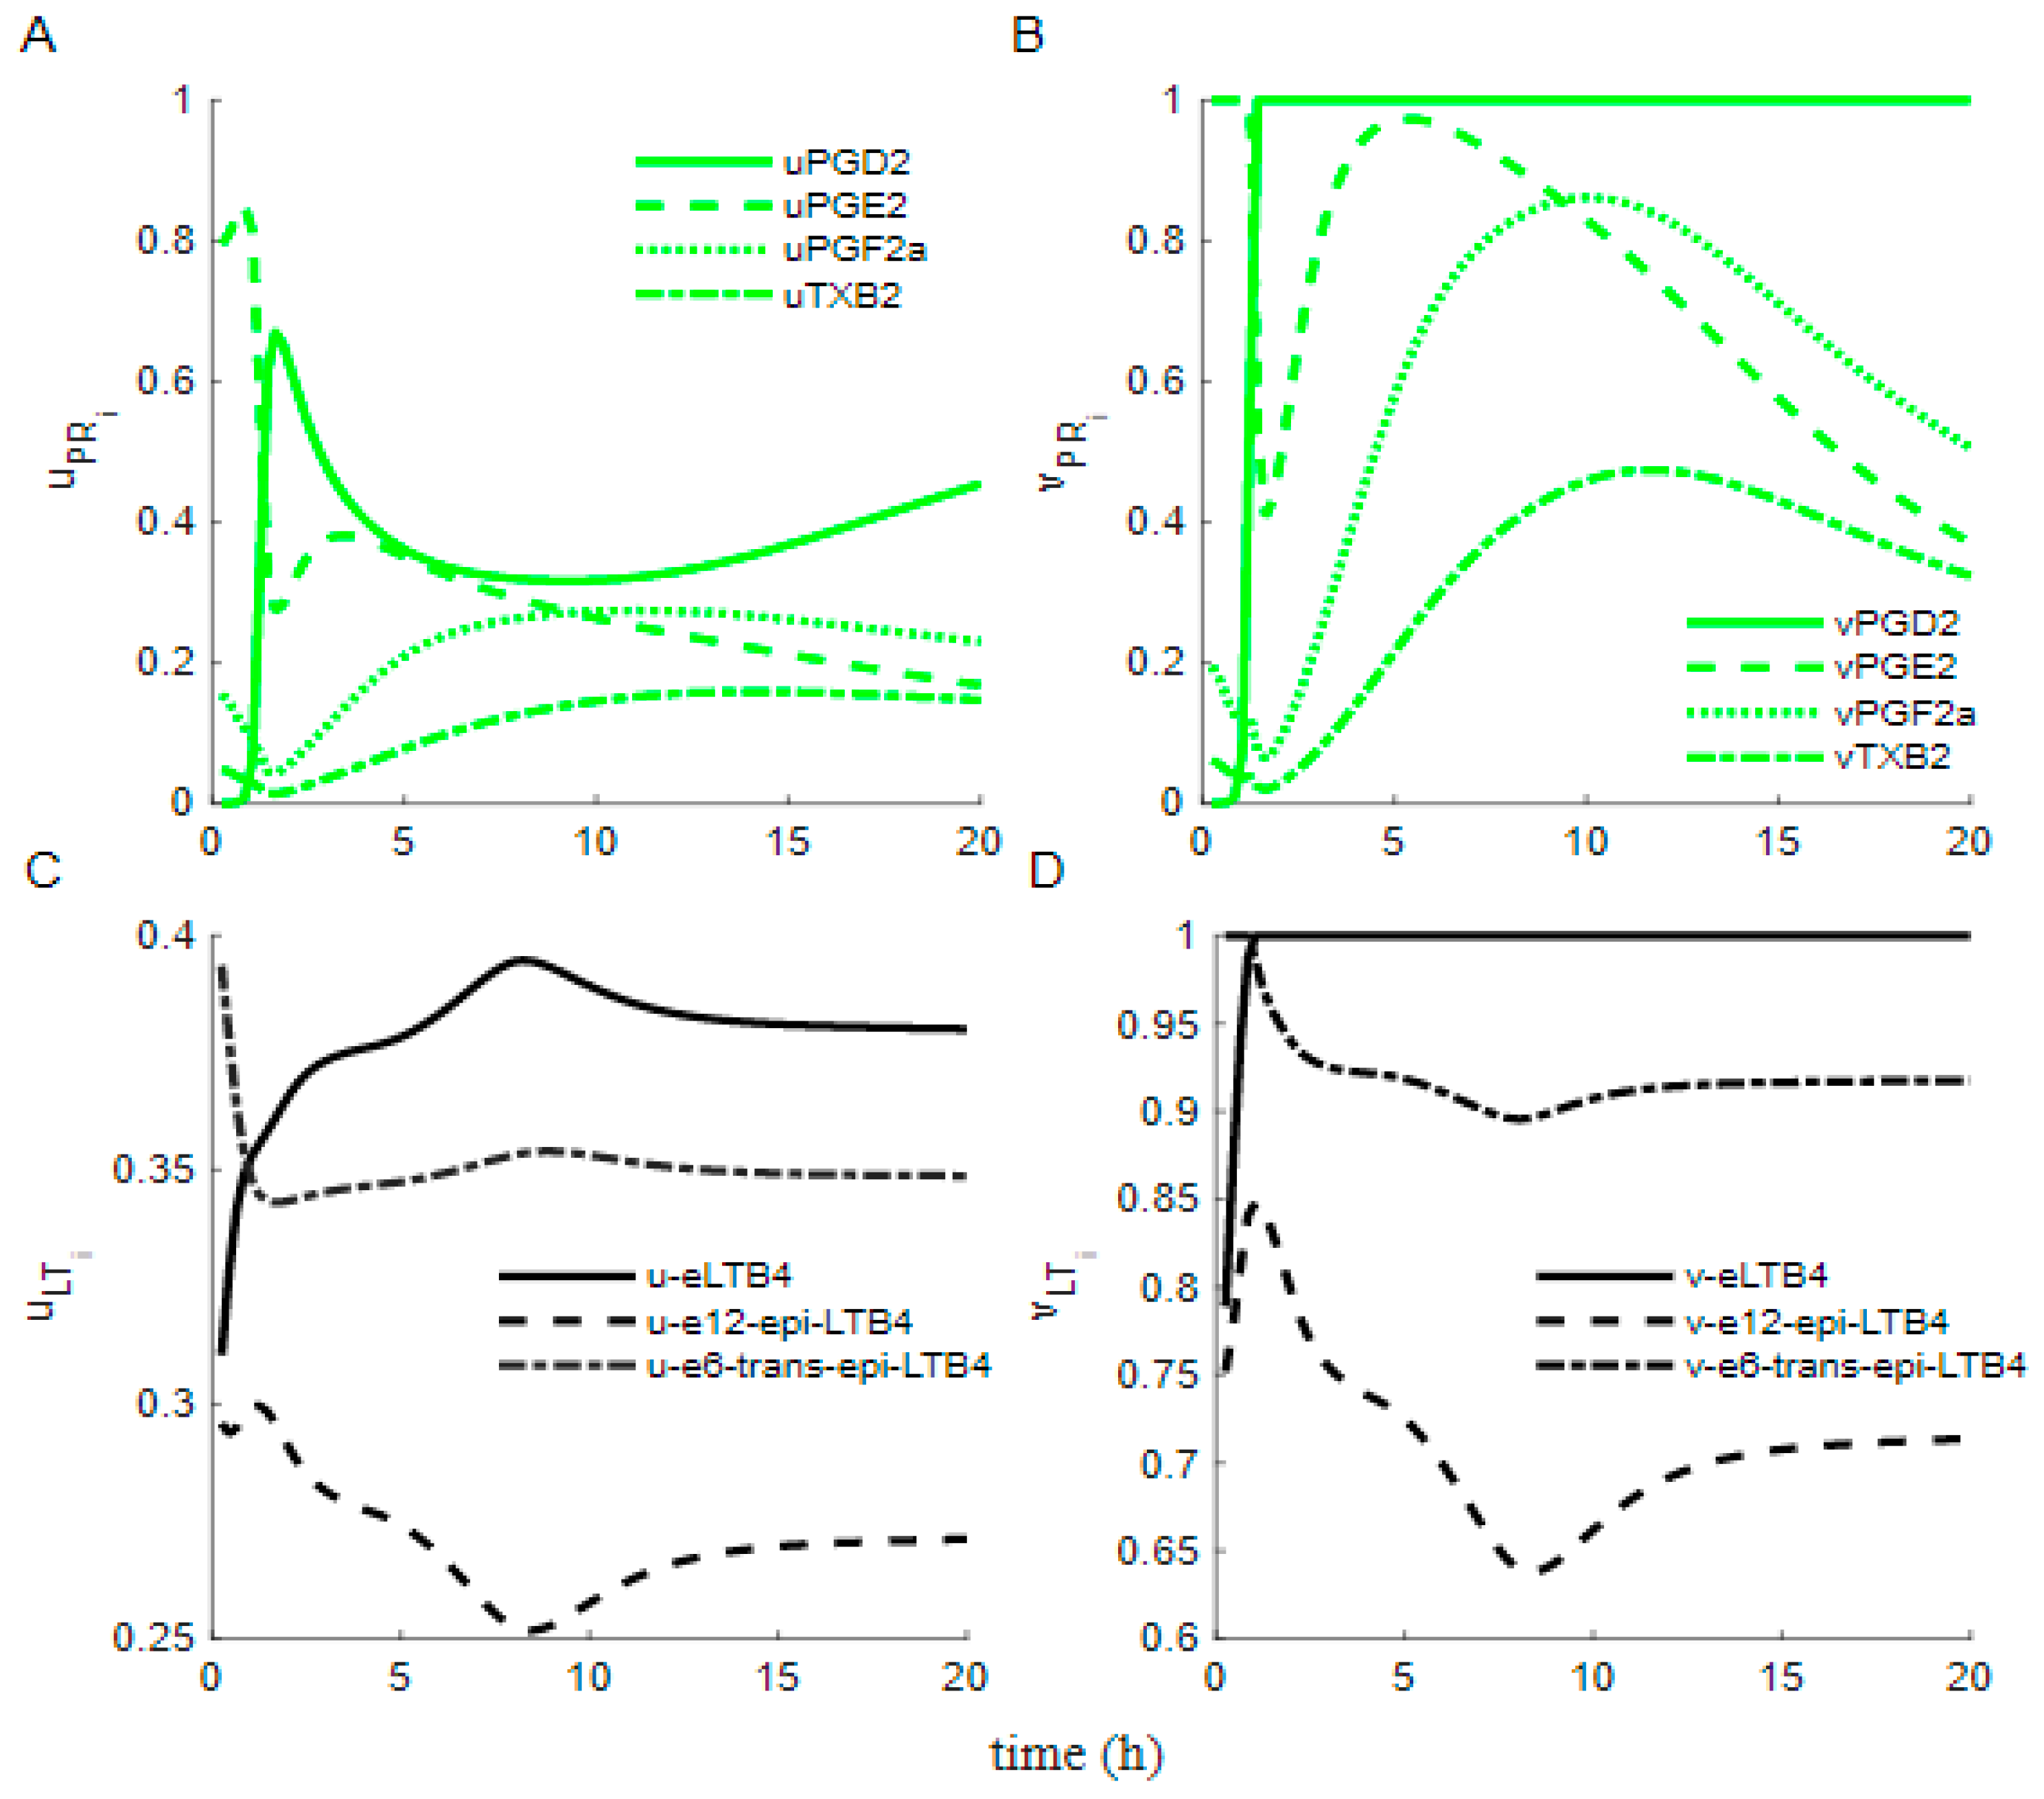
3.3. Dynamics of the Cybernetic Control Variables u i , v i

The optimal utility function ( ρ P R i ,   ρ L T i ) through a particular pathway is proportional to the weighted flux, shown in Equation (13). The cybernetic control variables u P R i ,   u L T i and v P R i ,   v L T i for the chosen pathway depend on their corresponding ρ P R i ,   ρ L T i . The higher the weighted flux, the higher the u P R i ,   u L T i and v P R i ,   v L T i values. The u P R i ,   u L T i and v P R i ,   v L T i plots shown in Figure 5 display the control dynamics that the system follows to optimize inflammation—the biological goal essential for restoring homeostasis—upon external stimulation.
For the PRs branch, cybernetic control is applied at the substrate PGH2, which is converted to the products PGD2, PGE2, PGF2a, and TxB2. There are control variables u P R i and v P R i associated with each of these metabolites. The corresponding u P G D 2 and v P G D 2 values in the model are highest for PGD2 for a considerable duration of time relative to the other PRs (Figure 5A,B), indicating that the weighted flux through the PGD2 branch is the maximum and, therefore, dominant branch for that portion of the network. For the LTs branch, cybernetic control is applied at the substrate LTA4, which is shared among LTB4, 12epi-LTB4, and 6trans-12epi-LTB4 metabolites. The u L T i and v L T i graphs for the LTs branch suggest that LTB4 is the dominant branch (Figure 5C,D) explaining why the weighted flux through the LTB4 branch is the maximum.

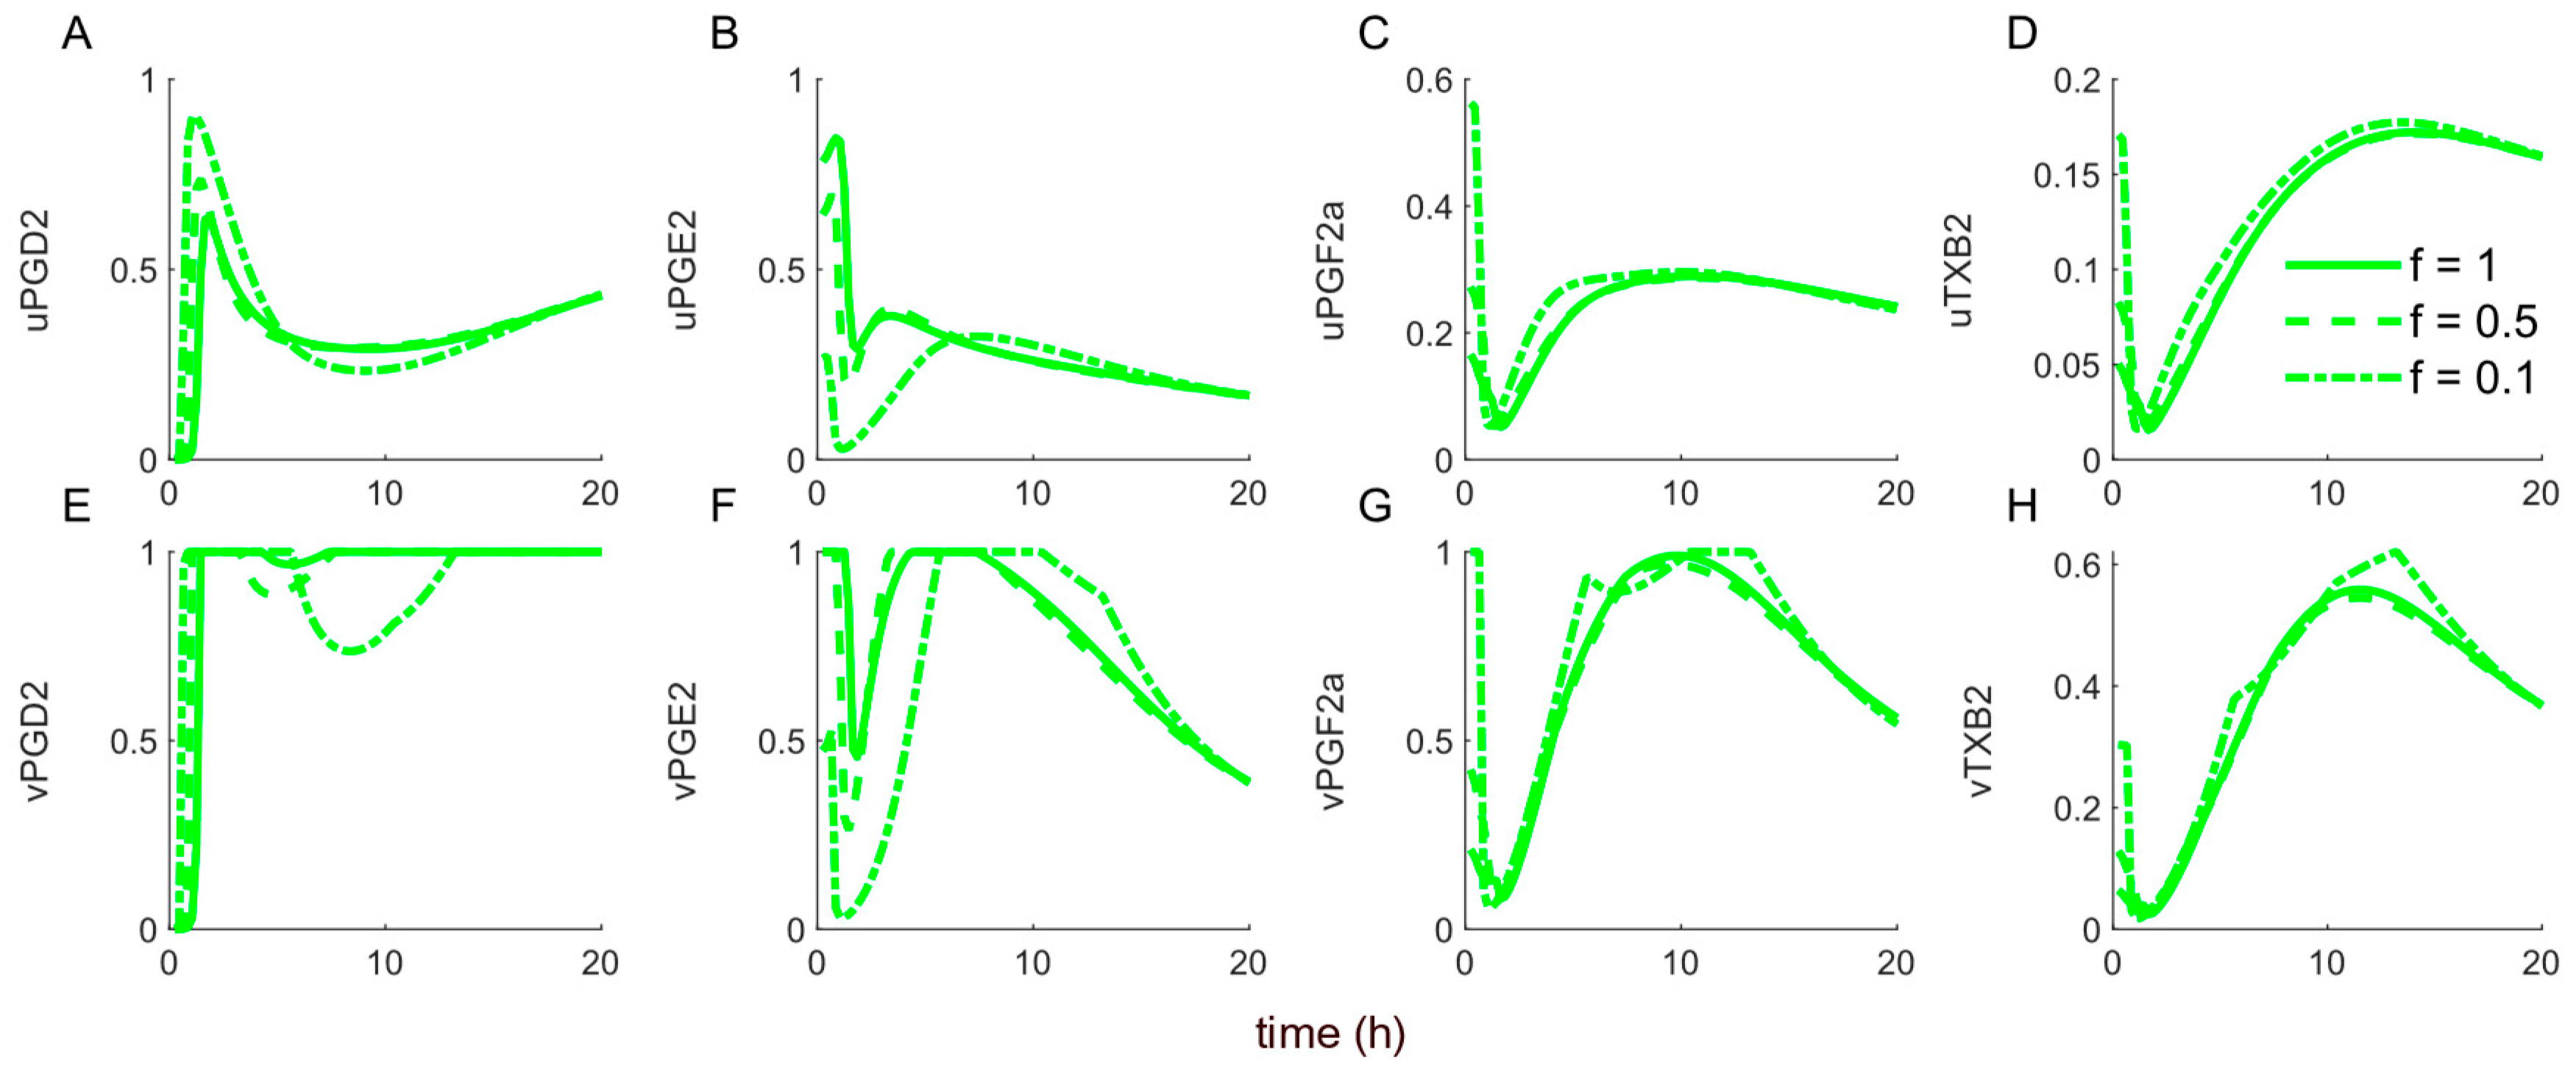
4. Model Validation: Model Perturbation Experiments

The model can predict dynamics in response to perturbations which can be explored experimentally. The gene knockdown perturbation simulations include the inhibition of enzyme levels. The model predictions of the percentage drop/rise in the concentrations of metabolites due to perturbations can be compared with experimental measurements.

4.1. Gene Knockdown: Enzyme Synthesis Perturbation of Ltbd4h (eLTB4) & Ptges (ePGE2)

4.1.1. Ltbd4h (eLTB4) Inhibition

A simulated enzyme perturbation to the LTB4 branch of the network alters the Ltbd4h scaled-enzyme levels (Figure 6). A lower f value corresponds to a decrease in the constitutive and inducible enzyme synthesis rates of Ltbd4h Equation (22) (Figure 6). As a result, we observe lower concentrations of eLTB4 as f decreases (Figure 6E). The flux reduces through LTA4 to LTB4 pathway, which results in a reduction of LTB4 levels (Figure 6B). Correspondingly, the flux increases through the 12epi-LTB4, and 6t-epi-LTB4 metabolites increase to balance the no-change in influx from AA to LTA4, and their respective levels increase (Figure 6C,D). The elevated LTA4 level (Figure 6A) in response to a lower f is due to suppressed production of LTB4 and subsequent accumulation of the metabolite prior to generating enough enzymes for the remaining metabolic products in the branch.
We observe a slight increase in scaled-enzyme levels for the other metabolites (e-12epi-LTB4 (Figure 6F), e-6t-epi-LTB4 (Figure 6G)) because of increased substrate LTA4 levels. HETE5 and HETE15 metabolites are not connected with the LTB4 branch and are independently produced in response to AA activation. A few experimental studies have confirmed this observed behavior: LTB4 diminishes, while HETE5 and HETE15 remain unchanged [75,76].
The cybernetic control variables u L T i and v L T i change with f for metabolites LTB4, 12-epi-LTB4, and 6t-epi-LTB4. For LTB4, its associated cybernetic variables u -eLTB4 (Figure 7A) and v -eLTB4 (Figure 7D) decrease initially because of the downregulation of its flux due to decreased scaled enzyme Ltbd4h resulting in decreased LTB4 concentrations. The enzyme synthesis variables u -e12-epi-LTB4 (Figure 7B) and u -6t-epi-LTB4 (Figure 7C), however, increase in response because the u for all the LTs metabolites in the branch (LTB4, 12epi-LTB4, and 6t-epi-LTB4) sum to 1. The increased flux of 12epi-LTB4 and 6t-epi-LTB4 also resulted in an increase in v -e12-epi-LTB4 (Figure 7E) and v -6t-epi-LTB4 (Figure 7F) initially.

4.1.2. Results of Ptges (ePGE2) Inhibition

A similar simulated enzyme perturbation to the PGE2 branch of the network alters the Ptges (ePGE2) enzyme levels, lowering the concentrations of Ptges (ePGE2, Figure 8J) as f decreases. The flux of PGE2 reduces because of decreased ePGE2, and PGE2 decreases (Figure 8C). The fluxes of PGD2, PGF2a, and TxB2 increase to maintain the constant influx from AA to PGH2. Subsequently, the levels for PGD2 (Figure 8B), PGF2a (Figure 8D), and TxB2 (Figure 8E) increase. Because PGD2 is the dominant metabolite, its increased flux lowers the substrate PGH2 (Figure 8A) levels to ensure that influx from AA to PGH2 is the same as outflux from PGH2 to downstream metabolites. Additionally, the increased flux of PGD2 leads to an increase in the concentration of downstream PGD2 products: dPGD2 (Figure 8F), PGJ2 (Figure 8G), and dPGJ2 (Figure 8H). The enzyme ePGD2 (Figure 8J) surges in response to increased PGD2 and results in a decrease in the substrate PGH2 (Figure 8A) levels as it is distributed through PGD2, PGE2, PGF2a, and TxB2 branches [76]. We observe a slight increase in enzyme levels for the other metabolites (ePGD2 (Figure 8I), ePGF2a (Figure 8K), eTxB2 (Figure 8L)) because of the corresponding increased metabolite levels. The corresponding u P R i and v P R i plots confirm the observed increase in flux through PGD2, PGF2a, and TxB2, and downregulated flux of PGE2. For PGE2, its associated cybernetic variables u -ePGE2 (Figure 9B) and v -ePGE2 (Figure 9F) decrease initially because of the downregulation of its flux due to decreased enzyme Ptges (ePGE2), resulting in decreased PGE2 concentrations. The enzyme synthesis variables u PGD2 (Figure 9A), u PGF2a (Figure 9C), and u TxB2 (Figure 9D) increase because the u P R i for all the PGs metabolites in the branch (PGD2, PGE2, PGF2a, and TxB2) sum to 1. The increased flux of PGD2, PGF2a, and TxB2 also results in an increase in v PGD2 (Figure 9E), v PGF2a (Figure 9G), and v TxB2 (Figure 9H).

4.2. Discussion

Inflammation is essential for restoring homeostasis of the body after injury or infection [33]. It is, therefore, reasonable to assume that the body attempts to achieve the biological goal of optimizing inflammation to counteract the effect of an invading pathogen. The body accomplishes this optimization goal by regulating the synthesis and activity of the enzymes associated with PR and LT production, among other processes. We use macrophage cell models to explore this regulation. Unlike the existing models, this mathematical framework (1) incorporated the known and unknown complex metabolic regulation by assuming a biological goal, (2) used non-linear kinetics through the cybernetic control variables, and (3) included formulation of the cybernetic goal by developing data-driven methods [19,23,36,38,39,40,41]. The simulated model captured the time evolution of eicosanoids under different conditions (Figure 3). The model is based on the hypothesis that the cybernetic goal for the AA network is to maximize the production rates of the cytokine TNFα and the chemokine CCL2. We derived a data-driven method (RSTE) to decipher the unknown causality between AA and cytokine/chemokine productions [6,37,38]. Using the RSTE method, we indeed established that AA secretion is the cause of TNF α (or CCL2) production. Previous experimental evidence confirms the presence of interactions between AA and TNF α /CCL2 [42,43,44]; however, the causal relationship is as-yet unknown. The RSTE finding of the causal relationship between AA and TNF α /CCL2 is an attempt to decipher the causality between them. Consequently, using a priori biological knowledge, we defined the branch-specific cybernetic goals for PR and LT as maximizing the production rate of TNF α and CCL2, respectively. The success of the model confirms that the cell likely regulates the synthesis and activity of the enzymes associated with the formation of PRs and LTs.
This study enhances our understanding of the dynamics of the relevant enzymes. The cybernetic model also predicts the enzyme (protein) levels required for the reaction to take place, while not requiring explicit enzyme measurements for modeling (Figure 4). Previous studies incorporated the enzyme dynamics using the transcriptomic experimental data given that the proteomic data is not available [19,38,41,77]. However, the enzyme transcriptomic data may not be reasonable for studying the metabolite dynamics as it lacks translational and post-translational information. Moreover, the lipidomic measurements for metabolites signify their formation as a result of the transcriptomic, translational, and post-translational modifications, thus, necessitating the inclusion of the proteomic enzyme information. The advantage of the cybernetic framework is that it predicts the proteomic enzyme concentration while not requiring explicit enzyme measurements for modeling.
We used the methods developed to infer that eicosanoid overproduction can lead to cytokine/chemokine flareup. The weights for PRs ( w P R i ) and LTs ( w L T i ) branches, calculated using mutual information, confirm the presence of statistical interactions between them. Although we cannot derive the positive/negative nature of correlation using mutual information, we use existing biological knowledge and infer that the correlation is positive because the eicosanoids (PRs and LTs) and signaling molecules (TNF α and CCL2) are pro-inflammatory in nature [42,43,44]. The weights and positive relationship suggest that increased levels of PRs and LTs can correspond to elevated levels of TNF α and CCL2. Further, the causal relationship signifies that the elevated AA secretion is likely the cause of an increase in CCL2/TNF α production. Based on these heuristic arguments, we support the possibility of cytokine imbalance and eicosanoid imbalance being linked [1,6]. It is important to note that we cannot predict the change in cytokine levels due to AA dysregulation because the mutual information I T ( X t ; Y t ) can only quantify interactions between AA and CCL2/TNF α ; it cannot forecast the CCL2/TNF α dynamics due to AA dysregulation.
The weights and the dynamics of the cybernetic control variables can be utilized to infer the dominant metabolite in COX and LOX branches. The weights, w P R i and w L T i , in the formulation relate the signaling molecules TNF α , CCL2 with metabolites PRs, LTs, respectively. The w P R i and w L T i in the formulation quantify the shared statistical linear and non-linear relationship between a metabolite PR/LT and TNF α /CCL2. Their values signify that interaction is highest between the pairs LTB4 and CCL2, and PGF2a and TNF α . However, the u L T i ,   u P R i and v L T i ,   v P R i plots show that LTB4 (Figure 5A,B) and PGD2 (Figure 5C,D) are the dominant metabolites because u L T i ,   u P R i   and   v L T i ,   v P R i for LTB4 and PGD2 are the highest, respectively. This behavior suggests the central pro-inflammatory role of PGD2, which is a major eicosanoid produced during inflammation [30,78]. The biological role of LTB4 during inflammation predominantly enhances different phagocyte antimicrobial functions in macrophages [30,78]. LTB4 causes neutrophil chemotaxis and adhesion to endothelial cells [30,78]. Additionally, it can cause vascular leakage and play a role in pain, fever, and swelling in acute inflammation. It is important to note that a higher u L T i or u P R i signifies a higher ρ L T i or ρ P R i , which corresponds to a higher flux for the respective metabolites.
The gene knockdown simulations helped further validate the cybernetic framework. Some experimental [75,76] and computational studies [33,40] have focused on the inhibition of the downstream enzymes Ptges and Ltbd4h, the enzymes associated with the production of PGE2 and LTB4, respectively. A few experimental studies confirm the behavior obtained from our simulations: LTB4 diminishes, and HETE5 and HETE15 remain the same, similar to those observed in other studies [75,76]. Moreover, from gene knockdown simulation results, the u L T i and v L T i plots indicate that LTB4 (Figure 7) eventually become the dominant branch despite its reduced levels (Figure 6B) and the elevated 12epi-LTB4 (Figure 6C) and 6t-epi-LTB4 (Figure 6D) concentrations. Hence, the regulation behavior ( u L T i and v L T i , Figure 7) at the later time attains the unperturbed state ( f = 1 ) . However, due to the reduced flux through LTB4, it settles down at a state different from the original f = 1 state (Figure 6B). Similar to the LT branch, the control dynamics ( u P R i and v P R i , Figure 9) towards the end of the experiment for PR eventually attain the undisturbed condition ( f = 1 ).

5. Conclusions

We developed a cybernetic model to study eicosanoid metabolism in the presence of a cytokine TNFα and chemokine CCL2. This state-of-the-art framework integrated mechanistic knowledge, a known biological understanding of signaling pathways, and data-driven methods to study the dynamics of eicosanoid metabolism. The simulated model also predicted an independent experimental condition, indicating that the framework can be applied to unseen datasets with appropriate modifications. The enzyme profile predictions, an output of the cybernetic model, can be compared against the proteomic enzyme measurements. However, the present unavailability of data for comparison calls for a suitably designed experiment in the future. The cybernetic control variables are shown to help understand the regulatory dynamics. From the calculations of RSTE and MI, a biological inference that AA secretion is the cause of TNF α /CCL2 release can be made. Further, we note with interest that AA dysregulation could possibly lead to the known phenomenon of cytokine/chemokine flareup.

Supplementary Materials

The following supporting information can be downloaded at: https://www.mdpi.com/article/10.3390/pr11030874/s1: Table S1: Weights for PRs branch with TNFα and LTs with CCL2; Table S2: RSTE values for AA network and AA, TNFα (and CCL2) combination; Table S3: Calculated kinetic parameters for the COX pathway; Table S4: Model Accuracy for the formulated cybernetic goal; Text S1: Materials and Methods; Text S1.1: PRs branch; Text S1.2. LTs branch; Text S2. RSTE; Text S3. Development of Mutual information formulation for time series; Text S4. F-test calculation.

Author Contributions

Conceptualization, L.A., S.K., M.H., R.R., S.G., M.R.M., A.G., S.S. and D.R.; Methodology, L.A., S.K., M.H., R.R., S.G., M.R.M., S.S. and D.R.; Validation, L.A., S.K., M.H. and R.R.; Formal analysis, L.A., S.K., M.H. and R.R.; Investigation, L.A., S.K., M.H., R.R., S.G. and M.R.M.; Data curation, L.A., S.G. and M.R.M.; Writing—original draft, L.A. and S.K.; Writing—review & editing, L.A., S.K., M.H., R.R., S.G., M.R.M., A.G., S.S. and D.R.; Visualization, L.A., A.G., S.S. and D.R.; Supervision, S.G., M.R.M., A.G., S.S. and D.R.; Funding acquisition, A.G., S.S. and D.R. All authors have read and agreed to the published version of the manuscript.

Funding

This work was supported by NIH grants, R01 LM012595 (S.S.), OT2 OD030544 (S.S.), R01 HL106579 (S.S.), R01 HL108735 (S.S.), U2C DK119886 (S.S.), the Joan and Irwin Jacobs endowed professorship (S.S.), Center for Science of Information (CSoI), a National Science Foundation Science and Technology Center, under grant agreement CCF-0939370 (S.S. and D.R.) and the Harry Creighton Peffer endowed professorship (D.R.).

Institutional Review Board Statement

Not applicable.

Informed Consent Statement

Not applicable.

Data Availability Statement

The lipidomic data used in this work is available at https://www.lipidmaps.org/data/results/primarymacrophage/atp/index.html, accessed on 1 December 2022. The transcriptomic data is available at https://www.lipidmaps.org/data/results/BMDM/agilent_ATP_ratio.html, accessed on 1 December 2022.

Conflicts of Interest

The authors declare no conflict of interest.

References

  1. Dennis, E.; Norris, P. Eicosanoid storm in infection and inflammation. Nat. Rev. Immunol. 2015, 15, 511–523. [Google Scholar] [CrossRef] [Green Version]
  2. Hammock, B.D.; Wang, W.; Gilligan, M.M.; Panigrahy, D. Eicosanoids: The Overlooked Storm in Coronavirus Disease 2019 (COVID-19)? Am. J. Pathol. 2020, 190, 1782–1788. [Google Scholar] [CrossRef]
  3. Hojyo, S.; Uchida, M.; Tanaka, K.; Hasebe, R.; Tanaka, Y.; Murakami, M.; Hirano, T. How COVID-19 induces cytokine storm with high mortality, Inflamm. Regen 2020, 40, 37. [Google Scholar] [CrossRef]
  4. Tisoncik, J.R.; Korth, M.J.; Simmons, C.P.; Farrar, J.; Martin, T.R.; Katze, M.G. Into the Eye of the Cytokine Storm. Microbiol. Mol. Biol. Rev. 2012, 76, 16–32. [Google Scholar] [CrossRef] [Green Version]
  5. Morgulchik, N.; Athanasopoulou, F.; Chu, E.; Lam, Y.; Kamaly, N. Potential therapeutic approaches for targeted inhibition of inflammatory cytokines following COVID-19 infection-induced cytokine storm. Interface Focus 2021, 12, 20210006. [Google Scholar] [CrossRef] [PubMed]
  6. Du, P.; Wang, G.Y.; Zhao, R.; An, Z.L.; Liu, L.H. Eicosanoid Metabolomic Profile of Remdesivir Treatment in Rat Plasma by High-Performance Liquid Chromatography Mass Spectrometry. Front. Pharmacol. 2021, 12, 747450. [Google Scholar] [CrossRef]
  7. Yiu, H.H.; Graham, A.L.; Stengel, R.F. Dynamics of a Cytokine Storm. PLoS ONE 2012, 7, e45027. [Google Scholar] [CrossRef]
  8. Blaho, V.A.; Buczynski, M.W.; Brown, C.R.; Dennis, E.A. Lipidomic analysis of dynamic eicosanoid responses during the induction and resolution of lyme arthritis. J. Biol. Chem. 2009, 284, 21599–21612. [Google Scholar] [CrossRef] [Green Version]
  9. Young, J.D.; Ramkrishna, D. On the Matching and Proportional Laws of Cybernetic Models. Biotechnol. Prog. 2007, 23, 83–99. [Google Scholar] [CrossRef] [PubMed]
  10. Song, D.R.H.-S. Dynamic Models of Metabolism: Review of the Cybernetic Approach Doraiswami. AIChE J. 2012, 59, 215–228. [Google Scholar] [CrossRef]
  11. Ramkrishna, D.; Song, H.-S. Cybernetic Modeling for Bioreaction Engineering; Cambridge University Press: New York, NY, USA, 2018. [Google Scholar] [CrossRef] [Green Version]
  12. Aboulmouna, L.; Raja, R.; Khanum, S.; Gupta, S.; Maurya, M.R.; Grama, A.; Subramaniam, S.; Ramkrishna, D. Cybernetic modeling of biological processes in mammalian systems. Curr. Opin. Chem. Eng. 2020, 30, 120–127. [Google Scholar] [CrossRef]
  13. Baral, S.; Raja, R.; Sen, P.; Dixit, N.M. Towards multiscale modeling of the CD8+ T cell response to viral infections, Wiley Interdiscip. Rev. Syst. Biol. Med. 2019, 11, e1446. [Google Scholar] [CrossRef] [Green Version]
  14. Yizhak, K.; Chaneton, B.; Gottlieb, E.; Ruppin, E. Modeling cancer metabolism on a genome scale. Mol. Syst. Biol. 2015, 11, 817. [Google Scholar] [CrossRef]
  15. Orth, J.D.; Thiele, I.; Palsson, B.O. What is flux balance analysis? Nature Biotechnology: Nature Publishing Group. Nat. Biotechnol. 2010, 28, 245–248. [Google Scholar] [CrossRef] [PubMed]
  16. Raman, K.; Chandra, N. Flux balance analysis of biological systems: Applications and challenges. Brief. Bioinform. 2009, 10, 435–449. [Google Scholar] [CrossRef]
  17. Bornheimer, S.J.; Maurya, M.R.; Farquhar, M.G.; Subramaniam, S. Computational modeling reveals how interplay between components of a GTPase-cycle module regulates signal transduction. Proc. Natl. Acad. Sci. USA 2004, 101, 15899–15904. [Google Scholar] [CrossRef] [Green Version]
  18. Maurya, M.R.; Subramaniam, S. A kinetic model for calcium dynamics in RAW 264.7 cells: 1. Mechanisms, parameters, and subpopulational variability. Biophys. J. 2007, 93, 709–728. [Google Scholar] [CrossRef] [Green Version]
  19. Gupta, S.; Maurya, M.R.; Stephens, D.L.; Dennis, E.A.; Subramaniam, S. An integrated model of eicosanoid metabolism and signaling based on lipidomics flux analysis. Biophys. J. 2009, 96, 4542–4551. [Google Scholar] [CrossRef] [Green Version]
  20. Hanly, T.J.; Henson, M.A. Dynamic flux balance modeling of microbial co-cultures for efficient batch fermentation of glucose and xylose mixtures. Biotechnol. Bioeng. 2011, 108, 376–385. [Google Scholar] [CrossRef] [Green Version]
  21. Chandrasekaran, S.; Price, N.D. Probabilistic integrative modeling of genome-scale metabolic and regulatory networks in Escherichia coli and Mycobacterium tuberculosis. Proc. Natl. Acad. Sci. USA 2010, 107, 17845–17850. [Google Scholar] [CrossRef] [Green Version]
  22. Schuster, S.; Fell, D.A.; Dandekar, T. A general definition of metabolic pathways useful for systematic organization and analysis of complex metabolic networks. Nat. Biotechnol. 2000, 18, 326–332. [Google Scholar] [CrossRef] [PubMed]
  23. Aboulmouna, L.; Gupta, S.; Maurya, M.R.; DeVilbiss, F.T.; Subramaniam, S.; Ramkrishna, D. A cybernetic approach to modeling lipid metabolism in mammalian cells. Processes 2018, 6, 126. [Google Scholar] [CrossRef] [Green Version]
  24. Ramakrishna, R.; Ramakrishna, D.; Konopka, A.E. Cybernetic modeling of growth in mixed, substitutable substrate environments: Preferential and simultaneous utilization. Biotechnol. Bioeng. 1996, 52, 141–151. [Google Scholar] [CrossRef]
  25. Varner, J.D. Large-scale prediction of phenotype: Concept. Biotechnol. Bioeng. 2000, 69, 664–678. [Google Scholar] [CrossRef]
  26. Varner, J.; Ramkrishna, D. Metabolic Engineering from a Cybernetic Perspective: Aspartate Family of Amino Acids. Metab. Eng. 1999, 1, 88–116. [Google Scholar] [CrossRef] [Green Version]
  27. Song, H.S.; Ramkrishna, D. Prediction of dynamic behavior of mutant strains from limited wild-type data. Metab. Eng. 2012, 14, 69–80. [Google Scholar] [CrossRef]
  28. Song, H.S.; Ramkrishna, D. Cybernetic models based on lumped elementary modes accurately predict strain-specific metabolic function. Biotechnol. Bioeng. 2011, 108, 127–140. [Google Scholar] [CrossRef]
  29. Snodgrass, R.G.; Brüne, B. Regulation and Functions of 15-Lipoxygenases in Human Macrophages. Front. Pharmacol. 2019, 10, 719. [Google Scholar] [CrossRef] [Green Version]
  30. Hanna, V.S.; Hafez, E.A.A. Synopsis of arachidonic acid metabolism: A review. J. Adv. Res. 2018, 11, 23–32. [Google Scholar] [CrossRef]
  31. Bennett, M.; Gilroy, D.W. Lipid Mediators in Inflammation. ASM J. 2016, 4, 1–21. [Google Scholar] [CrossRef]
  32. Werner, M.; Jordan, P.M.; Romp, E.; Czapka, A.; Rao, Z.; Kretzer, C.; Koeberle, A.; Garscha, U.; Pace, S.; Claesson, H.E.; et al. Targeting biosynthetic networks of the proinflammatory and proresolving lipid metabolome. FASEB J. 2019, 33, 6140–6153. [Google Scholar] [CrossRef]
  33. Meng, H.; Liu, Y.; Lai, L. Diverse Ways of Perturbing the Human Arachidonic Acid Metabolic Network to Control Inflammation. Acc. Chem. Res. 2015, 48, 2242–2250. [Google Scholar] [CrossRef] [PubMed]
  34. Wang, T.; Fu, X.; Chen, Q.; Patra, J.K.; Wang, D.; Wang, Z.; Gai, Z. Arachidonic acid metabolism and kidney inflammation. Int. J. Mol. Sci. 2019, 20, 3683. [Google Scholar] [CrossRef] [Green Version]
  35. O’Donnell, V.B.; Rossjohn, J.; Wakelam, M.J.O. Phospholipid signaling in innate immune cells. J. Clin. Investig. 2018, 128, 2670–2679. [Google Scholar] [CrossRef] [PubMed]
  36. Sala, A.; Proschak, E.; Steinhilber, D.; Rovati, G.E. Two-pronged approach to anti-inflammatory therapy through the modulation of the arachidonic acid cascade. Biochem. Pharmacol. 2018, 158, 161–173. [Google Scholar] [CrossRef] [PubMed]
  37. Chen, L.; Deng, H.; Cui, H.; Fang, J.; Zuo, Z.; Deng, J.; Li, Y.; Wang, X.; Zhao, L. Inflammatory responses and inflammation-associated diseases in organs. Oncotarget 2018, 9, 7204–7218. [Google Scholar] [CrossRef] [PubMed] [Green Version]
  38. Kihara, Y.; Gupta, S.; Maurya, M.R.; Armando, A.; Shah, I.; Quehenberger, O.; Glass, C.K.; Dennis, E.A.; Subramaniam, S. Modeling of eicosanoid fluxes reveals functional coupling between cyclooxygenases and terminal synthases. Biophys. J. 2014, 106, 966–975. [Google Scholar] [CrossRef] [Green Version]
  39. Gupta, S.; Kihara, Y.; Maurya, M.R.; Norris, P.C.; Dennis, E.A.; Subramaniam, S. Computational Modeling of Competitive Metabolism between ω3- and ω6-Polyunsaturated Fatty Acids in Inflammatory Macrophages. J. Phys. Chem. B 2016, 120, 8346–8353. [Google Scholar] [CrossRef] [Green Version]
  40. Yang, W.; Wang, X.; Li, K.; Liu, Y.; Liu, Y.; Wang, R.; Li, H. Pharmacodynamics simulation of HOEC by a computational model of arachidonic acid metabolic network. Quant. Biol. 2019, 7, 30–41. [Google Scholar] [CrossRef] [Green Version]
  41. Yang, K.; Ma, W.; Liang, H.; Ouyang, Q.; Tang, C.; Lai, L. Dynamic simulations on the arachidonic acid metabolic network. PLoS Comput. Biol. 2007, 3, 0523–0530. [Google Scholar] [CrossRef] [Green Version]
  42. Suzuki, T.; Hide, I.; Ido, K.; Kohsaka, S.; Inoue, K.; Nakata, Y. Production and Release of Neuroprotective Tumor Necrosis Factor by P2X 7 Receptor-Activated Microglia. J. Neurosci. 2004, 24, 1–7. [Google Scholar] [CrossRef] [PubMed] [Green Version]
  43. Van Der Bruggen, T.; Nijenhuis, S.; Van, E.; Verhoef, J.; Van Asbeck, B.S. Lipopolysaccharide-Induced Tumor Necrosis Factor Alpha Production by Human Monocytes Involves the Raf-1/MEK1-MEK2/ERK1-ERK2 Pathway. Infect. Immun. 1999, 67, 3824–3829. [Google Scholar] [CrossRef] [PubMed] [Green Version]
  44. Shin, K.; Hwang, J.J.; Kwon, B.I.; Kheradmand, F.; Corry, D.B.; Lee, S.H. Leukotriene enhanced allergic lung inflammation through induction of chemokine production. Clin. Exp. Med. 2015, 15, 233–244. [Google Scholar] [CrossRef] [PubMed]
  45. Fahy, E.; Subramaniam, S.; Murphy, R.C.; Nishijima, M.; Raetz, C.R.H.; Shimizu, T.; Spener, F.; Van Meer, G.; Wakelam, M.J.O.; Dennis, E.A. Update of the LIPID MAPS comprehensive classification system for lipids. J. Lipid Res. 2009, 50, 9–14. [Google Scholar] [CrossRef] [PubMed] [Green Version]
  46. Sud, M.; Fahy, E.; Cotter, D.; Brown, A.; Dennis, E.A.; Glass, C.K.; Merrill, A.H.; Murphy, R.C.; Raetz, C.R.H.; Russell, D.W.; et al. LMSD: LIPID MAPS structure database. Nucleic Acids Res. 2007, 35, 527–532. [Google Scholar] [CrossRef] [Green Version]
  47. Sud, M.; Fahy, E.; Cotter, D.; Dennis, E.A.; Subramaniam, S. LIPID MAPS-nature lipidomics gateway: An online resource for students and educators interested in lipids. J. Chem. Educ. 2012, 89, 291–292. [Google Scholar] [CrossRef] [Green Version]
  48. Gupta, S.; Maurya, M.R.; Merrill, A.H.; Glass, C.K.; Subramaniam, S.; Merrill, A.H., Jr.; Glass, C.K.; Subramaniam, S. Integration of lipidomics and transcriptomics data towards a systems biology model of sphingolipid metabolism. BMC Syst. Biol. 2011, 5, 26. [Google Scholar] [CrossRef] [Green Version]
  49. Chandrasekharan, N.V.; Dai, H.; Roos, K.L.T.; Evanson, N.K.; Tomsik, J.; Elton, T.S.; Simmons, D.L. COX-3, a cyclooxygenase-1 variant inhibited by acetaminophen and other analgesic/antipyretic drugs: Cloning, structure, and expression. Proc. Natl. Acad. Sci. USA 2002, 99, 13926–13931. [Google Scholar] [CrossRef] [Green Version]
  50. Straight, J.V.; Ramkrishna, D. Cybernetic Modeling and Regulation of Metabolic Pathways. Growth on Complementary Nutrients. Biotechnol. Prog. 1994, 10, 574–587. [Google Scholar] [CrossRef]
  51. Papana, A.; Kyrtsou, C.; Kugiumtzis, D.; Diks, C. Detecting Causality in Non-stationary Time Series Using Partial Symbolic Transfer Entropy: Evidence in Financial Data. Comput. Econ. 2016, 47, 341–365. [Google Scholar] [CrossRef]
  52. Ursino, M.; Ricci, G.; Magosso, E. Transfer Entropy as a Measure of Brain Connectivity: A Critical Analysis with the Help of Neural Mass Models. Front. Comput. Neurosci. 2020, 14, 45. [Google Scholar] [CrossRef]
  53. McBride, J.; Zhao, X.; Munro, N.; Jicha, G.; Smith, C.; Jiang, Y. Discrimination of mild cognitive impairment and alzheimer’s disease using transfer entropy measures of scalp EEG. J. Healthc. Eng. 2015, 6, 55–70. [Google Scholar] [CrossRef]
  54. Zhu, R.; Hochstetter, J.; Loeffler, A.; Diaz-Alvarez, A.; Nakayama, T.; Lizier, J.T.; Kuncic, Z. Information dynamics in neuromorphic nanowire networks. Sci. Rep. 2021, 11, 13047. [Google Scholar] [CrossRef] [PubMed]
  55. Marschinski, R.; Kantz, H. Analysing the information flow between financial time series. Eur. Phys. J. B 2002, 30, 275–281. [Google Scholar] [CrossRef]
  56. Jizba, P.; Lavička, H.; Tabachová, Z. Rényi Transfer Entropy Estimators for Financial Time Series. In Proceedings of the 7th International Conference on Time Series and Forecasting, Gran Canaria, Spain, 19–21 July 2021; Volume 33. [Google Scholar] [CrossRef]
  57. Jizba, P.; Kleinert, H.; Shefaat, M. Rnyi’s information transfer between financial time series. Phys. A Stat. Mech. Its Appl. 2012, 391, 2971–2989. [Google Scholar] [CrossRef] [Green Version]
  58. Yang, P.; Shang, P.; Lin, A. Financial time series analysis based on effective phase transfer entropy. Phys. A Stat. Mech. Its Appl. 2017, 468, 398–408. [Google Scholar] [CrossRef]
  59. Teng, Y.; Shang, P. Transfer entropy coefficient: Quantifying level of information flow between financial time series. Phys. A Stat. Mech. Its Appl. 2017, 469, 60–70. [Google Scholar] [CrossRef]
  60. Mao, X.; Shang, P. Transfer entropy between multivariate time series, Commun. Nonlinear Sci. Numer. Simul. 2017, 47, 338–347. [Google Scholar] [CrossRef]
  61. Kim, J.; Jakobsen, S.T.; Natarajan, K.N.; Won, K.J. TENET: Gene network reconstruction using transfer entropy reveals key regulatory factors from single cell transcriptomic data. Nucleic Acids Res. 2021, 49, e1. [Google Scholar] [CrossRef]
  62. Castro, J.C.; Valdés, I.; Gonzalez-García, L.N.; Danies, G.; Cañas, S.; Winck, F.V.; Ñústez, C.E.; Restrepo, S.; Riaño-Pachón, D.M. Gene regulatory networks on transfer entropy (GRNTE): A novel approach to reconstruct gene regulatory interactions applied to a case study for the plant pathogen Phytophthora infestans. Theor. Biol. Med. Model. 2019, 16, 7. [Google Scholar] [CrossRef] [Green Version]
  63. Staniek, M.; Lehnertz, K. Symbolic transfer entropy. Phys. Rev. Lett. 2008, 100, 158101. [Google Scholar] [CrossRef] [PubMed]
  64. Bandt, C.; Pompe, B. Permutation Entropy: A Natural Complexity Measure for Time Series. Phys. Rev. Lett. 2002, 88, 4. [Google Scholar] [CrossRef] [PubMed]
  65. Kraskov, A.; Stögbauer, H.; Grassberger, P. Estimating mutual information, Phys. Rev. E-Stat. Physics, Plasmas, Fluids. Relat. Interdiscip. Top. 2004, 69, 16. [Google Scholar] [CrossRef] [Green Version]
  66. Kvålseth, T. On Normalized Mutual Information: Measure Derivations and Properties. Entropy 2017, 19, 631. [Google Scholar] [CrossRef] [Green Version]
  67. Shannon, C.E. A Mathematical Theory of Communication. Bell Syst. Technol. J. 1948, 27, 623–656. [Google Scholar] [CrossRef]
  68. Reshef, D.; Reshef, Y.; Finucane, H.; Grossman, S.; Mcvean, G.; Turnbaugh, P.; Lander, E.; Mitzenmacher, M.; Sabeti, P. Detecting Novel Associations in Large Data Sets. Sci. Transl. Med. 2011, 334, 1518–1524. [Google Scholar] [CrossRef] [Green Version]
  69. de Siqueira Santos, S.; Takahashi, D.; Nakata, A.; Fujita, A. A comparative study of statistical methods used to identify dependencies between gene expression signals. Brief. Bioinform. 2013, 15, 906–918. [Google Scholar] [CrossRef] [Green Version]
  70. Numata, J.; Ebenhöh, O.; Knapp, E.-W. Measuring Correlations in Metabolic Networks with Mutual Information. Angew. Chemie Int. Ed. 2008, 20, 112–122. [Google Scholar]
  71. Batina, L.; Gierlichs, B.; Prouff, E.; Rivain, M.; Standaert, F.X.; Veyrat-Charvillon, N. Mutual information analysis: A comprehensive study. J. Cryptol. 2011, 24, 269–291. [Google Scholar] [CrossRef] [Green Version]
  72. Galka, A.; Ozaki, T.; Bayard, J.B.; Yamashita, O. Whitening as a tool for estimating mutual information in spatiotemporal data sets. J. Stat. Phys. 2006, 124, 1275–1315. [Google Scholar] [CrossRef]
  73. Kigozi, R.; Zinszer, K.; Mpimbaza, A.; Sserwanga, A.; Kigozi, S.; Kamya, M. Assessing temporal associations between environmental factors and malaria morbidity at varying transmission settings in Uganda. Malar. J. 2016, 15, 4–9. [Google Scholar] [CrossRef] [PubMed] [Green Version]
  74. Bell, W.; Brockwell, P.J.; Davis, R.A. Time Series: Theory and Methods; Springer Press: New York, NY, USA, 1989. [Google Scholar] [CrossRef]
  75. He, C.; Wu, Y.; Lai, Y.; Cai, Z.; Liu, Y.; Lai, L. Dynamic eicosanoid responses upon different inhibitor and combination treatments on the arachidonic acid metabolic network. Mol. Biosyst. 2012, 8, 1585–1594. [Google Scholar] [CrossRef] [PubMed]
  76. Mazaleuskaya, L.L.; Lawson, J.A.; Li, X.; Grant, G.; Mesaros, C.; Grosser, T.; Blair, I.A.; Ricciotti, E.; FitzGerald, G.A. A broad-spectrum lipidomics screen of antiinflammatory drug combinations in human blood. JCI Insight. 2016, 1, e87031. [Google Scholar] [CrossRef] [PubMed] [Green Version]
  77. Yang, K.; Bai, H.; Ouyang, Q.; Lai, L.; Tang, C. Finding multiple target optimal intervention in disease-related molecular network. Mol. Syst. Biol. 2008, 4, 228. [Google Scholar] [CrossRef]
  78. CBuckley, D.; Gilroy, D.W.; Serhan, C.N. Proresolving lipid mediators and mechanisms in the resolution of acute inflammation. Immunity 2014, 40, 315–327. [Google Scholar] [CrossRef] [Green Version]
Figure 1. The arachidonic acid (AA) metabolic pathway map for the breakdown of arachidonic acid into respective products prostanoid and leukotriene via prostaglandin H2 (PGH2) and leukotriene A4 (LTA4) is shown: (green) enzymes, (ellipses) lipid metabolites, (shaded) measured metabolites, (blue arrows) enzymatic and (black arrows) non-enzymatic reactions. The Hydroxyeicosatetraenoic acid (HETE) metabolites 5-HETE and 15-HETE are also formed from AA.
Processes 11 00874 g001
Figure 3. The plot represents the concentration of metabolites belonging to COX (AH) and LOX (IN) branches obtained by simulating the cybernetic model. The computational simulation of the eicosanoid profile is generated in three different treatment conditions (CTRL, ATP, and KLA) and used to predict a fourth independent data set (KLA+ATP). The mean experimental data (circles) with associated standard error of the mean (SEM) from three replicate experiments (n = 3) for the control (red), ATP (green), KLA (blue), and KLA+ATP (magenta) cases are taken from the mass spectrometry measurements of lipids. The simulation results are shown for the control case (solid red) and treatment (solid green and blue), along with the prediction curve (magenta dashed) for the combined KLA+ATP condition.
Processes 11 00874 g003
Figure 4. Scaled enzyme profiles predicted for ATP stimulated experiment. The substrate profile governs the enzyme dynamics, which follows Michaelis-Menten kinetics (second term in Equation (7)). The COX (A) enzyme peaks within 8 h due to a peak in its corresponding substrate AA level. Similarly, the enzymes ePGD2 (B), ePGE2 (C), ePGF2a (D), and eTXB2 (E) follow the dynamics of their substrate PGH2. The LOX (FH) branch enzyme profiles follow the same reasoning as that of the COX branch enzymes.
Processes 11 00874 g004
Figure 5. Profiles for the cybernetic control variables for PRs— u P R i (A) and v P R i (B), and LTs— u L T i (C) and v L T i (D) for the ATP-stimulation experiment. For the PRs, cybernetics is applied at the substrate PGH2, which is converted to the products PGD2, PGE2, PGF2a, and TxB2. For the LTs, cybernetics is applied at the substrate LTA4, which is converted to LTB4, 12epi-LTB4, and 6trans-12epi-LTB4 metabolites. A higher u P R i ,   u L T i corresponds to a higher v P R i ,   v L T i . This similarity in trends is because both control variables are directly proportional to the ρ P R i   ,   ρ L T i and differ by the normalization factors (Equation (16)). We show that PGD2 (A,B) and LTB4 (C,D) are the dominant branches that require the maximum number of resources for the reactions to occur under the inflammatory response of the body, which aligns with the biological information.
Processes 11 00874 g005
Figure 6. Gene knockdown perturbation profiles for LTs branch for metabolites and intermediates (AD) and scaled enzymes (EG). A simulated enzyme perturbation to the LTB4 branch of the network alters the Ltbd4h (eLTB4) enzyme levels. A lower f value corresponds to a decrease in the constitutive and inducible enzyme synthesis rates of Ltbd4h. We observed the lower concentrations of eLTB4 as f decreases, as expected (E). The elevated LTA4 levels (A) in response to lower fractional enzyme level f are due to decreased flux from LTA4 to LTB4 and the subsequent accumulation of LTA4 prior to generating enough enzymes for the remaining metabolic products in the branch. LTB4 levels reduced (B), and the increase in LTA4 led to increased fluxes and increased concentrations of 12epi-LTB4 and 6t-epi-LTB4 (C,D) to balance the no-change in influx from AA to LTA4. We observe a slight increase in enzyme levels for the other metabolites (e-12epi-LTB4 (F), e-6t-epi-LTB4 (G)) because of increased substrate LTA4 levels.
Processes 11 00874 g006
Figure 7. Gene knockdown perturbation profiles for LTs branch for cybernetic control variable u L T i (AC) cybernetic control variable v L T i (DF). For LTB4, its associated cybernetic variables u -eLTB4 (A) and v -eLTB4 (D) decrease initially because of the downregulation of its flux due to decreased scaled-enzyme Ltbd4h (eLTB4). The enzyme synthesis variables u -e12-epi-LTB4 (B) and u -6t-epi-LTB4 (C), however, increase in response because the u L T i for all the LTs metabolites in the branch (LTB4, 12epi-LTB4, and 6t-epi-LTB4) sum to 1. The increased flux of 12epi-LTB4 and 6t-epi-LTB4 also results in an increase in v -e12-epi-LTB4 (E) and v -6t-epi-LTB4 (F) initially.
Processes 11 00874 g007
Figure 8. Gene knockdown perturbation profiles for PRs branch for measured metabolites and intermediates (AH) and enzymes (IL). A simulated enzyme perturbation to the PGE2 branch of the network alters the Ptges (ePGE2) enzyme levels. A lower f value corresponds to a decrease in the constitutive and inducible enzyme synthesis rates of ePGE2 (J), and it reduces the flux of PGE2. The fluxes of PGD2, PGF2a, and TxB2 increase because the flux inflow from AA to PGH2 is unchanged. We observed the lower concentrations of PGE2 (C) and higher levels of PGD2 (B), PGF2a (D), and TxB2 (E) as f decreases, as expected. The decreased PGH2 level (A) in response to lower f is because of the increased PGD2 flux, which is the dominant metabolite. Additionally, the increased flux of PGD2 leads to an increase in the concentration of downstream PGD2 products: dPGD2 (F), PGJ2 (G), and dPGJ2 (H). We observe a slight increase in enzyme levels for the other metabolites (ePGD2 (I), ePGF2a (K), eTxB2 (L)) because of increased corresponding metabolite levels.
Processes 11 00874 g008
Figure 9. Gene knockdown perturbation profiles for PRs branch for cybernetic control variable u P R i (AD) and cybernetic control variable v P R i (EH). For PGE2, its associated cybernetic variables u -PGE2 (B) and v -PGE2 (F) decrease initially because of the downregulation of its flux due to decreased scaled-enzyme Ptges (ePGE2). The enzyme synthesis variables u PGD2 (A), u PGF2a (C), and u TxB2 (D) increase because the u P R i for all the PGs metabolites in the branch (PGD2, PGE2, PGF2a, and TxB2) sum to 1. The increased flux of PGD2, PGF2a, and TxB2 also results in an increase in v PGD2 (E), v PGF2a (G), and v TxB2 (H).
Processes 11 00874 g009
Disclaimer/Publisher’s Note: The statements, opinions and data contained in all publications are solely those of the individual author(s) and contributor(s) and not of MDPI and/or the editor(s). MDPI and/or the editor(s) disclaim responsibility for any injury to people or property resulting from any ideas, methods, instructions or products referred to in the content.

