Article

Scalable mRNA Machine for Regulatory Approval of Variable Scale between 1000 Clinical Doses to 10 Million Manufacturing Scale Doses

Institute for Separation and Process Technology, Clausthal University of Technology, Leibnizstr. 15, 38678 Clausthal-Zellerfeld, Germany
*
Author to whom correspondence should be addressed.
Processes 2023, 11(3), 745; https://doi.org/10.3390/pr11030745
Submission received: 23 January 2023 / Revised: 22 February 2023 / Accepted: 24 February 2023 / Published: 2 March 2023
(This article belongs to the Special Issue Towards Autonomous Operation of Biologics and Botanicals)

Abstract

:
The production of messenger ribonucleic acid (mRNA) and other biologics is performed primarily in batch mode. This results in larger equipment, cleaning/sterilization volumes, and dead times compared to any continuous approach. Consequently, production throughput is lower and capital costs are relatively high. Switching to continuous production thus reduces the production footprint and also lowers the cost of goods (COG). During process development, from the provision of clinical trial samples to the production plant, different plant sizes are usually required, operating at different operating parameters. To speed up this step, it would be optimal if only one plant with the same equipment and piping could be used for all sizes. In this study, an efficient solution to this old challenge in biologics manufacturing is demonstrated, namely the qualification and validation of a plant setup for clinical trial doses of about 1000 doses and a production scale-up of about 10 million doses. Using the current example of the Comirnaty BNT162b2 mRNA vaccine, the cost-intensive in vitro transcription was first optimized in batch so that a yield of 12 g/L mRNA was achieved, and then successfully transferred to continuous production in the segmented plug flow reactor with subsequent purification using ultra- and diafiltration, which enables the recycling of costly reactants. To realize automated process control as well as real-time product release, the use of appropriate process analytical technology is essential. This will also be used to efficiently capture the product slug so that no product loss occurs and contamination from the fill-up phase is <1%. Further work will focus on real-time release testing during a continuous operating campaign under autonomous operational control. Such efforts will enable direct industrialization in collaboration with appropriate industry partners, their regulatory affairs, and quality assurance. A production scale-operation could be directly supported and managed by data-driven decisions.

1. Introduction

mRNA vaccines against SARS-CoV-2 were approved in 2020 through an accelerated process to limit the pandemic, which had restricted large areas of public life. Since then, several billion doses of the vaccine have been produced [1]. Other therapies based on such new molecular groups are diverse in research. Therefore, it is worth perfecting the manufacturing technology for global supply [2,3,4,5,6,7,8,9].
Manufacturing technologies and the cost of goods (COGs) have already been analyzed [2,3,4,5,10,11,12,13,14]. It is not the capital cost that is the bottleneck, but the trained operators and supply of chemicals, which account for about 80% of the COGs. Recent approaches to minimize the defined bottlenecks in personnel and chemicals are continuous biomanufacturing (CBP) and autonomous operation using digital twins and process analytical technology (PAT) in the context of quality by design (QbD) under regulatory aspects [2,3,5,6,15,16,17,18,19,20,21,22,23]. CBP is required by the U.S. Food and Drug Administration (FDA) [24] and QbD, including PAT towards real-time release testing (RTRT), is a regulation-driven initiative. For these reasons, these approaches would open doors for approval.
Digital twin technology is now well established to the point where experience has shown that validated process models should not only be much faster and more efficient, but also allow accuracy and precision that is not feasible without the large simulation capacity to thoroughly define design and control space, with a few hundred to a thousand data points [3,5,25]. Such product quality and robustness is improved and guaranteed by RTRT [26,27,28].
The missing link in such a manufacturing technology is the regular approval effort for a small-scale facility for clinical or even pre-clinical quantities of about 1000 doses, and then the additional approval of a corresponding scale-up and validation of the manufacturing-scale facility, which typically involves about 10 million doses over a few days. If a solution that would allow the approval and validation for clinical and manufacturing scale-up to be performed in one step at one facility was feasible, the effort and timeframe would be dramatically reduced. Such a task is not straightforward, as a 10,000-fold reduction in volume in a production-scale facility would not even fill the dead volume and therefore would not be worth pursuing in detail. Therefore, the production facility must be as small as possible, which is achieved using a continuous biomanufacturing operation instead of a comparable batch plant for the same amount of product per year. In contrast, a small clinical trial facility could only produce production-scale quantities if it were scaled up, but this would multiply the bottleneck of trained personnel, which is also not a viable path.
The invention of a suitable application of a slug flow for clinical trial volumes in the final production-scale facility is the easiest solution to this challenge. It requires, first, the qualification of a facility and, second, the validation of clinical runs and production-scale runs. This will be described in detail below. The Comirnaty BNT162b2 mRNA vaccine is chosen as a current example to reflect reality.

1.1. State-of-the-Art in Slug Flow Manufacturing

The flow created by the generation of droplets in an immiscible or barely miscible liquid–liquid flow has many synonyms. The most common are plug flow [29], slug flow [30], and segment flow [31]. Various flow manufacturing systems for pharmaceuticals have been described in the literature [32,33]. Mascia et al. [34] describe production with a nominal flow rate of 45 g/h aliskirenhemifumarate. This value can be adjusted between 20 g/h and 100 g/h by changing the flow rate. The main synthesis reactor is a stainless steel tube with an inner diameter of 11.7 mm and a nominal residence time of 4 h. After the reaction, LLE is performed with ethyl acetate. Phase separation is performed by membrane separation (Pall Zelfuor 1 μm). The concentration of the organic product phase is monitored by infrared spectroscopy (IR; Mettler Toledo ReactIR 15).
In Adamo et al. [35], a multipurpose production plant is described that can produce hydrochloride, lidocaine hydrochloride, diazepam, and fluoxetine hydrochloride, among others. The size of the platform plant is 1.0 m (width) × 0.7 m (length) × 1.8 m (height). The main synthesis reactor was a continuous flow tubular reactor with defined volumes (5, 10, 30 mL) made with windings of high purity PFA tubing (1/8″ OD, 1/16″ ID). The slugs are generated by the addition of the organic phase and separated from the aqueous phase either by membranes or by gravity.
The organic phases used in each case are toluene, ethyl acetate, and hexane. Detection in this case is performed with a capacity sensor. The product concentration is monitored by IR (FlowIR Mettler-Toledo).
In Gladius et al. [36], a commercial, low-cost water-soluble tungsten catalyst is combined with Aliquat 336 as a phase transfer agent under solvent-free reaction conditions. The enhanced mass transfer and reduced back-mixing of the biphasic liquid–liquid slug allow selectivity control depending on the physical parameters of the slug, i.e., volumetric phase ratio, volumetric flow rate, and slug length. In Bogdan et al. [37], various flow chemistry productions (e.g., from Pfizer) with and without slug-flow segmentation are shown. In Holbach et al. [38], the continuous microfluidic generation of slugs using injection nozzles and phase separation by a prototype combining stainless steel and PEEK for different wetting behavior is described, as well as phase detection using microscopic image segmentation.
In relation to the scenario considered in this study, the reduction in manufacturing volume can be achieved by sending the small volume of 4 mL at 1000 doses, as opposed to 40 L at 10 million doses, through the system in a batch-by-batch mode as a segmented plug flow injection and cutting the product fraction for the next operation using a PAT strategy. The product fraction is separated with a solvent that is immiscible or only slightly miscible. The solvent should also be biodegradable and harmless to humans and nature. Substances such as silicone oil, perfluoropolyether, and oleic acid can be used [38,39,40,41,42,43].
However, the latter is very reactive; an inert solvent is preferable to avoid interactions with the product phase. For this purpose, oleic acid can be replaced by methyl oleate or ethyl oleate [36,44].

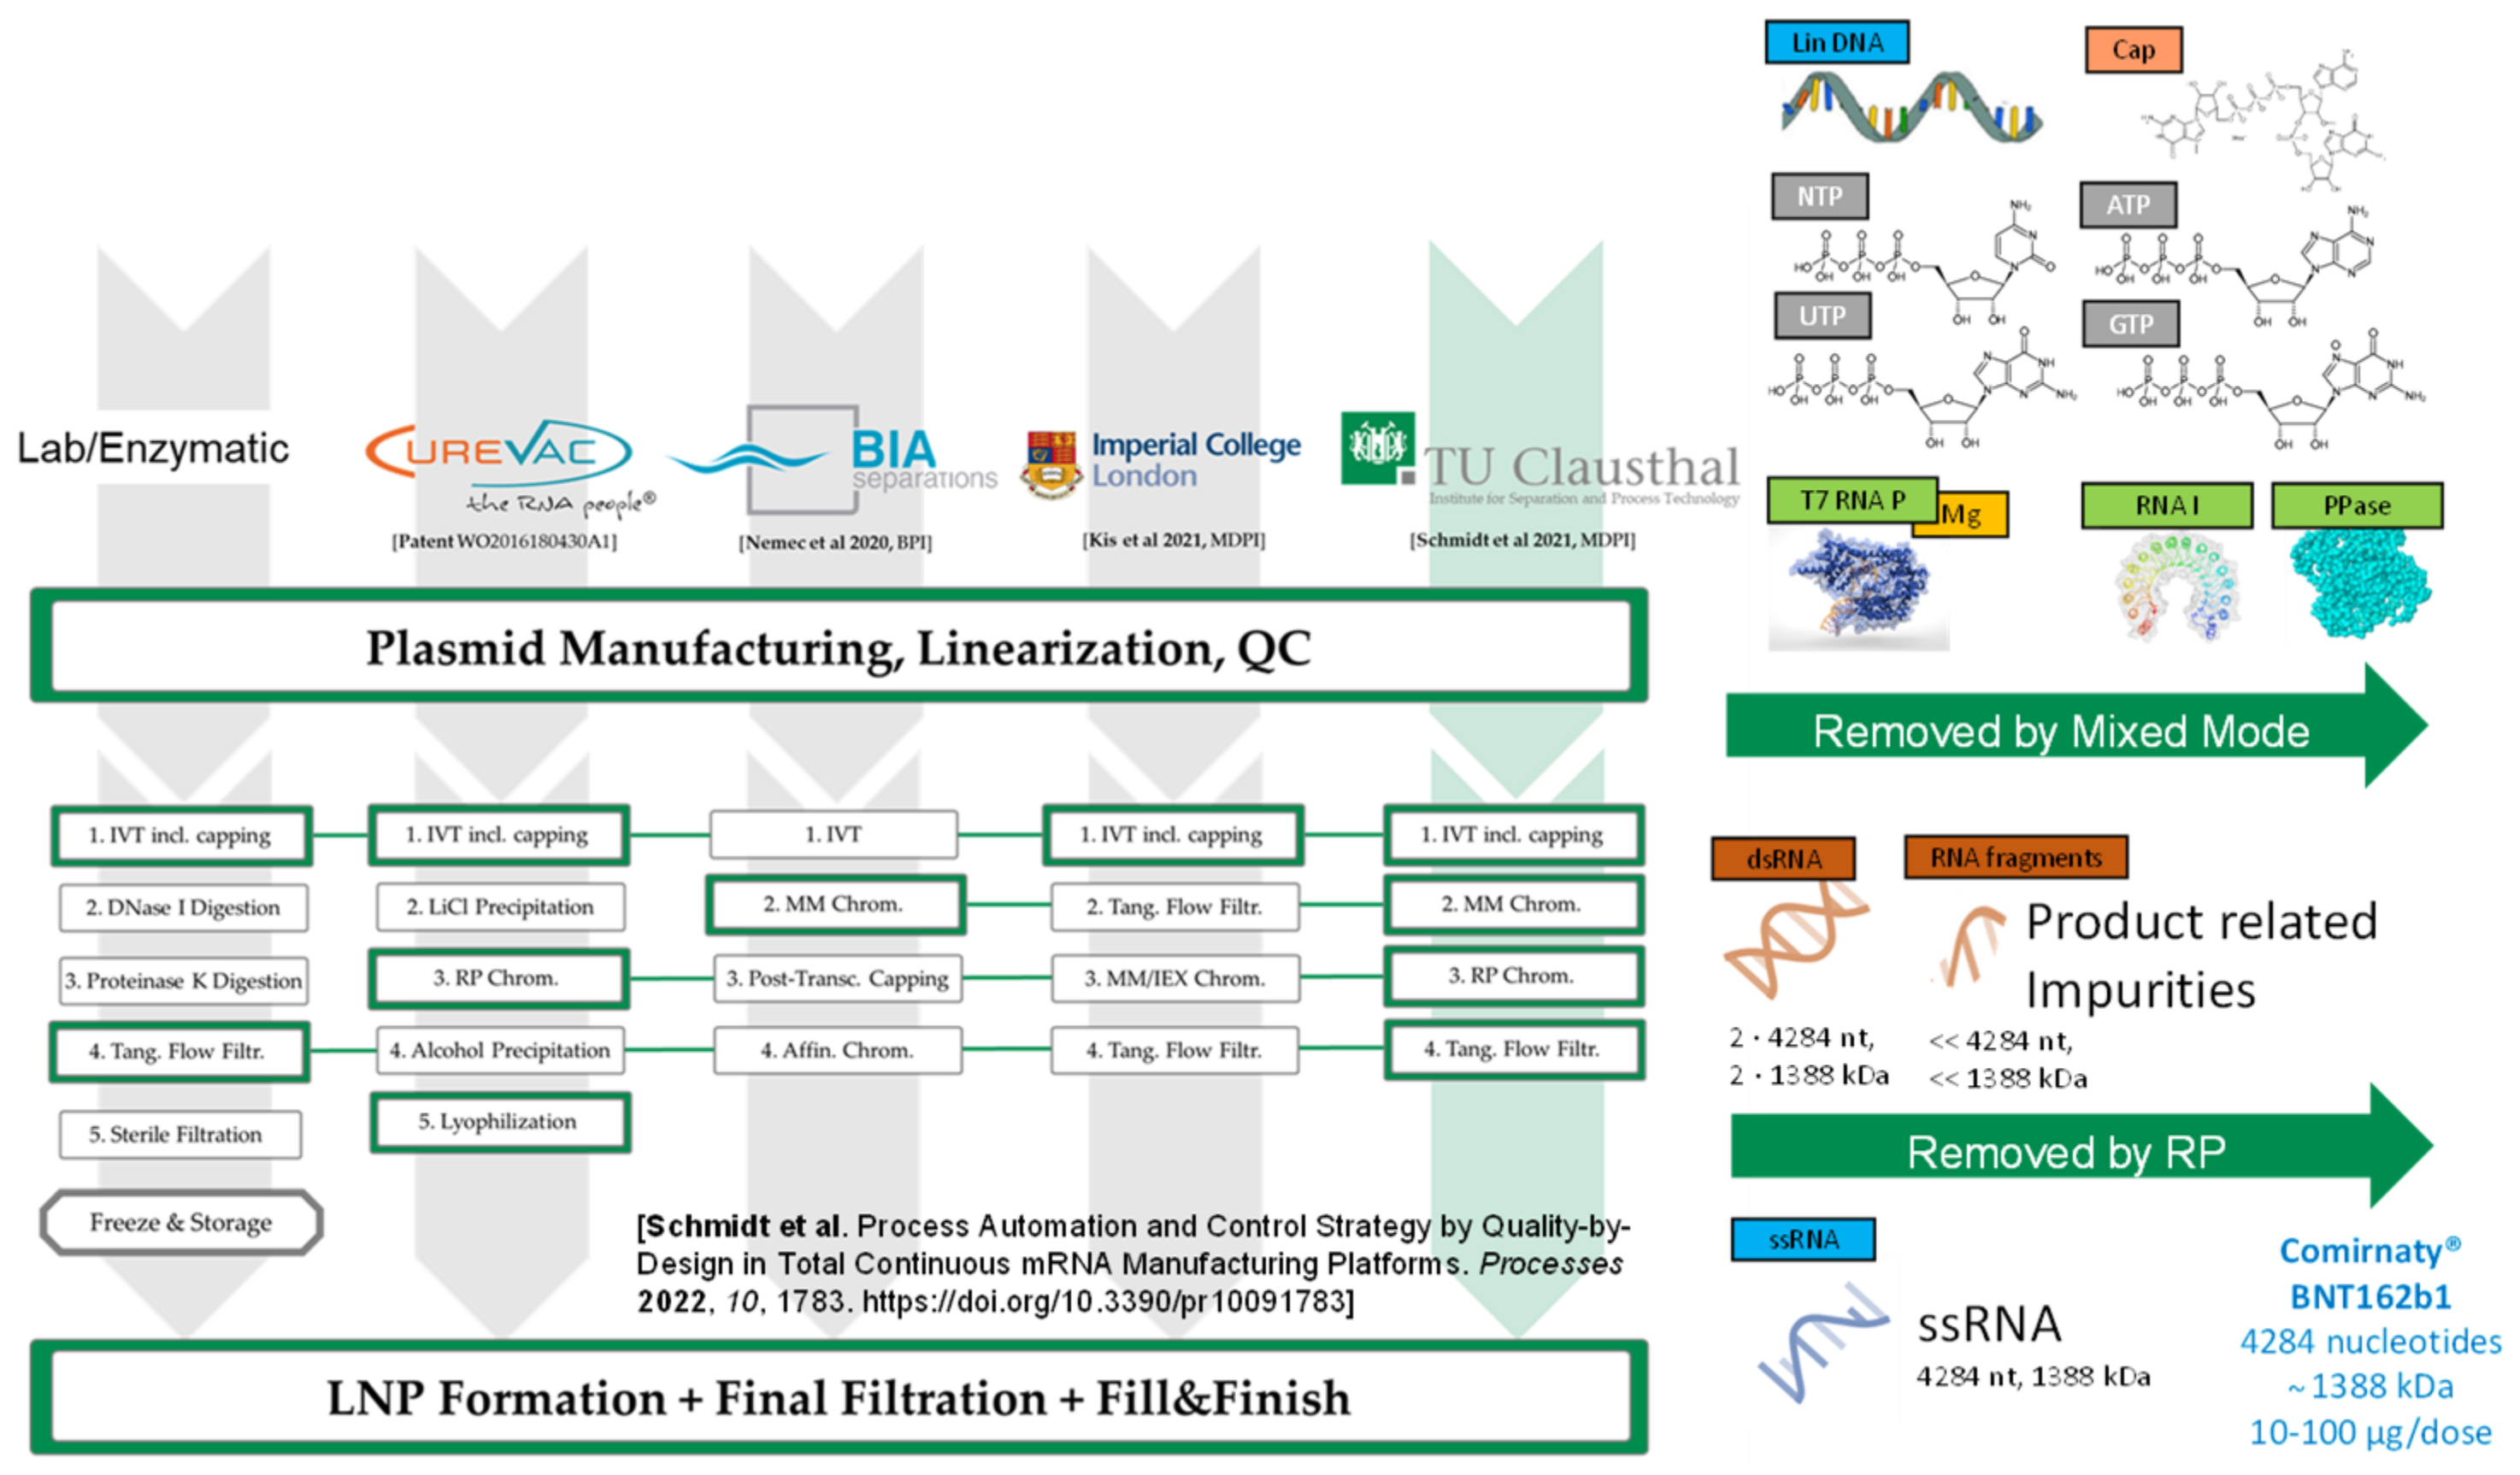
1.2. State-of-the-Art in mRNA Manufacturing

The production process of mRNA starts with the production of a DNA template (deoxyribonucleic acid), which contains the genetic code for the respective protein. The plasmid is usually produced by the fermentation of Escherichia coli (E. coli). After disruption of the cells by alkaline lysis, the pDNA is purified. Finally, the DNA is linearized and serves as a template for in vitro transcription (IVT) [45,46,47].
IVT is an enzymatic reaction for which T7, SP6 or T3 polymerases are typically used as reaction catalysts. The nucleotides (NTPs) ATP, CTP, UTP, and GTP serve as substrates. In addition, magnesium chloride or magnesium acetate is required as a co-factor of the polymerase [48,49]. The following equations depict the reaction scheme of IVT, in which the enzyme used is T7 RNA polymerase [48]. The reaction proceeds from initiation (Equations (1)–(5)), through elongation (Equation (6)) to termination (Equation (13)) of IVT [48,50,51].
Ki describes reversible reactions, whereas irreversible reactions include the rate constants kI, kE, and kT. Initiation is described by the random binding of the first nucleotide GTP and the promoter (D). Initiation is completed by the formation of a reversible enzyme–DNA–RNA complex (E∙D∙Mj). The mRNA is elongated by the addition of a nucleotide to the complex. Upon the irreversible binding of the nucleotide to the mRNA, an inorganic pyrophosphate (PPi) is cleaved [48].
The nucleotides can bind to the free enzyme as well as to the promoter–enzyme complex or transcription complex, resulting in competition and thus competitive inhibition (Equations (7)–(12)). In addition, the pyrophosphate may temporarily bind to the nucleotide binding site of the free enzyme or to the enzyme–DNA–RNA complex [48,52,53]. This leads to a decrease in the transcription rate, which is why pyrophosphatase is usually added to the reaction mixture to degrade the pyrophosphate [49,52]. Once the mRNA has reached its final length, the complex breaks down into the mRNA (Mn), the enzyme, and the template DNA [48].
Initiation:
E   +   GTP   K G I   E   ·   GTP
E   +   D   K D   E   ·   D
E   ·   GTP   +   D   K D   E   ·   GTP   ·   D
E   ·   D   +   GTP K G I   E   ·   D   ·   GTP
E   · D   ·   GTP   k I   E   ·   D   ·   M 1
Elongation:
E   ·   D   ·   M j +   NTP   K NTP   E   ·   D   ·   M j   ·   NTP   K E   E   ·   D   ·   M j + 1 +   PPi
Competitive Inhibition:
E   +   NTP   K I , NTP   E   ·   NTP
E   ·   D   +   NTP   K I , NTP   E   ·   D   ·   NTP
E   +   PPi   K I , PPi   E   ·   PPi
E   ·   D   +   PPi   K I , PPi   E   ·   D   · PPi
E   ·   D   ·   M j +   NTP   K I , NTP   E   ·   D   ·   M j   ·   NTP
E   ·   D   ·   M j +   PPi   K I , PPi   E   ·   D   ·   M j   ·   PPi
Termination:
E   ·   D   ·   M n   kT   E   +   D   +   M n
Capping of the mRNA, which prevents it from being degraded in vivo, can occur either co-transcriptionally during IVT or post-transcriptionally through a second enzymatic reaction. The reaction schemes of the two capping mechanisms are shown in Figure 1. For post-transcriptional capping, the vaccinia capping enzyme is usually used [11,54,55].
Post-transcriptional capping is composed of three reaction steps [56,57,58]. In contrast, co-transcriptional capping occurs during IVT, with the polymerase incorporating the added cap analog to the 5′ end of the mRNA [58,59]. One problem that can occur with this capping mechanism is the incorporation of the cap analog in the reverse orientation so that translation is not possible [58,60]. A possible solution is to use the anti-reverse cap analog (ARCA) or m7pppG modified at the 2′ position [58,61,62,63]. Another disadvantage of co-transcriptional capping is the lower capping efficiency of 60–80% as opposed to 100% for post-transcriptional capping due to competition with GTP in the initiation reaction of IVT [45,53,58]. To prevent this, an NTP:cap ratio of 4 is usually used, resulting in a high substrate requirement [49,64,65]. Further modifications to TriLink’s cap analog can increase capping efficiency up to 90%, using an NTP:cap ratio of 5:4 [66].
A variety of different separation technologies and purification strategies have been described in the literature for the capped mRNA present after co-transcriptional IVT. Although the main manufacturing steps of transcription, purification, and final encapsulation into lipid nanoparticles are similar for mRNA vaccines on the market and in development, the overall purification strategy and steps used are not standardized [2,3,4].
Figure 2 summarizes the procedures documented in the literature for the production of mRNA [2,3,4]. The chosen route is shown on the right, as well as the molecules separated from the product at each step to illustrate their properties [2]. Thus, in addition to IVT, including capping, the chosen process first involves mixed-mode chromatography to remove impurities such as the template, nucleotides, cap analog, and enzymes. The remaining product-related impurities such as double stranded mRNA and mRNA that is not of the desired length can be removed by reversed-phase (RP) chromatography.
The detailed process flowsheet is shown in Figure 3 in order to illustrate the complex amount supply in feasibility studies [2,4]. In this study, a pDNA fermentation is operated on a 2 L scale, and all sizes and volumes correspond proportionally to this.
The detailed process flow, as shown in Figure 3, is operated in the multipurpose facility shown in Figure 4 to understand the complex volume range in feasibility studies. The pDNA fermentation is run at 2 L scale in this study, and all sizes and volumes are proportional to this.
Therefore, all equipment and devices of the unit operations are flexible on a scale of 1–100 mL/min, starting with a 2 × 2 L fermentation.
Process models for continuous in vitro transcription with co-transcriptional capping have already been developed for the design of continuous mRNA vaccine production [3]. In the course of further development, it could be shown that the implementation of PID controllers can compensate for the occurrence of disturbance variables, or the drop in pH due to the reaction, in order to ensure consistent product quality. Furthermore, a model describing the formulation of mRNA in lipid nano particles (LNPs) was developed and PID controllers were also used to compensate for interfering variables [5].
This study considers the first experimental results to determine kinetic parameters that can be used to validate models of in vitro transcription (IVT). This is a prerequisite for the models to be used as digital twins for model-based process control.
This work also demonstrates the feasibility of generating and detecting segmented slugs in a one-system setup for a dose range from 1000 clinical doses to 10 million production-scale doses. On this basis, and after the optimization of IVT in batch, the transfer to continuous production of mRNA in segmented PFR and its separation by ultra- and diafiltration is performed. The basis for real-time controls and optimizations is, in addition to the digital twins, the process analysis technology (PAT), which also enables the real-time release of the product (RTRT) [67,68,69,70,71,72,73]. Consequently, spectroscopic methods are investigated for their applicability.

2. Materials and Methods

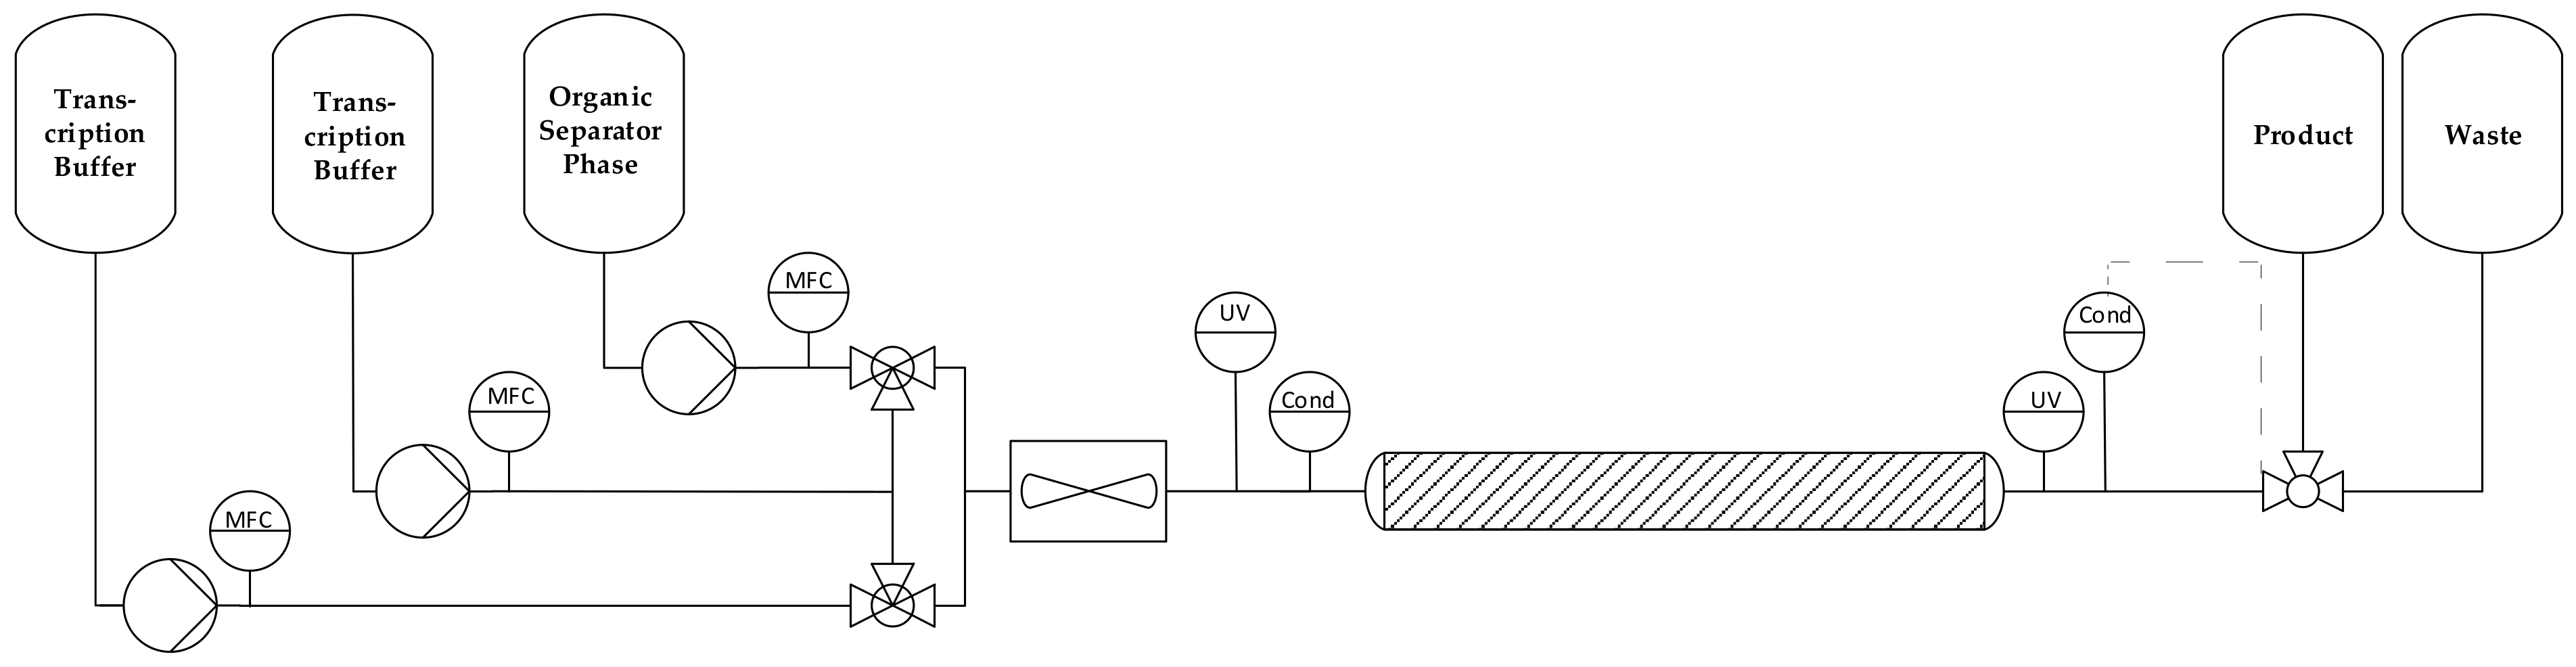
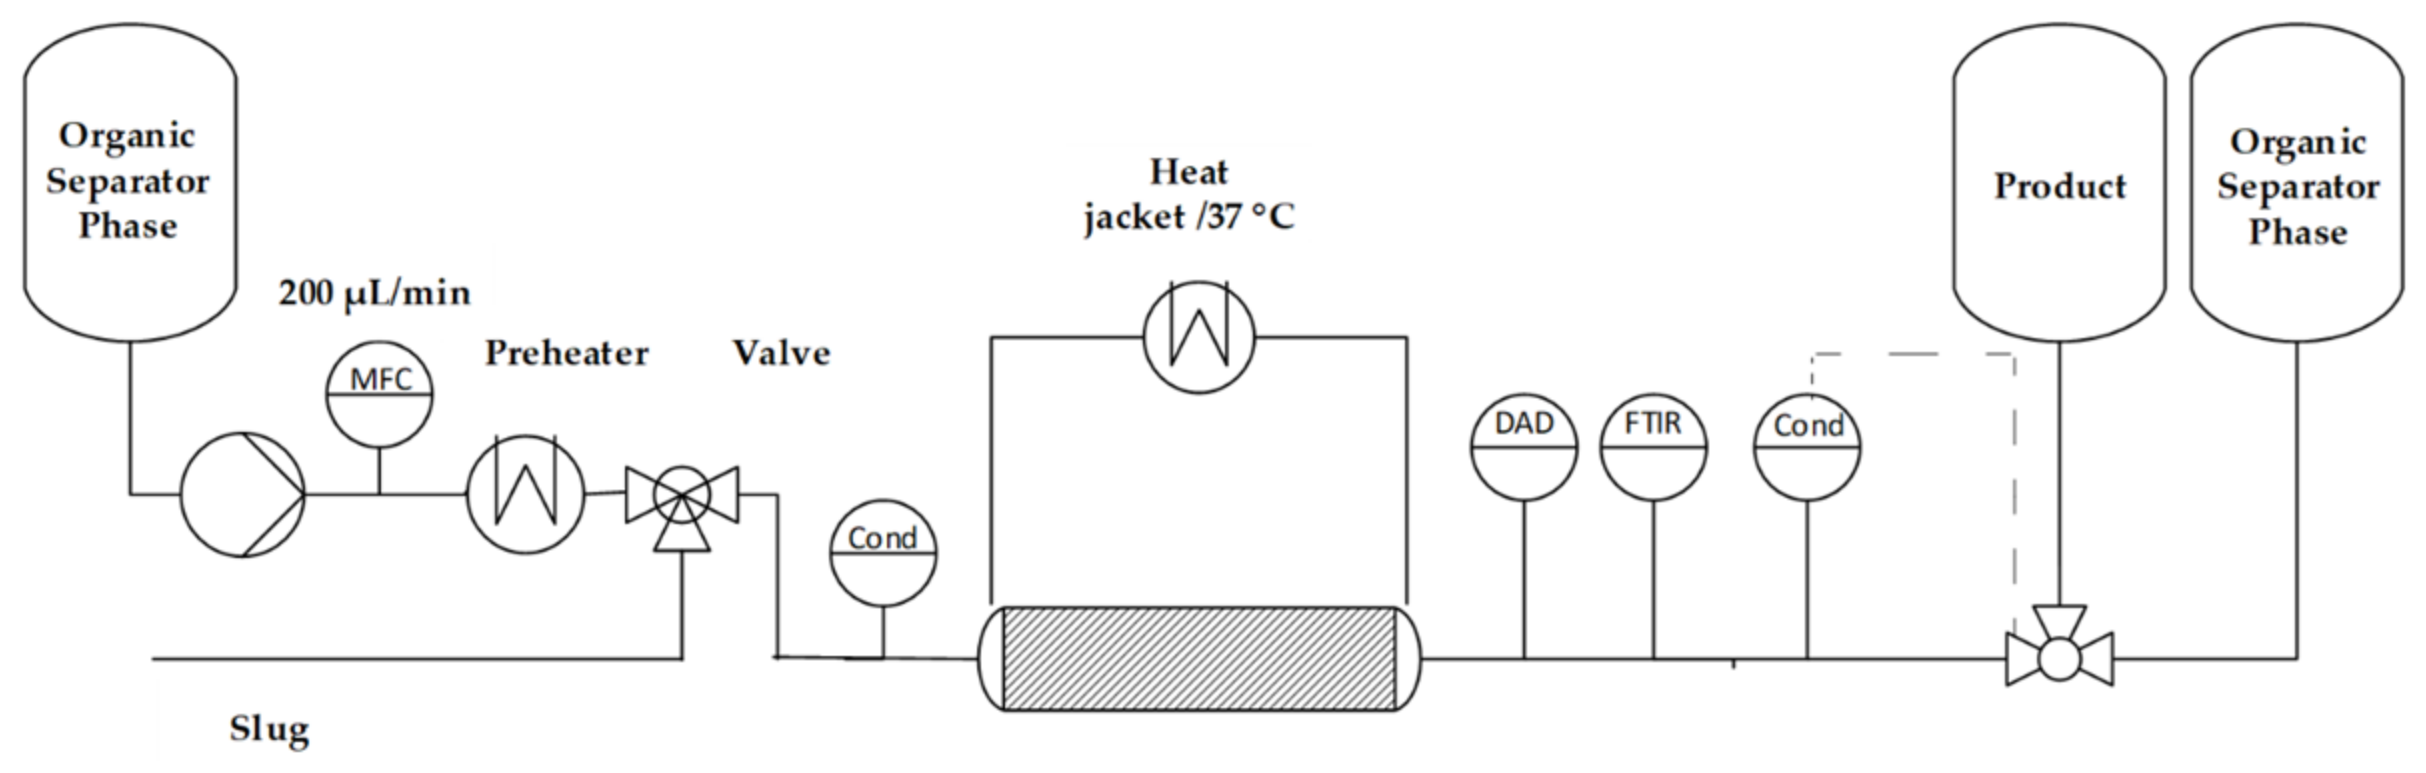
2.1. Plug Flow Reactor

To demonstrate the feasibility of the slug generation, a plug flow reactor (PFR) with a 1/16″ diameter and a length of approximately 18 m was used. The slug phase was the transcription buffer, and oleic acid was used as the slug generating phase. The experimental setup is shown in the flow diagram in Figure 5.
The system consists of storage tanks which contain the transcription buffer or the oleic acid, from which the respective phase is pumped via a pump into the PFR, first passing a switch valve and a mass flow controller, which are used to monitor the actual volumetric flow rate and the density, and then passing a UV detector and a conductivity detector. After the PFR, the UV signal is captured first, followed by the conductivity signal. Then, the product phase can be fractionated with the downstream valve. The UV detector records at a wavelength of 200 nm, which is the wavelength at which the absorption maximum of oleic acid is located [74]. The experiments were performed by first filling the tubular reactor and tubing with the oleic acid and then applying the slug using the switching valve. The slug is displaced by the oil phase by switching the valve again.
To ensure the required residence time of 3 h for the apparatus dimensions, the volume flow was set to 0.2 mL/min. Furthermore, a volume flow of 1 mL/min was used. This is derived from the Reynolds number obtained for a reactor, in line with the simulation study of Helgers et al. [3], at a volume flow of 9.26 mL/min. This volume flow is required to produce 10 million doses in 3 days. As mentioned above, the volume of product phase for 1000 doses is 4 mL, if 10 million doses correspond to a 40 L fermentation batch [4]. In this study, the reactor diameter used was 1/16″. This results in a slug length of 200 cm.
For continuous IVT, a reaction slug of 300 µL was applied, which makes the exact fractionation even more challenging to prove, in terms of feasibility for larger slugs also. In addition, the following detectors were added to the setup: temperature, DAD, Raman, FTIR, fluorescence, and MALS/DLS (see Figure 6).

2.2. Preparation of the Linearized pDNA Template

In order for the T7 RNA polymerase to transcribe the desired mRNA, a linearized DNA template is required. This is obtained from the fermentation and chemical digestion of E. coli. The isolated pDNA is purified using two ultra- and diafiltration steps and an anion exchanger (Fractogel® EMD DEAE, Merck Millipore, Burlington, MA, USA). Finally, the pDNA is linearized with the restriction enzyme EcoRI (Thermo ScientificTM, Waltham, MA, USA) so that the polymerase can read it [75].

2.3. In Vitro Transcription

In vitro transcription was performed both batch-wise and continuously in a plug-flow reactor. For the optimization of IVT in batch with respect to yield, a statistical experimental design with 35 experiments including 3 center points was performed and evaluated using various statistical analysis tools with JMPTM Pro 16 software.
The factors to be investigated in the experimental plan (design of experiments; DoE) were selected based on the literature. For example, temperature can positively affect the reaction rate between 37–43 °C [49]. The NTP concentration [49], as well as the ratio of NTP:GTP, affects the mRNA yield [64,76]. However, the NTP concentration can lead to inhibition of T7 mRNA polymerase above 10 mM, which can be reduced by the cofactor Mg2+ in magnesium acetate [49]. The concentration of magnesium acetate used varies in the literature in a wide range from 12–50 mM [49,66,76]. The pH is usually pH8 [13,66], but some studies have shown that a lower pH may be beneficial [49,76].
The factors selected for the DoE and their considered ranges are shown in Table 1.
The factors listed in Table 2 are used in in vitro transcription at the concentrations frequently used in the literature. They are not varied because no optimization potential is known for them.
All 25 µL mixtures included in the statistical experimental design were incubated for two hours and subsequently analyzed using the analytical methods listed in Section 2.6. To reproduce the optimal operating point and to determine the capping efficiency, the cap analog Clean Cap AG (TriLink BioTechnologies, San Diego, CA, USA) was added in addition to the components listed in Table 1 and Table 2.
For the continuous production of mRNA in the PFR, the reaction mixture of 300 µL was applied as a feasibility test.

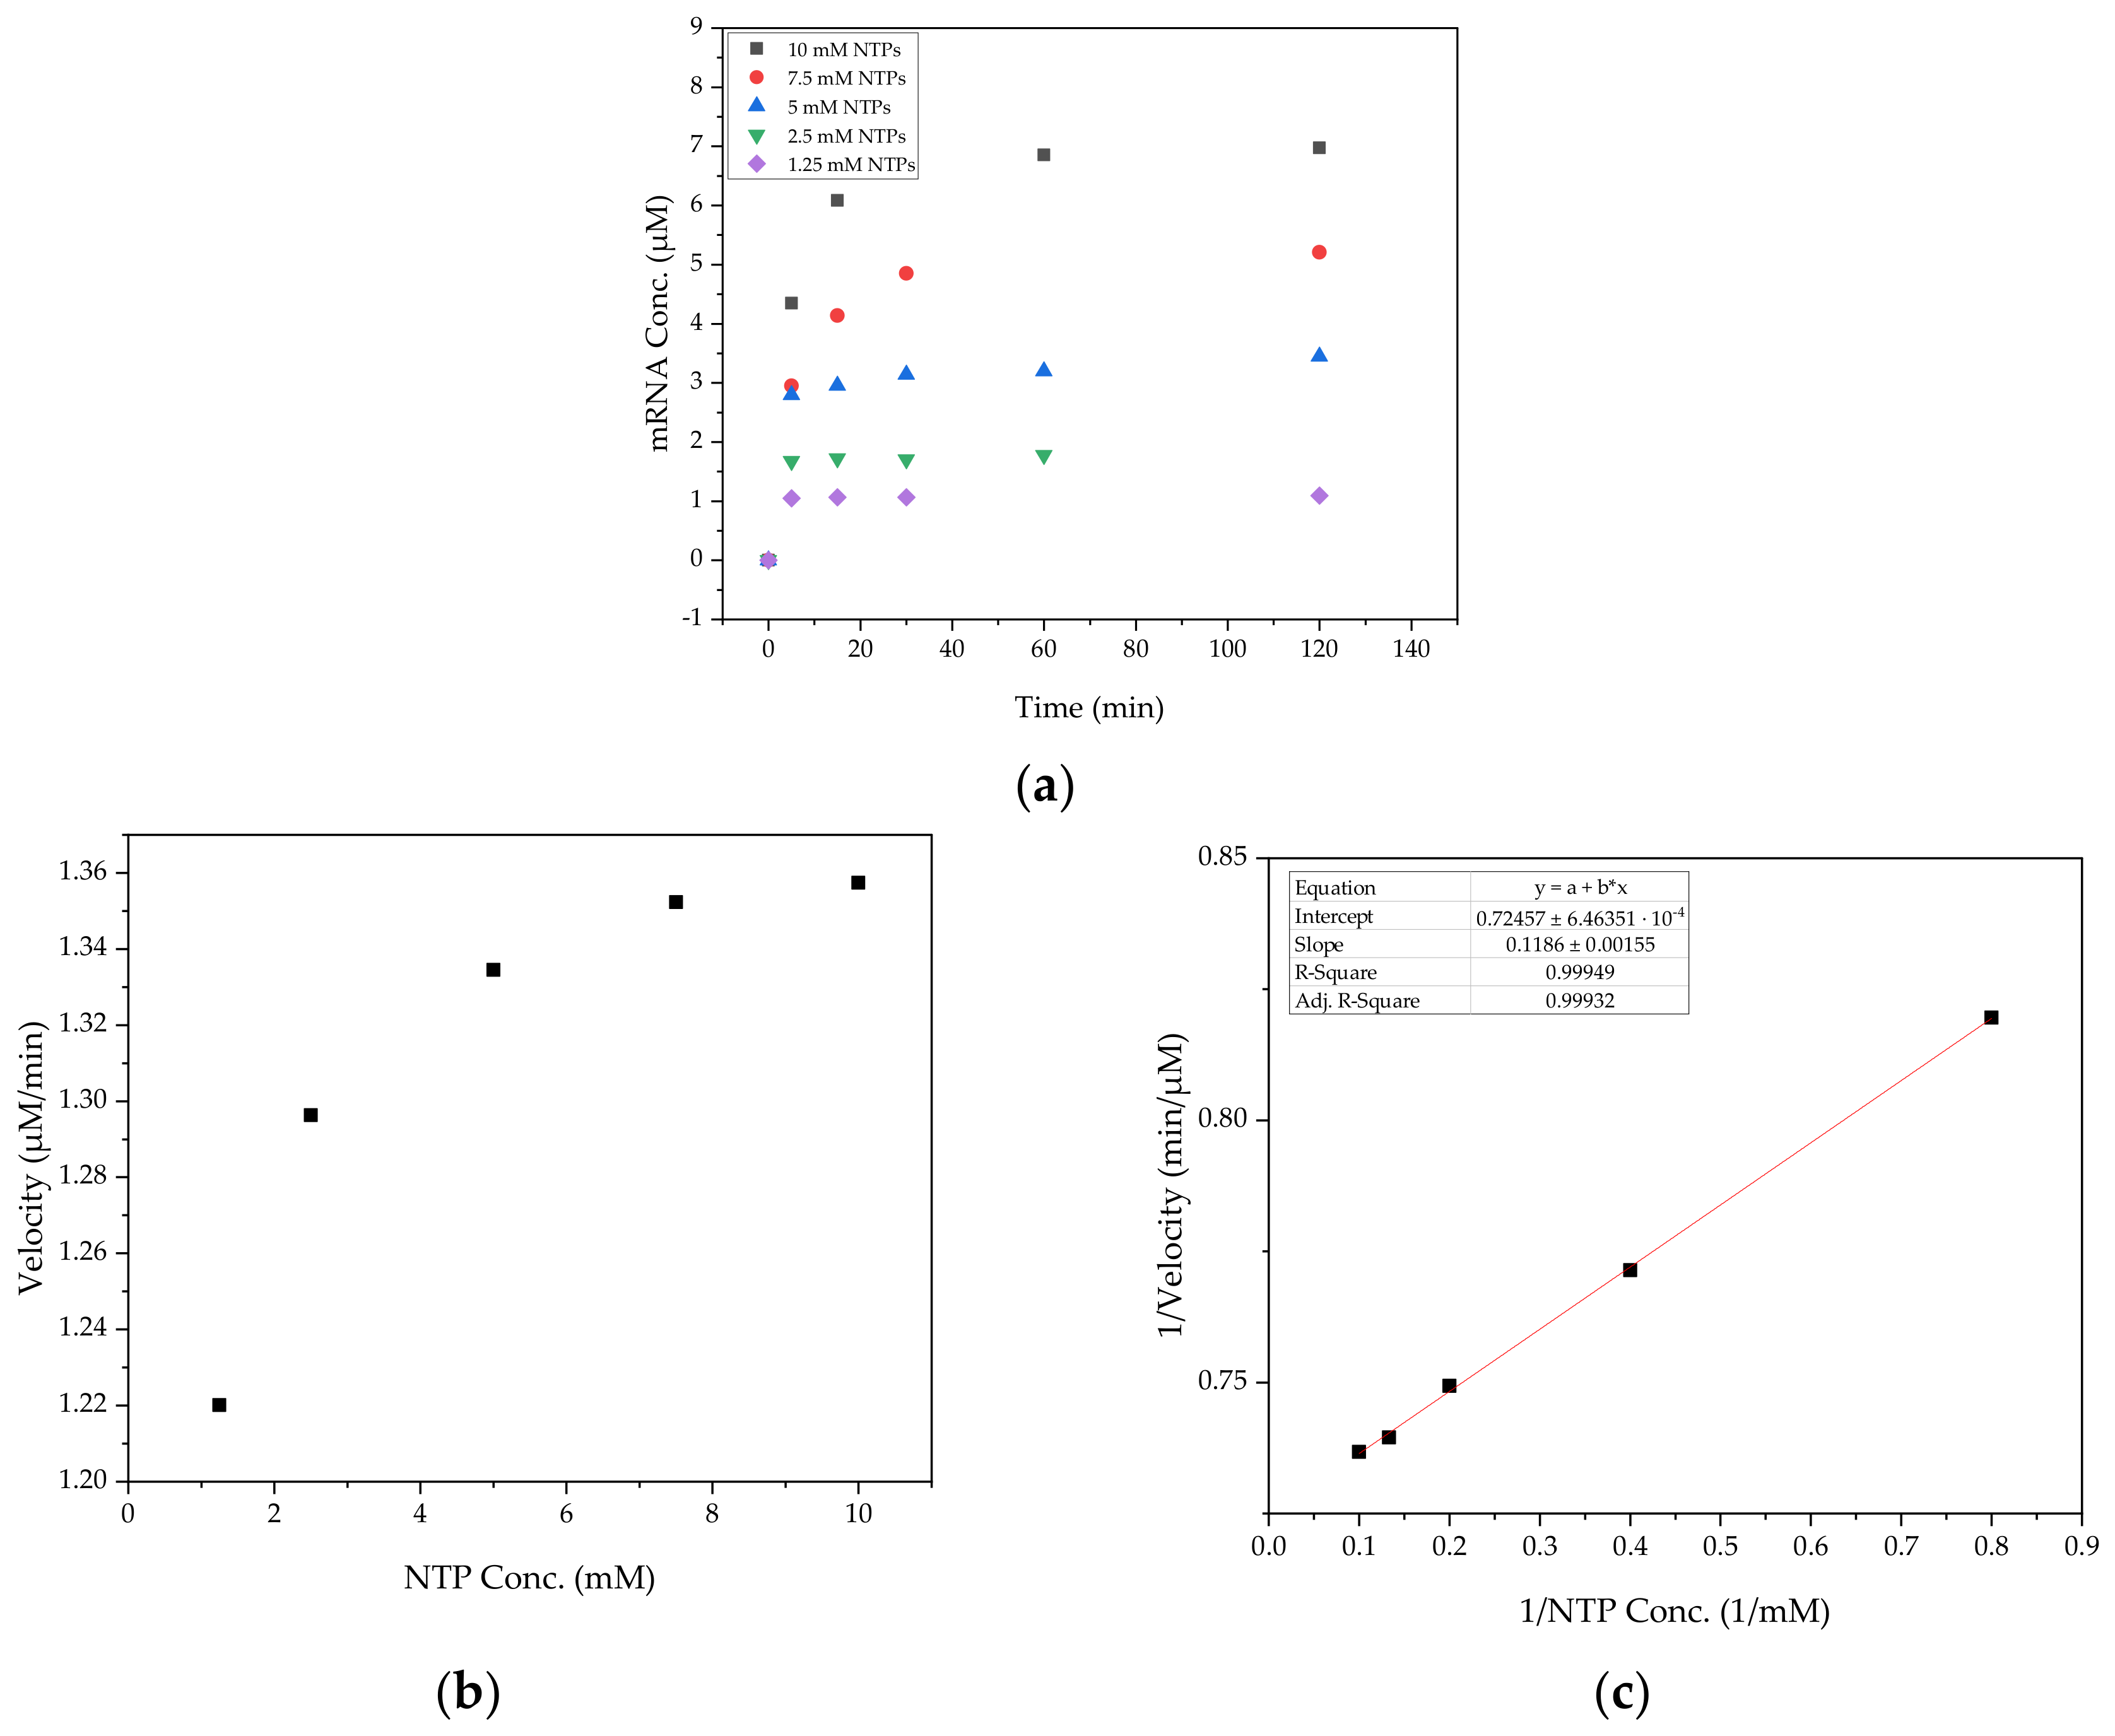
2.4. Determination of the Enzymatic Kinetic Parameters

To determine the characteristic parameters of enzymatic reactions, the Michaelis–Menten constant (KM) and the turnover rate (k), the substrate concentration was varied and samples were taken at different times. The substrate concentrations used were 10, 7.5, 5, 2.5, and 1.25 mM. Samples were taken after 5, 15, 30, 60, and 120 min of reaction time. From the linear range of the time courses, the reaction rates can be determined. From the Lineweaver–Burk plot, the Michaelis–Menten constant and the maximum reaction rate (vmax) can then be obtained [77]. With a known enzyme concentration (cT7 Polymerase) and the following relationship, the turnover rate can be calculated [48].
v m a x = c T 7   P o l y m e r a s e · k

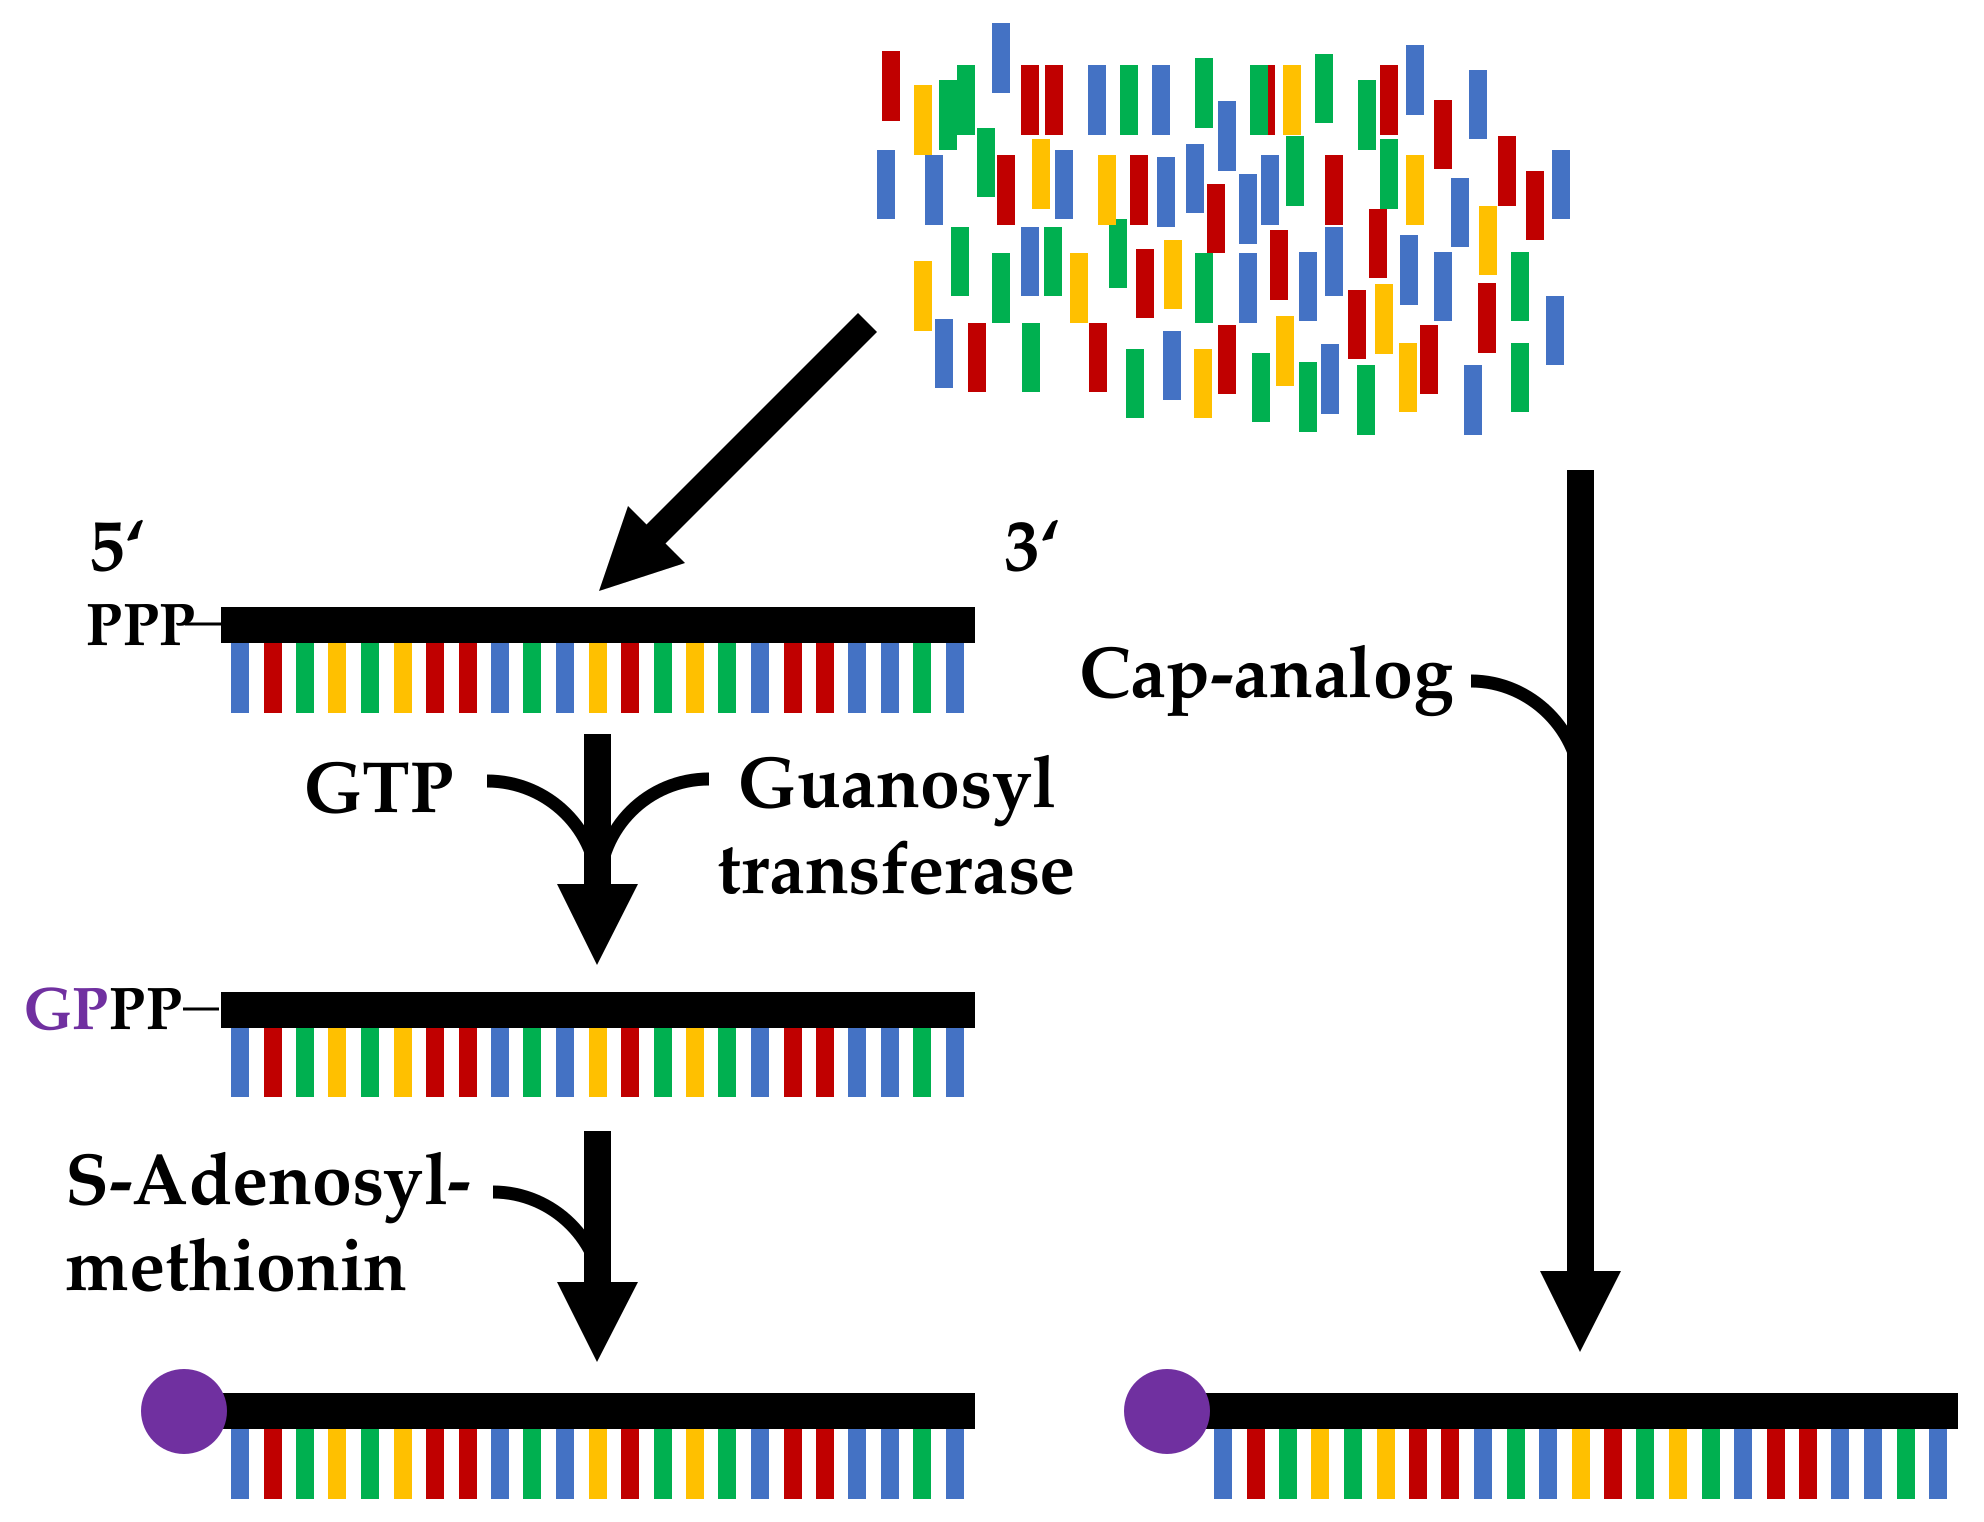
2.5. Determination of Capping Efficiency

For the determination of capping efficiency, a two-step enzymatic digestion of uncapped mRNA was performed, analogous to Pregeljc et al. [76]. In the first reaction, phosphates of the 5′ triphophorilated mRNA were degraded to a 5′ monophosphorilated end by 10 U of RNA 5′ polyphosphatase (Lucigen Corporation, Teddington, UK). In the second digestion step, 0.5 U of terminator 5′-phosphate dependent exonuclease (Lucigen Corporation, Teddington, UK) degraded the mRNA with the 5′ monophosphorilated end, leaving only the capped mRNA.

2.6. Analytics of mRNA

There are various critical quality attributes (CQAs; cf. Table 3) for mRNA, which must lie within a defined range for the product to be released. The analysis of these CQAs is very different. According to the literature, BioNtech applies two RP HPLC methods in quality analytics (QA) for homogeneity and cap efficiency, and gel, pH, and osmolality for drug substance. Drug size is determined using DLS, and lipid concentration is determined using the RP method [18,78]. Since transcription errors or premature termination of IVT can result in mRNA species that are too short and usually lack a PolyA-tail, Moderna implements RP or oligo(dT) chromatography into the production process [79,80,81], and QA uses RP chromatography for homogeneity determination and an anion exchanger (AEX) for purity testing. BIA, as a commercial supplier of chromatography columns for mRNA analysis, uses Oligo(dT) affinity and the PrimaS mixed-mode chromatography in its processes. In QA, BIA relies on gel electrophoresis, Oligo(dT) to verify the presence of a PolyA-tail, PrimaS to determine mRNA titer and NTP concentration, and RP to determine ss:ds homogeneity [82,83,84]. Rosa et al. purifies mRNA with MEGAclearTM Transcription Clean-Up Kit (Thermo ScientificTM, Waltham, MA, USA) without chromatographic steps, using the OD260 UV signal in Nanodrop 1 (Thermo ScientificTM, Waltham, MA, USA) for titer determination [49]. Furthermore, they use gel electrophoresis and RP chromatography as analytical methods [49]. The overview shows that different analytical methods are applied for different QA CQAs data and that different approaches are used. Therefore, this study is concentrated on three different analytical methods. Agarose gel electrophoresis was used for the qualitative detection of mRNA, the titer of which is determined using PrimaS chromatography. It was also used to determine the nucleotide consumption rate. As a third method, RP chromatography was used to determine the ratio of single-stranded (ss) to double-stranded (ds) mRNA, i.e., homogeneity.

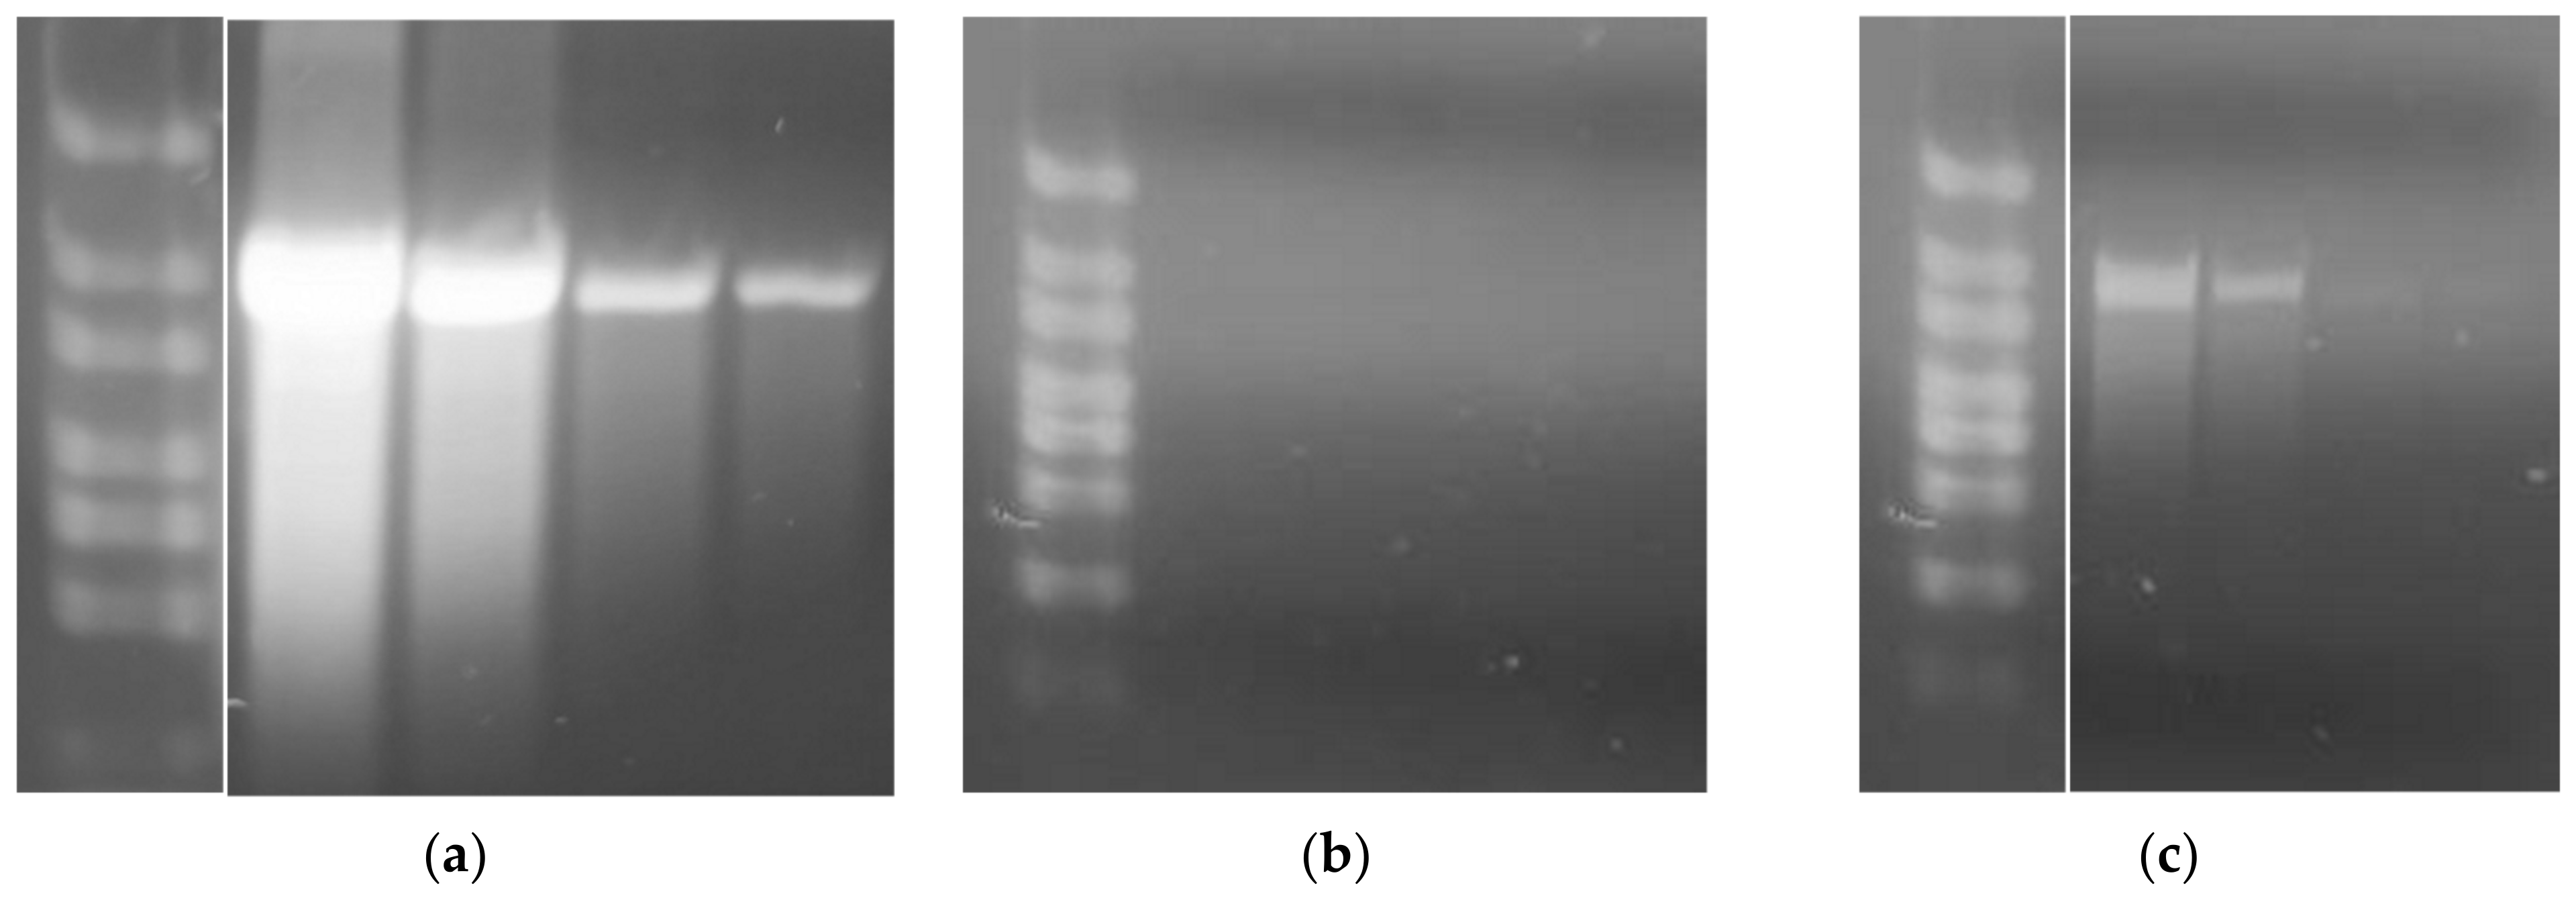
Agarose Gel Electrophoresis

Agarose gel gives the mRNA titer in total as well as qualitative homogeneity and length. The gel consists of 1.2% agarose, 1 × TAE buffer and ethidium bromide; 1 × TAE buffer is also used as the running buffer. Before loading the gel, the samples were first denatured. For this purpose, formamides (60% v/v final concentration) were added, the loading dye was applied, and the samples were denatured for 5 min at 65 °C [86]. In addition, different dilution levels are necessary to prevent overloading of the gel [64,65]. Consequently, the samples were diluted to 1:10, 1:20, 1:100, and 1:200, respectively. Electrophoresis was performed at 120 V for 60 min.

PrimaS Chromatography
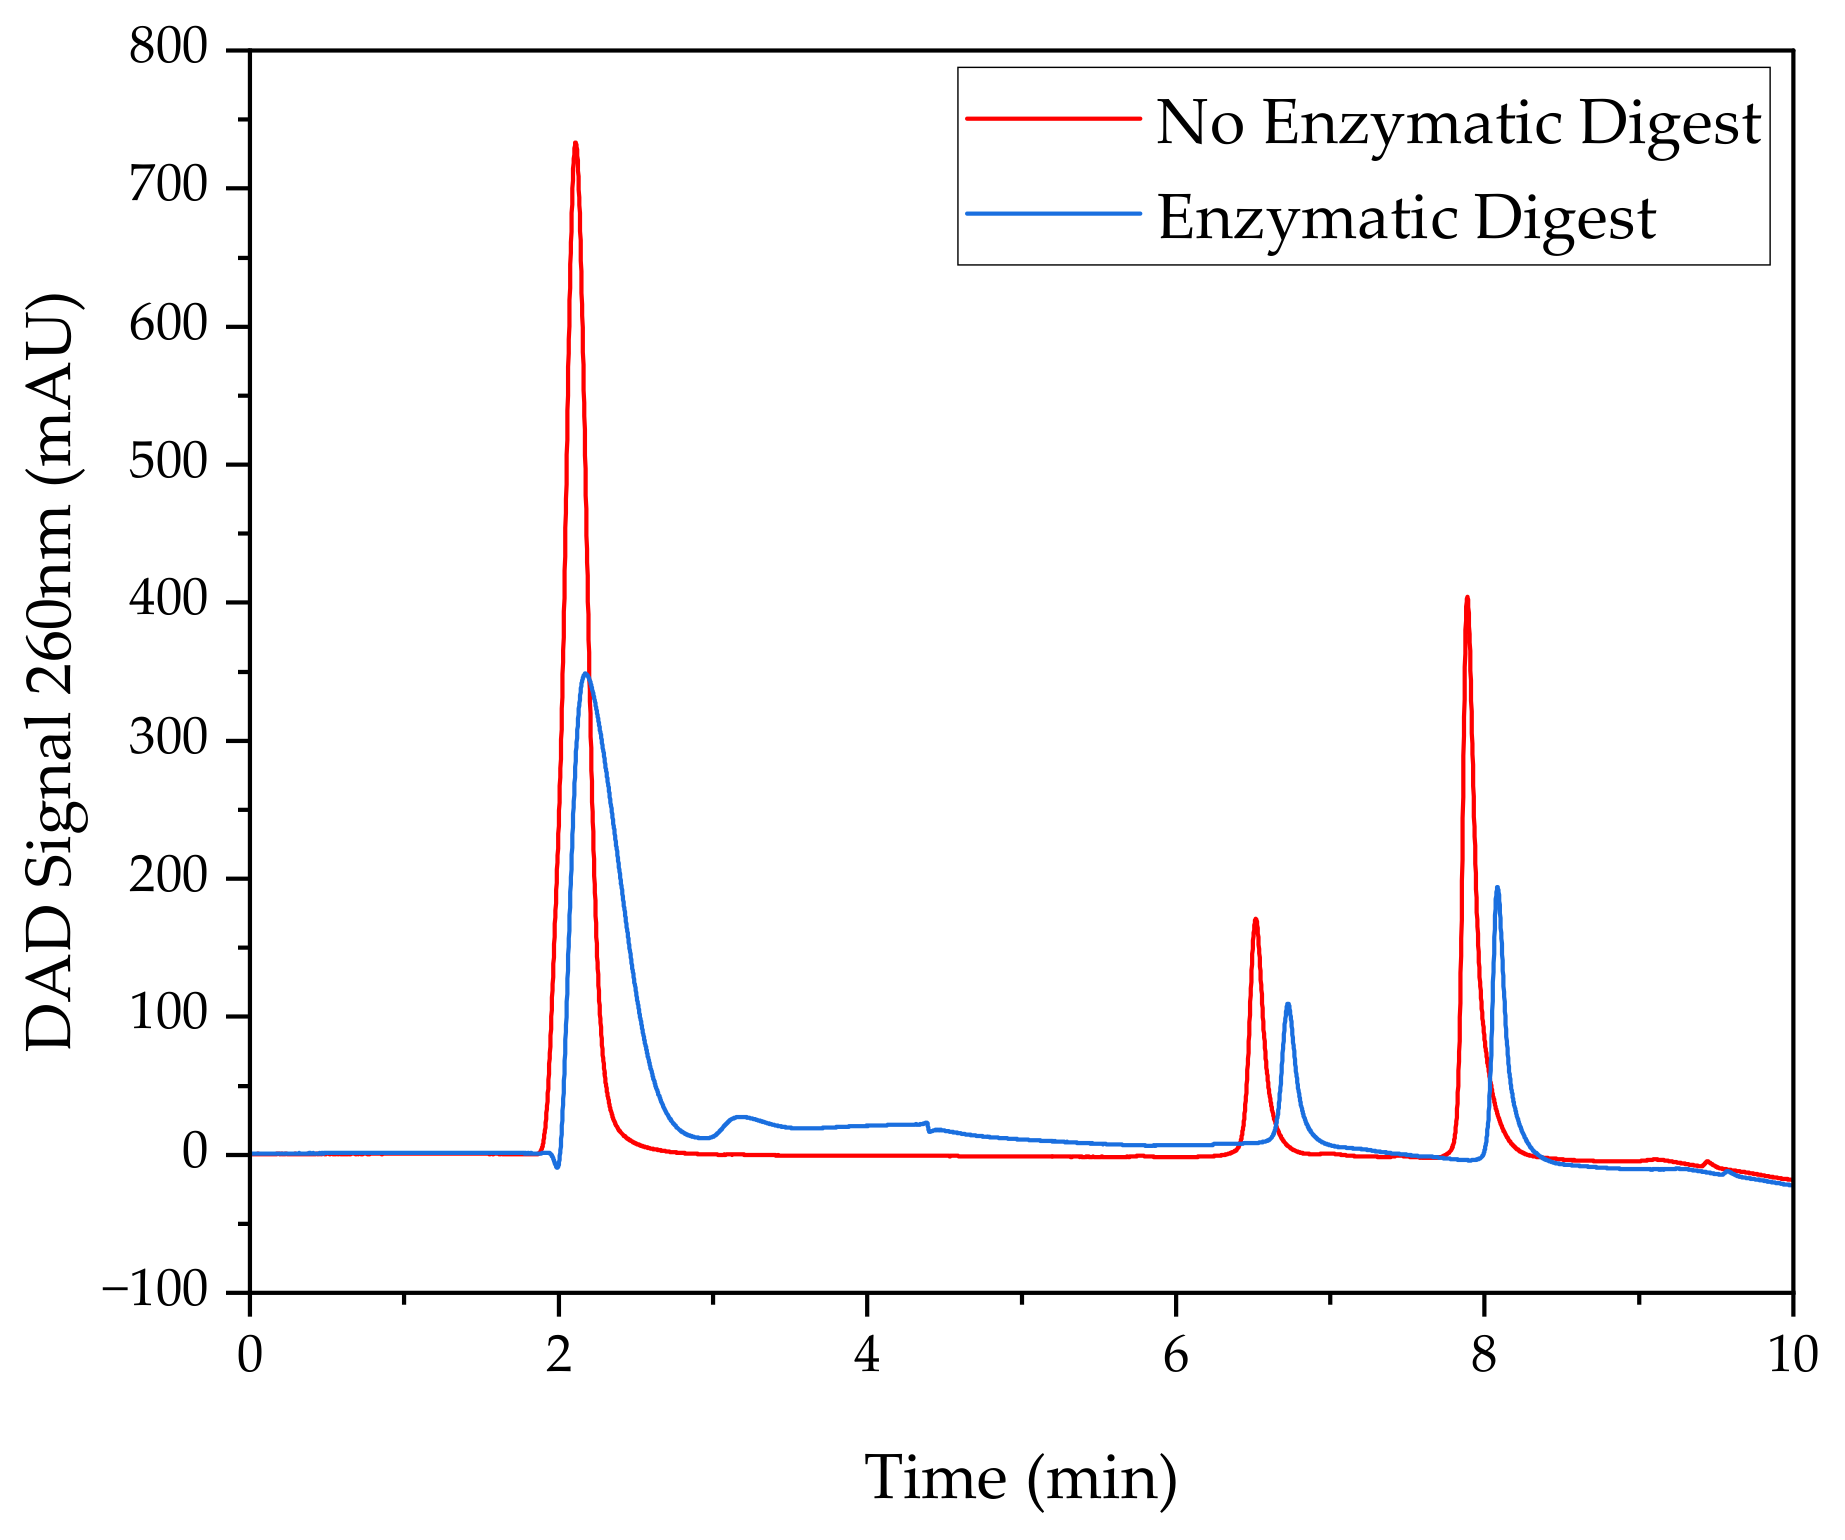
PrimaS chromatography is another method used to quantify mRNA titer in relation to the NTP amount. The CIMac PrimaS Column (BIA Separations, Ajdovščina, Slovenia) with a bed volume of 0.1 mL was used. The loading buffer was 50 mM HEPES at pH 7. A total of 50 mM HEPES with 100 mM Na4P2O7 at pH 8.3 was used for elution. For the cleaning-in-place (CIP) step, 100 mM NaOH with 1 M NaCl was used and for the regeneration step, 500 mM HEPES at pH 7 was used. The method was adapted from BIA Separations [84]. The samples were diluted with mobile phase A prior to injection.

RP Chromatography

The determination of single-stranded and double-stranded mRNA was performed with the aid of RP chromatography. A DNAPacTM RP (Thermo ScientificTM, Waltham, MA, USA) column, including a guard column, was used. The mobile phases were 100 mM TEAA buffer at pH 7 and 100 mM TEAA with 25% acetonitrile at pH 7. The method was adapted from [49,80]. The sample preparation consisted of an eightfold dilution of samples with mobile phase A.

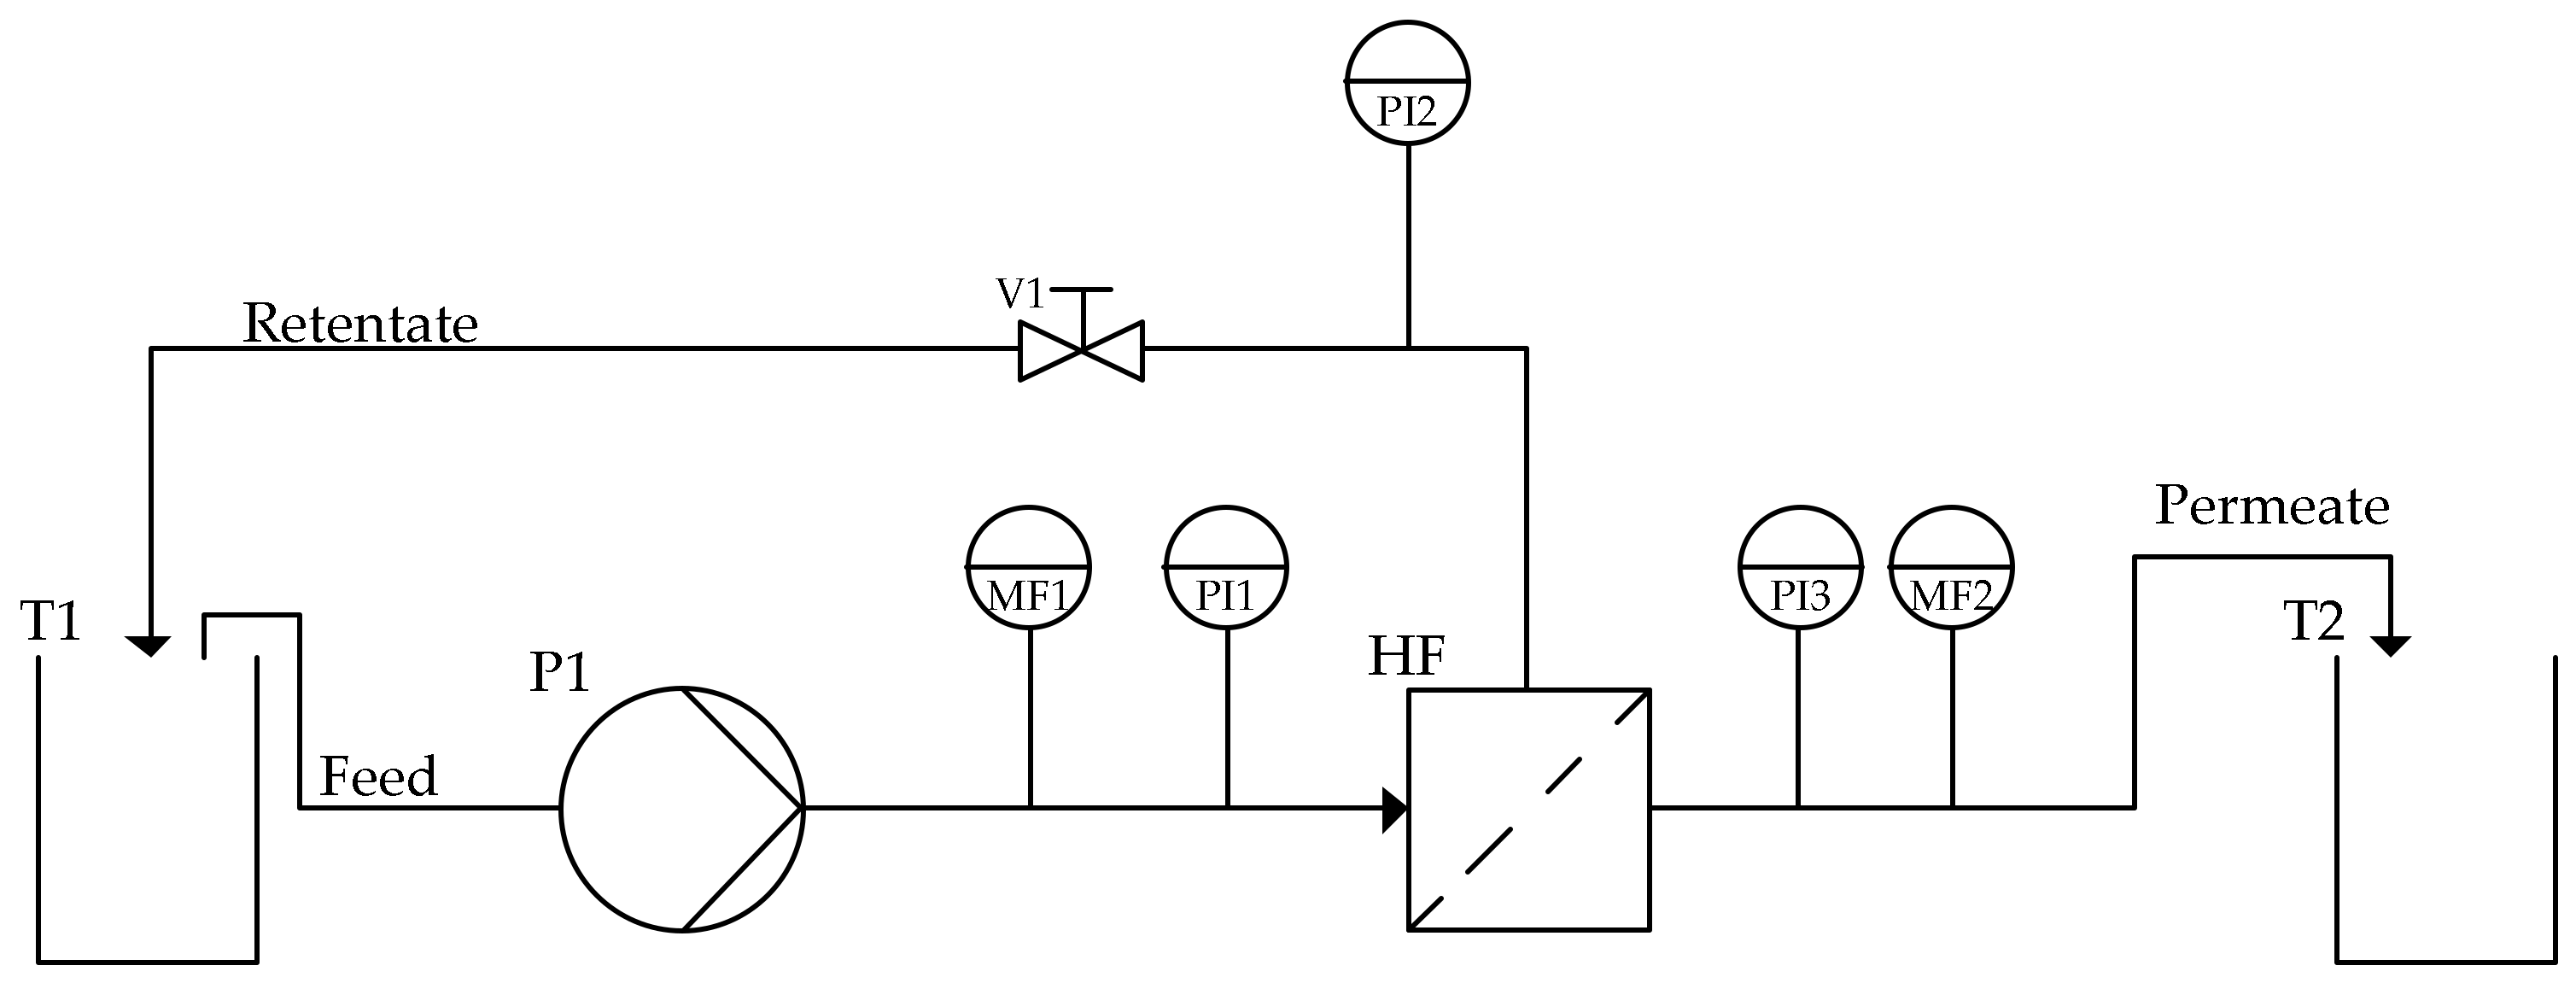
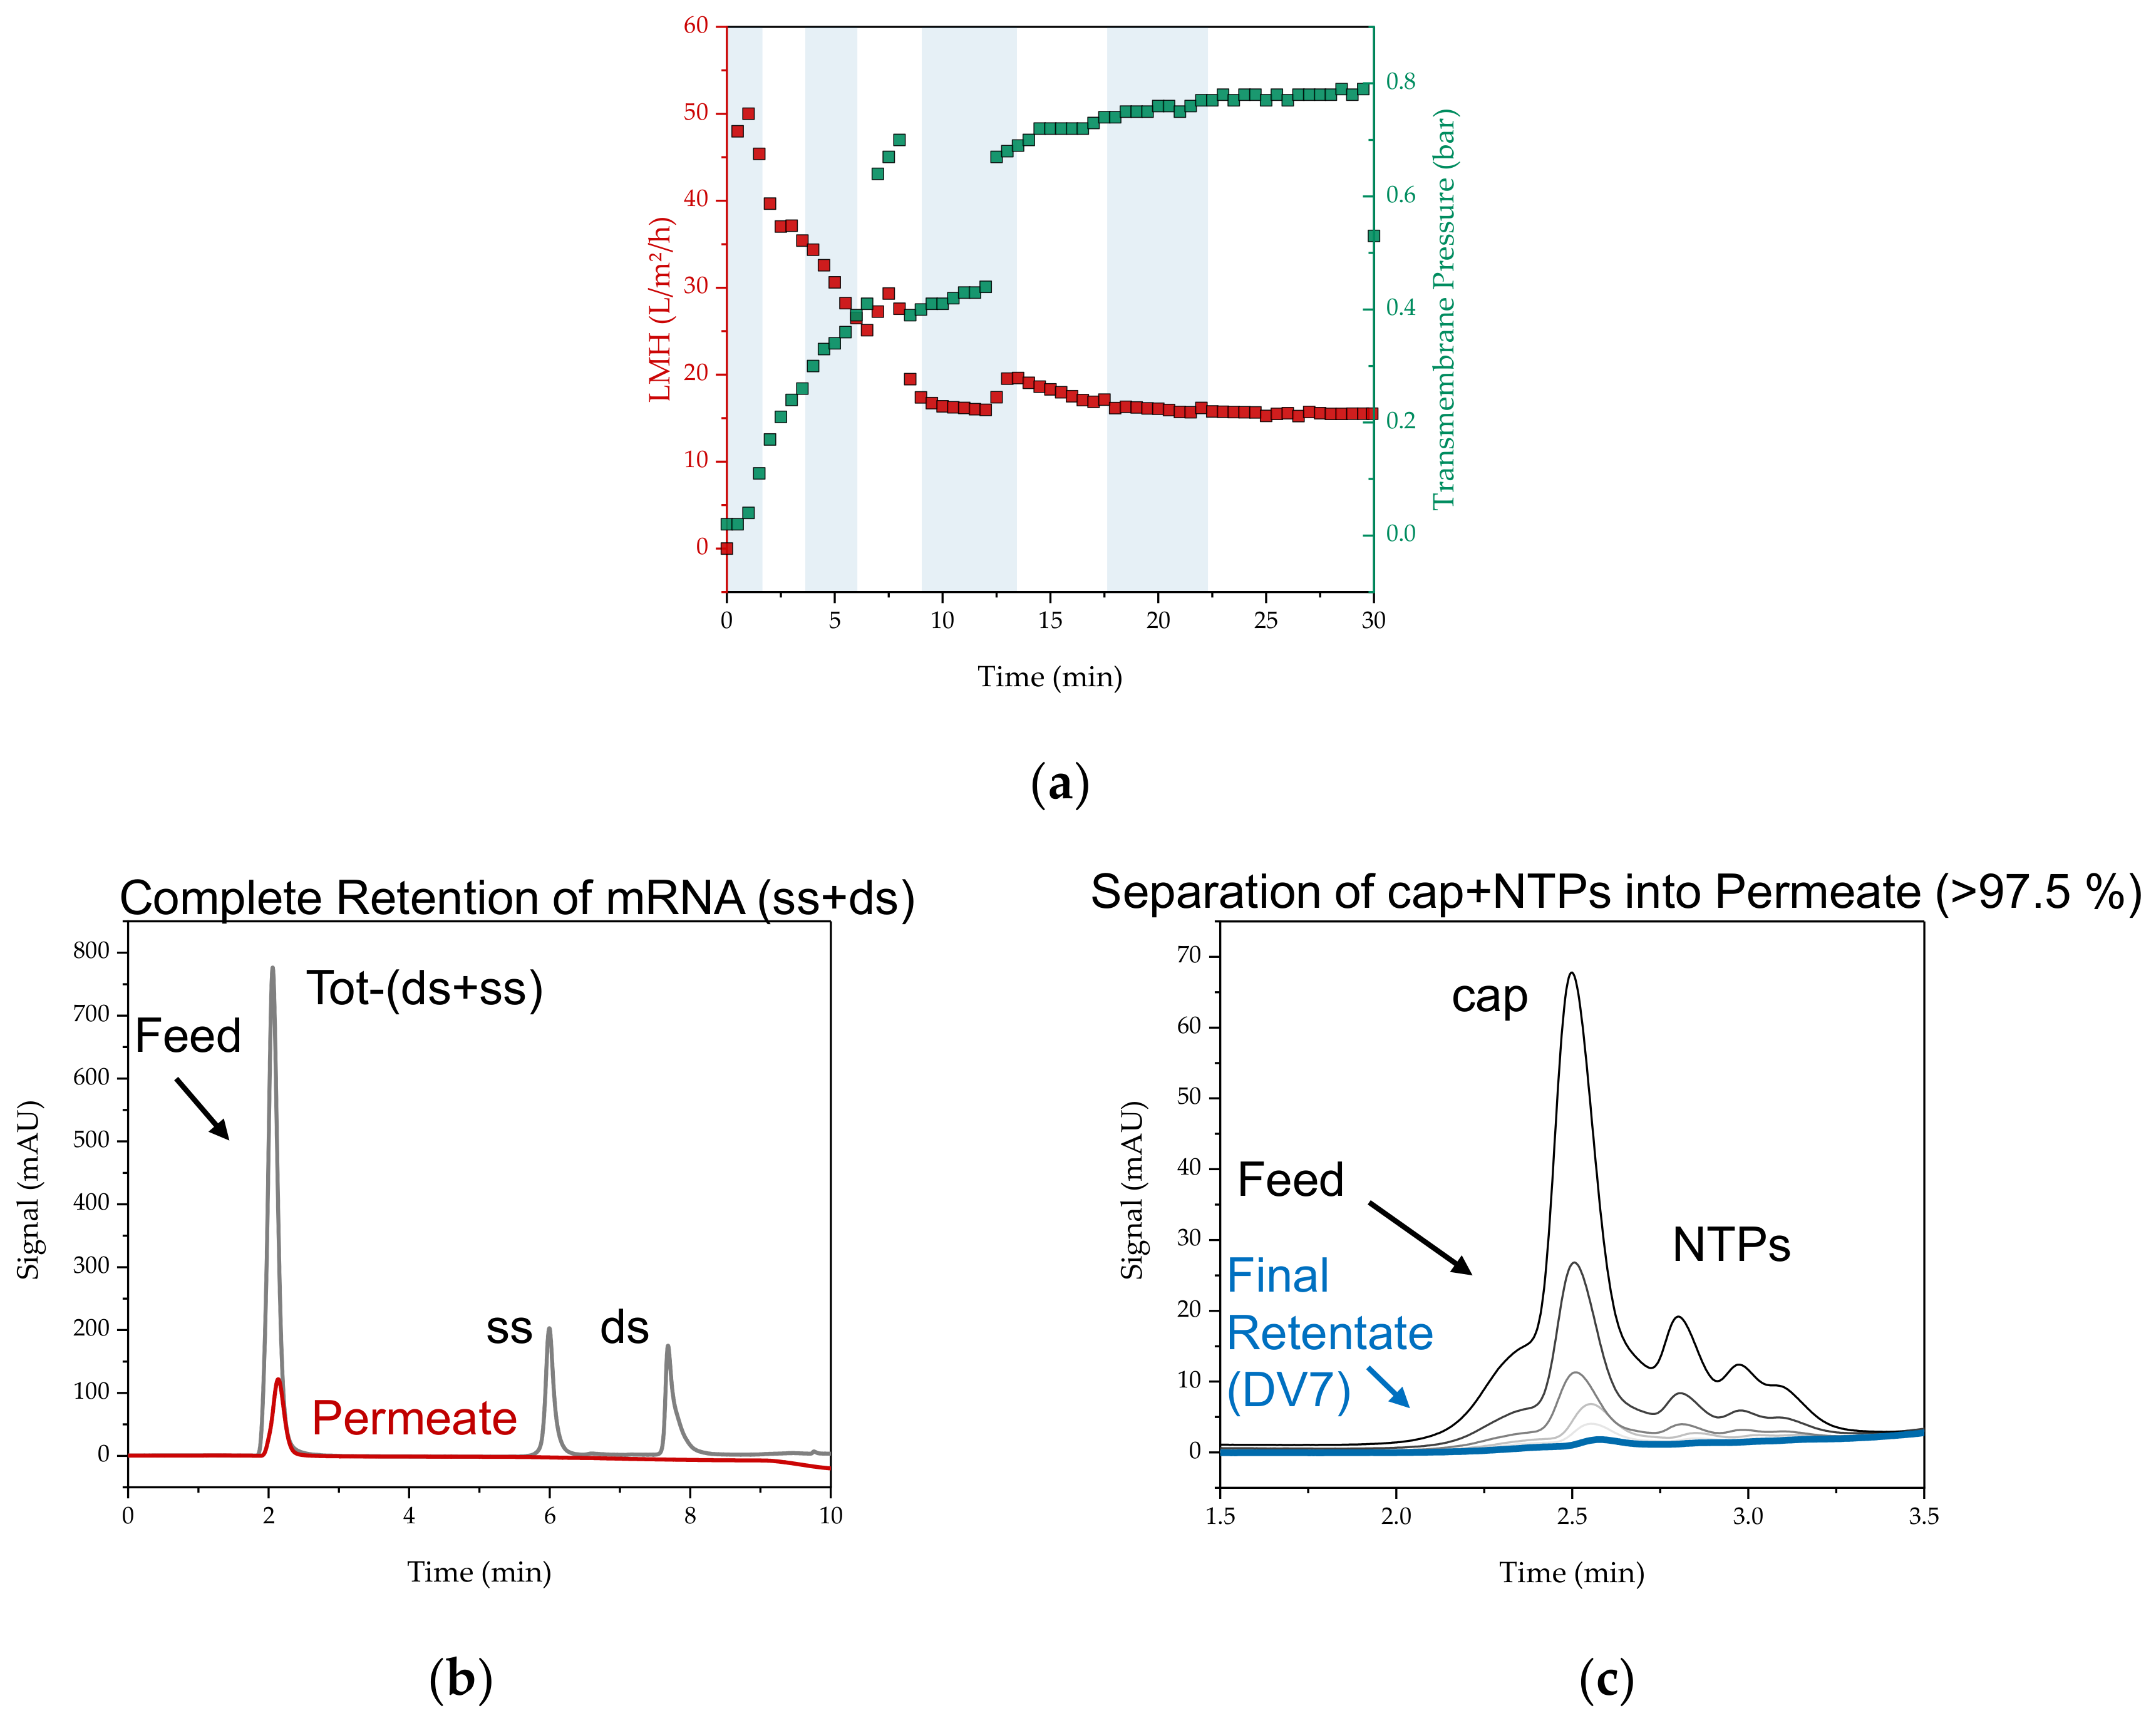
2.7. Ultra- and Diafiltration

The post-IVT solutions that contained NTPs, cap analog, enzymes, and salts of the transcription buffer were used as feed. The exchange buffer (50 mM Tris-HCl, pH 7.2) was added stepwise immediately after sampling. A total of 8 diavolumes were used for buffer exchange, which corresponds to a buffer exchange of more than 99%. The examined hollow-fiber module (Type C02-E300-05-N, Repligen Corporation, Boston, MA, USA) had an effective length of 200 mm and a fiber inner diameter of 0.5 mm. With 6 fibers, this resulted in an effective filter area of 20 cm2. The fiber material was mPES (modified polyethersulfone) and the MWCO (molecular weight cut-off) was 300 kDa.
The mean pressure on the feed side is the average of feed pressure P F and retentate pressure P R e t . The difference between the mean pressure on the feed side and the permeate side is the transmembrane pressure T M P (Equation (15)). During the process, the T M P was readjusted via a control valve (see Figure 7).
T M P = P F + P R e t 2 P P e r
The permeate flux L M H calculated via Equation (16) is the permeate flow V ˙ P e r normalized to the membrane area A M e m :
L M H = V ˙ P e r A M e m
The apparent sieving coefficient S a p p , i can be calculated via Equation (17) and represents the relative concentrations of component i in permeate c P e r , i and feed c F , i [87]:
S a p p , i = c P e r , i c F , i
This allows the calculation of the apparent retention of component i R a p p , i in the process via S a p p , i , as shown in Equation (18):
R a p p , i = 1 S a p p , i
The concentration increase of mRNA in the retentate is given by the volume concentration factor V C F , as shown in Equation (19) [88].
V C F = V F , s t a r t V R e t , e n d
The focus of the study was to characterize the separation potential of NTPs, cap analog, enzymes, and salts derived from the transcriptional buffer, rather than the concentration increase; therefore, the process was run at a V C F of 1. The initial volume V F , s t a r t therefore equals the final volume of retentate V R e t , e n d .

3. Results

The central question in slug-flow operation is whether the introduced slug with 1000 doses of the product could be operated accurately enough, without any contamination or mixing of the separating non-miscible fluid. This is proven in the following for any in vitro transcription in a plug-flow reactor. Finally, mRNA quality of continuous operation with regards to the corresponding batch modus must be proven.
The continuous reactor has the benefit of generating residence time need of about, e.g., 3 h with the aid of a recycling loop, in this recycling loop a membrane with cut-off of, e.g., 300 kDa or 500 kDa is placed to allow any recycling of small molecular entities and draw of mRNA product continuously. A cut-off of 300 kDA has less MWCO losses and proves best [89,90,91]. In addition, such a configuration allows appropriate adjustment with a feeding strategy which is controlled by the measurement of the consumption rate to product mRNA by aid of FTIR and DAD; the necessary optimal feed content amounts are calculated with a digital twin.

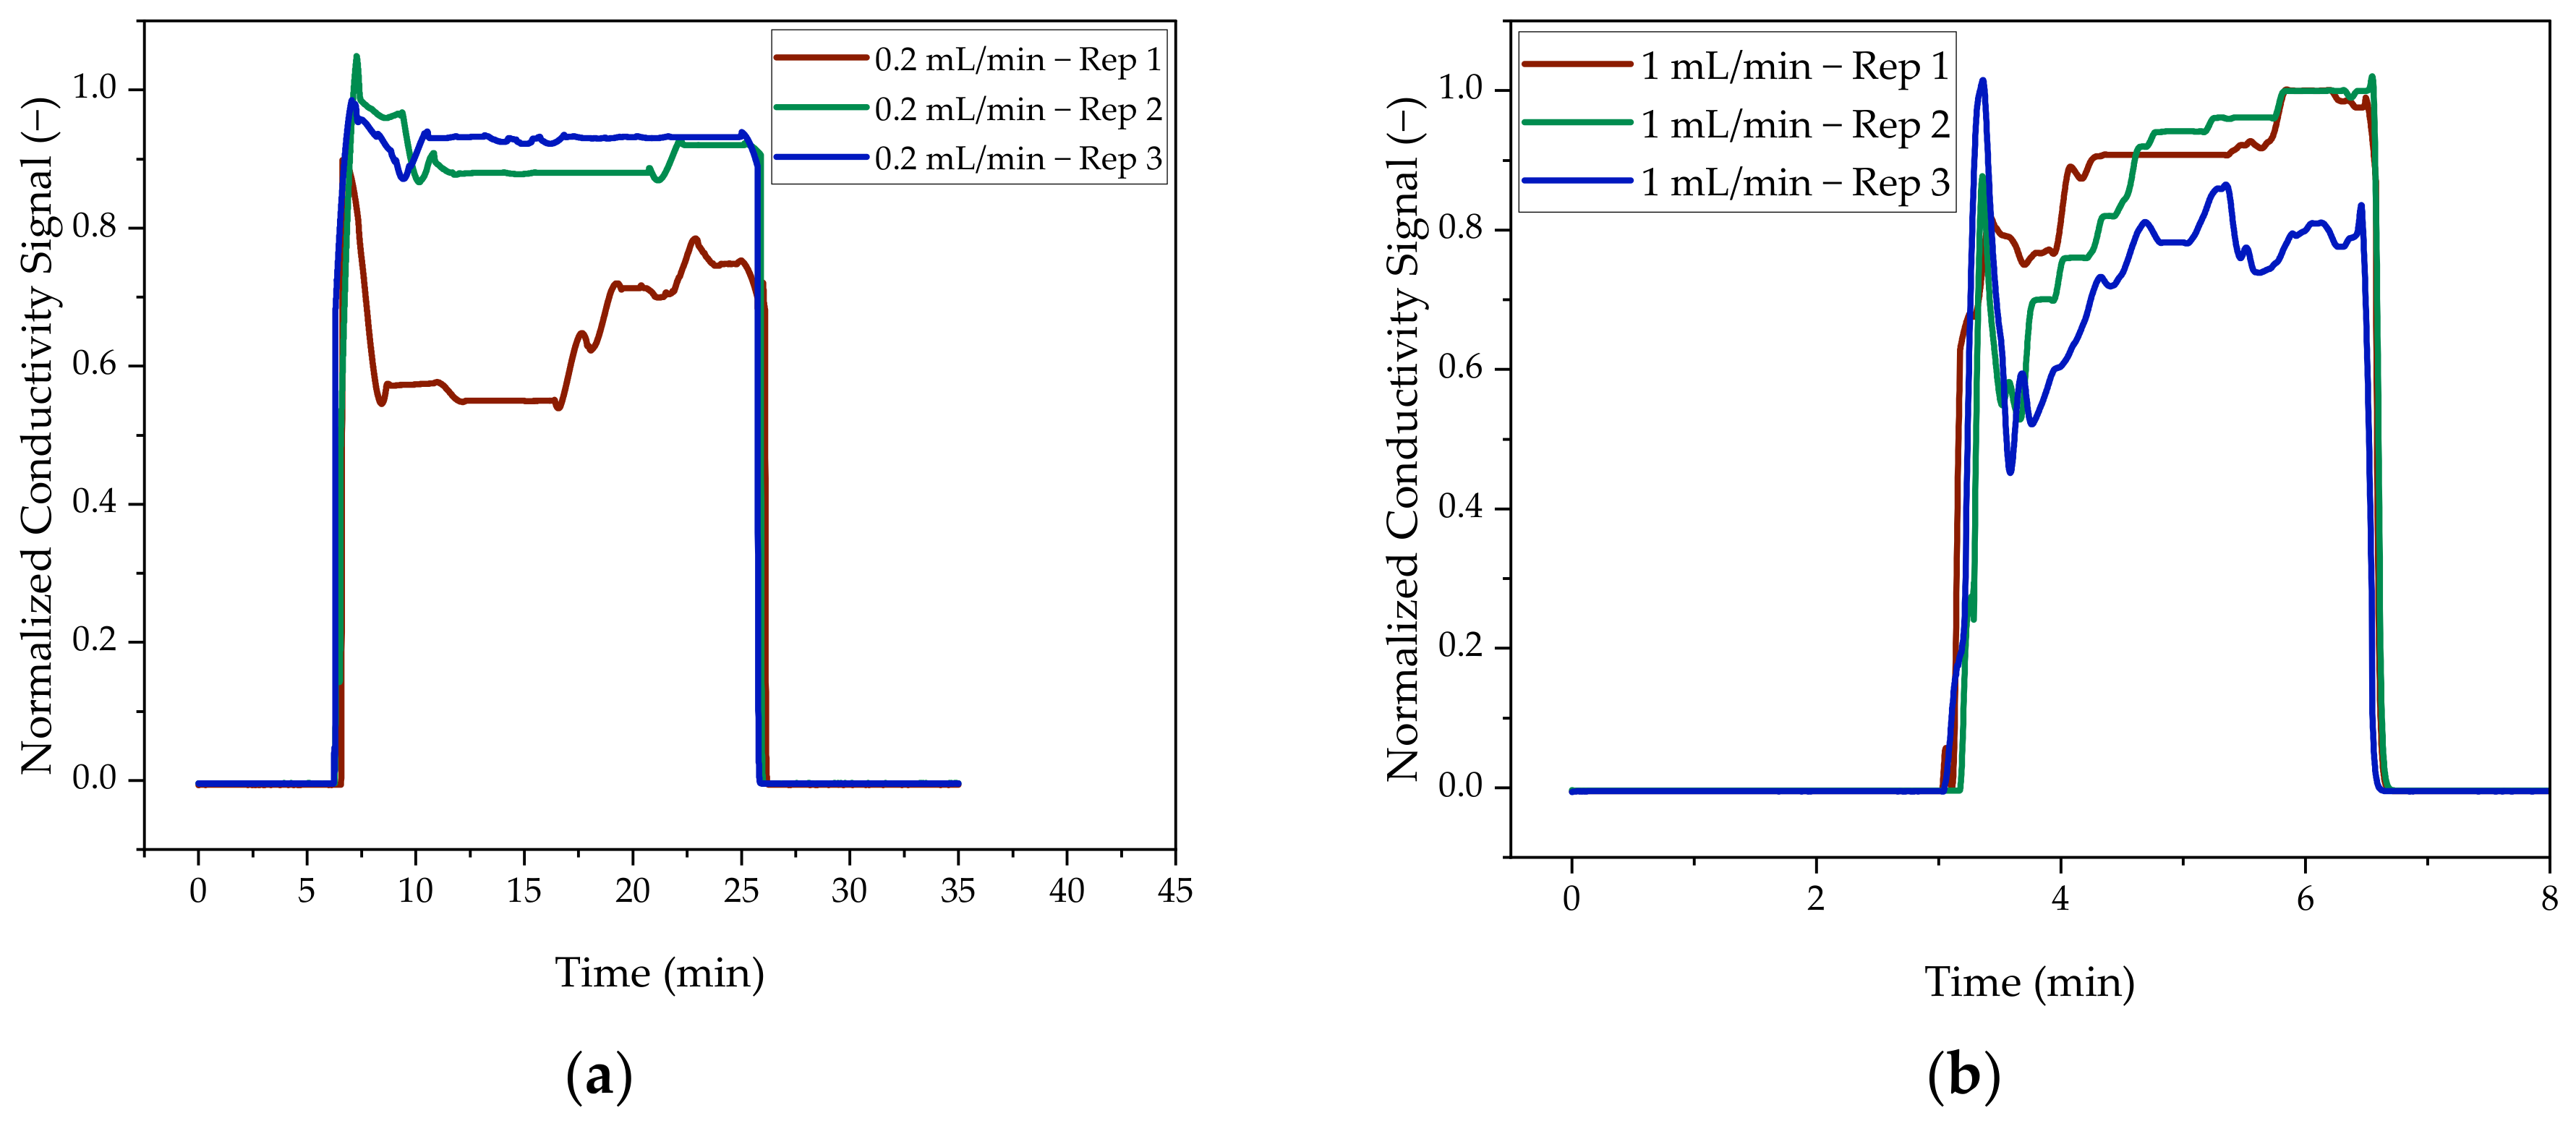
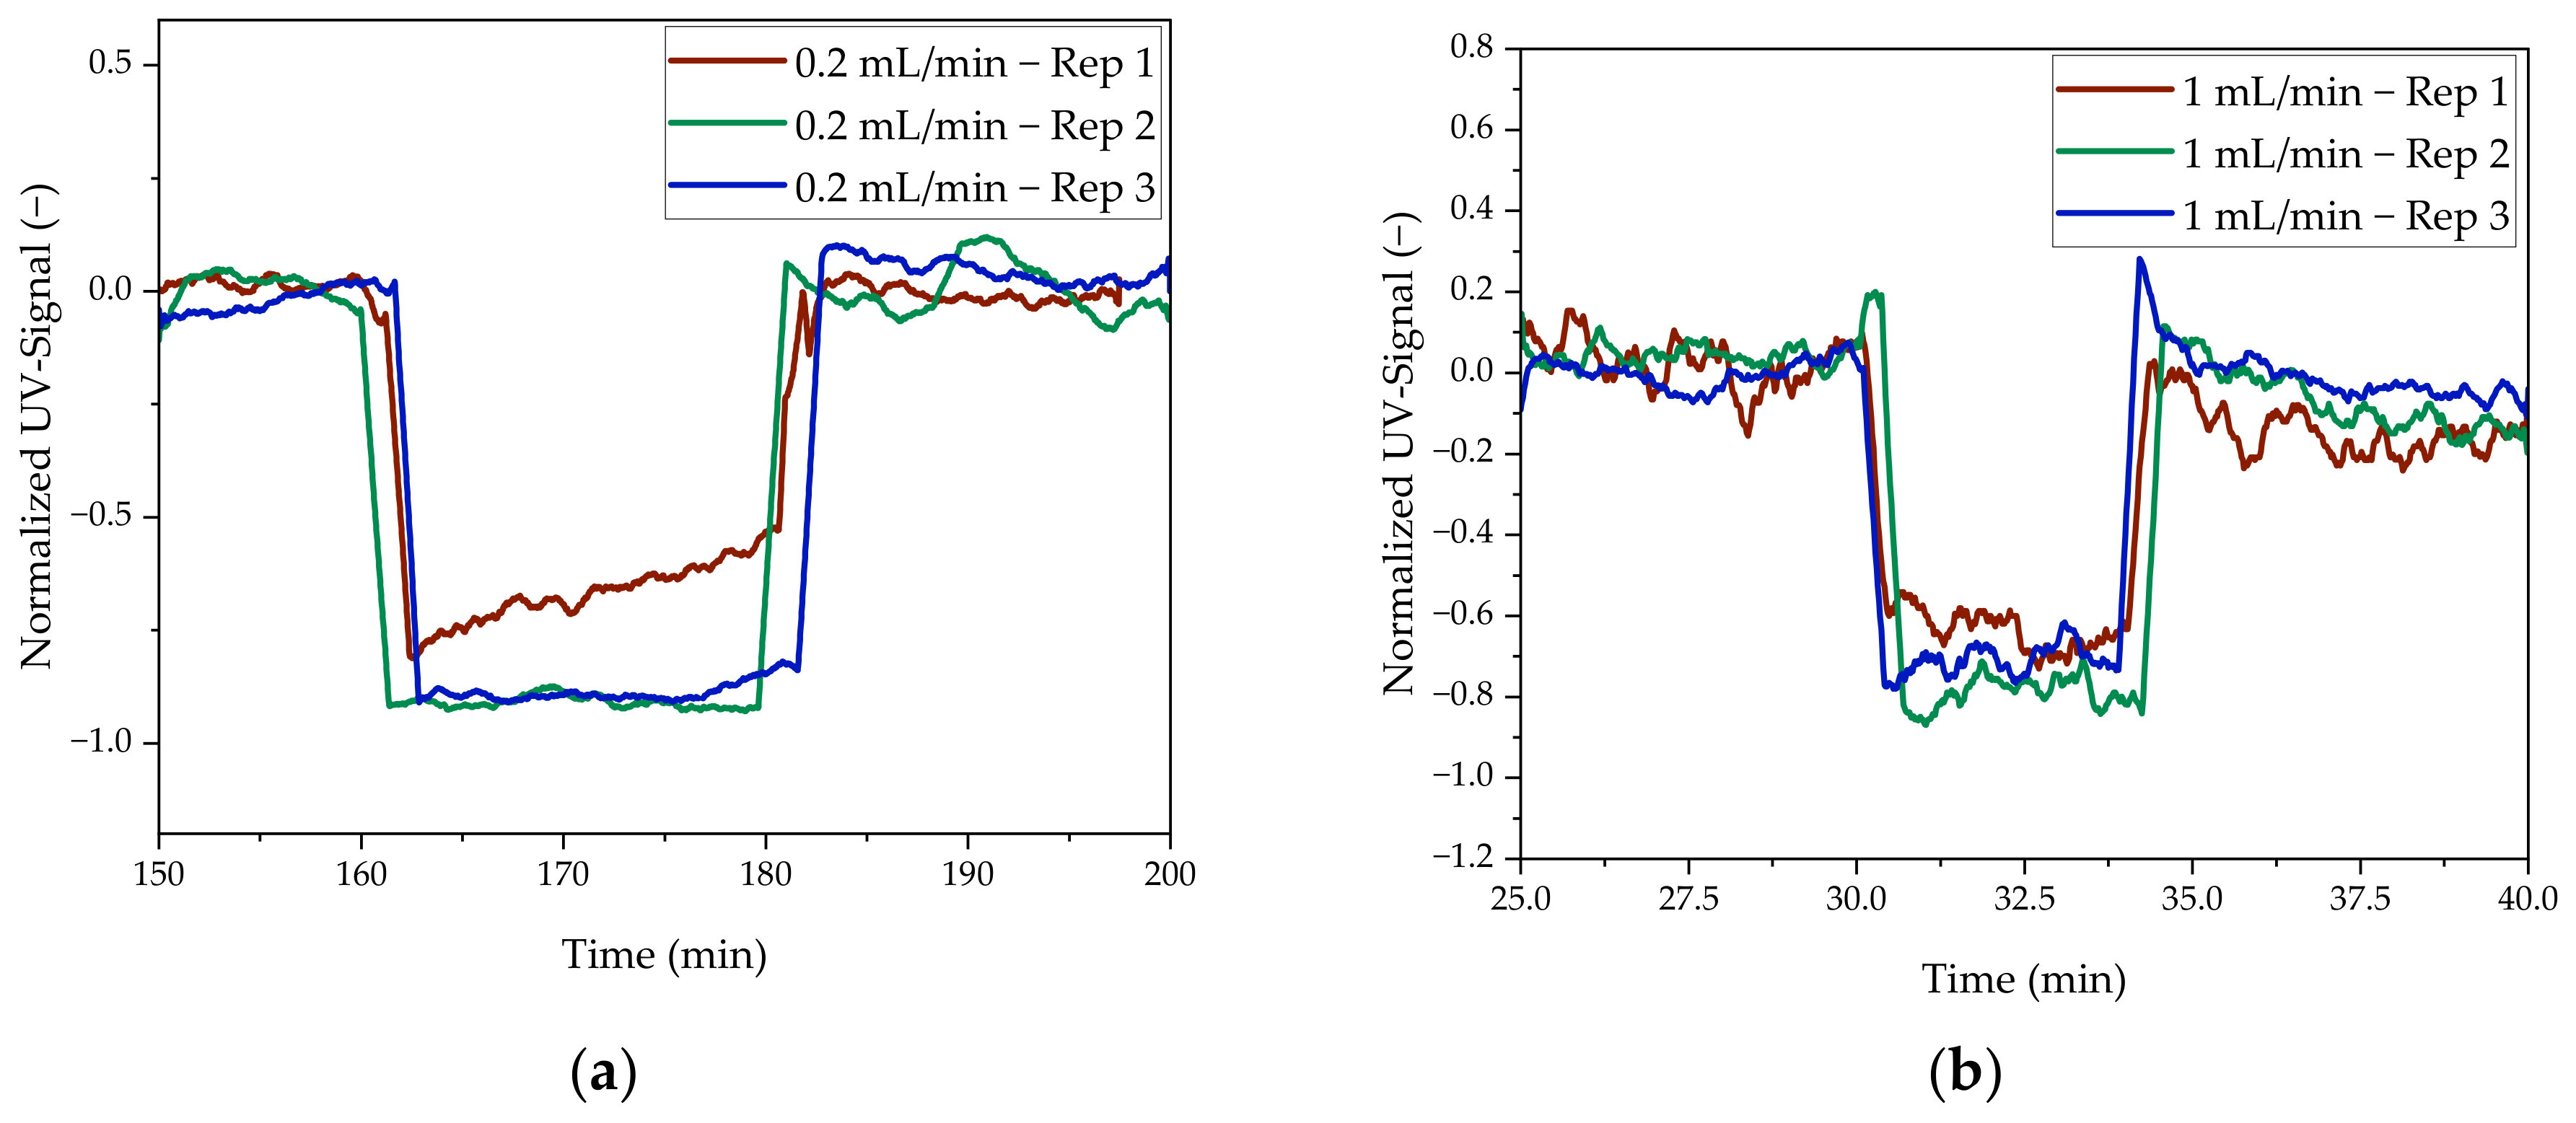
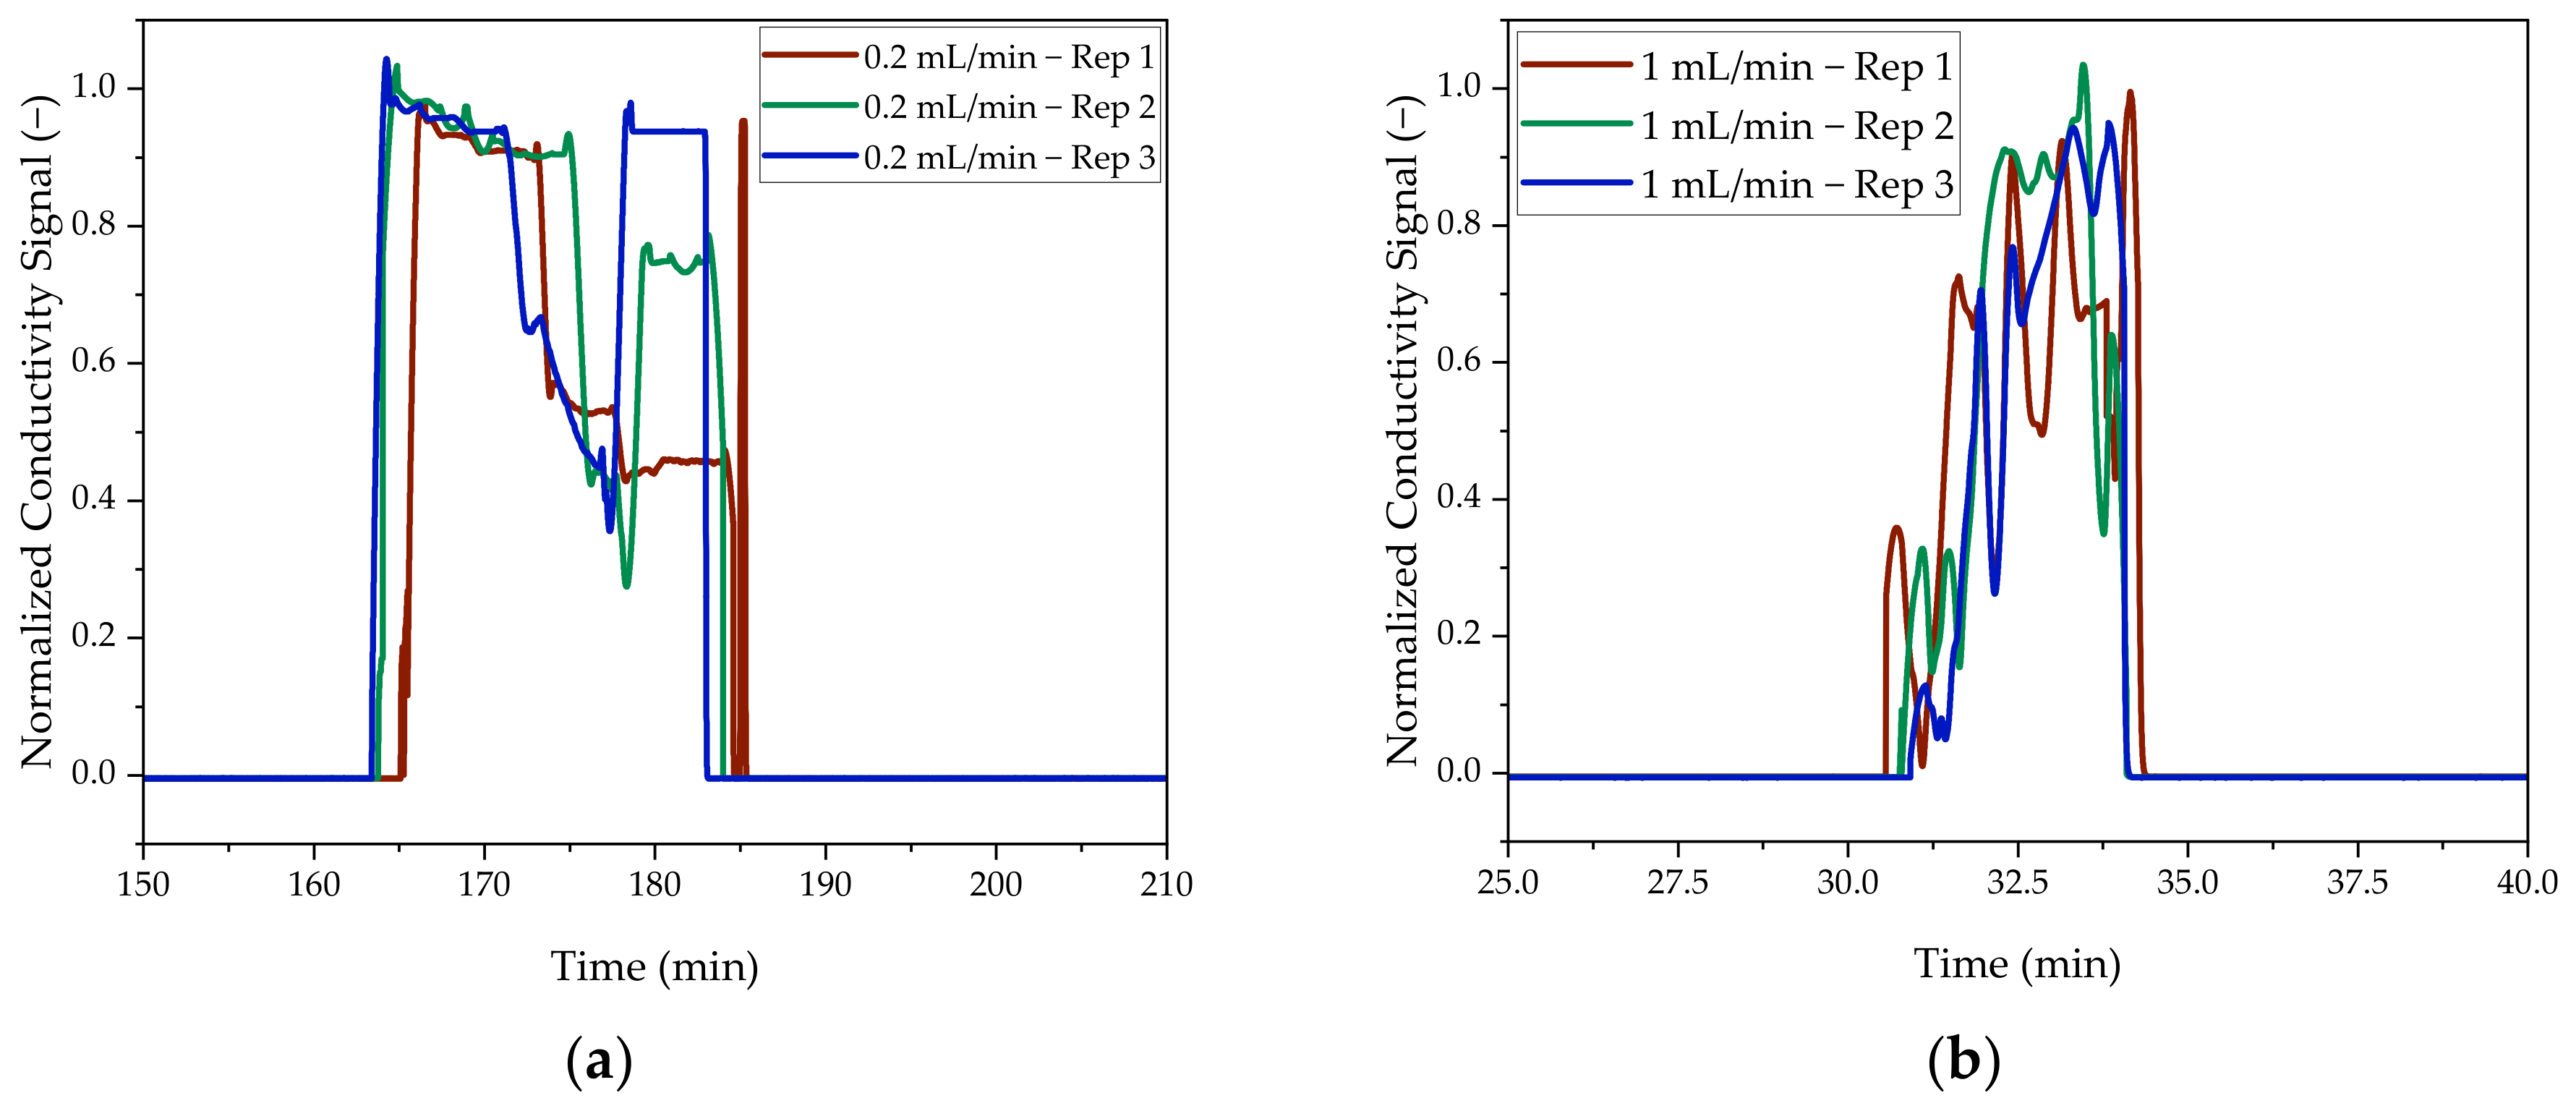
3.1. Slug Flow Accuracy and Precision

To ensure the required residence time of 3 h for the apparatus dimensions, the volume flow was set to 0.2 mL/min (Scenario 2). Furthermore, a volume flow of 1 mL/min (Scenario 1) was used. This is derived from the Reynolds number in line with the simulation study of Helgers et al. [3], at a volume flow of 9.26 mL/min. This volume flow is required to produce 10 million doses in 3 days and correspondents to exactly 40 L transcription volume. With a proposed reduction of the production capacity to 1000 doses with the same equipment, the volume is reduced to 4 mL, which is significantly less than the reactor volume of 1667 mL. The idea of the invention solves this problem by displacing the transcription volume using an apolar phase to fill up dead volume. To eliminate yield loss while preventing product contamination, the transition from the product to the displacement phase must be reliably detected in an automatable process, allowing clean fractionation to occur.

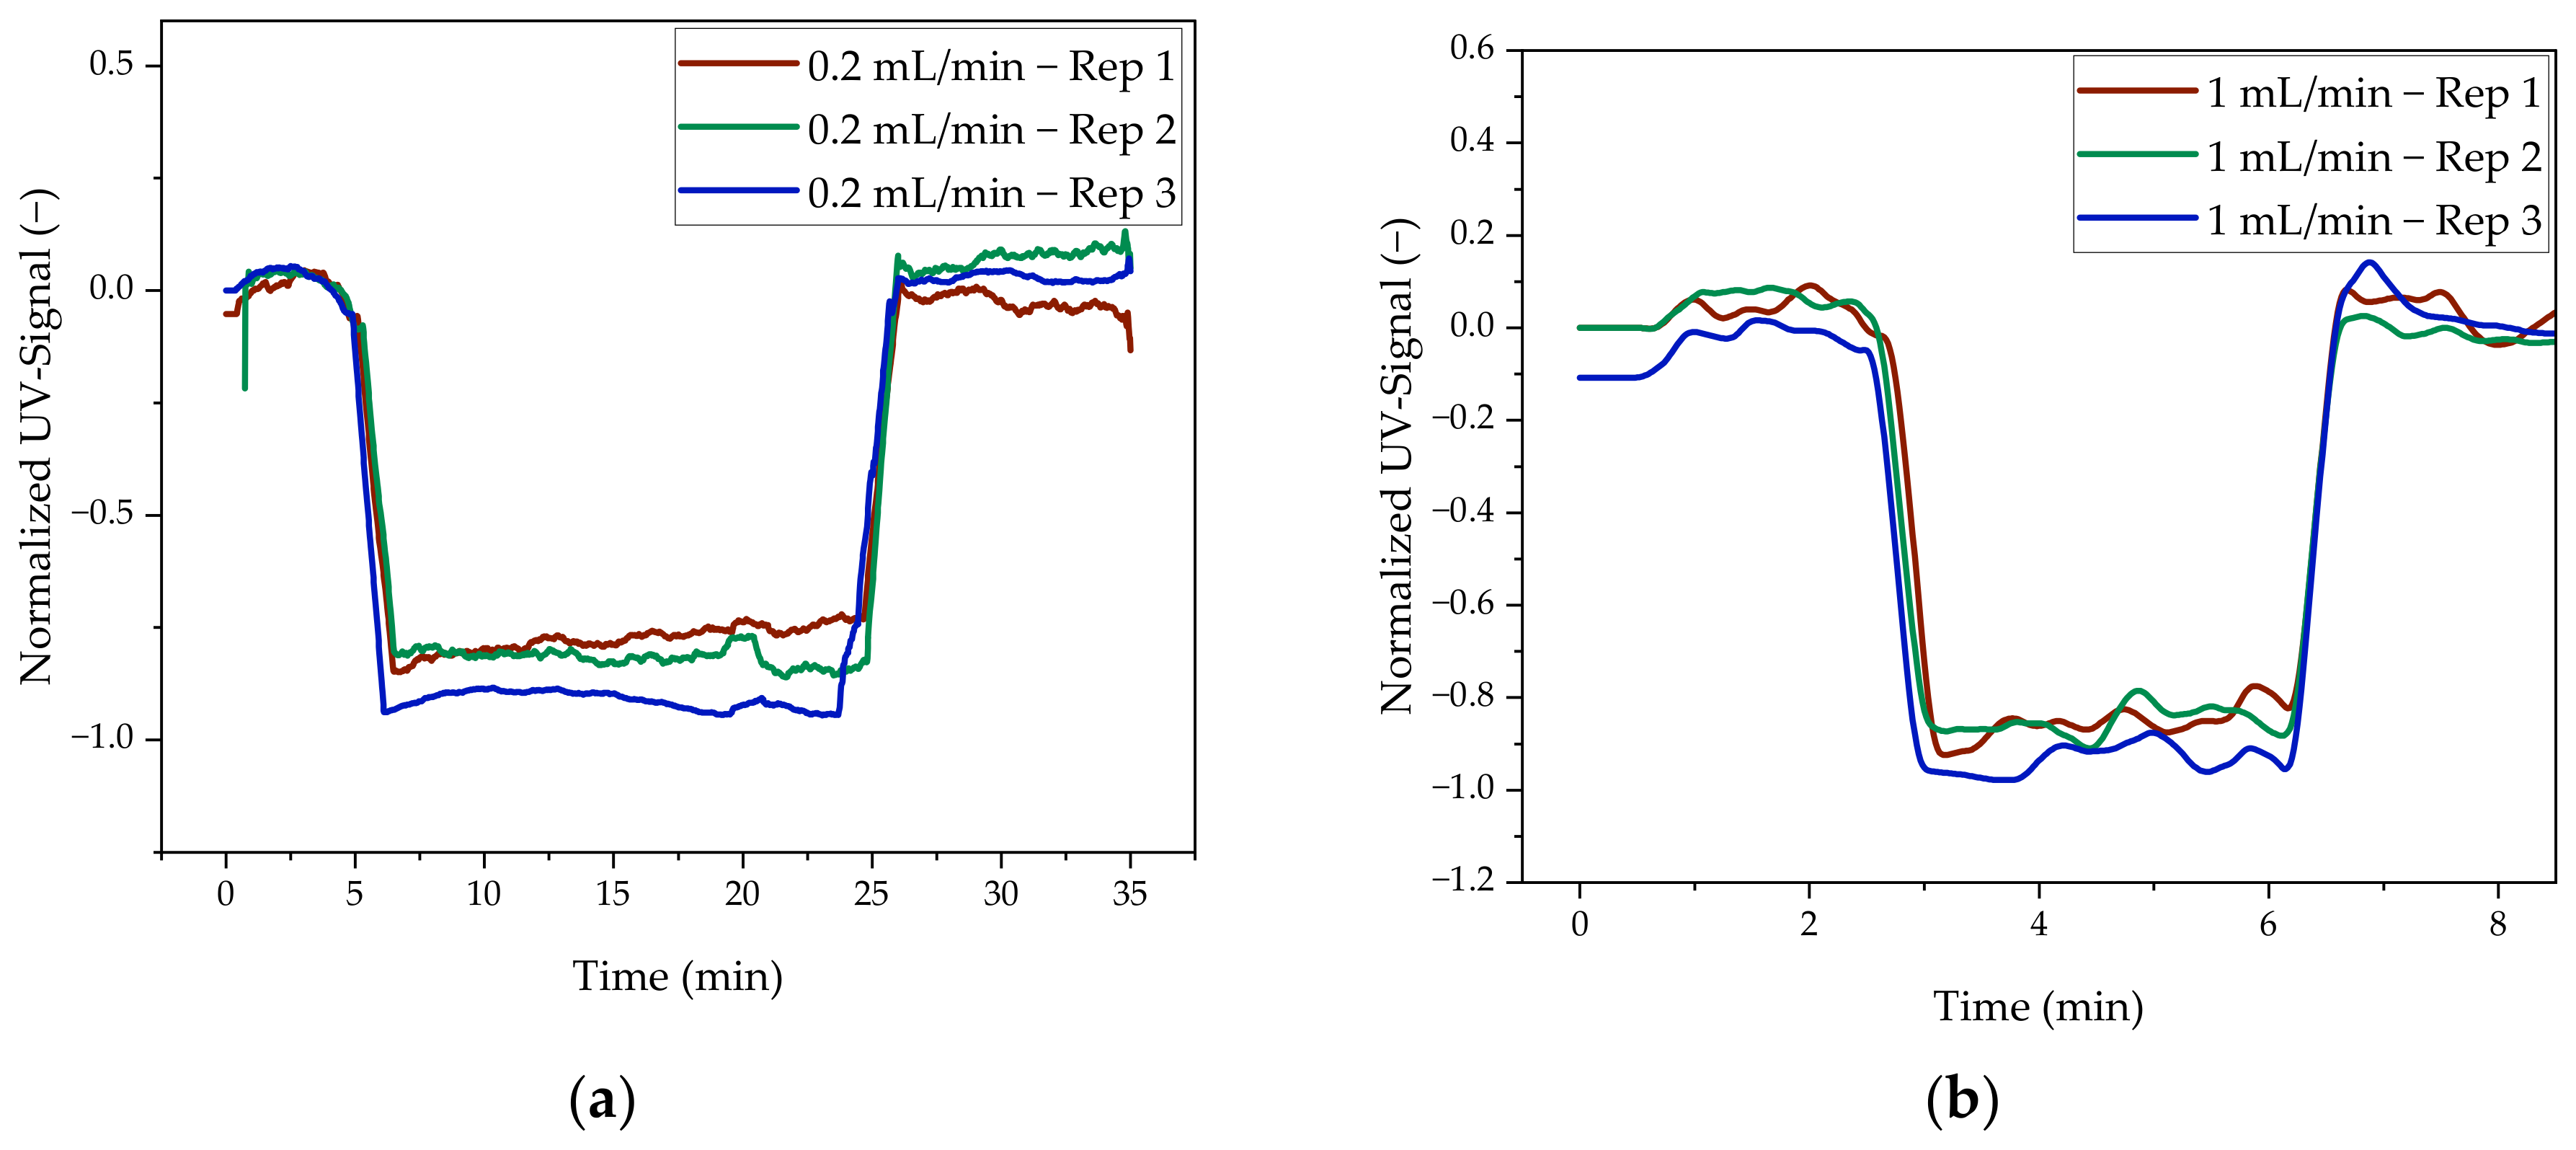
3.1.1. Fluid Dynamic Characterization

After evaluating the input and output signals according to the procedure of Wellsandt [92], a Bodenstein number of about 2.6 × 10 5 for 1 mL/min and 2 × 10 5 for 0.2 mL/min is obtained. Thus, the values for the axial dispersion coefficients (Dax) are 1.55 ×   10 7 and 8.05 × 10 7 , respectively, which are significantly lower than the values calculated by the correlations (Table 4). This can be attributed to the fact that the characteristic parameters determined in this study apply at the phase interface. Consequently, it can be expected that no or hardly any back-mixing takes place here, which is expressed by the small Dax. Between the two Dax there is a factor of about 5, which corresponds to the factor between the two volume flows. Likewise, this factor occurs in the Trivedi–Vasudeva and Saxena–Nigam correlations applicable here.

3.1.2. Slug Flow Accuracy

Figure 8 shows the generation of the slug that displaces the oil phase.
Two different types of PAT detectors were investigated for their applicability to the detection and fractionation of the generated slugs based on their signals. Firstly, UV detectors and secondly, conductivity detectors. These were installed upstream and downstream of the plug flow reactor, respectively, and the input and output signals were monitored. The normalized input signals of the UV detector are shown in Figure 9 for a volume flow of 0.2 mL/min (a) and for a volume flow of 1 mL/min (b). At both operating points investigated, a clear step signal can be seen, indicating that the oil phase does not mix or mixes only slightly with the transcription buffer. The repetitions also show that both the timing of the input signal and its course are reproducible.
The input signals acquired with the conductivity detector are shown in Figure 10. The plot is normalized for both operating points (0.2 mL/min, a; 1 mL/min, b). Once again, the signal increases and decreases instantaneously, so clear phase boundaries can be assumed. However, the signal is unsteady and shows a high measurement fluctuation. A possible reason for this could be that when the valve is switched, small oil droplets disperse in the aqueous phase, which can partially accumulate on the inner wall of the PTFE tube and become detached, leading to a dip in the conductivity signal. The time courses can also be reproduced when measured with the conductivity detector. Slight changes occur only in the qualitative profile.
At the output of the reactor, the UV signal (Figure 11) and the conductivity signal (Figure 12) were also recorded for 0.2 mL/min (a) and for 1 mL/min (b). Analogous to the input signal, the UV detector recorded a distinct step signal. The signal from the conductivity detector at the reactor outlet also enables the start and end of the slug to be detected. However, the signal fluctuations here, especially at a volume flow of 1 mL/min, are greater than those of the input signal. Nevertheless, fractionation can be performed with both output signals. Furthermore, no, or hardly any, temporal shifts (<1%) of the signal occur during the repeat runs.
Based on the detection signal at the outlet of the reactor, the product fraction was then signal controlled for fractionation. The results, particularly with regard to yield and purity, are shown in Table 5 for both volume flows investigated. Furthermore, the percentage compositions of the samples are shown in Figure 13. The purity of the product fraction can also be read from this. A purity of 92% was achieved at a volume flow rate of 1 mL/min and a purity of 98% at a volume flow rate of 0.2 mL/min. Furthermore, the goal was to generate as little product loss as possible during fractionation. A slug of 4 mL, corresponding to a weight of approximately 4.2 g, was targeted in each case. A product phase of 3.7 g (1 mL/min) and 4.6 g (0.2 mL/min) was generated. This can be attributed to fluctuating pump speeds. By implementing a control loop (cf. [5]), it can be ensured that the volume flow is kept constant and therefore the slug contains the desired volume. In this fractionation, a yield of 94% could be achieved for 1 mL/min and a yield of 100% for 0.2 mL/min. A capillary with a diameter of 0.01″ and a length of 4 cm is installed between the detector and the switching valve. The reaction time to achieve a 100% yield, as with a volume flow of 0.2 mL/min, is therefore approx. 0.6 s. Consequently, the lower yield at 1 mL/min can be compensated for by lengthening the connection between the detector and the switching valve, taking into account the reaction time. Thus, the capillary must be extended by a factor of 5 to 20 cm.

3.2. Optimization of In Vitro Transcription in Batch

In vitro transcription conditions were at first optimized and analytics were established based on µL pipetting with the kit application itself [64,65], followed by BNT161b2, which was generated by E. coli fermentation for the test amount supply. The study of Azevedo [49] proves most helpful to starting any DoE.
A custom-made fractional factorial DoE with a resolution of 5 and 35 experimental points including 3 center points was carried out. The materials used, as well as their usage ranges, are listed in Table 1 in Section 2.3.
The yield was determined using PrimaS, and the ratio of single-stranded (ss) to double-stranded (ds) mRNA is shown in RP. In addition, an agarose gel image was obtained. In this, in addition to the RNA ladder (RiboRuler High Range, Thermo ScientificTM, Waltham, MA, USA), the sample was loaded onto the gel at dilution levels of 1:10, 1:20, 1:100, and 1:200.
Statistical evaluation of the DoE with respect to mRNA yield was performed using the common evaluation model OLS (ordinary-least-squares). To improve the prediction of this, an additional reduction of the p-value was performed. The evaluation was also extended by the application of PLS (partial-least-squares) and an ANN (artificial neural network).
The regression quality is sufficiently good with an R2 of 0.99 (OLS), 0.89 (reduced p-value), 0.98 (ANN training), and 0.91 (ANN validation) for all regression models. To be a statistically robust model, the p-value should be less than 0.0001. This is the case for all models. Only the ANN is different, with p-values of 0.67 (training) and 16 (validation).
Significant factors on the yield are, according to statistical evaluation by reduced p-value and PLS, the magnesium acetate concentration and the ratio of NTP:GTP as well as the interactions from NTP concentration and magnesium acetate and the interaction from the ratio of NTP to GTP with magnesium acetate. According to the OLS, only the latter interactions are significant factors. Both the high R2 and the fact that no predictions can be made with the OLS regarding an optimum operating point indicate that the model is overfitted.
The prediction of the optimal operating point gives very similar results to the other three models. Accordingly, this is at an NTP concentration of 10 mM, an NTP:GTP ratio of 1, and a magnesium acetate concentration of 50 mM. Both temperature and pH are not significant factors in all models, but show a tendency that higher yields may be possible at lower values of these.
As evaluation by PLS has the greatest significance with large data sets, such as spectral data, the results of the OLS with a stepwise reduction of the p-value are shown in the Figure 14 below.
In addition to the R2 and the p-value, the adj. R2 was found to be 0.88 for the statistical analysis with OLS and stepwise reduction of the p-value; the residuals of the experiments were used to evaluate the model quality (cf. Figure 15). Figure 15a suggests homoscedasticity due to the random scatter of the residuals in an approximately constant-width band around the identity line. Furthermore, a normal distribution of the error terms can be assumed, since the normal probability diagram of the residuals (Figure 15b) is approximately linear.
In addition, the statistical evaluation of the DoE allows design spaces to be spanned (Figure 16). Analogous to the prediction of the optimal operating point, a high magnesium acetate concentration, a high NTP concentration, and a low NTP:GTP ratio positively influence the mRNA concentration produced.
Subsequently, the predicted optimal operating point was repeated with a 10 mM NTP concentration, an NTP:GTP ratio of 1, and a magnesium acetate concentration of 50 mM. As no significant effect was observed for both pH and temperature, these were set to 8 and 37 °C, respectively. A comparison of the optimal operating point from the DoE (a) and its reproduction with (c) and without (b) cap analog is shown in Table 6. Here, the mRNA concentration without cap analog hardly deviates from the DoE result with <1% and is thus well reproduced. If cap analog is added, the mRNA concentration drops to 10.5 g/L, which can be attributed to the use ratio of cap analog to NTP of four.

3.3. Determination of the Characteristic Enzymatic Kinetic Parameters

To determine the characteristic parameters of enzymatic reactions, the Michaelis–Menten constant and the turnover number, the substrate concentration used was varied and samples were taken at different times. Figure 17a shows the time courses. From these, the reaction rate can be determined from the linear range present at the start of the reaction. This is plotted in the Michaelis–Menten plot (Figure 17b) against the substrate concentration used. Because it is difficult to determine the parameters from this plot, the values are plotted reciprocally in the Lineweaver–Burk plot (Figure 17). The y-axis intercept represents the reciprocal maximum reaction rate, and the x-axis intercept represents the reciprocal Michaelis–Menten constant. The conversion rate can be determined from the maximum reaction rate if the enzyme concentration is known.
The evaluation yields a Michaelis–Menten constant of 164 µM and agrees with values from the literature (160 µM [93]; 190 µM [94]). The conversion rate of 0.01 1/s is also within the range obtained from the BRENDA enzyme database (0.025–0.88 1/s) [95].

3.4. Determination of Capping Efficiency

For the determination of the capping efficiency, a two-step enzymatic digestion of uncapped mRNA was performed. Figure 18 shows the RP chromatogram of the initial solution and the sample after the two-step enzymatic digestion. A capping efficiency of 71% was obtained.
Table 7 shows the comparison of different kit manufacturers with the results obtained in this study. In the kit from Thermofisher (TF), the cap analog m 7 G(5′)ppp(5′)G is present, with which one can achieve a capping efficiency of up to 80% at an NTP:GTP ratio of 1:4 [64]. The same capping efficiency is said to be possible with the cap analog ARCA from Jena Bioscience (JB) [65]. TriLink claims a capping efficiency of up to more than 95% for CleanCap AG at an NTP:GTP ratio of 4:5 [66]. Consequently, for the reaction parameters used in this study, further optimization is necessary to increase the capping efficiency. The other comparative parameters listed in the table, such as yield and NTP turnover rate, agree very well with those of the reference kits.

3.5. Feasibility of Continuous IVT in the PFR

After identifying the optimal operating point in batch, feasibility of continuous production of mRNA in the PFR will be demonstrated. The setup used (Section 2.1), including the PAT pathway, is shown in Figure 6 in Section 2.1.
Ethyl oleate served as the hydrophobic phase, and a volume flow rate of 0.2 mL/min was set to achieve a residence time of 3 h (see Section 3.1.2). Each reaction consisted of a volume of 300 µL.
In addition, during the transfer to continuous production, urea was added to the buffer to improve the ratio of single-stranded to double-stranded mRNA, as described in the literature [96]. Table 8 shows the comparison between IVT in PFR with (Table 8c) and without (Table 8b) the addition of urea as well as the IVT in batch mode (a). The yield in the PFR was 11.2 g/L ± 5%. When urea was added, 42% less mRNA was produced, but the ratio of ss:ds mRNA shifted to 3.5:1, so that, in total, more single-stranded mRNA was produced. This leads to an optimization problem, which could be investigated further.

3.6. mRNA Quality in Batch and Continuous Mode
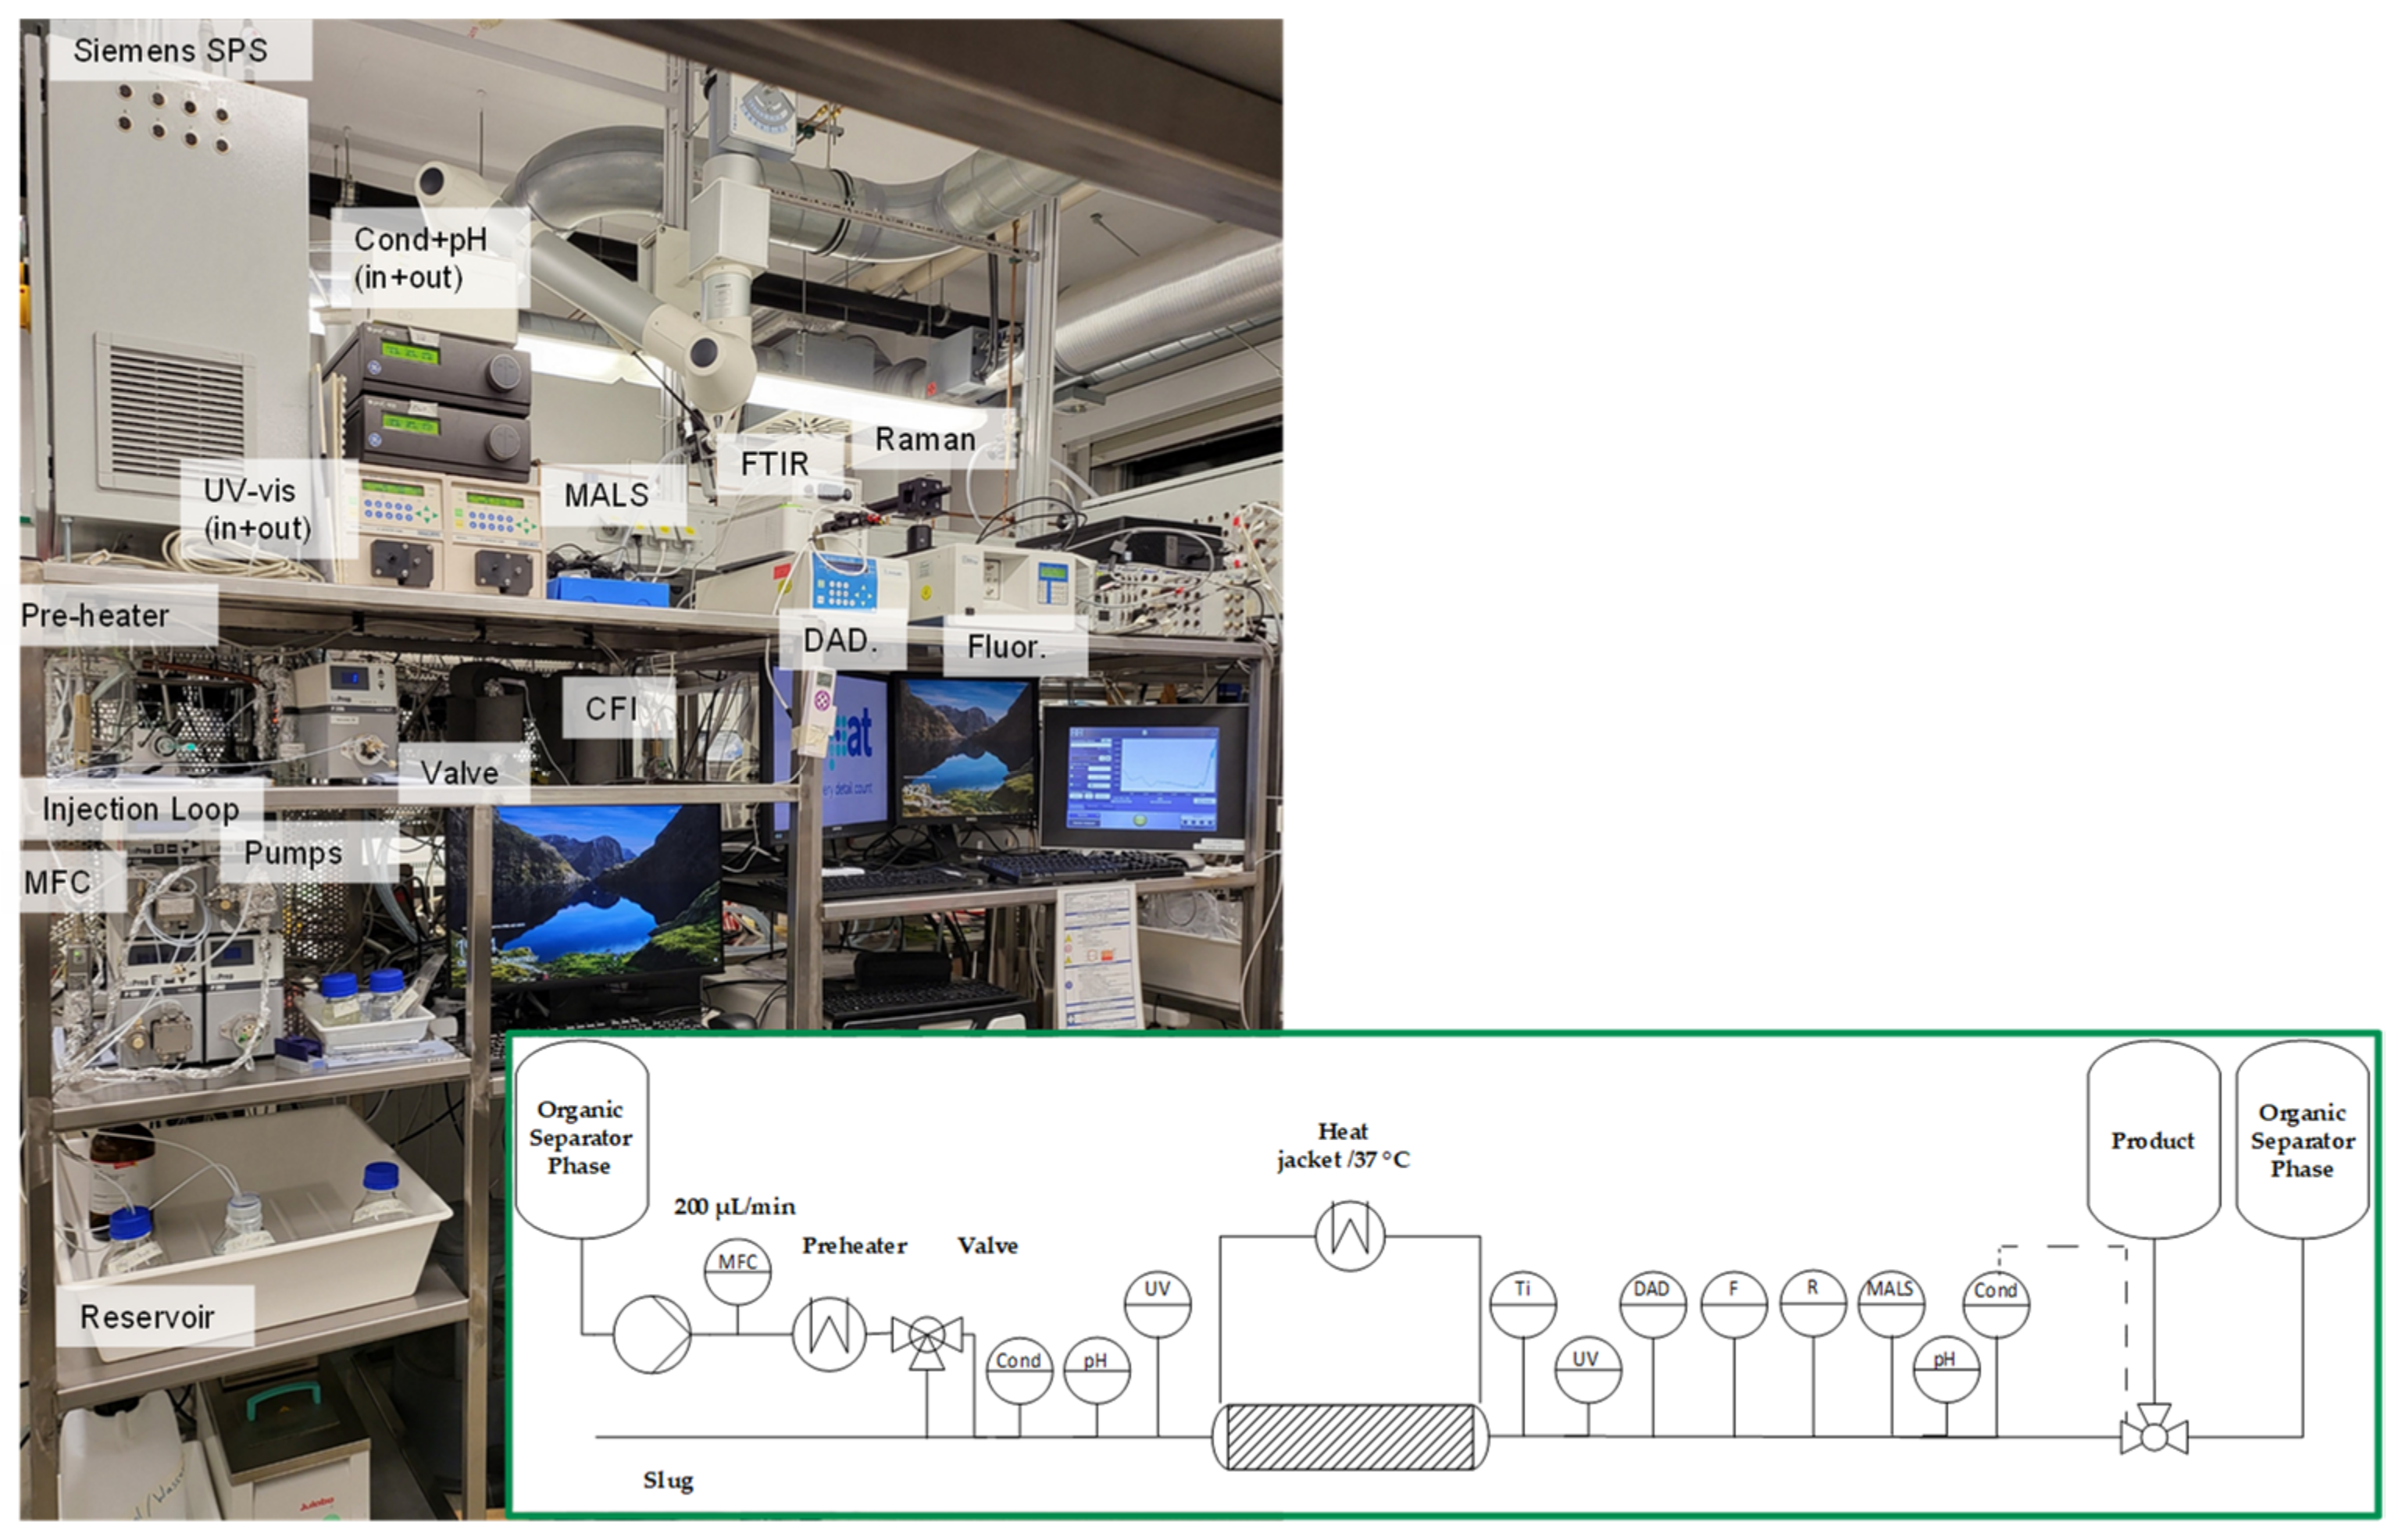
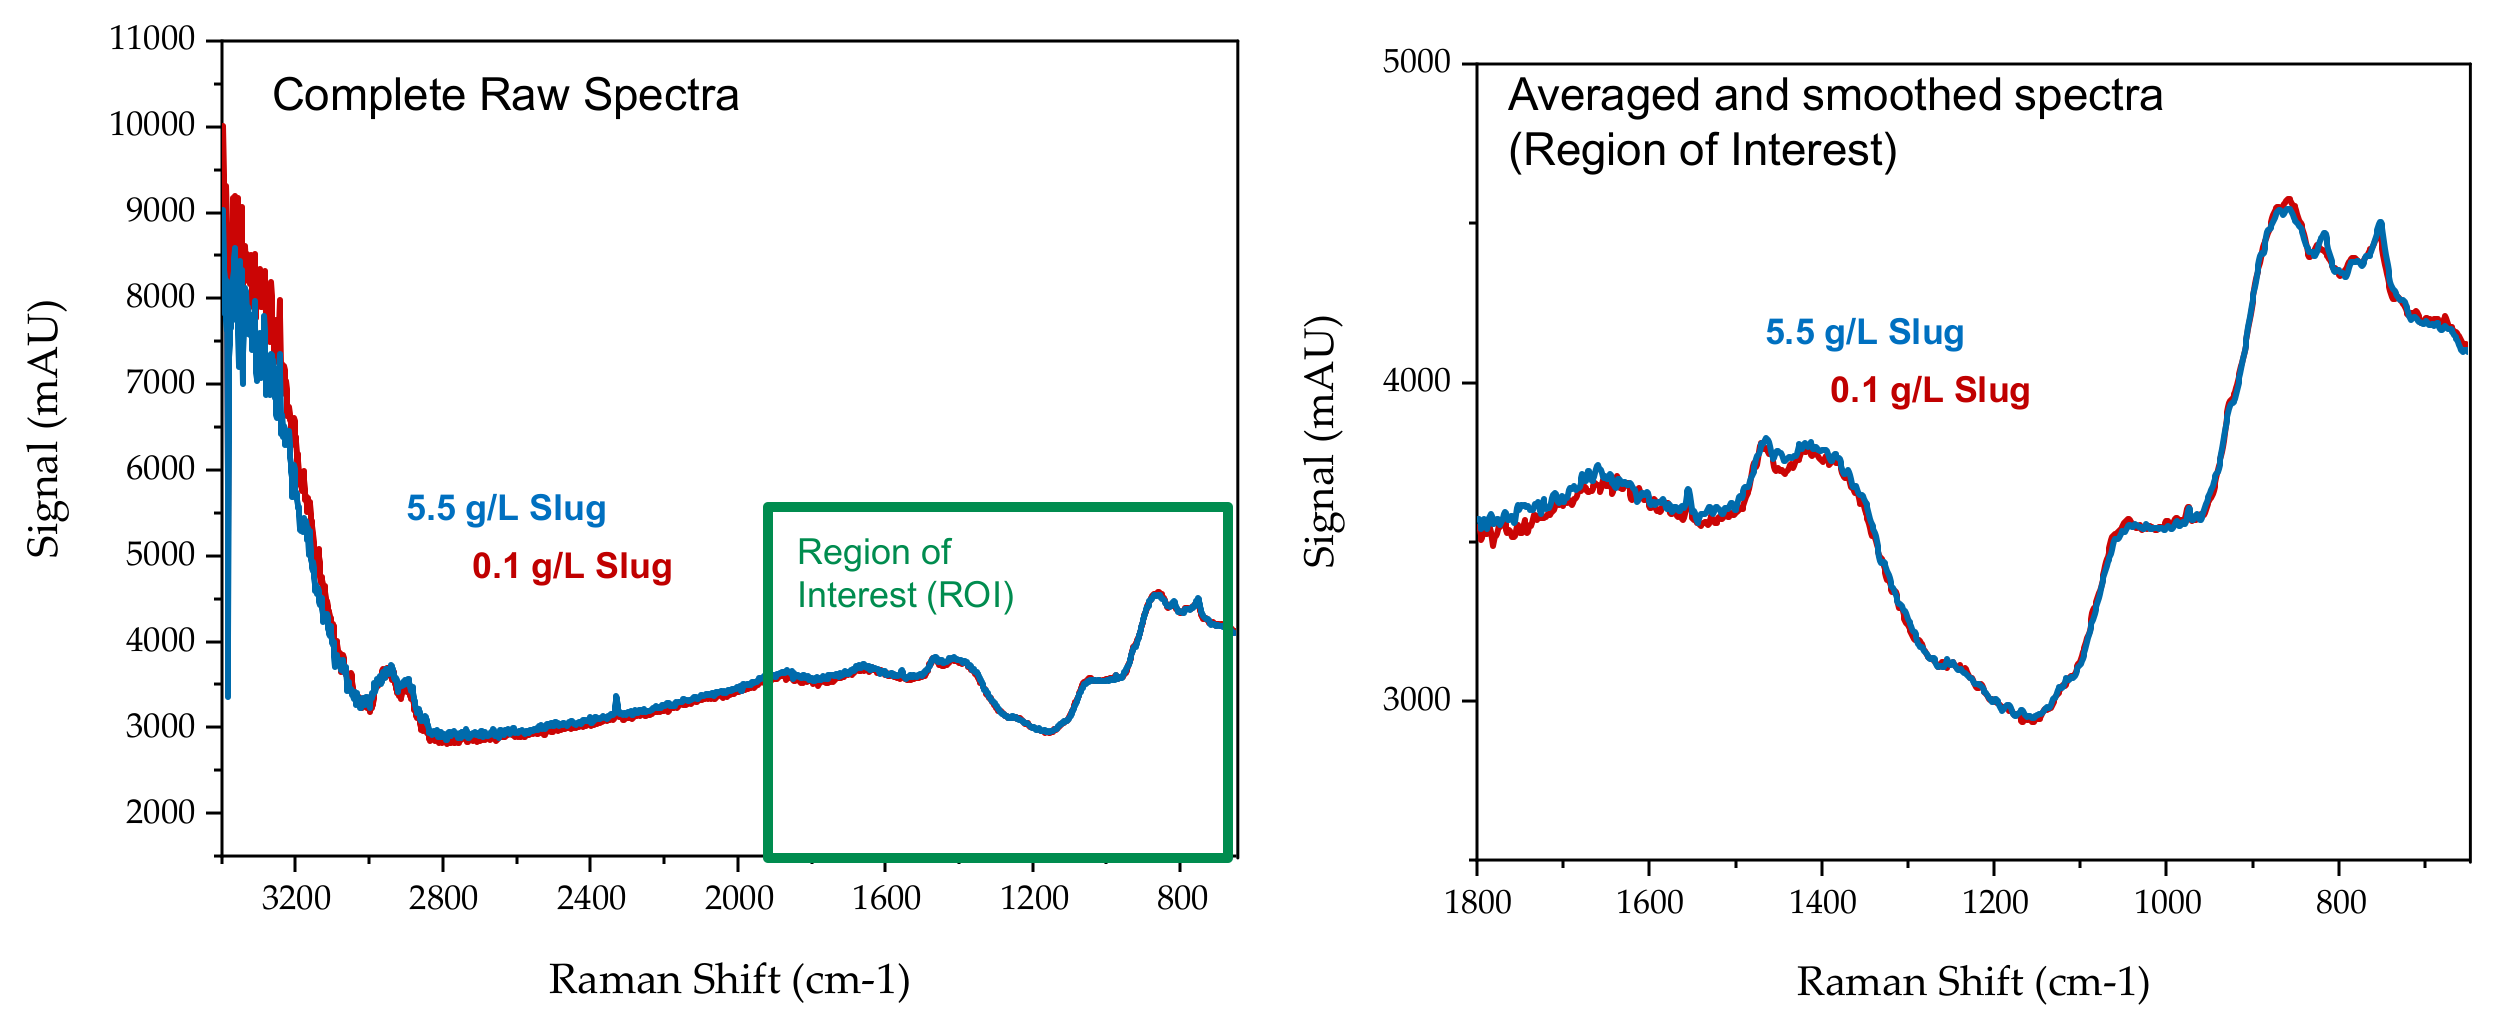
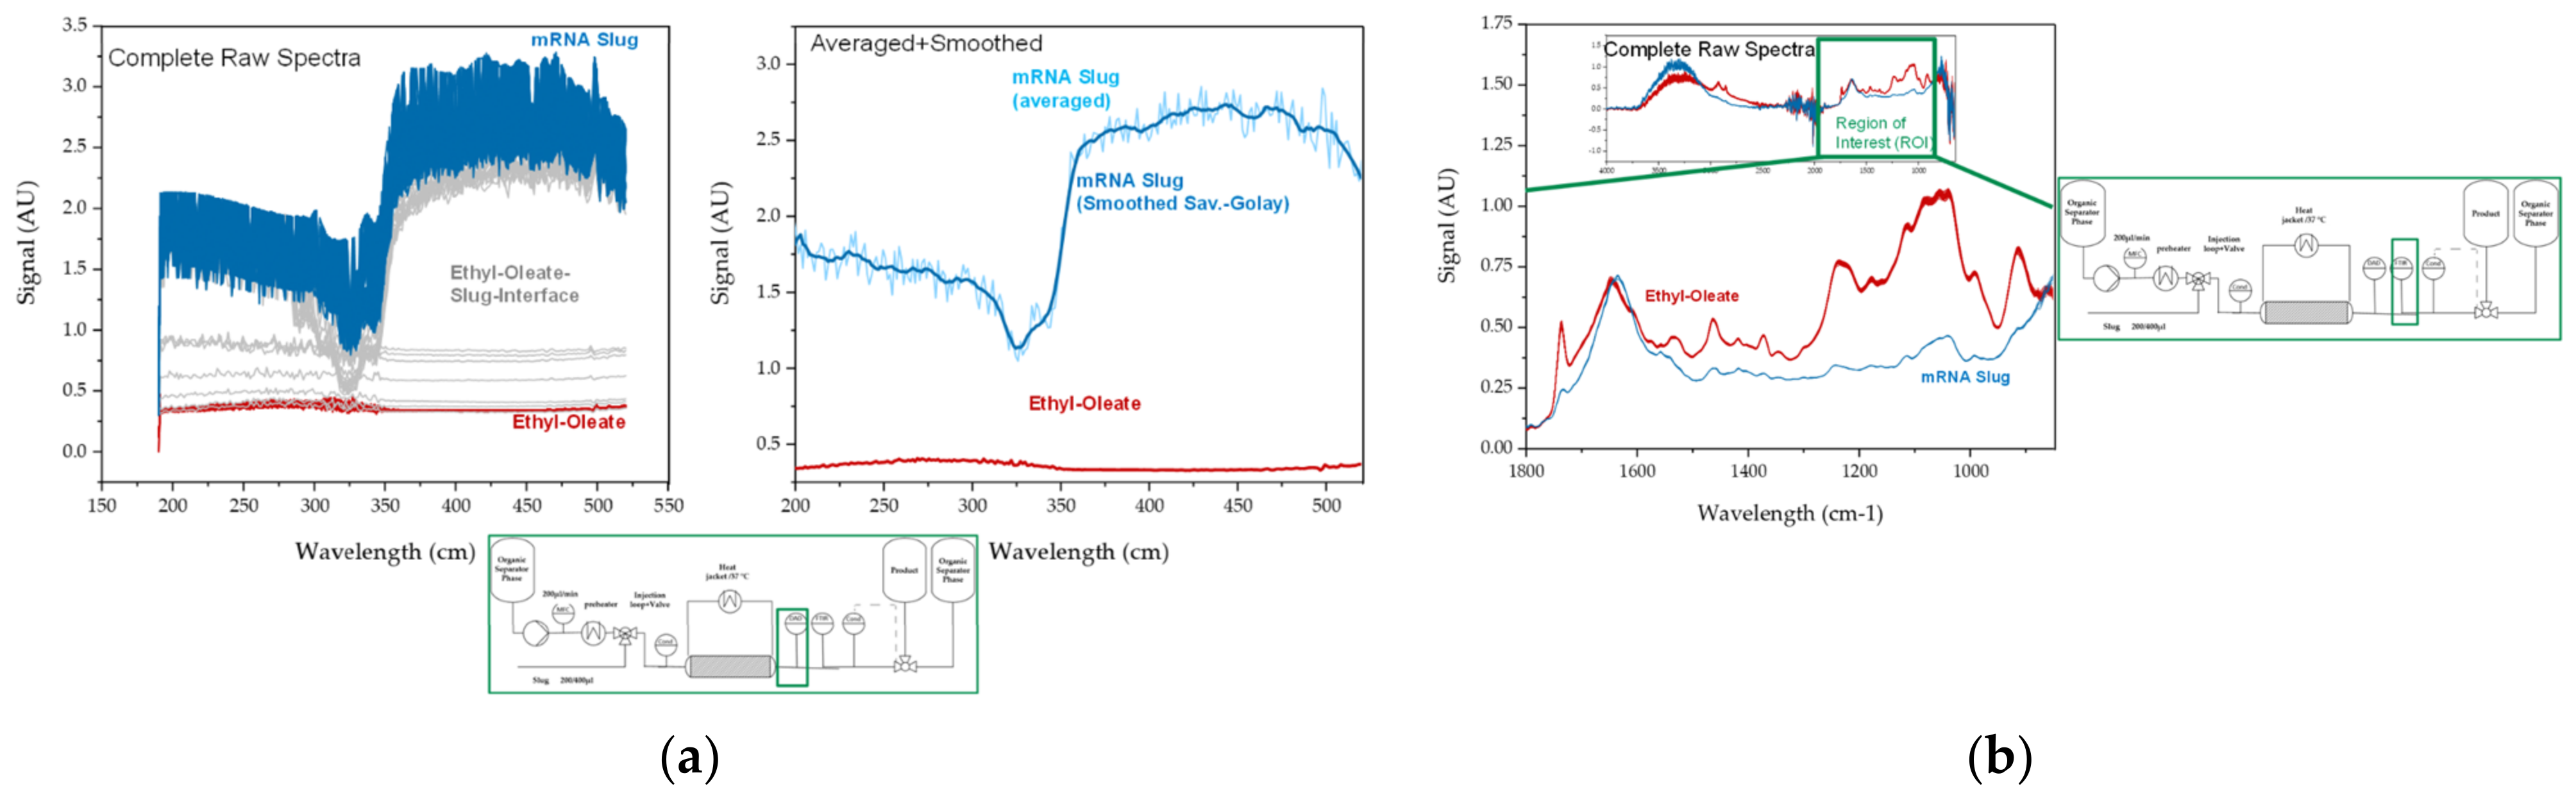
A DoE was evaluated from 35 reactions of varying temperature (37–43 °C), NTP:GTP ratio (1–5), NTP amount (5–10 mM), and MgAc amount (12–50 mM), as well as pH (7–8).
The best operation point resulted from NTP:GTP 1:1, NTP 10 mM, and 50 mM MgAc. Temperature and pH were not identified as significant factors for the IVT.
Table 9 shows the comparison between the optimal operating point of in vitro transcription from the DoE (a) and IVT in the PFR, with (c) and without (b) the addition of urea. The yield in the PFR was 11.2 g/L, therefore it is comparable to that in the batch. When urea was added, 42% less mRNA was produced, but the ratio of ss:ds mRNA shifted to 3.5:1.
The conversion rate in the slug reactor configuration reached about 86%. This is comparable to the batch consumption, which was near 91%. The addition of urea lowered this to 49%. Root cause analysis showed a shift towards ss mRNA, therefore, in the future, the operation conditions in a continuous operation with urea will be optimized further. However, the intended proof of concept was achieved.
This optimal operation point operated in batch was successfully reproduced in 300 µL slug flows in the PFR. The kinetic evaluation delivered results which were similar to the literature [93,94,95] and used for the improvement of the digital twin [3,5].

3.7. PAT Concept

For automatic process control, it is necessary to have real-time information about the product. Process analysis technology is needed for this. Test samples were therefore analyzed with the PAT station containing all of the devices, such as DAD, Raman, FTIR, MALS/DLS, and fluorescence, described in detail before [7,67,70].
The experimental setup is shown in Figure 6 in Section 2.1.
Both in the fluorescence spectra (not shown here) and in the spectra of the Raman detector used (see Figure 19), no difference in the region of interest could be detected between different mRNA concentrations.
Fluorescence and Raman did not show sufficiently high sensitivity, as expected. However, DAD and FTIR were an option for high and low concentrations.
Thus, the experimental setup was changed, as shown in Figure 20.
In contrast, there was a strong difference in DAD (a) and FTIR (b) spectra between ethyl oleate and the slug (see Figure 21).
In addition to the spectroscopic methods mentioned above, a MALS/DLS detector was tested. As an example, the course of the hydrodynamic radius (blue line), which is obtained from the DLS signal (blue dots), is shown over time in Figure 22. The detector was located behind the RP chromatograph. The slug from the PFR is shown in Figure 8. The radius ranges from about 10 to 25 nm. This is in the order of magnitude published in the literature [97]. Furthermore, the measured size of the second peak is larger than that of the first peak, which is consistent with the functionality of RP, in which larger molecules are more strongly retained.

3.8. Recycling at IVT
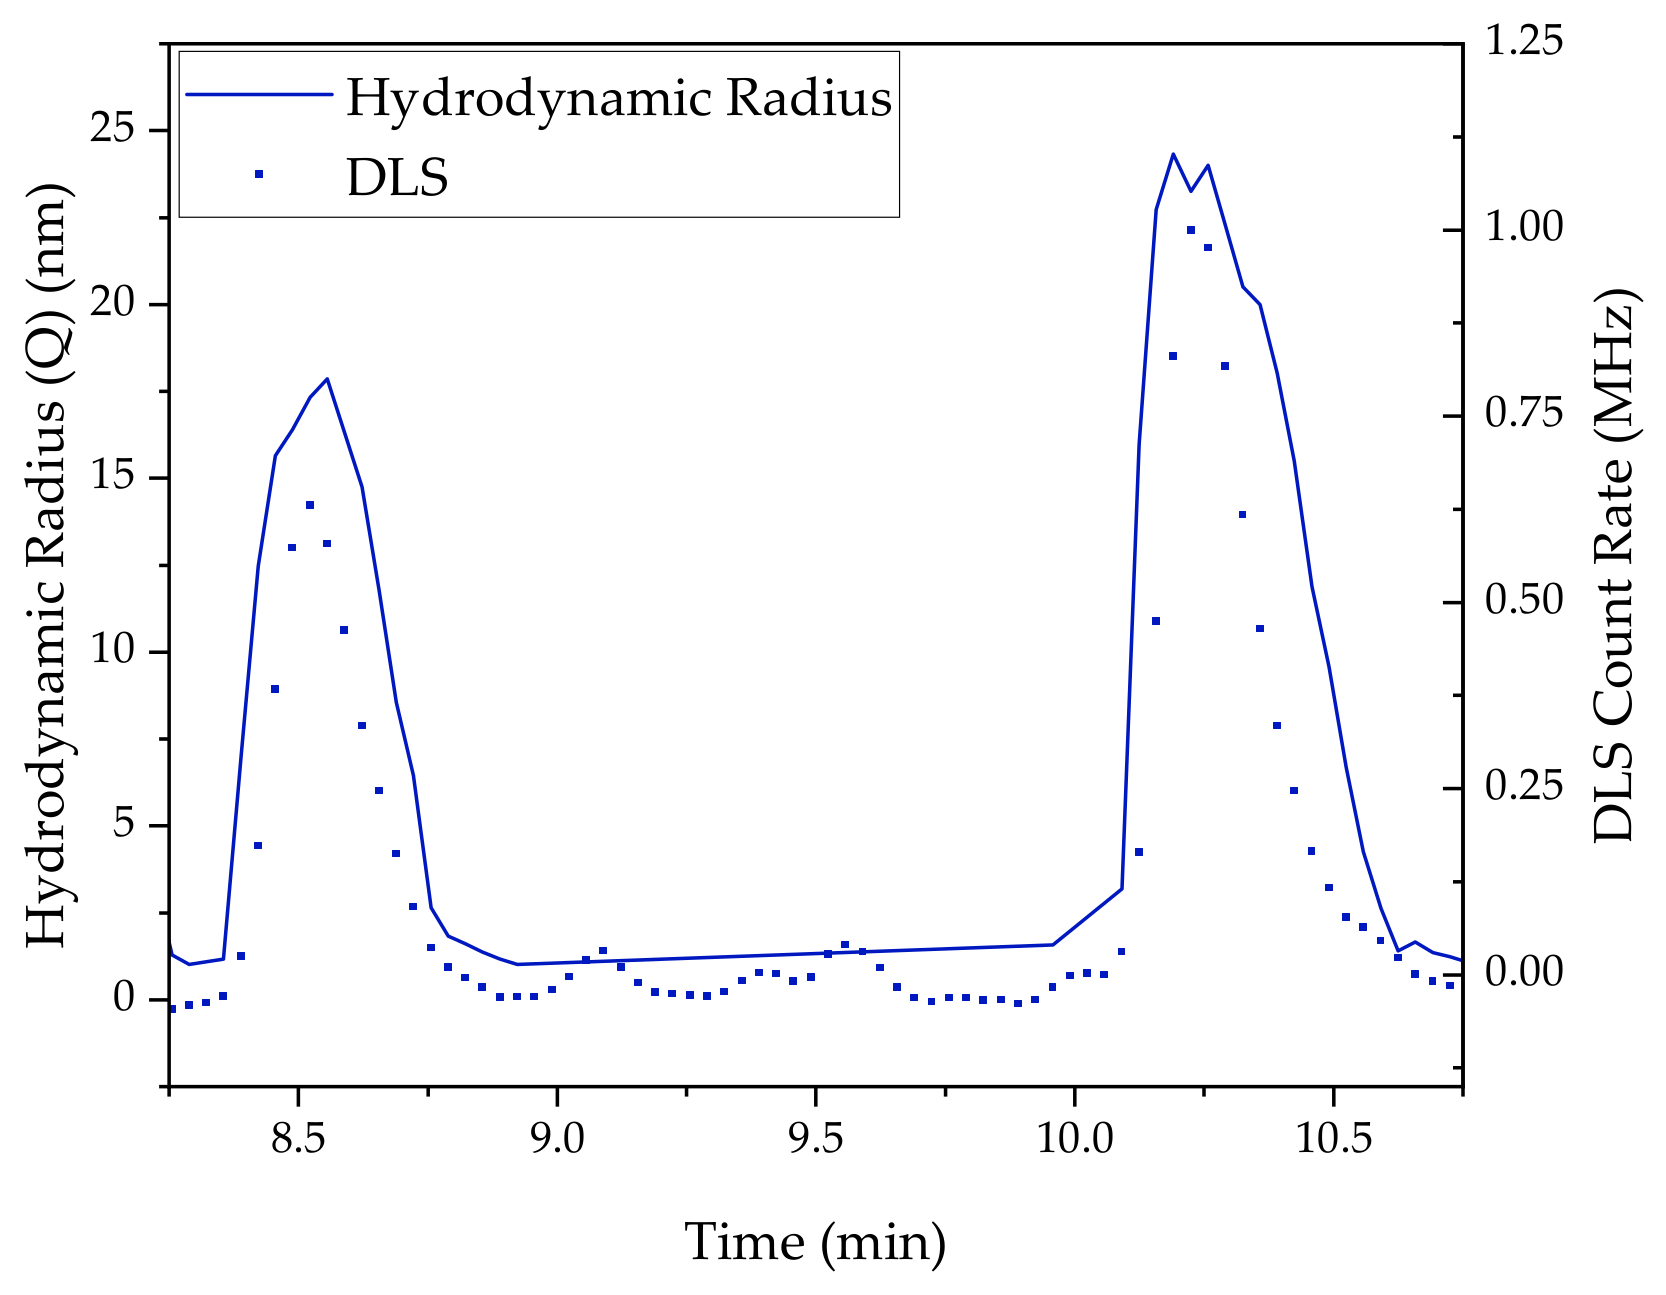
After IVT in the PFR, a buffer exchange was performed using ultra- and diafiltration (UF/DF). This was intended on the one hand to prepare for the following chromatographic steps and on the other hand to separate initial impurities and media. Before starting the UF/DF, the feed (800 µL) was diluted to 2 mL. For the UF/DF, a hollow-fiber module with a cut-off of 300 kDa was used. The course of the buffer exchange (Figure 23a) and chromatographic analysis (Figure 23b,c) of the permeate and feed is shown. At the beginning of the UF/DF, a permeate flux (LMH) of 50 L/m2/h is achieved. As the buffer exchange proceeds, this first decreases almost exponentially and finally approaches a constant value of about 15 L/m2/h. The TMP starts at approx. 0.05 bar and increases over the course of the diafiltration to a value of approx. 0.8 bar.
From the chromatograms, it can be seen that the mRNA is completely retained and both the NTPs and the cap analog can be separated. Thus, not only is the mRNA purer in the retentate, but recycling of the costly cap analog is also possible.
The fact that no mRNA is transferred to the permeate can also be seen in the gel images in Figure 24. Here, clear bands can be seen in the retentate (c), whereas nothing can be seen in the permeate (b).
For the scale-up to the production capacity of 10 million doses, a membrane area of 10.7 m2 would be required, which is quite reasonable. As mRNA product removal and separation of all smaller nutrients such as NTP, GTP, polymerase, cap-analog, and salts works with such a high performance, that any following multicolumn countercurrent solvent gradient purification (MCSGP) with mixed mode or ion exchange is not necessary, because the PCC based on the RP separation mechanisms works quite well alone. Recycling at the IVT reaction therefore generates two main benefits.

3.9. LNP

For the formulation of mRNA into lipid nanoparticles (LNP), significant factors influencing the LNP concentration and the encapsulation efficiency in the continuous LNP formation have already been identified within a simulation study by Schmidt et al. [5]. These are shown in the diagrams of effect sizes ((a), (b)) and design spaces ((c), (d)) in Figure 25. According to these, the mRNA concentration, the adjusted volume flow rates, and the composition of the lipid mix have an influence on the encapsulation efficiency. In addition to the volume flows, the final LNP concentration is also influenced by the number of diafiltration volumes and the transmembrane pressure.
In addition, the implementation of PID controllers showed that disturbance variables can be compensated for in the event of their occurrence.
For the actual execution of the experiments, batch tests are to be carried out first, analogous to the IVT. Here, especially influencing variables that are difficult to capture by simulation, such as the oligonucleotide encapsulation, are to be investigated.
The composition of the lipid mix is taken from the literature. Here, the N/P ratio is particularly crucial for feasibility. This describes the ratio of amine groups in the ionizable lipid to the number of phosphates in the backbone of the oligonucleotides. The optimal N/P ratio for the mRNA vaccine developed by BioNTech and Pfizer is 6 [98].
To demonstrate feasibility, LNPs are first generated without oligonucleotides at a smaller scale of 0.5 mL. Subsequently, this will be performed at the same scale with the use of non-linearized pDNA. The two experiments are then repeated in a larger scale of 1.5 mL to demonstrate scale-up and reproducibility. Finally, the transferability to linearized pDNA and mRNA will be investigated in two experiments of 1.5 mL each. The experimental design with the exact compositions is shown in Table 10.
All experiments of the experimental design are carried out in sections by pipetting. Finally, the scale-up to the mixing section takes place. This is shown in Figure 26.
To determine the integrity of lipids, the combination of RP chromatography with an ELSD has been discussed in the literature [99]. The size distribution of the LNPs is performed by size-exclusion chromatography (SEC) and downstream MALS/DLS [100,101].

4. Discussion and Conclusions

This experimental study proves the feasibility of the invented slug-flow concept as a solution to the task of scaling-up 1000 clinical doses to 10 million doses at production scale in only one qualified and validated plant. The system was initially run without the use of the expensive reaction mixture with slug generation to demonstrate the applicability and accuracy of signal-based fractionation. This study has shown that both UV detectors and conductivity detectors are suitable for detecting the generated slug. In addition, it is even possible to isolate the product fraction so that a yield of 100% with a purity of >98% is achieved.
The reproducibility of generating and fractionating such a slug flow for 1000 doses in a 10-millon dose plant is less than or equal to +/−1%, i.e., extremely accurate. This even allows fractionation with a yield close to 100% with standard well-controlled pumps, e.g., via mass flow controllers and classical PID controllers. Nevertheless, different detectors, such as UV or conductivity, as well as DAD or FTIR, can be used, as shown in this study, to detect the phase boundary and give the exact fractionation signal to a valve. Yields close to 100% are possible. Purities, i.e., contamination of the main phase containing mRNA with the immiscible separation phase, are possible on the order of about 98%. To avoid yield losses, a safety margin, i.e., earlier switching of the valve, of 5–10% can be applied. In this case, a maximum of 5 or 10 vol% of foreign phase is produced. From 4 mL of slug, 4 mL of slug + 0.2 or 0.4 mL of displacement phase would then leave the PFR.
This can already be compensated in the first DSP unit, i.e., by mixed-mode chromatography (MMC) or single-pass tangential flow filtration (SPTFF) before RP chromatography. Both units are known to be able to do this using the chosen separation mechanism [34,35]. Alternatively, or additionally, but not necessarily, as evidenced by the above data, the commercially available phase separators (membrane or gravity-based) can be used for phase separation prior to MMC [34,35]. However, this would destroy the beauty of the concept of the closed, integrated plant, and is unnecessary, as described above.
Before applying this concept to continuous IVT, an optimal operating point was determined by conducting a statistical experimental design consisting of 35 experiments. Thus, a high NTP concentration of 10 mM in combination with a high magnesium acetate concentration of 50 mM and an NTP:GTP ratio of 1 should be selected to obtain a maximum yield of mRNA.
It was shown that continuous production of mRNA in the PFR is possible. Thus, by generating slugs, it becomes possible to perform this in one facility, from small dose quantities for clinical scale-up to 10 million doses at production scale. Moreover, by adding the excipient urea, the amount of double-stranded mRNA can be significantly reduced from a ss:ds ratio of 1:2.1 to a ratio of 3.5:1, resulting in a higher purity of the product, single-stranded mRNA. However, the addition of urea resulted in a decrease in the yield of mRNA by 5.6 g/L. Although this concentration is above the yields of up to 5 g/L widely reported in the literature [64,65,66,79], optimization of the urea concentration used, as well as other process parameters such as temperature, is desirable [96].
The subsequent buffer exchange was performed using a hollow-fiber module with a cut-off of 300 kDa. This was able to completely retain the mRNA for further processing DSP, whereas impurities such as unreacted nucleotides were successfully separated. Furthermore, the costly cap analog could be recovered from the permeate. This allows the use of a recycling loop by incorporating a 300 kDa membrane downstream of the PFR and, in particular, the expensive cap analog can be recycled back into the process.
It has already been shown in previous studies that process control is possible with the aid of PID controllers [5]. This is a prerequisite for successful autonomous process control. These are based on existing digital twins as model-based predictive control integration of the available PAT strategies for diverse material systems [7,25,102,103,104]. For the process models developed by Helgers et al. [3], initial model parameters of enzyme kinetics could be determined in this study. Furthermore, the use of DAD and FTIR spectrometers not only enables the detection and fractionation of slugs, but also allows tracking substrate consumption and, in combination with the digital twin, performing an optimal feeding strategy of the IVT via the recycling loop. With reference to the evaluated simulation studies, an improvement potential of additionally about 15–20% productivity increase and personnel as well as chemical reduction of about 30% could be predicted [2,3,4,5]. When discussing effort and benefit, it should be kept in mind that autonomous operation is an essential key technology for all decentralized, local, container-based manufacturing concepts of the future [105,106], as these approaches can not only be realized without skilled workers placed abroad, but with less local personnel and sophisticated remote support by the main manufacturer. An efficient and rapid global supply of mRNA therapeutics at the lowest cost and use of resources is technically feasible and ready for industrialization.
In summary, a scalable mRNA machine based on slug-flow operation for clinical (at 1000 doses) and direct continuous operation (at 10 million doses) proves feasible. With sufficient accuracy of more than 99% in operation, the slug can be cut out to ensure that there is no contamination of the separation phase. In addition, because it operates in bind-and-elute mode, the subsequent mixed-mode chromatography would directly deal with any potential deviation and accurately purify the main product fraction, even in the presence of impurities. The final reversed-phase chromatography used for the sensitive removal of product-related impurities to purify ss-mRNA would also allow the separation of potential residues in flow-through, in the unlikely event.
Further work in the immediate future will focus on the experimental execution of the LNP formulation presented in this work with final lyophilization to increase transport stability, which to date has been a challenge. Furthermore, real-time release testing will be performed during a continuous operating campaign under autonomous operational control as described. Such efforts will enable direct industrialization, in collaboration with appropriate industry partners, their regulatory affairs and quality assurance. Production operations would be directly supported and managed by data-driven decisions. Even benchmark competition with skilled operators and a priori operator training with the aid of the digital twins would be a game changer.

Author Contributions

Conceptualization, J.S.; software, process, analytics and experiments, A.H., A.S., H.H. and F.L.V.; E. coli cell line development, H.H.; writing—original draft preparation, A.H., A.S. and J.S.; writing—review and editing, A.H., A.S., H.H., F.L.V. and J.S.; supervision, J.S.; project administration, J.S. All authors have read and agreed to the published version of the manuscript.

Funding

This research received no external funding.

Institutional Review Board Statement

Not applicable.

Informed Consent Statement

Not applicable.

Data Availability Statement

Not applicable.

Acknowledgments

The authors would like to thank the whole institute’s team, including Steffen Zobel-Roos for continuous chromatography, Alex Juckers for lyophilization, and Mourad Mouellef and Thomas Knebel for their endless automation efforts. The mechanical and electrical workshop with Nils Hoffmann and Volker Strohmeyer is thanked for their fast-track assembly of IVT and LNP units, under the budgeting supervision of Claudia Lacheta. The authors would also like to thank Frank Steinhäuser for his full-time trouble-shooting and total support, Martin Tegtmeier as the qualified person for his regulatory guidance and supervision, Christophe Bonneville and Nicolas Moinette from Dillico®/Grenoble for their enthusiastic discussions and questionnaires, as well as the Fisher Scientific team around Clemens Döring, and Barbara Zschörnig from Jena Bioscience. The authors acknowledge financial support from the Open Access Publishing Fund of the Clausthal University of Technology.

Conflicts of Interest

The authors declare no conflict of interest.

References

  1. Bundesministerium der Finanzen. Förderung der Impfstoffentwicklung. Available online: https://www.bundesfinanzministerium.de/Content/DE/Standardartikel/Themen/Europa/DARP/Leuchtturm-Projekte/foerderung-impfstoffentwicklung.html# (accessed on 19 January 2023).
  2. Schmidt, A.; Helgers, H.; Vetter, F.L.; Juckers, A.; Strube, J. Digital Twin of mRNA-Based SARS-COVID-19 Vaccine Manufacturing towards Autonomous Operation for Improvements in Speed, Scale, Robustness, Flexibility and Real-Time Release Testing. Processes 2021, 9, 748. [Google Scholar] [CrossRef]
  3. Helgers, H.; Hengelbrock, A.; Schmidt, A.; Strube, J. Digital Twins for Continuous mRNA Production. Processes 2021, 9, 1967. [Google Scholar] [CrossRef]
  4. Schmidt, A.; Helgers, H.; Vetter, F.L.; Juckers, A.; Strube, J. Fast and Flexible mRNA Vaccine Manufacturing as a Solution to Pandemic Situations by Adopting Chemical Engineering Good Practice—Continuous Autonomous Operation in Stainless Steel Equipment Concepts. Processes 2021, 9, 1874. [Google Scholar] [CrossRef]
  5. Schmidt, A.; Helgers, H.; Vetter, F.L.; Zobel-Roos, S.; Hengelbrock, A.; Strube, J. Process Automation and Control Strategy by Quality-by-Design in Total Continuous mRNA Manufacturing Platforms. Processes 2022, 10, 1783. [Google Scholar] [CrossRef]
  6. Vetter, F.L.; Zobel-Roos, S.; Mota, J.P.B.; Nilsson, B.; Schmidt, A.; Strube, J. Toward Autonomous Production of mRNA-Therapeutics in the Light of Advanced Process Control and Traditional Control Strategies for Chromatography. Processes 2022, 10, 1868. [Google Scholar] [CrossRef]
  7. Helgers, H.; Hengelbrock, A.; Schmidt, A.; Rosengarten, J.; Stitz, J.; Strube, J. Process Design and Optimization towards Digital Twins for HIV-Gag VLP Production in HEK293 Cells, including Purification. Processes 2022, 10, 419. [Google Scholar] [CrossRef]
  8. Zobel-Roos, S.; Strube, J. Präparative Chromatographie von (Bio-)Pharmazeutika—Mit Digitalisierten Mehrzweckanlagen zu Schnellen und Flexiblen Prozessen; GIT Labor-Fachzeitschrift; John Wiley & Sons: Hoboken, NJ, USA, 2021; pp. 20–21. [Google Scholar]
  9. Mouellef, M.; Vetter, F.L.; Zobel-Roos, S.; Strube, J. Fast and Versatile Chromatography Process Design and Operation Optimization with the Aid of Artificial Intelligence. Processes 2021, 9, 2121. [Google Scholar] [CrossRef]
  10. Kis, Z.; Kontoravdi, C.; Shattock, R.; Shah, N. Resources, Production Scales and Time Required for Producing RNA Vaccines for the Global Pandemic Demand. Vaccines 2020, 9, 3. [Google Scholar] [CrossRef]
  11. Rosa, S.S.; Prazeres, D.M.F.; Azevedo, A.M.; Marques, M.P.C. mRNA vaccines manufacturing: Challenges and bottlenecks. Vaccine 2021, 39, 2190–2200. [Google Scholar] [CrossRef]
  12. Grilo, A.L.; Schmidhalter, D.R. mRNA Manufacturing and Single-use Technology—A Perfect Liaison. Chem. Ing. Tech. 2022, 94, 1920–1927. [Google Scholar] [CrossRef]
  13. Skok, J.; Megušar, P.; Vodopivec, T.; Pregeljc, D.; Mencin, N.; Korenč, M.; Krušič, A.; Celjar, A.M.; Pavlin, N.; Krušič, J.; et al. Gram-Scale mRNA Production Using a 250-mL Single-Use Bioreactor. Chem. Ing. Tech. 2022, 94, 1928–1935. [Google Scholar] [CrossRef]
  14. Uhl, A.; Schmidt, A.; Jensch, C.; Köster, D.; Strube, J. Development of Concepts for a Climate-Neutral Chemical–Pharmaceutical Industry in 2045. Processes 2022, 10, 1289. [Google Scholar] [CrossRef]
  15. Schmidt, A.; Zobel-Roos, S.; Helgers, H.; Lohmann, L.; Vetter, F.; Jensch, C.; Juckers, A.; Strube, J. Digital Twins for Continuous Biologics Manufacturing. In Process Control, Intensification, and Digitalisation in Continuous Biomanufacturing; Subramanian, G., Ed.; Wiley: Hoboken, NJ, USA, 2022; pp. 265–350. ISBN 9783527347698. [Google Scholar]
  16. Beg, S.; Hasnain, M.S.; Rahman, M.; Swain, S. Introduction to Quality by Design (QbD): Fundamentals, Principles, and Applications. In Pharmaceutical Quality by Design; Elsevier: Amsterdam, The Netherlands, 2019; pp. 1–17. ISBN 9780128157992. [Google Scholar]
  17. Brunef, R.; Kumar, K.S.; Guillen-Gosalbez, G.; Jimenez, L. Integrating process simulation, multi-objective optimization and LCA for the development of sustainable processes. In 21st European Symposium on Computer Aided Process Engineering; Elsevier: Amsterdam, The Netherlands, 2011; pp. 1271–1275. ISBN 9780444538956. [Google Scholar]
  18. Daniel, S.; Kis, Z.; Kontoravdi, C.; Shah, N. Quality by Design for enabling RNA platform production processes. Trends Biotechnol. 2022, 40, 1213–1228. [Google Scholar] [CrossRef]
  19. Mihokovic, N. Continuous manufacturing-EMA perspective and experience. In Integrated Continuous Biomanufacturing III; ECI: New York, NY, USA, 2017. [Google Scholar]
  20. Ouranidis, A.; Davidopoulou, C.; Tashi, R.-K.; Kachrimanis, K. Pharma 4.0 Continuous mRNA Drug Products Manufacturing. Pharmaceutics 2021, 13, 1371. [Google Scholar] [CrossRef]
  21. Schmidt, A.; Hengelbrock, A.; Strube, J. Biopharma 4.0 for Biologics Manufacturing Under Pandemic Constraints. In Cell Engineering; Biopharmaceutical Manufacturing: Progress, Trends and Challenges Book Series; Springer: Berlin/Heidelberg, Germany, 2023. [Google Scholar]
  22. Zobel-Roos, S.; Schmidt, A.; Uhlenbrock, L.; Ditz, R.; Köster, D.; Strube, J. Digital Twins in Biomanufacturing. Adv. Biochem. Eng. Biotechnol. 2021, 176, 181–262. [Google Scholar] [CrossRef]
  23. Vetter, F.L.; Strube, J. Need for a Next Generation of Chromatography Models—Academic Demands for Thermodynamic Consistency and Industrial Requirements in Everyday Project Work. Processes 2022, 10, 715. [Google Scholar] [CrossRef]
  24. Woodcock, J. Modernizing pharmaceutical manufacturing–continuous manufacturing as a key enabler. In Proceedings of the MIT-CMAC International Symposium on Continuous Manufacturing of Pharmaceuticals, Cambridge, MA, USA, 20–21 May 2014. [Google Scholar]
  25. Helgers, H.; Schmidt, A.; Strube, J. Towards Autonomous Process Control—Digital Twin for CHO Cell-Based Antibody Manufacturing Using a Dynamic Metabolic Model. Processes 2022, 10, 316. [Google Scholar] [CrossRef]
  26. Chatterjee, S. FDA perspective on continuous manufacturing. In Proceedings of the IFPAC Annual Meeting, Baltimore, MD, USA, 22–25 January 2012. [Google Scholar]
  27. ICH Expert Working Group. ICH Q12—Technical and Regulatory Considerations for Pharmaceutical Product Lifecycle Management; ICH Expert Working Group: Geneva, Switzerland, 2020. [Google Scholar]
  28. ICH Expert Working Group. Pharmaceuticel Development Q8(R2): ICH Harmonised Tripartite Guideline; ICH Expert Working Group: Geneva, Switzerland, 2009. [Google Scholar]
  29. Tice, J.D.; Song, H.; Lyon, A.D.; Ismagilov, R.F. Formation of Droplets and Mixing in Multiphase Microfluidics at Low Values of the Reynolds and the Capillary Numbers. Langmuir 2003, 19, 9127–9133. [Google Scholar] [CrossRef]
  30. Kashid, M.N.; Agar, D.W. Hydrodynamics of liquid–liquid slug flow capillary microreactor: Flow regimes, slug size and pressure drop. Chem. Eng. J. 2007, 131, 1–13. [Google Scholar] [CrossRef]
  31. Nord, L.; Bäckström, K.; Danielsson, L.-G.; Ingman, F.; Karlberg, B. Extraction rate in liquid-liquid segmented flow injection analysis. Anal. Chim. Acta 1987, 194, 221–233. [Google Scholar] [CrossRef]
  32. Wellsandt, T.; Stanisch, B.; Strube, J. Characterization Method for Separation Devices Based on Micro Technology. Chem. Ing. Tech. 2015, 87, 150–158. [Google Scholar] [CrossRef]
  33. Wellsandt, T.; Stanisch, B.; Strube, J. Development of Micro Separation Technology Modules. Part 1: Liquid-Liquid Extraction. Chem. Ing. Tech. 2015, 87, 1198–1206. [Google Scholar] [CrossRef]
  34. Mascia, S.; Heider, P.L.; Zhang, H.; Lakerveld, R.; Benyahia, B.; Barton, P.I.; Braatz, R.D.; Cooney, C.L.; Evans, J.M.B.; Jamison, T.F.; et al. End-to-end continuous manufacturing of pharmaceuticals: Integrated synthesis, purification, and final dosage formation. Angew. Chem. Int. Ed. Engl. 2013, 52, 12359–12363. [Google Scholar] [CrossRef] [PubMed]
  35. Adamo, A.; Beingessner, R.L.; Behnam, M.; Chen, J.; Jamison, T.F.; Jensen, K.F.; Monbaliu, J.-C.M.; Myerson, A.S.; Revalor, E.M.; Snead, D.R.; et al. On-demand continuous-flow production of pharmaceuticals in a compact, reconfigurable system. Science 2016, 352, 61–67. [Google Scholar] [CrossRef] [PubMed] [Green Version]
  36. Gladius, A.W.; Vondran, J.; Ramesh, Y.; Seidensticker, T.; Agar, D.W. Slug flow as tool for selectivity control in the homogeneously catalysed solvent-free epoxidation of methyl oleate. J. Flow Chem. 2021, 11, 407–427. [Google Scholar] [CrossRef]
  37. Bogdan, A.R.; Dombrowski, A.W. Emerging Trends in Flow Chemistry and Applications to the Pharmaceutical Industry. J. Med. Chem. 2019, 62, 6422–6468. [Google Scholar] [CrossRef]
  38. Holbach, A.; Kockmann, N. Counter-current arrangement of microfluidic liquid-liquid droplet flow contactors. Green Process. Synth. 2013, 2, 157–167. [Google Scholar] [CrossRef]
  39. Wu, Z.; Cao, Z.; Sunden, B. Flow patterns and slug scaling of liquid-liquid flow in square microchannels. Int. J. Multiph. Flow 2019, 112, 27–39. [Google Scholar] [CrossRef]
  40. Robertson, K.; Flandrin, P.-B.; Klapwijk, A.R.; Wilson, C.C. Design and Evaluation of a Mesoscale Segmented Flow Reactor (KRAIC). Cryst. Growth Des. 2016, 16, 4759–4764. [Google Scholar] [CrossRef]
  41. Holtze, C.; Rowat, A.C.; Agresti, J.J.; Hutchison, J.B.; Angilè, F.E.; Schmitz, C.H.J.; Köster, S.; Duan, H.; Humphry, K.J.; Scanga, R.A.; et al. Biocompatible surfactants for water-in-fluorocarbon emulsions. Lab Chip 2008, 8, 1632–1639. [Google Scholar] [CrossRef]
  42. Shembekar, N.; Chaipan, C.; Utharala, R.; Merten, C.A. Droplet-based microfluidics in drug discovery, transcriptomics and high-throughput molecular genetics. Lab Chip 2016, 16, 1314–1331. [Google Scholar] [CrossRef] [Green Version]
  43. Ładosz, A.; Rigger, E.; Rudolf von Rohr, P. Pressure drop of three-phase liquid–liquid–gas slug flow in round microchannels. Microfluid. Nanofluid. 2016, 20, 49. [Google Scholar] [CrossRef]
  44. Liu, Y.; Chen, G.; Yue, J. Manipulation of gas-liquid-liquid systems in continuous flow microreactors for efficient reaction processes. J. Flow Chem. 2020, 10, 103–121. [Google Scholar] [CrossRef] [Green Version]
  45. Linares-Fernández, S.; Lacroix, C.; Exposito, J.-Y.; Verrier, B. Tailoring mRNA Vaccine to Balance Innate/Adaptive Immune Response. Trends Mol. Med. 2020, 26, 311–323. [Google Scholar] [CrossRef]
  46. Huang, L.; Zhang, L.; Li, W.; Li, S.; Wen, J.; Li, H.; Liu, Z. Advances in Development of mRNA-Based Therapeutics. In mRNA Vaccines; Current Topics in Microbiology and Immunology Book Series; Springer: Berlin/Heidelberg, Germany, 2020. [Google Scholar] [CrossRef]
  47. Sahin, U.; Muik, A.; Vogler, I.; Derhovanessian, E.; Kranz, L.M.; Vormehr, M.; Quandt, J.; Bidmon, N.; Ulges, A.; Baum, A.; et al. BNT162b2 vaccine induces neutralizing antibodies and poly-specific T cells in humans. Nature 2021, 595, 572–577. [Google Scholar] [CrossRef]
  48. Arnold, S.; Siemann, M.; Scharnweber, K.; Werner, M.; Baumann, S.; Reuss, M. Kinetic modeling and simulation of in vitro transcription by phage T7 RNA polymerase. Biotechnol. Bioeng. 2001, 72, 548–561. [Google Scholar] [CrossRef]
  49. Rosa, S.S.; Nunes, D.; Antunes, L.; Prazeres, D.M.F.; Marques, M.P.C.; Azevedo, A.M. Maximizing mRNA vaccine production with Bayesian optimization. Biotechnol. Bioeng. 2022, 119, 3127–3139. [Google Scholar] [CrossRef]
  50. Geall, A.J.; Mandl, C.W.; Ulmer, J.B. RNA: The new revolution in nucleic acid vaccines. Semin. Immunol. 2013, 25, 152–159. [Google Scholar] [CrossRef]
  51. Fuchs, A.-L.; Neu, A.; Sprangers, R. A general method for rapid and cost-efficient large-scale production of 5′ capped RNA. RNA 2016, 22, 1454–1466. [Google Scholar] [CrossRef] [Green Version]
  52. Cunningham, P.R.; Ofengand, J. Use of inorganic pyrophosphatase to improve the yield of in vitro transcription reactions catalyzed by T7 RNA polymerase. Biotechniques 1990, 9, 713–714. [Google Scholar]
  53. Guajardo, R.; Sousa, R. A model for the mechanism of polymerase translocation. J. Mol. Biol. 1997, 265, 8–19. [Google Scholar] [CrossRef] [PubMed]
  54. Higman, M.A.; Christen, L.A.; Niles, E.G. The mRNA (guanine-7-)methyltransferase domain of the vaccinia virus mRNA capping enzyme. Expression in Escherichia coli and structural and kinetic comparison to the intact capping enzyme. J. Biol. Chem. 1994, 269, 14974–14981. [Google Scholar] [CrossRef] [PubMed]
  55. Tusup, M.; French, L.E.; de Matos, M.; Gatfield, D.; Kundig, T.; Pascolo, S. Design of in vitro Transcribed mRNA Vectors for Research and Therapy. Chimia 2019, 73, 391–394. [Google Scholar] [CrossRef] [PubMed]
  56. Shuman, S. Capping Enzyme in Eukaryotic mRNA Synthesis; Elsevier: Amsterdam, The Netherlands, 1995; pp. 101–129. ISBN 9780125400503. [Google Scholar]
  57. Fabrega, C.; Hausmann, S.; Shen, V.; Shuman, S.; Lima, C.D. Structure and Mechanism of mRNA Cap (Guanine-N7) Methyltransferase. Mol. Cell 2004, 13, 77–89. [Google Scholar] [CrossRef]
  58. Muttach, F.; Muthmann, N.; Rentmeister, A. Synthetic mRNA capping. Beilstein J. Org. Chem. 2017, 13, 2819–2832. [Google Scholar] [CrossRef]
  59. Samanta, A.; Krause, A.; Jäschke, A. A modified dinucleotide for site-specific RNA-labelling by transcription priming and click chemistry. Chem. Commun. 2014, 50, 1313–1316. [Google Scholar] [CrossRef]
  60. Pasquinelli, A.E.; Dahlberg, J.E.; Lund, E. Reverse 5′ caps in RNAs made in vitro by phage RNA polymerases. RNA 1995, 1, 957–967. [Google Scholar]
  61. Grudzien, E.; Stepinski, J.; Jankowska-Anyszka, M.; Stolarski, R.; Darzynkiewicz, E.; Rhoads, R.E. Novel cap analogs for in vitro synthesis of mRNAs with high translational efficiency. RNA 2004, 10, 1479–1487. [Google Scholar] [CrossRef] [Green Version]
  62. Jemielity, J.; Fowler, T.; Zuberek, J.; Stepinski, J.; Lewdorowicz, M.; Niedzwiecka, A.; Stolarski, R.; Darzynkiewicz, E.; Rhoads, R.E. Novel “anti-reverse” cap analogs with superior translational properties. RNA 2003, 9, 1108–1122. [Google Scholar] [CrossRef] [Green Version]
  63. Peng, Z.-H.; Sharma, V.; Singleton, S.F.; Gershon, P.D. Synthesis and application of a chain-terminating dinucleotide mRNA cap analog. Org. Lett. 2002, 4, 161–164. [Google Scholar] [CrossRef]
  64. Life Technologies Corporation. User Guide—mMESSAGE mMACHINE® Kit: High Yield Capped RNA Transcription Kit. SP6, T7, and T3 Kits; Life Thechnologies Corporation: Carlsbad, CA, USA, 2012; Available online: https://www.thermofisher.com/document-connect/document-connect.html?url=https://assets.thermofisher.com/TFS-Assets%2FLSG%2Fmanuals%2Fcms_055516.pdf (accessed on 10 October 2022).
  65. Jena Bioscience GmbH. Data Sheet—HighYield T7 ARCA mRNA Synthesis Kit: Synthesis of ARCA-Capped (m)RNA; Jena Bioscience GmbH: Jena, Germany, 2021; Available online: https://www.jenabioscience.com/images/PDF/RNT-102.0003.pdf (accessed on 10 October 2022).
  66. TriLink BioTechnologies. CleanCap® AG: CleanCap Reagent AG for Co-Transcriptional Capping of mRNA; TriLink BioTechnologies: San Diego, CA, USA, 2020. [Google Scholar]
  67. Helgers, H.; Schmidt, A.; Lohmann, L.J.; Vetter, F.L.; Juckers, A.; Jensch, C.; Mouellef, M.; Zobel-Roos, S.; Strube, J. Towards Autonomous Operation by Advanced Process Control—Process Analytical Technology for Continuous Biologics Antibody Manufacturing. Processes 2021, 9, 172. [Google Scholar] [CrossRef]
  68. Juckers, A.; Knerr, P.; Harms, F.; Strube, J. Advanced Process Analytical Technology in Combination with Process Modeling for Endpoint and Model Parameter Determination in Lyophilization Process Design and Optimization. Processes 2021, 9, 1600. [Google Scholar] [CrossRef]
  69. Juckers, A.; Knerr, P.; Harms, F.; Strube, J. Emerging PAT for Freeze-Drying Processes for Advanced Process Control. Processes 2022, 10, 2059. [Google Scholar] [CrossRef]
  70. Schmidt, A.; Helgers, H.; Lohmann, L.J.; Vetter, F.; Juckers, A.; Mouellef, M.; Zobel-Roos, S.; Strube, J. Process analytical technology as key-enabler for digital twins in continuous biomanufacturing. J. Chem. Technol. Biotechnol. 2022, 97, 2336–2346. [Google Scholar] [CrossRef]
  71. Vetter, F.L.; Zobel-Roos, S.; Strube, J. PAT for Continuous Chromatography Integrated into Continuous Manufacturing of Biologics towards Autonomous Operation. Processes 2021, 9, 472. [Google Scholar] [CrossRef]
  72. Berry, B.; Moretto, J.; Matthews, T.; Smelko, J.; Wiltberger, K. Cross-scale predictive modeling of CHO cell culture growth and metabolites using Raman spectroscopy and multivariate analysis. Biotechnol. Prog. 2015, 31, 566–577. [Google Scholar] [CrossRef]
  73. Biechele, P.; Busse, C.; Solle, D.; Scheper, T.; Reardon, K. Sensor systems for bioprocess monitoring. Eng. Life Sci. 2015, 15, 469–488. [Google Scholar] [CrossRef]
  74. Birdsall, R.E.; Yu, Y.Q. An Efficient UV-Based Method for the Assessment of Oleic Acid Content in Biotherapeutic Drug Products Containing Polysorbate-80; Waters Corporation: Milford, MA, USA, 2019. [Google Scholar]
  75. GenScript ProBio. Accelerating Vaccine Development against COVID-19. Available online: https://www.genscriptprobio.com/gsfiles/techfiles/GPB-COVID19-GMP%20plasmid-GPB_052020.pdf (accessed on 20 January 2023).
  76. Pregeljc, D.; Skok, J.; Vodopivec, T.; Mencin, N.; Krušič, A.; Ličen, J.; Nemec, K.Š.; Štrancar, A.; Sekirnik, R. Increasing yield of IVT reaction with at-line HPLC monitoring. Authorea 2022. [Google Scholar] [CrossRef]
  77. Chmiel, H.; Takors, R.; Weuster-Botz, D. Bioprozesstechnik; Springer: Berlin/Heidelberg, Germany, 2018; ISBN 978-3-662-54041-1. [Google Scholar]
  78. Committee for Mecdicinal Products for Human Use. Assessment Report Comirnaty: Procedure No. EMEA/H/C/005735/0000; Committee for Medicinal Products for Human Use: Amsterdam, The Netherlands, 2021. [Google Scholar]
  79. Bancel, S.; Issa, W.J.; Aunins, J.G.; Chakraborty, T. Manufacturing Methods for Production of RNA Transcripts. WO2014152027A1, 25 September 2014. [Google Scholar]
  80. William Issa, M.P. Methods for HPLC Analytics. WO 2019/036685 Al, 17 February 2019. [Google Scholar]
  81. Committee for Mecdicinal Products for Human Use. Assessment Report Comirnaty COVID-19 Vaccine Moderna: Procedure No. EMEA/H/C/005791/0000; Committee for Medicinal Products for Human Use: Amsterdam, The Netherlands, 2021. [Google Scholar]
  82. Sekirnik, R. Chromatographic Tools for a High-Yielding mRNA Production Process. Available online: https://www.rubiconscience.com.au/wp-content/uploads/2021/05/mRNA_Production_Process_presentation.pdf (accessed on 20 January 2023).
  83. Nemec, K.S.; Cernigoj, U.; Vidic, J.; Livk, A.G.; Goricar, B.; Bozic, K.; Celjar, A.M.; Skok, J.; Mencin, N.; Kralj, S.; et al. High Yield mRNA Production Process from E. coli to Highly Pure mRNA. Available online: https://www.biaseparations.com/en/library/seminars-webinars/1098/high-yield-mrna-production-process-from-ecoli-to-highly-pure-mrna (accessed on 20 January 2023).
  84. Budihna, A.F.; Pavlin, N.; Celjar, A.M. High-Selectivity HPLC mRNA Analytics: Quantification and Characterization; BioProcess International: New York, NY, USA, 2022. [Google Scholar]
  85. USP. Analytical Procedures for mRNA Vaccine Quality; USP: North Bethesda, MD, USA, 2022. [Google Scholar]
  86. Masek, T.; Vopalensky, V.; Suchomelova, P.; Pospisek, M. Denaturing RNA electrophoresis in TAE agarose gels. Anal. Biochem. 2005, 336, 46–50. [Google Scholar] [CrossRef]
  87. Van der Bruggen, B. Microfiltration, ultrafiltration, nanofiltration, reverse osmosis, and forward osmosis. In Fundamental Modelling of Membrane Systems; Elsevier: Amsterdam, The Netherlands, 2018; pp. 25–70. ISBN 9780128134832. [Google Scholar]
  88. Russo, T. A Hands-On Guide to Ultrafiltration/Diafiltration Optimization Using Pellicon® Cassettes: Application Note; MilliporeSigma: Burlington, MA, USA, 2013. [Google Scholar]
  89. Funkner, A.; Dorner, S.; Sewing, S.; Kamm, J.; Broghammer, N.; Ketterer, T.; Mutzke, T. A Method for Producing and Purifying RNA, Comprising at Least One Step of Tangential Flow Filtration. EP 3 303 583 B1, 1 April 2020. [Google Scholar]
  90. Geiger, J.; Treml, M. mRNA Purification by Tangential Flow Filtration. WO2020165158A1, 20 August 2020. [Google Scholar]
  91. Kis, Z.; Rizvi, Z. How to Make Enough Vaccine for the World in One Year; Public Citizen: Washington, DC, USA, 2021. [Google Scholar]
  92. Wellsandt, T. Entwicklung und Charakterisierung Miniaturisierter Flüssig-Flüssig Extraktoren, 1st ed.; Shaker Verlag: Aachen, Germany, 2016; ISBN 978-3-8440-4914-5. [Google Scholar]
  93. Chamberlin, M.; Ring, J. Characterization of T7-specific ribonucleic acid polymerase. 1. General properties of the enzymatic reaction and the template specificity of the enzyme. J. Biol. Chem. 1973, 248, 2235–2244. [Google Scholar] [CrossRef]
  94. Ikeda, R.A.; Richardson, C.C. Enzymatic properties of a proteolytically nicked RNA polymerase of bacteriophage T7. J. Biol. Chem. 1987, 262, 3790–3799. [Google Scholar] [CrossRef] [PubMed]
  95. BRENDA. BRENDA—Braunschweig Enzyme Database. Available online: https://www.brenda-enzymes.org/ (accessed on 12 December 2022).
  96. Piao, X.; Yadav, V.; Wang, E.; Chang, W.; Tau, L.; Lindenmuth, B.E.; Wang, S.X. Double-stranded RNA reduction by chaotropic agents during in vitro transcription of messenger RNA. Mol. Ther. Nucleic Acids 2022, 29, 618–624. [Google Scholar] [CrossRef] [PubMed]
  97. Wang, P.; Akula, R.; Chen, M.; Legaspi, K. AN1616: SEC-MALS Method for Characterizing mRNA Biophysical Attributes: Application Note; Wyatt Technology: Santa Barbara, CA, USA, 2022. [Google Scholar]
  98. Schoenmaker, L.; Witzigmann, D.; Kulkarni, J.A.; Verbeke, R.; Kersten, G.; Jiskoot, W.; Crommelin, D.J.A. mRNA-lipid nanoparticle COVID-19 vaccines: Structure and stability. Int. J. Pharm. 2021, 601, 120586. [Google Scholar] [CrossRef] [PubMed]
  99. Schneider, S. Analysis of Lipid Nonoparticle Composition: Quaterny Method Development for Highest Resolution with Evaporative Light Scattering Detection; Agilent Technologies, Inc.: Santa Clara, CA, USA, 2022. [Google Scholar]
  100. Jia, X.; Liu, Y.; Wagner, A.M.; Chen, M.; Zhao, Y.; Smith, K.J.; Some, D.; Abend, A.M.; Pennington, J. Enabling online determination of the size-dependent RNA content of lipid nanoparticle-based RNA formulations. J. Chromatogr. B Anal. Technol. Biomed. Life Sci. 2021, 1186, 123015. [Google Scholar] [CrossRef] [PubMed]
  101. Zhang, J.; Haas, R.M.; Leone, A.M. Polydispersity characterization of lipid nanoparticles for siRNA delivery using multiple detection size-exclusion chromatography. Anal. Chem. 2012, 84, 6088–6096. [Google Scholar] [CrossRef]
  102. Helgers, H.; Hengelbrock, A.; Schmidt, A.; Vetter, F.L.; Juckers, A.; Strube, J. Digital Twins for scFv Production in Escherichia coli. Processes 2022, 10, 809. [Google Scholar] [CrossRef]
  103. Hengelbrock, A.; Helgers, H.; Schmidt, A.; Vetter, F.L.; Juckers, A.; Rosengarten, J.F.; Stitz, J.; Strube, J. Digital Twin for HIV-Gag VLP Production in HEK293 Cells. Processes 2022, 10, 866. [Google Scholar] [CrossRef]
  104. Mouellef, M.; Szabo, G.; Vetter, F.L.; Siemers, C.; Strube, J. Artificial Neural Network for Fast and Versatile Model Parameter Adjustment Utilizing PAT Signals of Chromatography Processes for Process Control under Production Conditions. Processes 2022, 10, 709. [Google Scholar] [CrossRef]
  105. Saied, A.A. mRNA vaccines and clinical research in Africa—From hope to reality. Int. J. Surg. 2022, 105, 106833. [Google Scholar] [CrossRef]
  106. Uli Beisel. BioNTainer—A Manufacturing Solution for Africa or Circumventing Capacity? Available online: https://www.medizinethnologie.net/biontainer-a-manufacturing-solution-for-africa-or-circumventing-capacity/ (accessed on 23 January 2023).
Figure 1. Comparison of the post-transcriptional capping (left) with a two-step enzymatic reaction and the co-transcriptional capping (right) by adding a cap analog, catalyzed by the enzyme used in the in vitro transcription.
Processes 11 00745 g001
Figure 2. Comparison of different purification strategies as well as the route chosen for this study with molecules separated from the product per step [2,5].
Processes 11 00745 g002
Figure 3. Detailed flowsheet for the production of mRNA. Starting with the generation and purification of the template DNA, followed by the in vitro transcription and purification of the mRNA, and ending with the encapsulation in lipid nanoparticles. Adapted from Schmidt et al. [2,4,5].
Processes 11 00745 g003
Figure 4. Biomanufacturing development facility.
Processes 11 00745 g004
Figure 5. Setup of the test unit in which the segmented slugs are generated, detected, and fractionated by the resulting detection signal.
Processes 11 00745 g005
Figure 6. Setup of the plant, including PAT.
Processes 11 00745 g006
Figure 7. Ultra- and diafiltration process flowsheet: T1 (feed reservoir), P1 (feed pump), MF1 (feed mass flow indicator), PI1 (feed pressure indicator), HF (hollow-fiber module), PI2 (retentate pressure indicator), V1 (pressure control valve), PI3 (permeate pressure indicator), MF2 (permeate mass flow indicator), and T2 (permeate tank).
Processes 11 00745 g007
Figure 8. Generated slug that displaces the oil phase with marked phase boundary (red arrow).
Processes 11 00745 g008
Figure 9. Normalized input signal of the slug. Recorded with a UV detector (200 nm) at a volume flow of (a) 0.2 mL/min and (b) 1 mL/min.
Processes 11 00745 g009
Figure 10. Normalized input signal of the slug. Recorded with a conductivity detector at a flow rate of (a) 0.2 mL/min and (b) 1 mL/min.
Processes 11 00745 g010
Figure 11. Normalized output signal of the slug. Recorded with a UV detector at a volume flow of (a) 0.2 mL/min and (b) 1 mL/min.
Processes 11 00745 g011
Figure 12. Normalized output signal of the slug. Recorded with a conductivity detector at a volume flow rate of (a) 0.2 mL/min and (b) 1 mL/min.
Processes 11 00745 g012
Figure 13. Product phase composition in percent for a volume flow of 0.2 mL/min as well as a volume flow of 1 mL/min.
Processes 11 00745 g013
Figure 14. Statistical evaluation of DoE using OLS with stepwise reduced p-value. (a) Actual-vs-predicted plot with marked confidence interval (red shadow); (b) Effect summary with the marked threshold for significance (logWorth of 2.0, red line); and (c) Prediction of optimal operating point.
Processes 11 00745 g014aProcesses 11 00745 g014b
Figure 15. Visualization of the residuals (black dots) in an (a) ideal residual plot and a (b) normal probability diagram with marked confidence interval (red dots).
Processes 11 00745 g015
Figure 16. Design spaces based on reduced p-value model; (a) magnesium acetate and NTP:GTP and (b) magnesium acetate and NTP concentration.
Processes 11 00745 g016
Figure 17. (a) Time course of in vitro transcription at different substrate concentrations; (b) Michaelis–Menten plot, (c) Lineweaver–Burk diagram.
Processes 11 00745 g017
Figure 18. Reaction mixture before (red) and after (blue) enzymatic degradation.
Processes 11 00745 g018
Figure 19. Raman spectra for mRNA concentrations of 0.1 g/L (red line) and 5.5 g/L (blue line).
Processes 11 00745 g019
Figure 20. Setup of the plant with reduced PAT.
Processes 11 00745 g020
Figure 21. Spectra of ethyl oleate and slug in (a) DAD and (b) FTIR.
Processes 11 00745 g021
Figure 22. Course of the hydrodynamic radius (blue line), which results from the DLS signal (blue dots) of the slug over time.
Processes 11 00745 g022
Figure 23. (a) Course of UFDF (LMH and TMP); (b) analysis of permeate and feed by RP; and (c) PrimaS chromatography.
Processes 11 00745 g023
Figure 24. Agarose gel images with dilution steps 1:10, 1:20, 1:100 and 1:200 of the (a) feed (pre dilution), (b) permeate, and (c) retentate.
Processes 11 00745 g024
Figure 25. Effect strengths (a log-worth >2 is defined as significant) of factors on (a) encapsulation efficiency and (b) LNP concentration, and contour plots of (c) encapsulation efficiency with factors PEG lipid concentration and cholesterol concentration and (d) final LNP concentration with factors flow rate and transmembrane pressure [5].
Processes 11 00745 g025aProcesses 11 00745 g025b
Figure 26. Set-up of the mixing section for the LNP formulation.
Processes 11 00745 g026
Table 1. Factors varied in the DoE and their studied ranges.
TemperatureNTP:GTPNTPMg AcetatepH
(°C)(mM:mM)(mM)(mM)(–)
3715127
402.57.516.57.5
43510508
Table 2. Constant factors in in vitro transcription.
TrisDTTTritonRnase IPyrophosphataseT7 PolymeraseTemplate
(mM)(mM)(%)(U/µL)(U/µL)(U/µL)(µg/µL)
40100.00210.00280.05
Table 3. Critical quality attributes for mRNA drug substances [18,85].
QualityAttribute
IdentitySequence confirmation
ContentRNA content
IntegrityPercentage of intact mRNA and fragment mRNA
5′ Cap
3′ Poly(A)-tail
mRNA Integrity
PurityProduct related impurities—dsRNA
Residual DNA template
SafetyEndotoxin
Bioburden
Sterility
OtherAppearance
pH
Table 4. Axial dispersion coefficients for the discussed PFR setups.
CoefficientsUnitScenario 1Scenario 2
Dax (Saxena–Nigam)m2/s 4.2 × 10 4 8.4 × 10 5
Dax (Trivedi–Vasudeva) Im2/s 2.5 × 10 3 4.9 × 10 4
Dax (Trivedi–Vasudeva) IIm2/s 1.6 × 10 3 3.1 × 10 4
Table 5. Fraction properties, purity, and yield.
Operation PointTotal Weight (g)Weight Product in (g)Weight
Product Out (g)
Yield
(%)
Purity
(%)
13.8 ± 0.43.7 ± 0.33.5 ± 0.494 ± 292 ± 2
24.7 ± 0.24.6 ± 0.14.7 ± 0.1100 ± 198 ± 2
Table 6. Result of optimal operating point (OOP) predicted from DoE (a). Reproduction of OOP performed with (c) and without (b) cap analog.
GelPrima SRP
(a)Processes 11 00745 i001Processes 11 00745 i002Processes 11 00745 i003
(b)Processes 11 00745 i004Processes 11 00745 i005Processes 11 00745 i006
(c)Processes 11 00745 i007Processes 11 00745 i008Processes 11 00745 i009
Table 7. Comparison of different kit manufacturers with this study [64,65,66].
NTP Conc (mM)GTP:NTPRatioGTP:CapRatioCap TypeCapping Eff. (%)Reaction Vol. (µL)mRNA Yield (g/L)Theor. Max. mRNA Yield (g/L)Consumption Rate (%)
TF7.51:51:4m7G(5′)ppp(5′)G80201–1.51.9810–15
JB7.51:51:4ARCA80201.5–2.51.9815–20
TriLink51:15:4CleanCap AG>951004–55.2861–76
This Study101:15:4CleanCap AG7125–30010.5–12.110.56–13.291–99
Table 8. Comparison between the IVT in batch (a), the IVT in PFR (b), and the IVT in PFR with urea (c) as an additive.
GelPrima SRP
(a)Processes 11 00745 i010Processes 11 00745 i011Processes 11 00745 i012
(b)Processes 11 00745 i013Processes 11 00745 i014Processes 11 00745 i015
(c)Processes 11 00745 i016Processes 11 00745 i017Processes 11 00745 i018
Table 9. Comparison of mRNA concentration, consumption rate, and ss:ds mRNA ratio of batch (a) reaction and reproduction in PFR with (c) and without (b) urea as additive.
mRNA Conc.
(g/L)
Consumption Rate
(%)
ss:ds mRNA
(-)
(a)12.0911:2.1
(b)11.2861.1:1
(c)6.5493.5:1
Table 10. Experimental plan for the LNP formulation.
Exp. No.mRNA/pDNAmRNA/pDNA (mg/mL)Ion. Lipid (mg/mL)PEG-Lipid (mg/mL)DSPC (mg/mL)Cholesterol (mg/mL)Volume (mL)
0–(pos. control)011.81.42.55.52
1pDNA0.2711.81.42.55.52
2lin. pDNA0.2711.81.42.55.53
3mRNA0.2711.81.42.55.53
Disclaimer/Publisher’s Note: The statements, opinions and data contained in all publications are solely those of the individual author(s) and contributor(s) and not of MDPI and/or the editor(s). MDPI and/or the editor(s) disclaim responsibility for any injury to people or property resulting from any ideas, methods, instructions or products referred to in the content.

