Article

Numerical Investigation of Natural Convection in an Open-Ended Square Channel with Two Suspending Heat Sources

1
China Unicom Smart City Research Institute, Beijing 100033, China
2
Key Laboratory of Low-Grade Energy Utilization Technologies and Systems of Ministry of Education, School of Energy and Power Engineering, Chongqing University, Chongqing 400044, China
*
Author to whom correspondence should be addressed.
Processes 2022, 10(9), 1774; https://doi.org/10.3390/pr10091774
Submission received: 12 August 2022 / Revised: 28 August 2022 / Accepted: 30 August 2022 / Published: 4 September 2022
(This article belongs to the Special Issue Advance in Flow and Heat/Mass Transfer Technology)

Abstract

:
Passive heat dissipation cooling technologies based on natural convection in open channels can effectively control the maximum temperature and improve the temperature homogeneity of 5G base stations, data centers and other equipment. In this paper, the flow and heat transfer of natural convection in an open-ended square channel with two suspending heat sources are studied through numerical simulation. The distributions of the temperature field and flow field in the channel with different horizontal distances and vertical altitude differenced of the heat sources are acquired via the finite element method (FEM)-based COMSOL Multiphysics. The changes in local temperature and the local Nusselt number are obtained. The relationships between the temperature field, flow field, and Nusselt number with respect to the geometric parameters of the heat sources are discussed. With different geometric parameters of the two suspending heat sources, the average surface temperature at the bottom is always lower than the top, while the average Nusselt number reaches maximum and minimum values at the bottom and top surfaces, respectively. As the horizontal distance increases, the maximum vertical airflow velocity decreases. The average surface temperature and local Nusselt number go through a V-shape and reverse V-shape tendency, respectively. The maximum temperature at the surface of the heat source is 397 K at a horizontal distance of 0.36 m. The local Nusselt number on the side of the heat source reaches its maximum at a horizontal distance of 0.28 m with an average value of 33.5. As the vertical altitude difference increases, the temperature difference between the heat sources increases from 0 K to 54 K, and the maximum vertical airflow velocity goes through a reverse V-shape tendency. The Nusselt number of the right heat source decreases to a certain value of about 20, while that of the left heat source goes through a fluctuating tendency. The results show that the best arrangement of the heat sources is a vertical altitude difference of 0 m and a horizontal distance of 0.28 m.

1. Introduction

Passive heat dissipation cooling technologies based on natural convection in an open-ended channel are very commonly encountered in engineering applications for the 5G base station, data center, solar chimneys and nuclear reactors, etc. [1,2,3,4,5]. The important challenges for the effective utilization of passive heat dissipation cooling technologies based on natural convection are controlling the maximum temperature and improving the temperature homogeneity of these facilities.
Many previous investigations into the natural convection have been conducted within the enclosure and open-ended channel etc. [6,7,8,9]. Senthil Nayaki et al. [10], A. Spizzichino et al. [11], D. Lee et al. [12] and A. Horimek et al. [13] studied the natural convection in the square, rectangular and cylinder enclosures by simulations and experiments. They found that the geometry and size of enclosures, the arrangement, size and number of discrete heat sources, and Prandtl number of working fluids have great impacts on the flow and heat transfer characteristics of natural convection in enclosures. Based on pioneering works, a complete understanding of the flow and heat transfer of natural convection in an enclosure with discrete heat sources has been established.
A.K. da Silva et al. [14] and Cheng et al. [15] respectively used the contractual method and the bionic method to optimize the distractions and sizes of discrete heat sources in vertical and horizontal open-ended channels cooled by natural convection. Talukdar et al. [16] presented a numerical study on the heat transfer behavior between the staggered and symmetric arrangement of discrete heat sources in a vertical open-ended channel under a modified Rayleigh number. The staggered arrangement of discrete heat sources shows the overall cooling enhancement over the symmetric one. Moreover, they paid attention to the compressible natural convection induced by high temperature difference in an inclined open-ended channel [17]. The heat transfer behavior is enhanced with the increase of the Rayleigh number and inclination angle. The composite correlations of the average Nusselt number and mass flow rate with the Rayleigh number, distraction of discrete heat sources and inclination angle of channels are presented [16,17]. Chae et al. [18] experimentally and numerically investigated the natural convection heat transfer in a vertical open-ended channel. They observed that the heat transfer rates are enhanced with the chimney effect becoming more pronounced due to the decrease in the Prandtl number and the increase in the height. It should be pointed out that researchers mainly focused on the flow and heat transfer of the natural convection in an open-ended channel induced by heat sources fixed on the channel walls.
There are relatively few investigations on the natural convection generated by suspending heat sources in an open-ended channel. Acharya et al. [19], Chandrakar et al. [20], Dash et al. [21] and Day et al. [22] paid attention to the flow field, temperature distribution and heat transfer coefficients of natural convection in an open-ended cylinder channel with the symmetric arrangement of suspending heat sources at various aspect ratios of open-ended channels, Rayleigh numbers, surface emissivity coefficients and so on. They found that the mass-flow rate due to the buoyancy-driven flow inside the open-ended cylinder channel decreases with the Rayleigh number, increases with the aspect ratio and then attains a peak. In addition, the cooling curve and correlation of the Nusselt number with the aspect ratios, Rayleigh number and surface emissivity coefficients were presented, which are helpful for the 5G base station, data center, solar chimneys and so on. Dash et al. [21] also reported that the Nusselt number of the inner surface of the suspending heat sources is always lower than that of the outer surface. Moreover, as the aspect ratio increases, the Nusselt number of the inner surface decreases, whereas that of the outer surface increases. This results in the deterioration in heat transfer being aggravated. The heat transfer performance difference between the inner and outer surfaces of heat sources has not been observed in natural convection in the open-ended cylinder channel that the heat sources are fixed on the channel walls.
It should be mentioned that the previous investigations only focused on the natural convection in the open-ended cylinder channel with the symmetric arrangement of suspending heat sources. However, the effects of the square channel, suspending and symmetric arrangements of heat sources on the flow and heat transfer of the natural convection in a vertical open-ended channel have not been revealed. Therefore, by using the commercial software, COMSOL Multiphysics, a three-dimensional numerical simulation of natural convection in a vertical open-ended square channel with two suspending heat sources is carried out in this paper. The flow and heat transfer characteristics of natural convection in a vertical open-ended square channel are obtained and analyzed at different arrangements of the suspending heat sources.

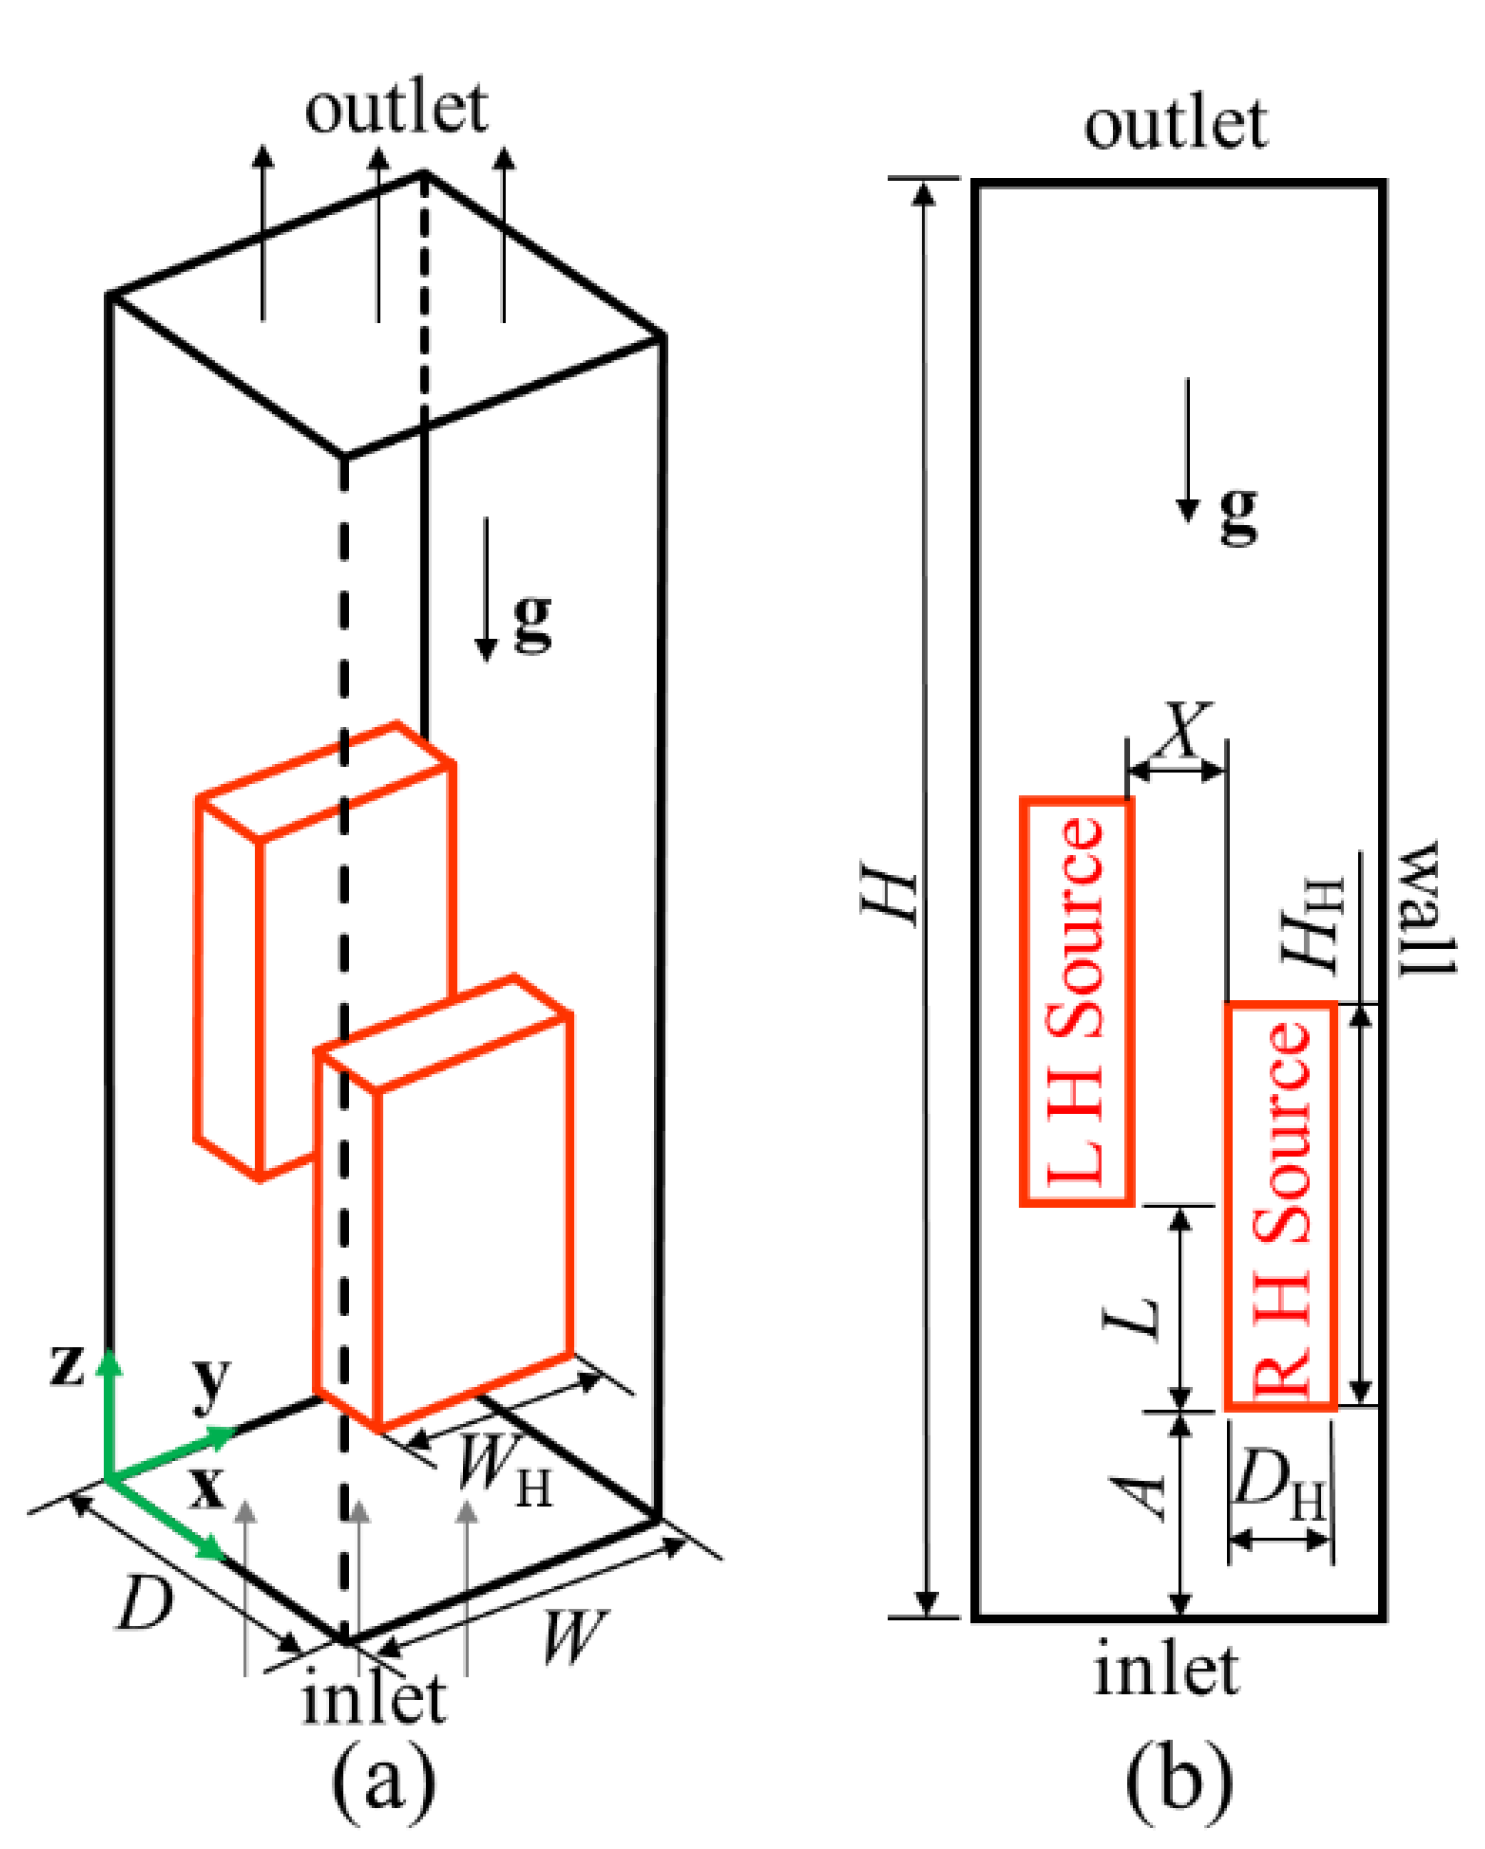
2. Model Formulation

2.1. Governing Equations and Boundary Conditions

The physical model in this study is shown in Figure 1. Two suspending heat sources with the size of WH × DH × HH = 0.5 m × 0.2 m × 0.8 m are asymmetrically arranged in a vertical open-ended square channel with the size of W × D × H = 0.8 m × 0.8 m × 2.8 m. The thermal power of each suspended heat source is set to P0 = 1000 W. The material of the suspended heat sources is aluminum, whose physical property parameters are shown in Table 1. It should be pointed out that the thermal power, material, size of heat sources and open-ended square channel correspond to the 5G base station [1]. The horizontal distance between the two heat sources is X and the vertical altitude difference between them is L, as shown in Figure 1. The walls of the open-ended square channel are rigid solid walls and considered to be slip-free and adiabatic [2]. Gravity is along the negative direction of the z-axis. The air flows from the inlet to the outlet of the vertical open-ended channel due to the buoyancy effect generated by the two suspending heat sources. The pressure at the inlet is set to atmospheric pressure patm and the temperature is set to ambient temperature T. The outlet is set as a pressure outlet at atmospheric pressure [2]. The initial air temperature is the environmental temperature, T = 293 K. The air physical property parameters are referenced in from Ref. [12], as shown in Table 1. In order to simplify the following discussion, the twelve surfaces of two discrete heat sources are marked and shown in Table 2.
The following assumptions are introduced in the present model: (1) The air is an incompressible Newtonian fluid [16,23]. The physical properties of air are taken as constant except for the density in the buoyancy term of the momentum equation [16,23]. (2) The velocity is small and the flow is laminar [16]. (3) The open-ended square channel walls are adiabatic and impermeable. (4) The radiative heat transfer is ignored due to the relatively low temperature [24]. With these assumptions above, the governing equations, including the continuity equation, momentum equation and energy equation of air, are shown in Equations (1)–(5) [25].
u x + v y + w z = 0
u u x + v u y + w u z = 1 ρ p x + μ ρ [ 2 u x 2 + 2 u y 2 + 2 u z 2 ]
u v x + v v y + w v z = 1 ρ p y + μ ρ [ 2 v x 2 + 2 v y 2 + 2 v z 2 ]
u w x + v w y + w w z = 1 ρ p z + μ ρ [ 2 w x 2 + 2 w y 2 + 2 w z 2 ] + F z
u T x + v T y + w T z = α [ 2 T x 2 + 2 T y 2 + 2 T z 2 ]
The last term in the momentum equation of Equation (4) is the buoyancy force, which is considered under the Boussinesq approximation and is valid for incompressible flow [26]. αl and αs are the thermal diffusion coefficients of liquid and solid, respectively. Equation (6) gives the control equation for incompressible flow. Here, β is the thermal expansion coefficient of air.
F z = g β ( T T )
The energy equation of heat sources is presented as Equation (7). The heat source heating power density is Φ, expressed as Equation (8) [27].
α s [ 2 T x 2 + 2 T y 2 + 2 T z 2 ] + Φ ˙ ρ c = 0
Φ ˙ = P / V
In the model, the inner walls of the square channels are slip-free and adiabatic. The pressure at the channel inlet is set to atmospheric pressure patm, and the temperature is set to ambient temperature T. The outlet is set to pressure outlet for atmospheric pressure.
In natural convection studies near vertical channels, heat transfer results are usually expressed in terms of Nusselt number (Nu) or convective heat transfer coefficient (h). The local heat flux at any z position along the vertical wall is calculated using the following expression:
q z = k [ ( T x ) x = x 0 + ( T y ) y = y 0 ]
x0, y0 denote the corresponding coordinates of a vertical surface. The local convection heat transfer coefficient hz is given by:
h z = q z T w T
where Tw and T is the average temperature of one surface and the ambient temperature, respectively. The local Nusselt number (Nuz) refers to the Nusselt number of local points on a specified line on a given surface and can be defined by [21]:
N u z = h z L z k
The average Nusselt number (Nu) of each surface of suspending heat sources can be defined by [21]:
N u = P s L s A s ( T w T )
with Ps and As representing the heat transfer rate and the area of selected surfaces, respectively.

2.2. Calculation Conditions

In the present work, the thermal power, sizes of heat sources and open-ended square channel are fixed, which correspond to the 5G base station. The horizontal distance between the two suspending heat sources X ranges from 0.20 m to 0.36 m. In addition, the vertical altitude difference of the two suspending heat sources’ L varies from 0 to 1.36 m. When the vertical altitude difference of the two suspending heat sources X is 0, the two suspending heat sources reveal a symmetrical arrangement.

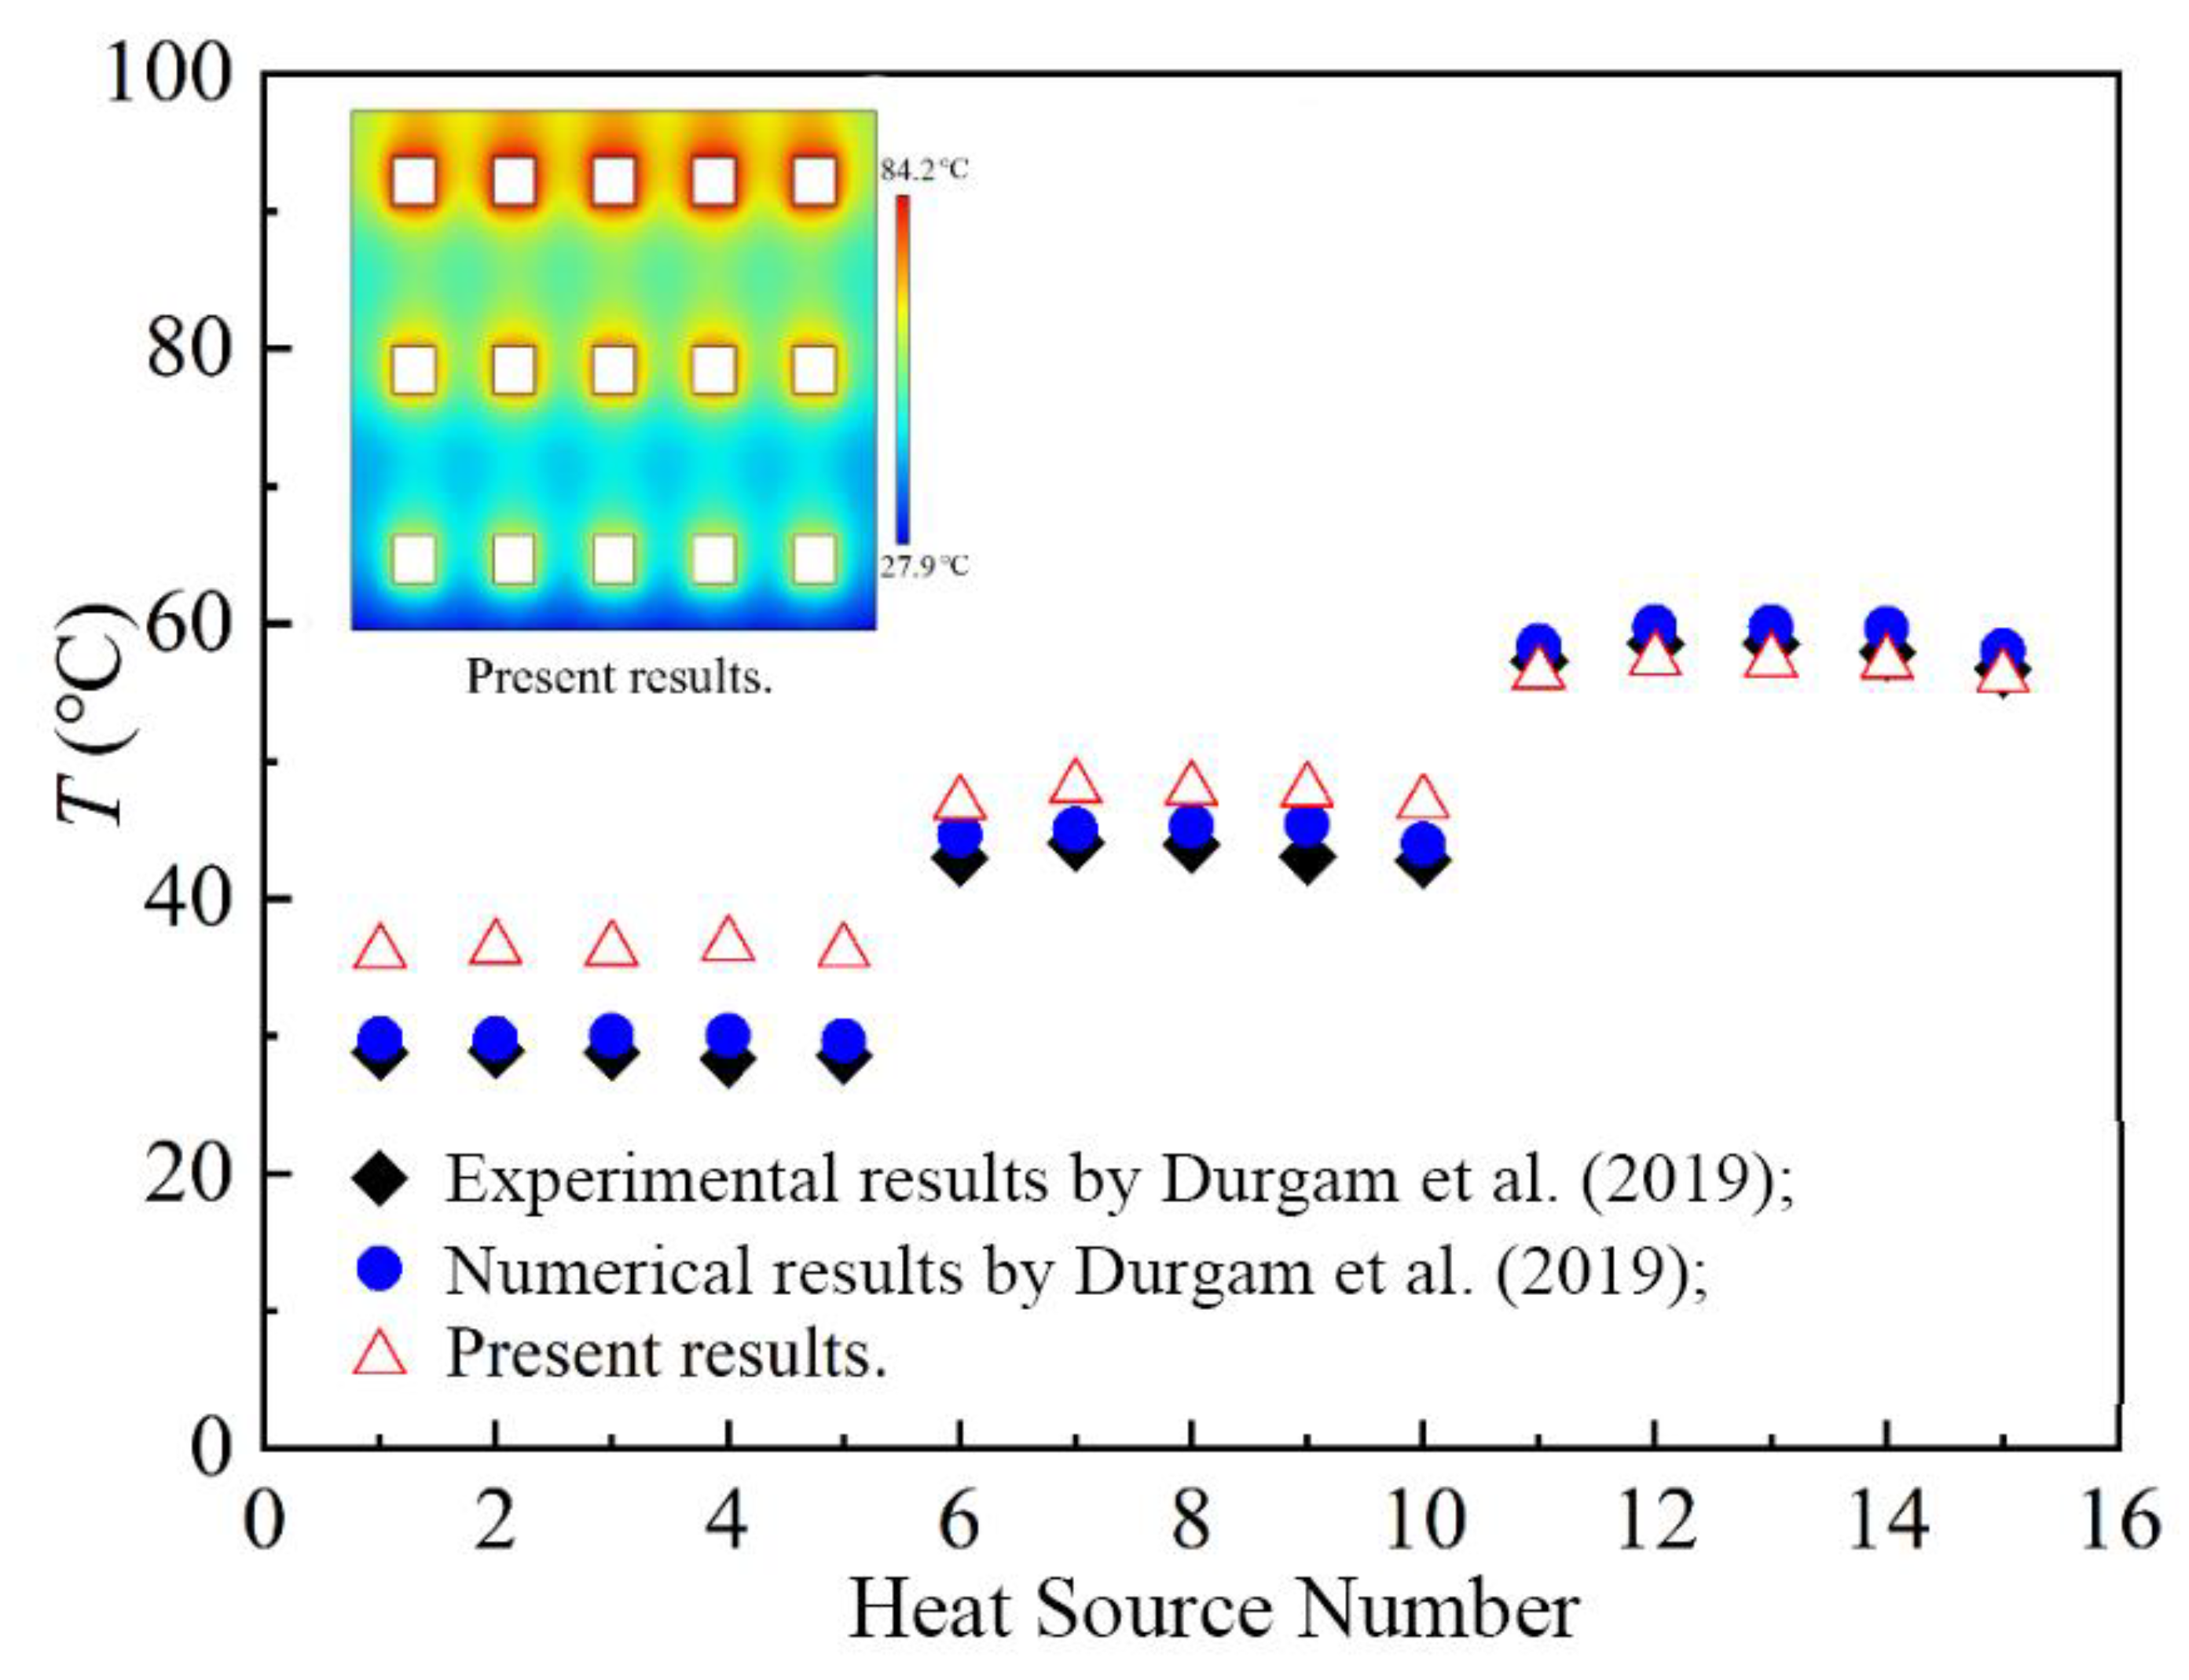
2.3. Numerical Procedure and Validation

The discrete equations are solved via the finite element method (FEM), while the accuracy and stability of the model are ensured by refining the grid and adjusting the solver parameters [28]. The volume force and flow boundary conditions are induced into the laminar flow module, while the heat sources and temperature boundary conditions are induced into the solid/fluid heat transfer module [29]. The transient solver is applied, with the backward differentiation method as the time-stepping method and the absolute tolerance factor of 0.05. The velocity and temperature are solved by the segregated solver, with the PARDISO solver applied for the temperature.
In order to verify the independence of the grid, the natural convection at L = 0, X = 0.2 m, and P = 1000 W is simulated with five different grids. Table 3 gives the average air temperature around the heat sources on five different grids. The results show that the largest relative error of the average temperature of the heat sources is only 0.93%. Thus, considering both the accuracy and current resources, the grid with a number of 1.2 × 10⁵ was selected in this study.
In order to verify the present numerical method, the investigation into natural convection air-cooling of a discrete square heat source array in a vertical channel by Shankar Durgam et al. [25] is verified by this method, as is shown in Figure 2. In Figure 2, the horizontal axis represents different heat sources on the FR4 substrate. The temperature distributions on the FR4 substrate acquired by the current numerical method are in good agreement with the numerical and experimental results in Ref. [25]. The relative error of the average temperature is less than 5%. Therefore, the accuracy of the current numerical method on the flow and heat transfer of natural convection in a vertical open-ended channel with two suspending heat sources can be assured.

3. Results and Discussions

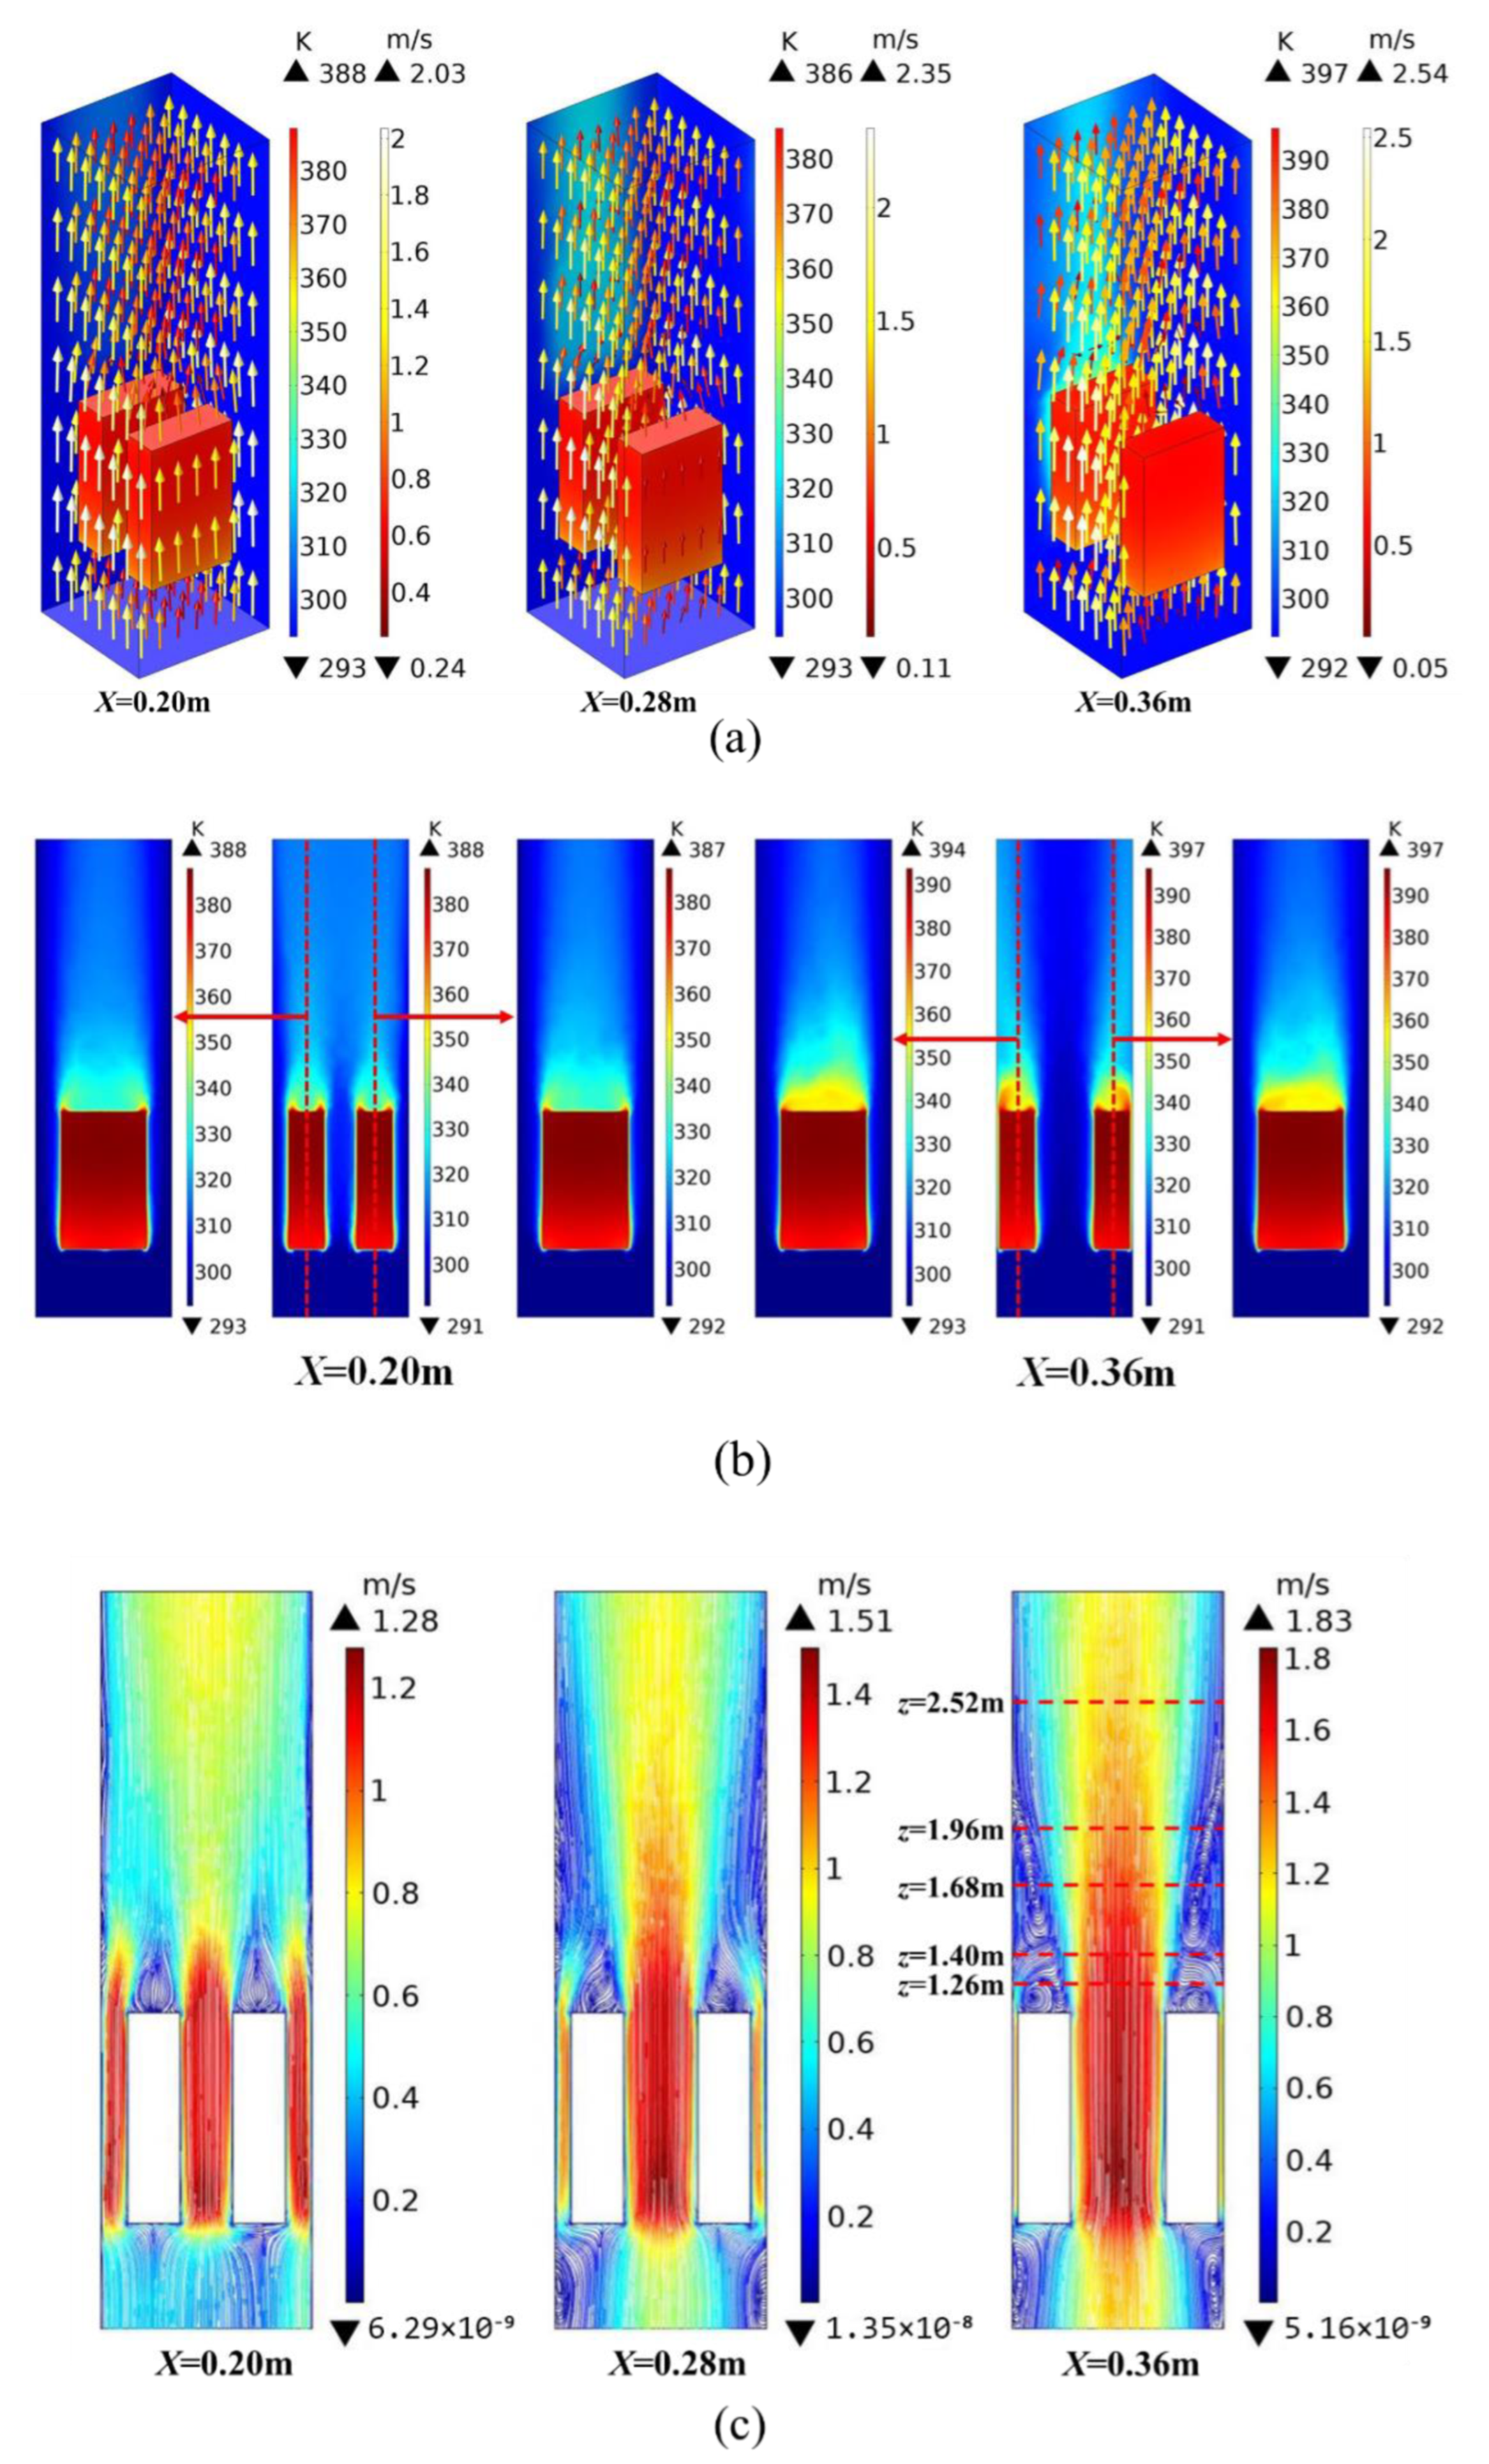
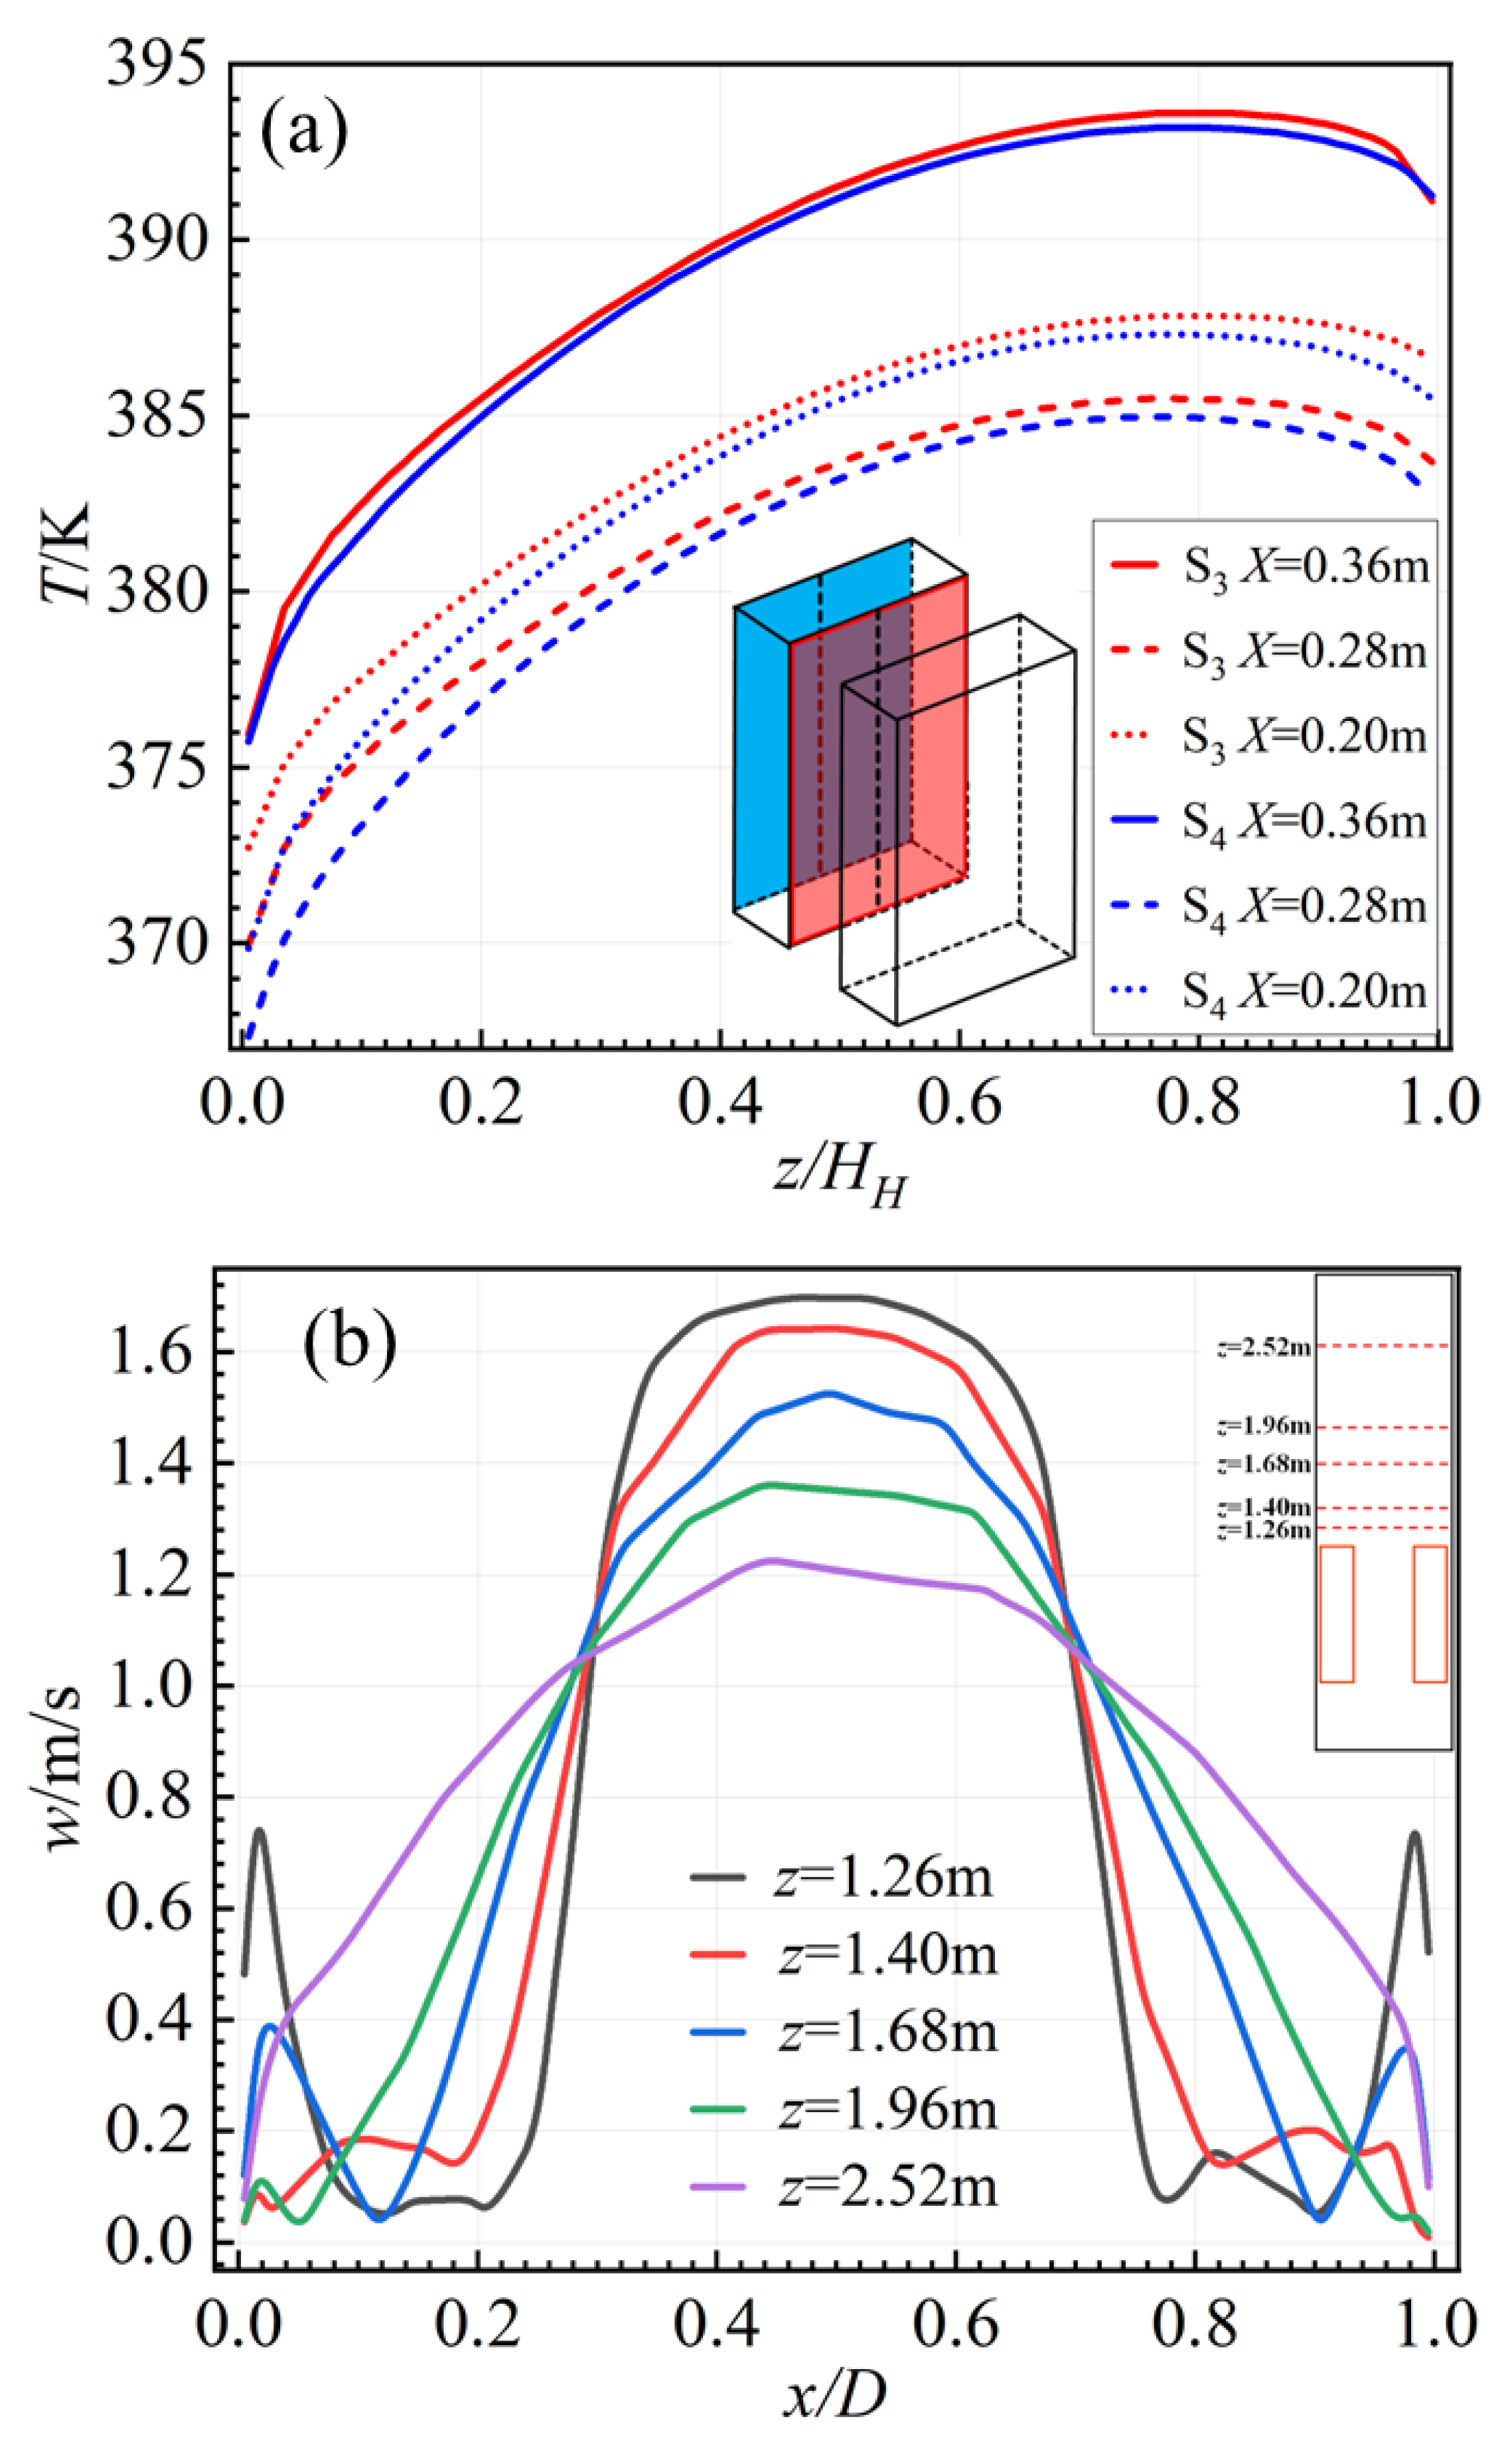
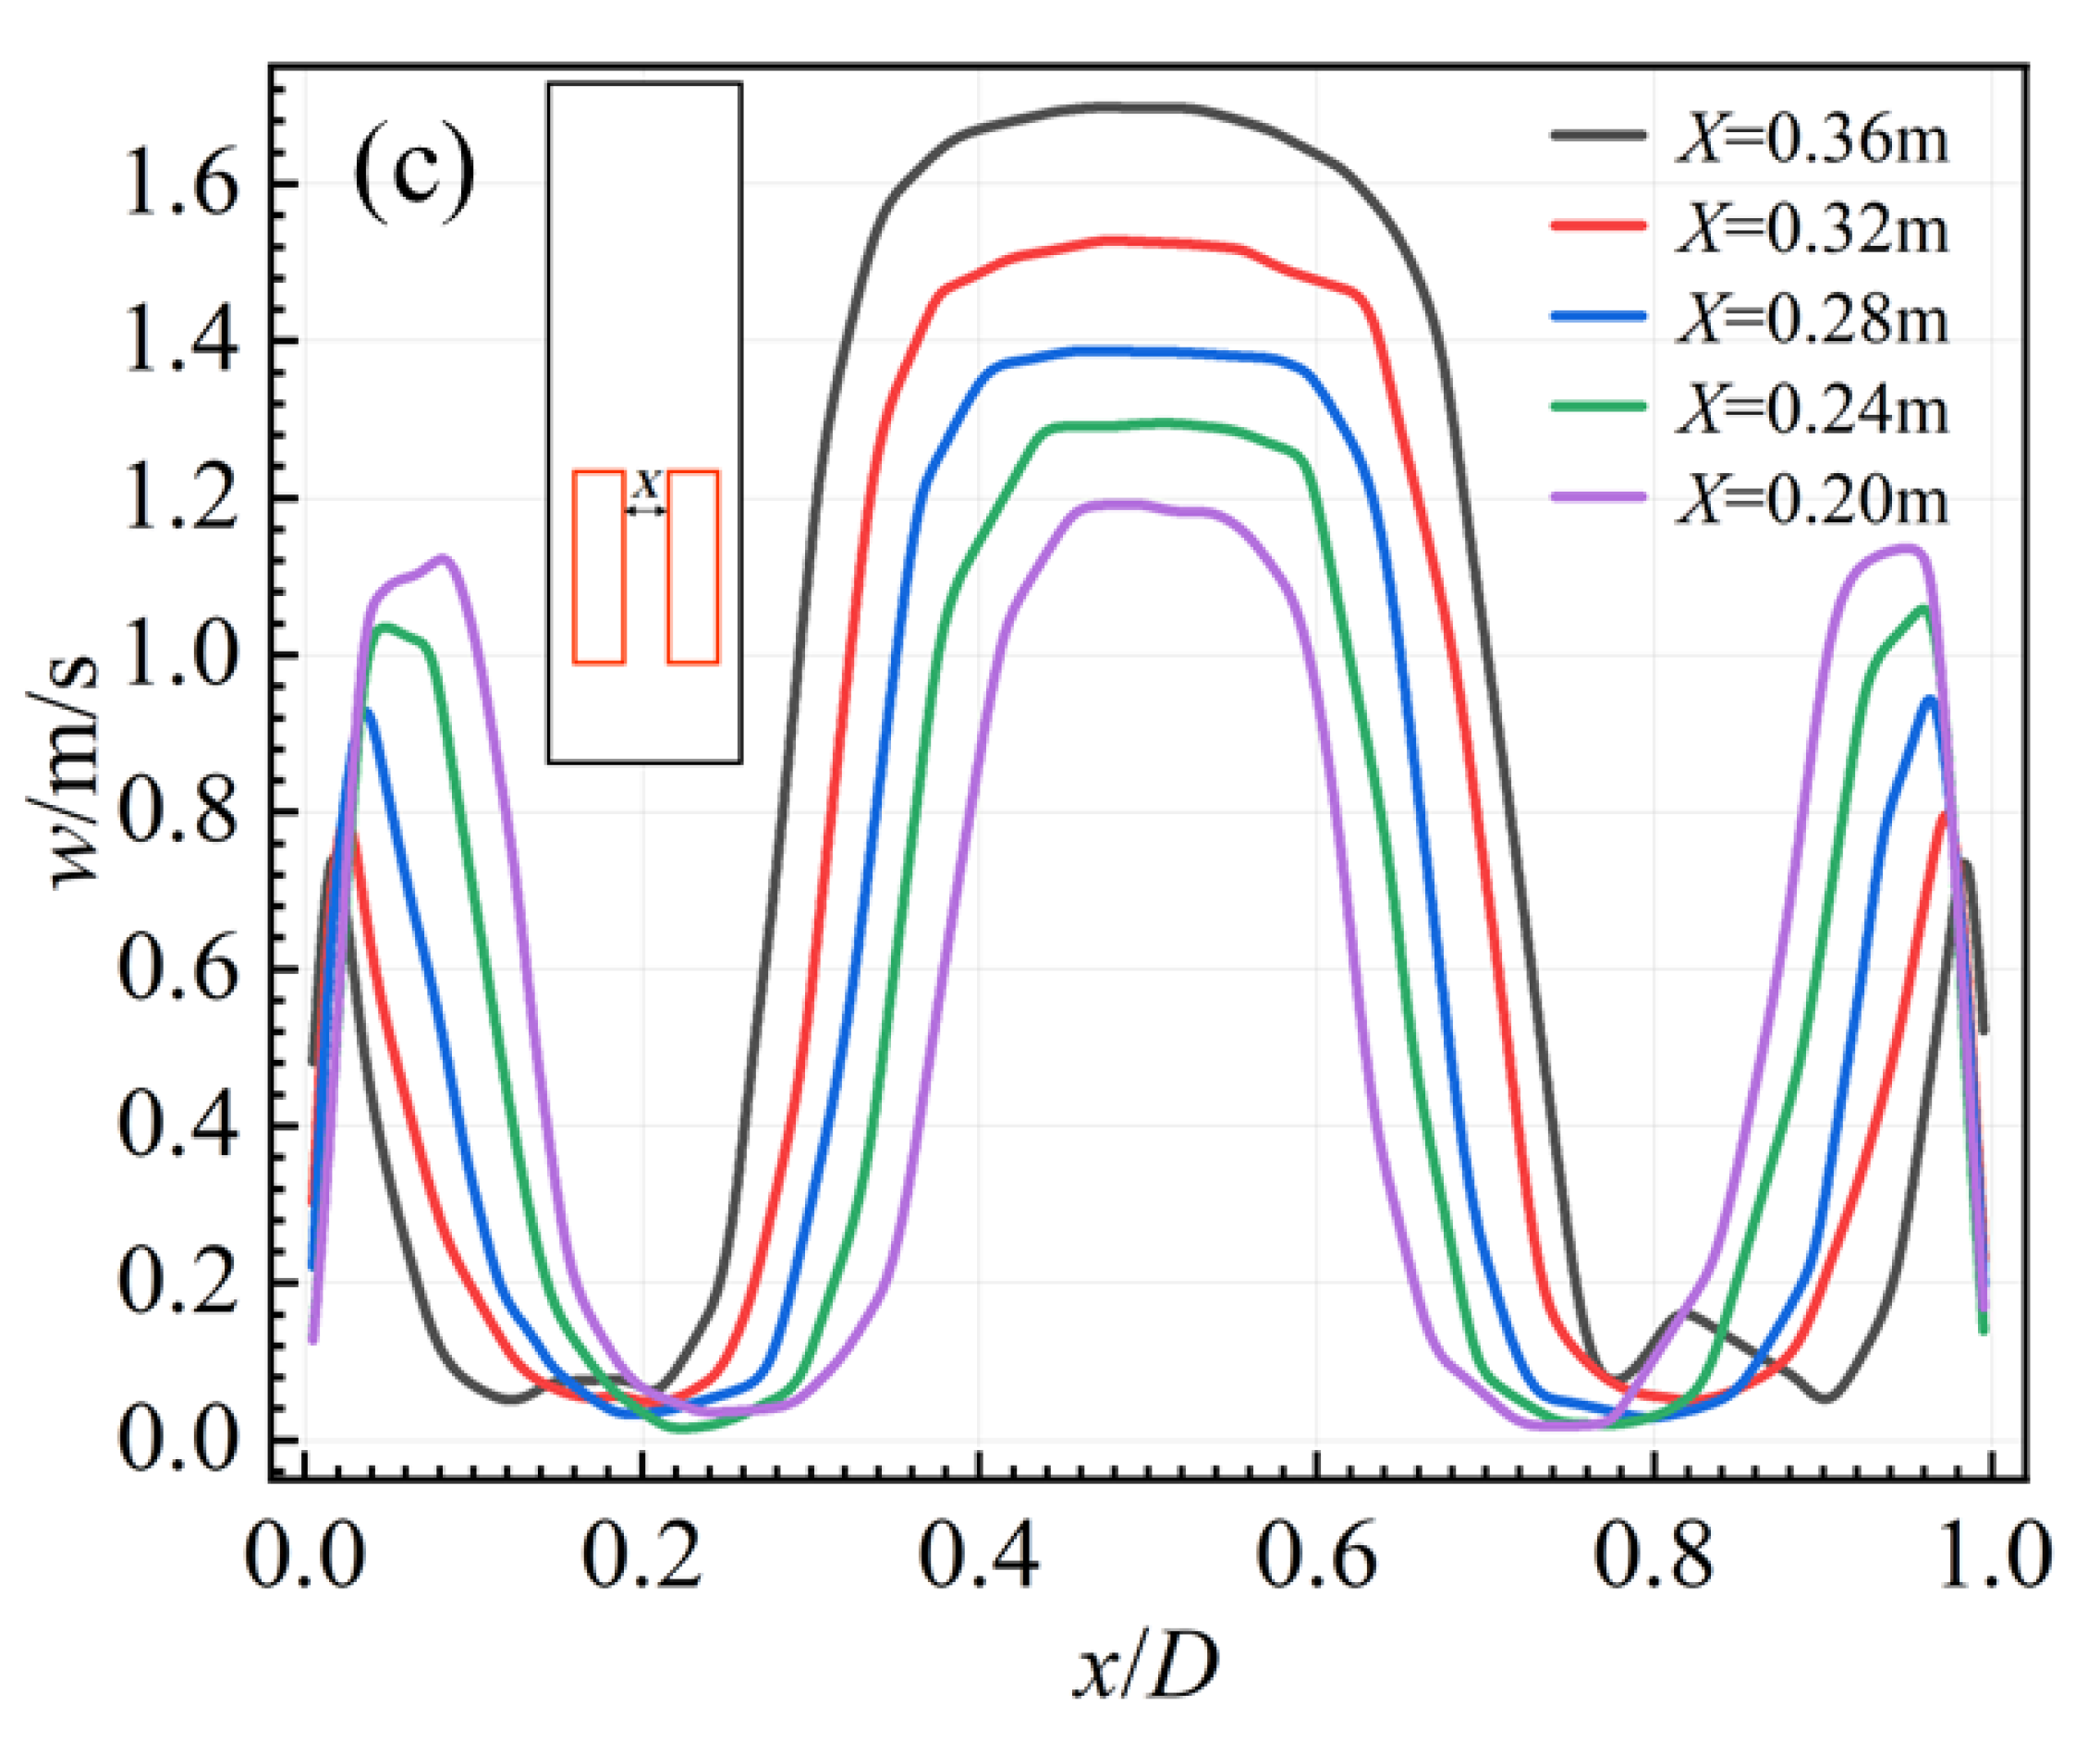
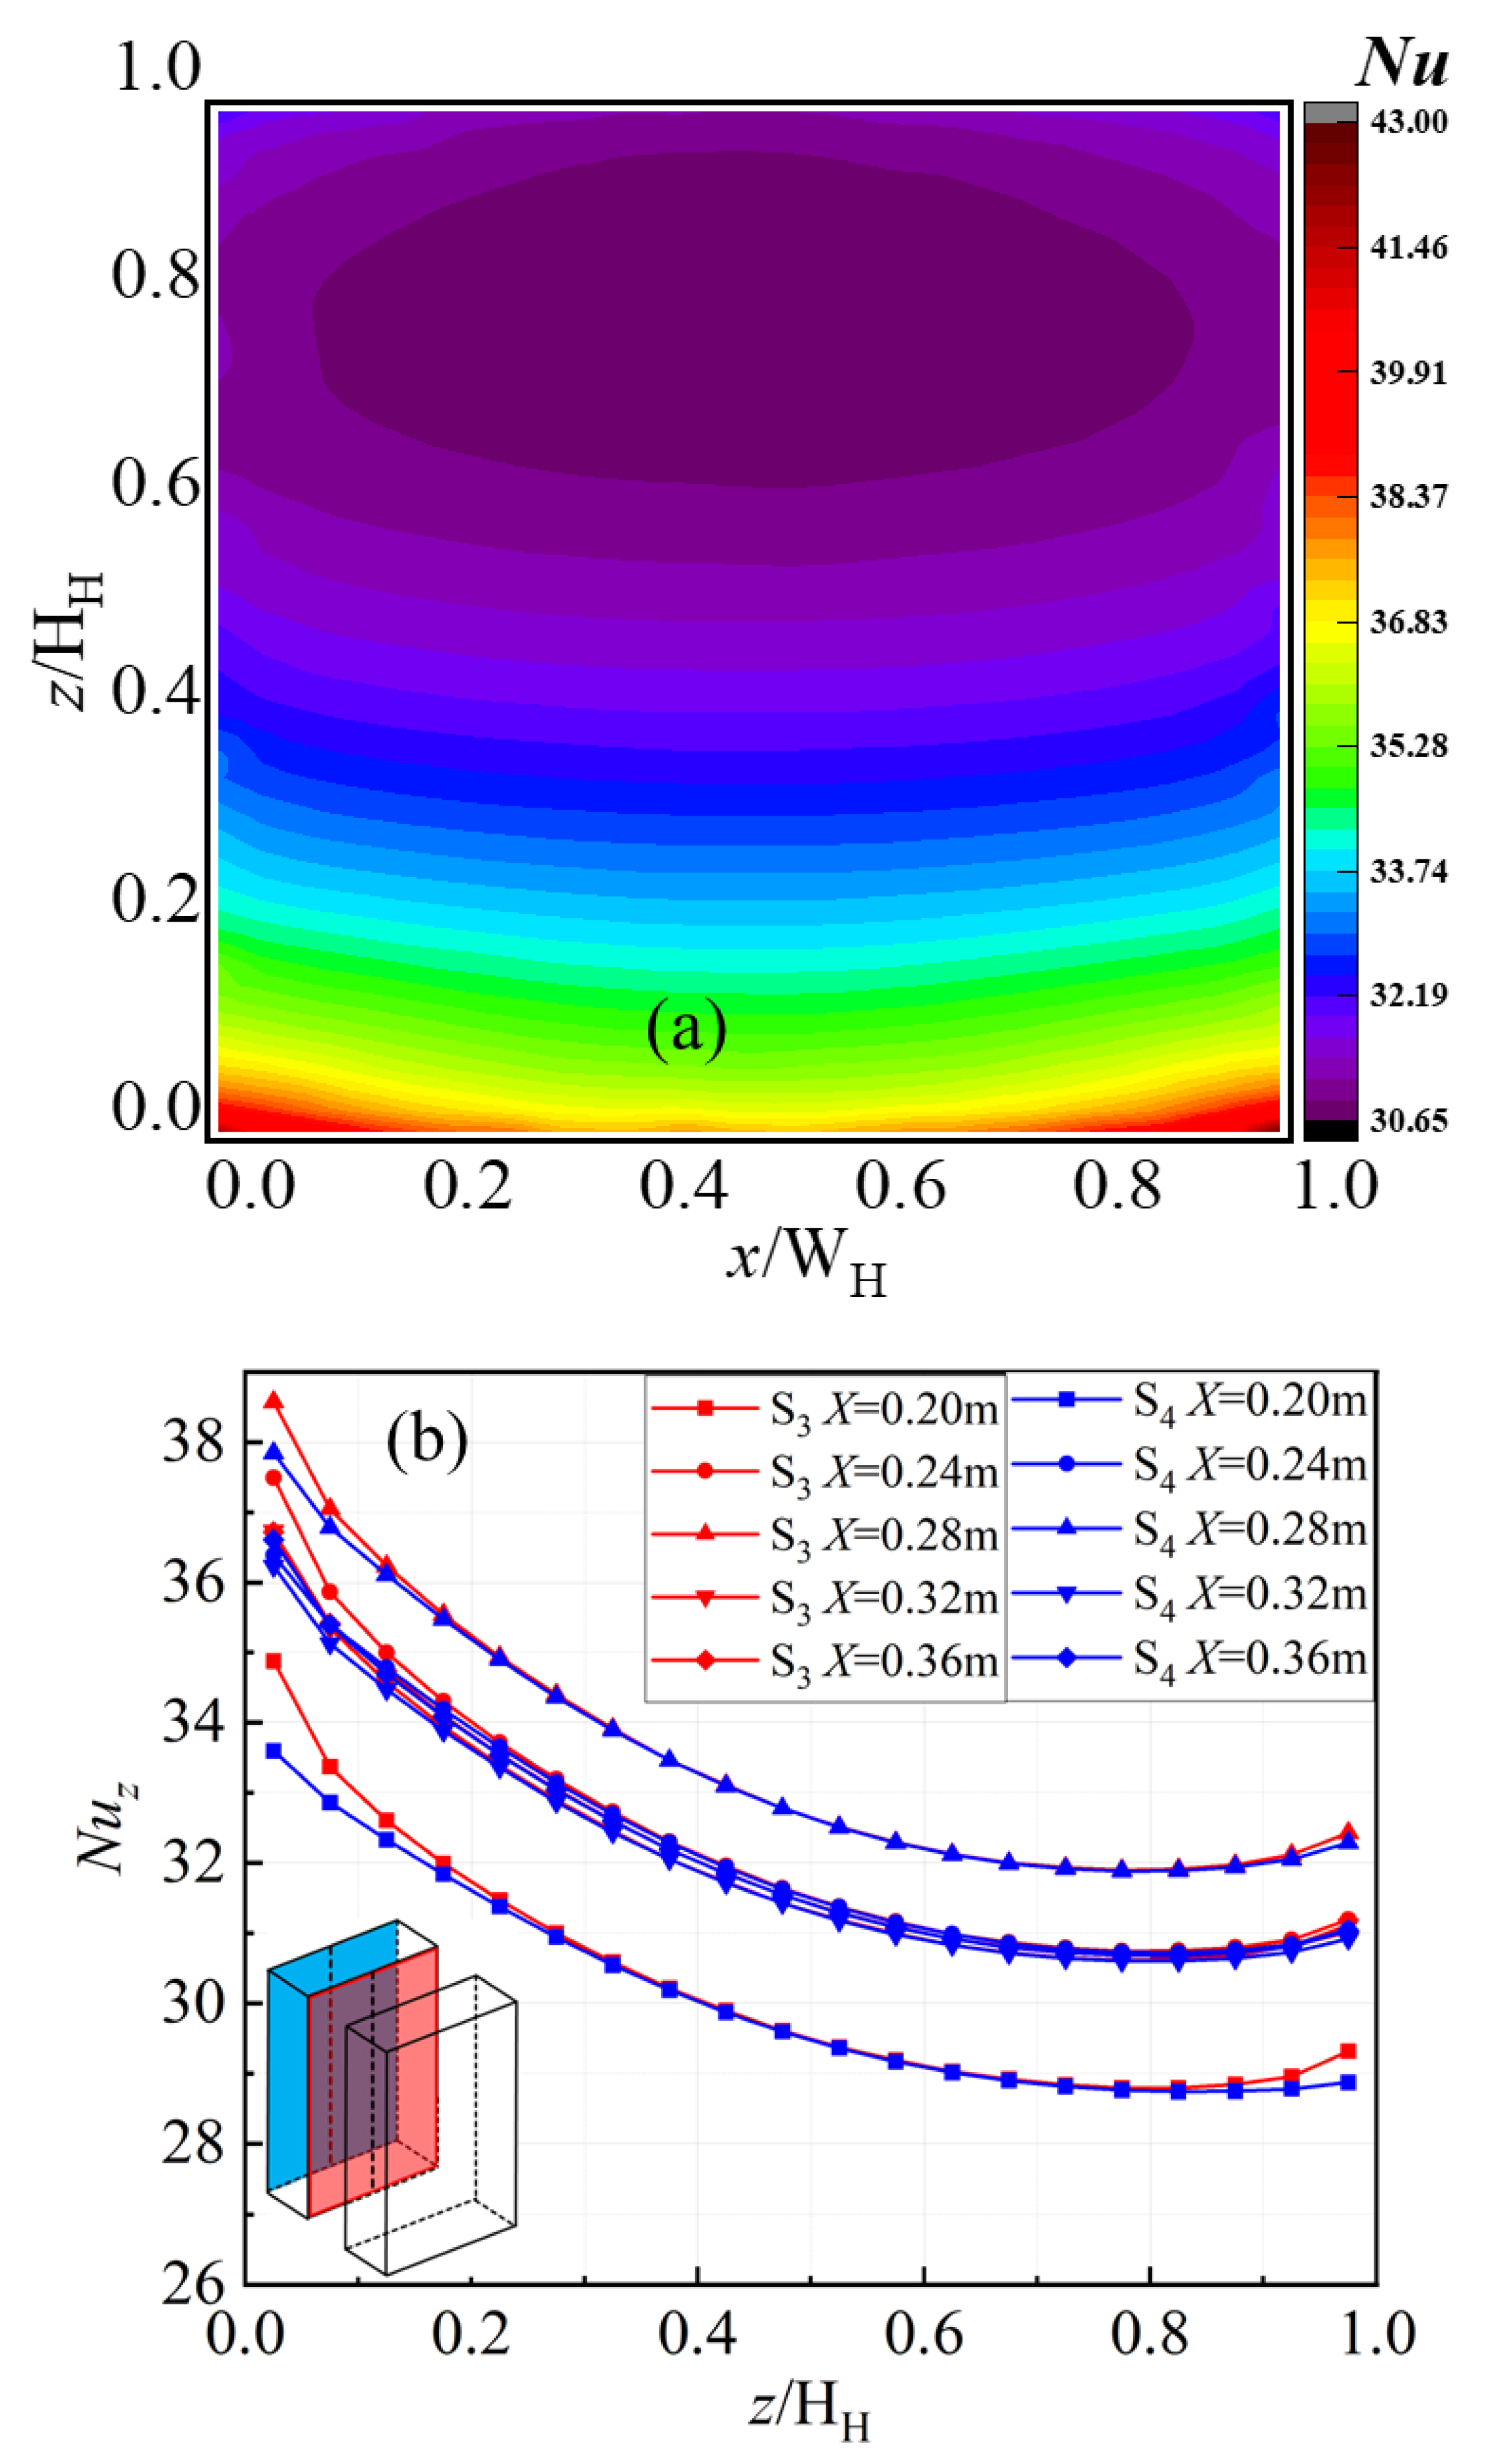
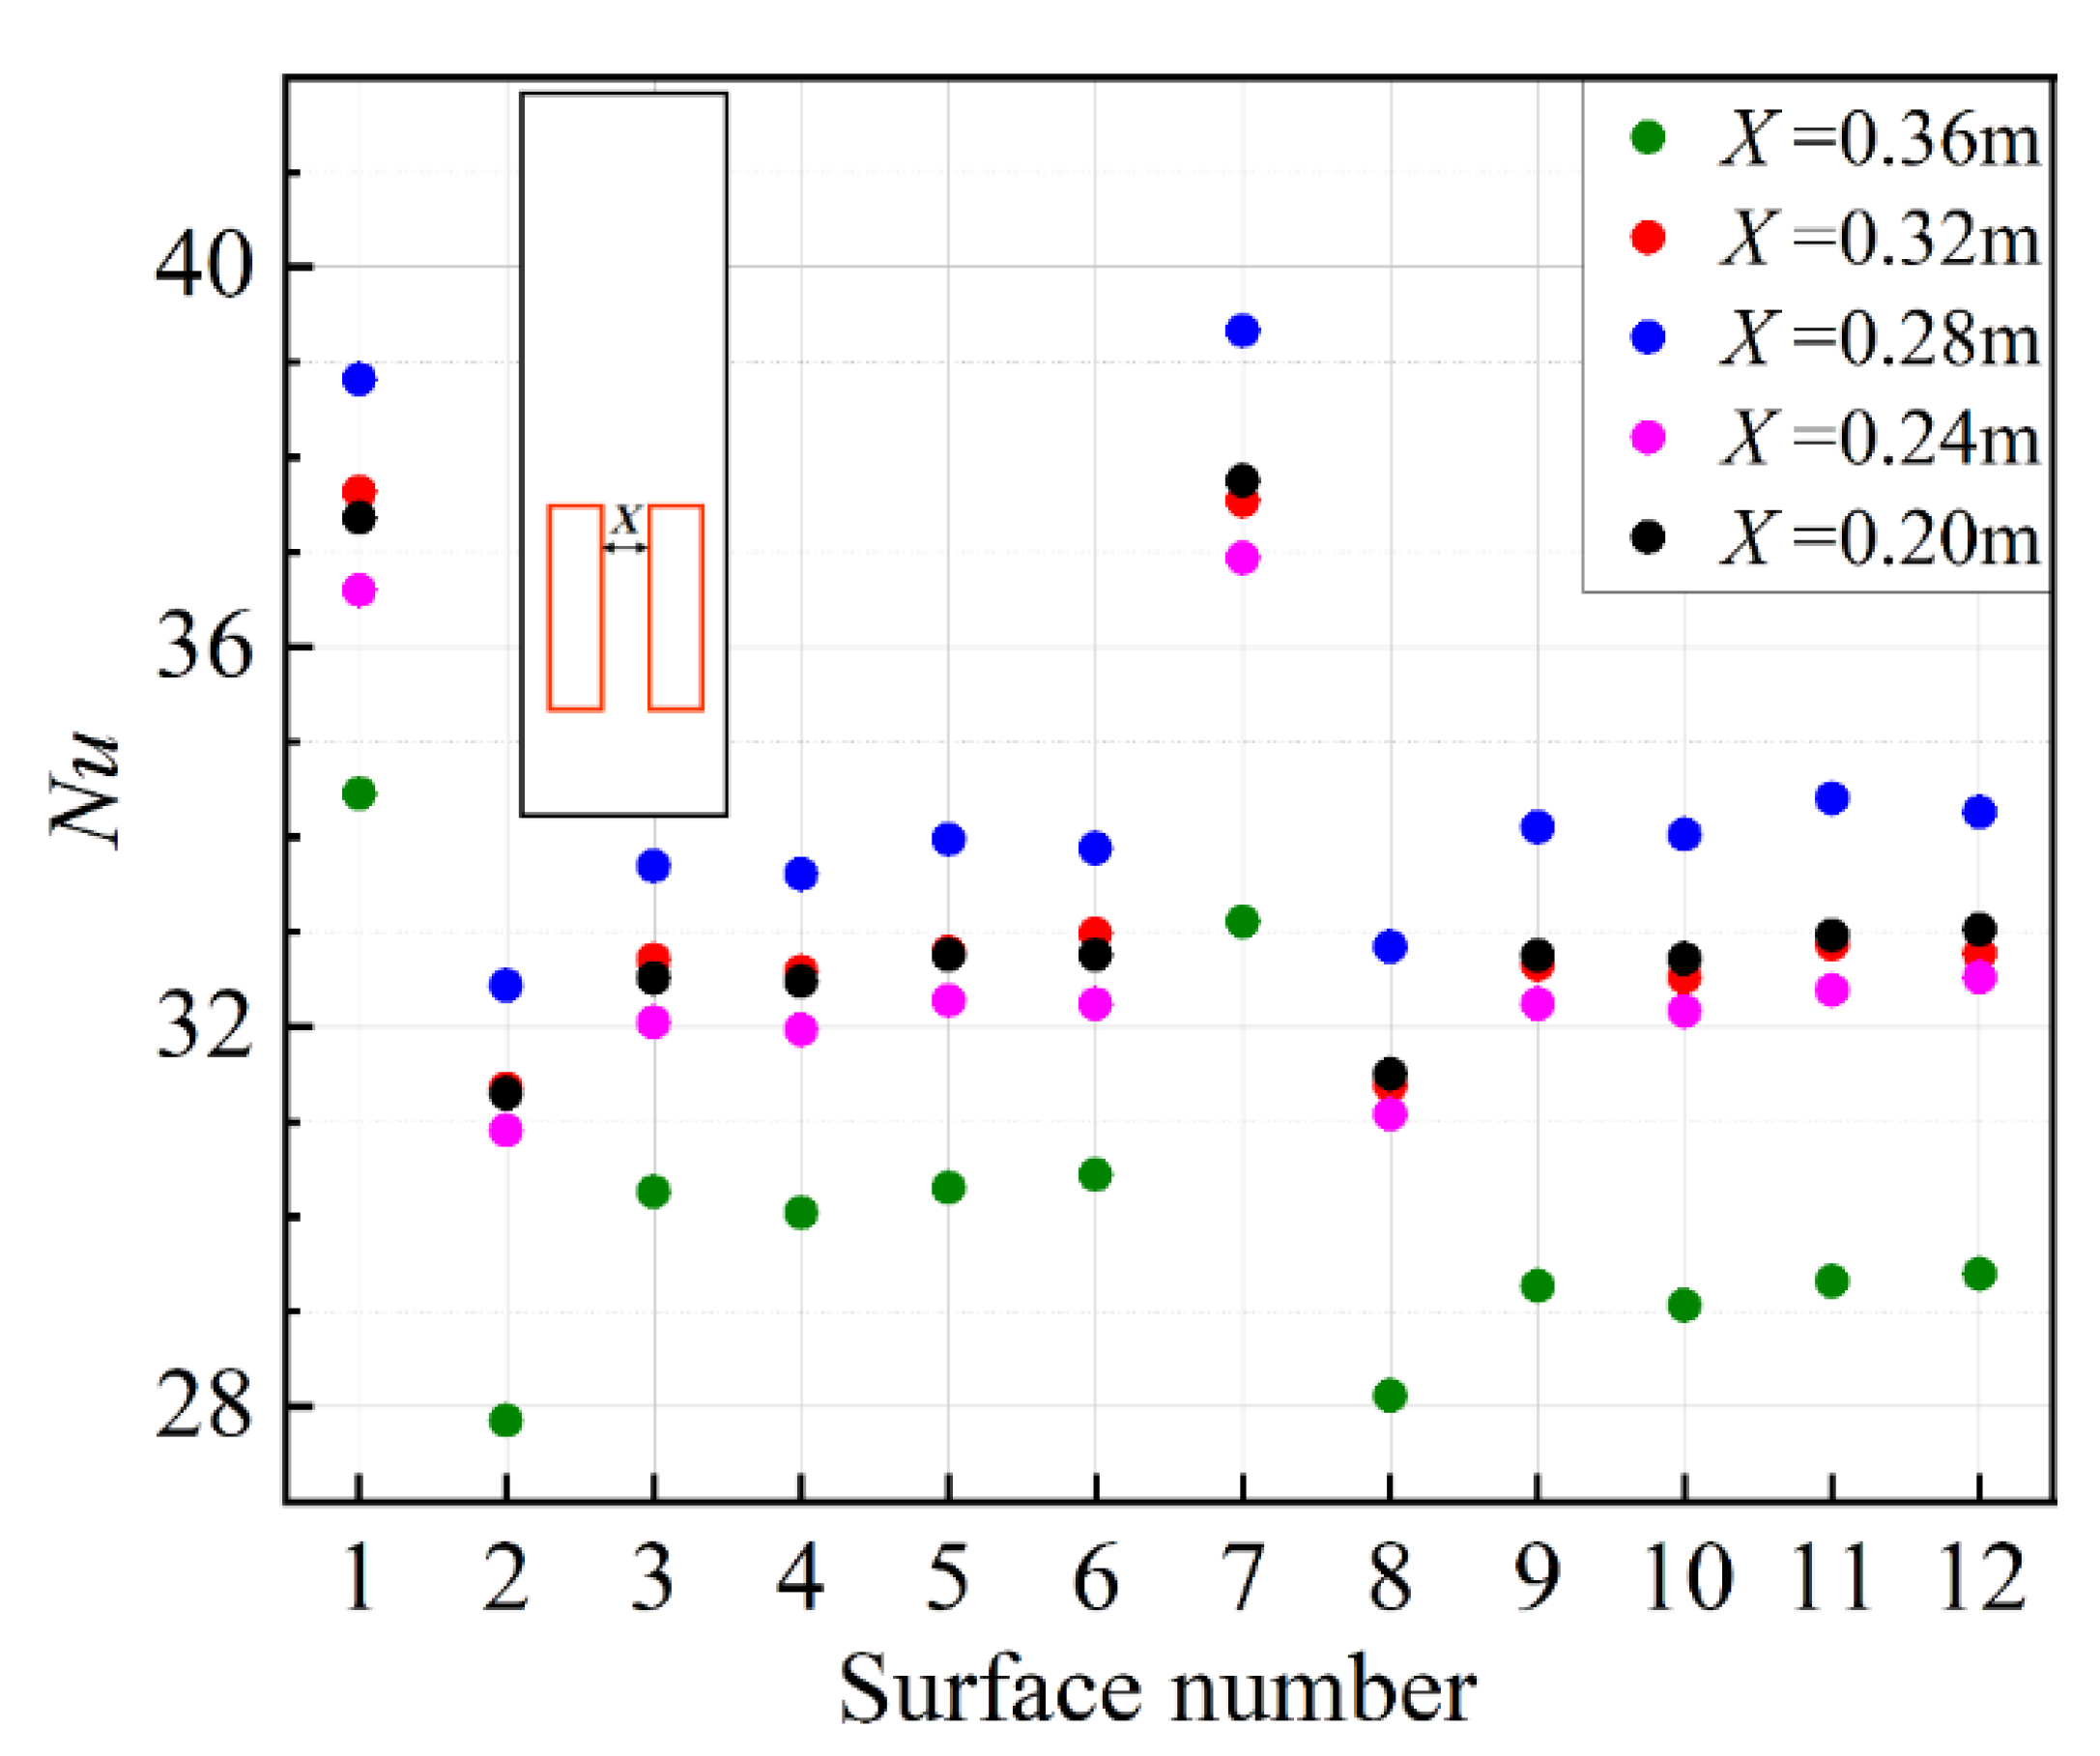
3.1. Effects of Horizontal Distance X

Figure 3 shows the temperature and velocity vector distributions in the open-ended square channel with a different horizontal distance X at L = 0. The main flow direction of air in the open-ended square channel is vertically straight up, along the z direction. The temperature of the air is lower near the outlet, while it is higher near the heat sources. Thus, the air flows from the inlet to the outlet are generated by buoyancy force due to the nonuniform air density. As X decreases from 0.36 m to 0.20 m, the maximum temperature on the surfaces of the heat sources decreases from 397 K to 388 K, and the maximum velocity of the air flow in the channel decreases from 2.54 m/s to 2.03 m/s, as shown in Figure 3a. The temperature distributions of the heat sources and air in the open-ended square channel are nonuniform, as shown in Figure 3b. In addition, the temperature is always lower at the bottom of heat sources and higher at the top. It is because the cold air firstly flows around the bottom of heat sources to take the heat, and then moves to the top of heat sources. When X decreases, not only the maximum temperature but also the air temperature around the top of heat sources decreases markedly, as displayed in Figure 3a,b. It means the decrease of X contributes to weakening the buoyancy force, which results in a decrease in the maximum velocity of the air flow, as shown in Figure 3a,c. With the increase of X, the velocity of the air flow in the region between S3 and S9 rises, the maximum value of the velocity in the z direction increases, and the velocity of the air flow in the region directly on the opposite of S4 and S10 drops and the range of the vortex over S2 and S8 is enlarged, indicating an increase in the region of lower flow velocity, as shown in Figure 3c.
Figure 4a illustrates the temperature distribution of vertical lines on S3 and S4 along the z direction at different X. The local temperature of S3 and S4 increases and then decreases mildly along the z direction. As X decreases, the temperature distribution hardly changes, which decreases to a minimum point and then increases, with the lowest temperature occurring at X = 0.28 m. Figure 4b,c give the vertical velocity along the x direction at different slicing positions marked in Figure 3c and different X, respectively. At X = 0.36 m and z = 1.26 m, the distribution of the vertical velocity exhibits a shape of “W”, corresponding to the vortexes in Figure 3c. In more detail, the vertical velocity reaches its maximum at the center of the open-ended square channel, while the minimum vertical velocity is located near the top of the heat sources, x/D = 0.2 and 0.8. As the vertical altitude z rises, the maximum vertical velocity decreases, while the vertical velocity at x/D = 0.2 and x/D = 0.8 increases. Thus, the distribution of the vertical velocity changes gradually from the “W” shape to a parabolic shape. The vertical velocity at z = 0.45 m increases in the center of the open-ended square channel but decreases in the regions near the channel walls with the increase of X, as shown in Figure 4c.
Figure 5a gives the distribution of Nusselt number Nu on S3. Figure 5b gives the local Nusselt number Nuz of the lines on S3 and S4 along the z direction at different horizontal distances X of 0.36 m. The maximum value of Nuz appears near the bottom corners of S3, while the minimum value appears in the medium top region, as shown in Figure 5a. It is because the cold air first contacts with the heat sources at the bottom. The Nuz decreases first and then increases along the z direction, as displayed in Figure 5b. The reason why the Nuz minimum occurs in the middle top region of the heat source is that the air flow rate decreases and the temperature increases in this part, while the presence of vortices at the top deteriorates the heat transfer. Moreover, the Nuz also increases and then decreases with the decrease of horizontal distance, with the maximum value at X = 0.28 m because the layout at this point can get a higher flow rate and a smaller range of vortices. The difference between the maximum and minimum Nuz is generally 6 regardless of the magnitude of X, as shown in Figure 5.
Figure 6 gives the average Nusselt number, Nu, of each surface of two heat sources. The maximum Nu always appears at the bottom surface of heat sources (S1 and S7), and the minimum Nu at the top surface (S6 and S12). In addition, as X decreases, Nu increases and then decreases, with the minimum and maximum values at X = 0.36 m and X = 0.28 m, respectively. For both heat sources, the most likely locations for heat transfer deterioration are the two top surfaces (S6 and S12). For different X, the best air flow heat dissipation occurs when X = 0.28 m.

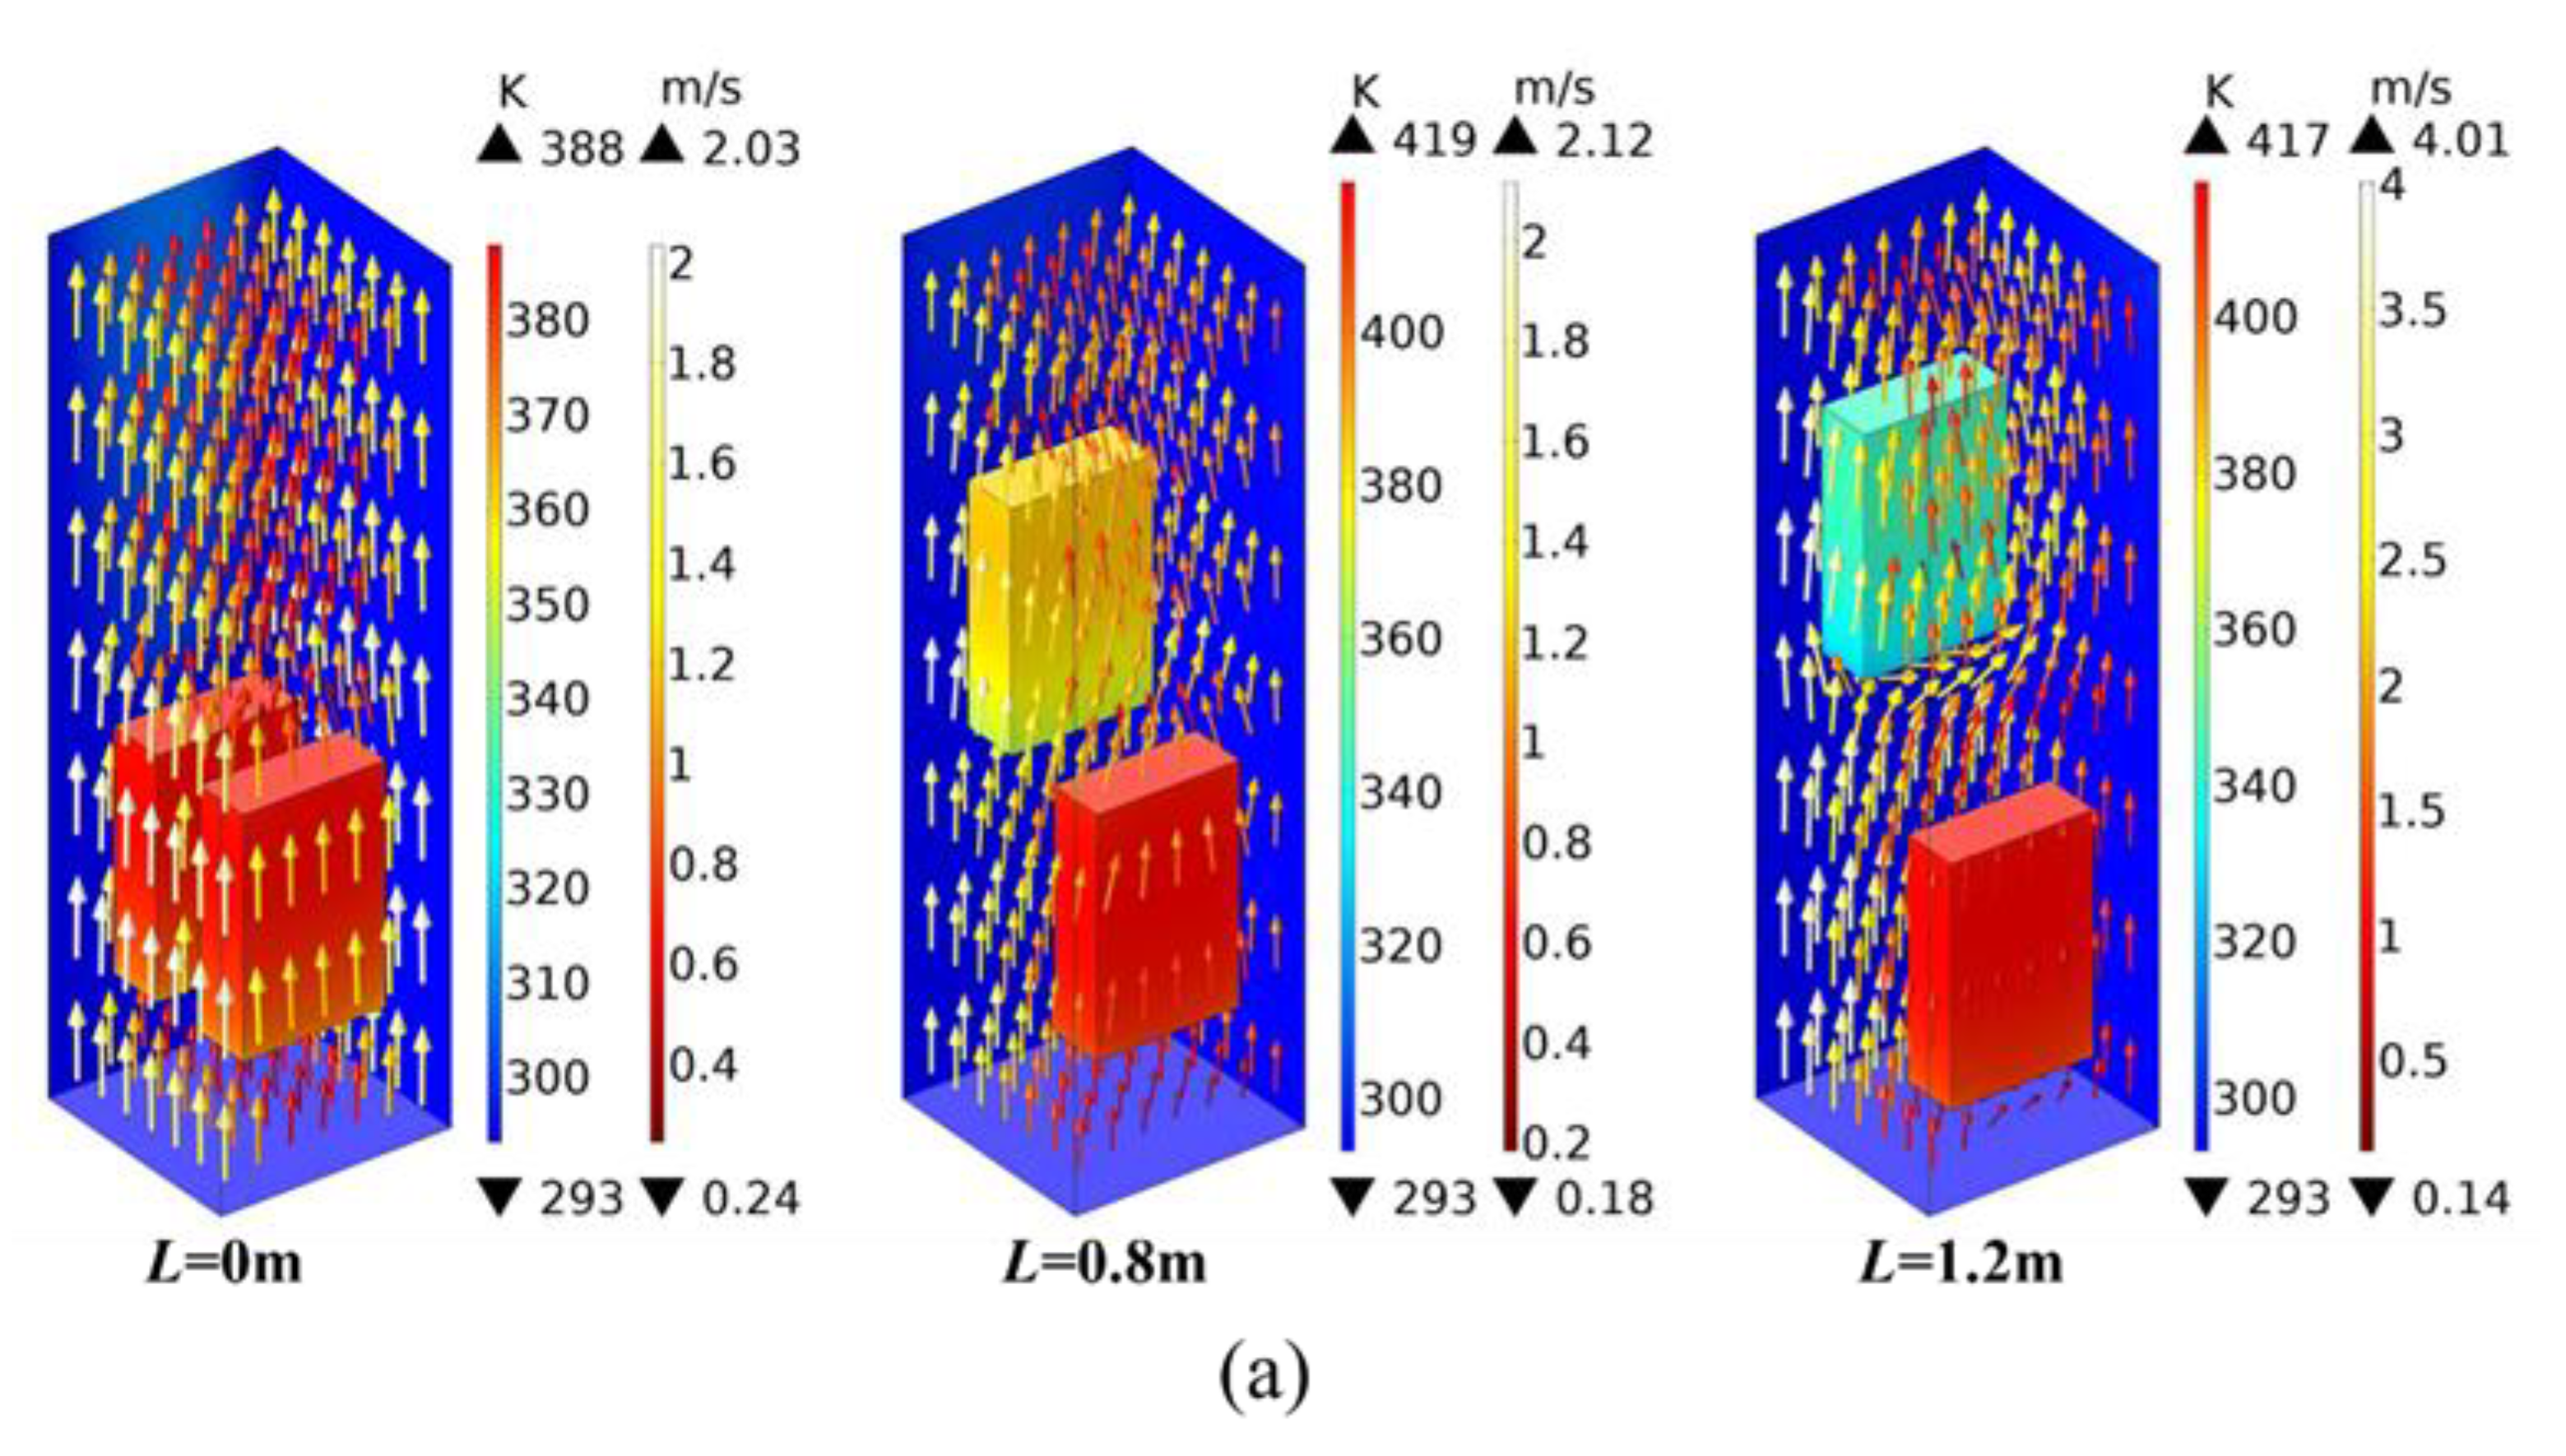
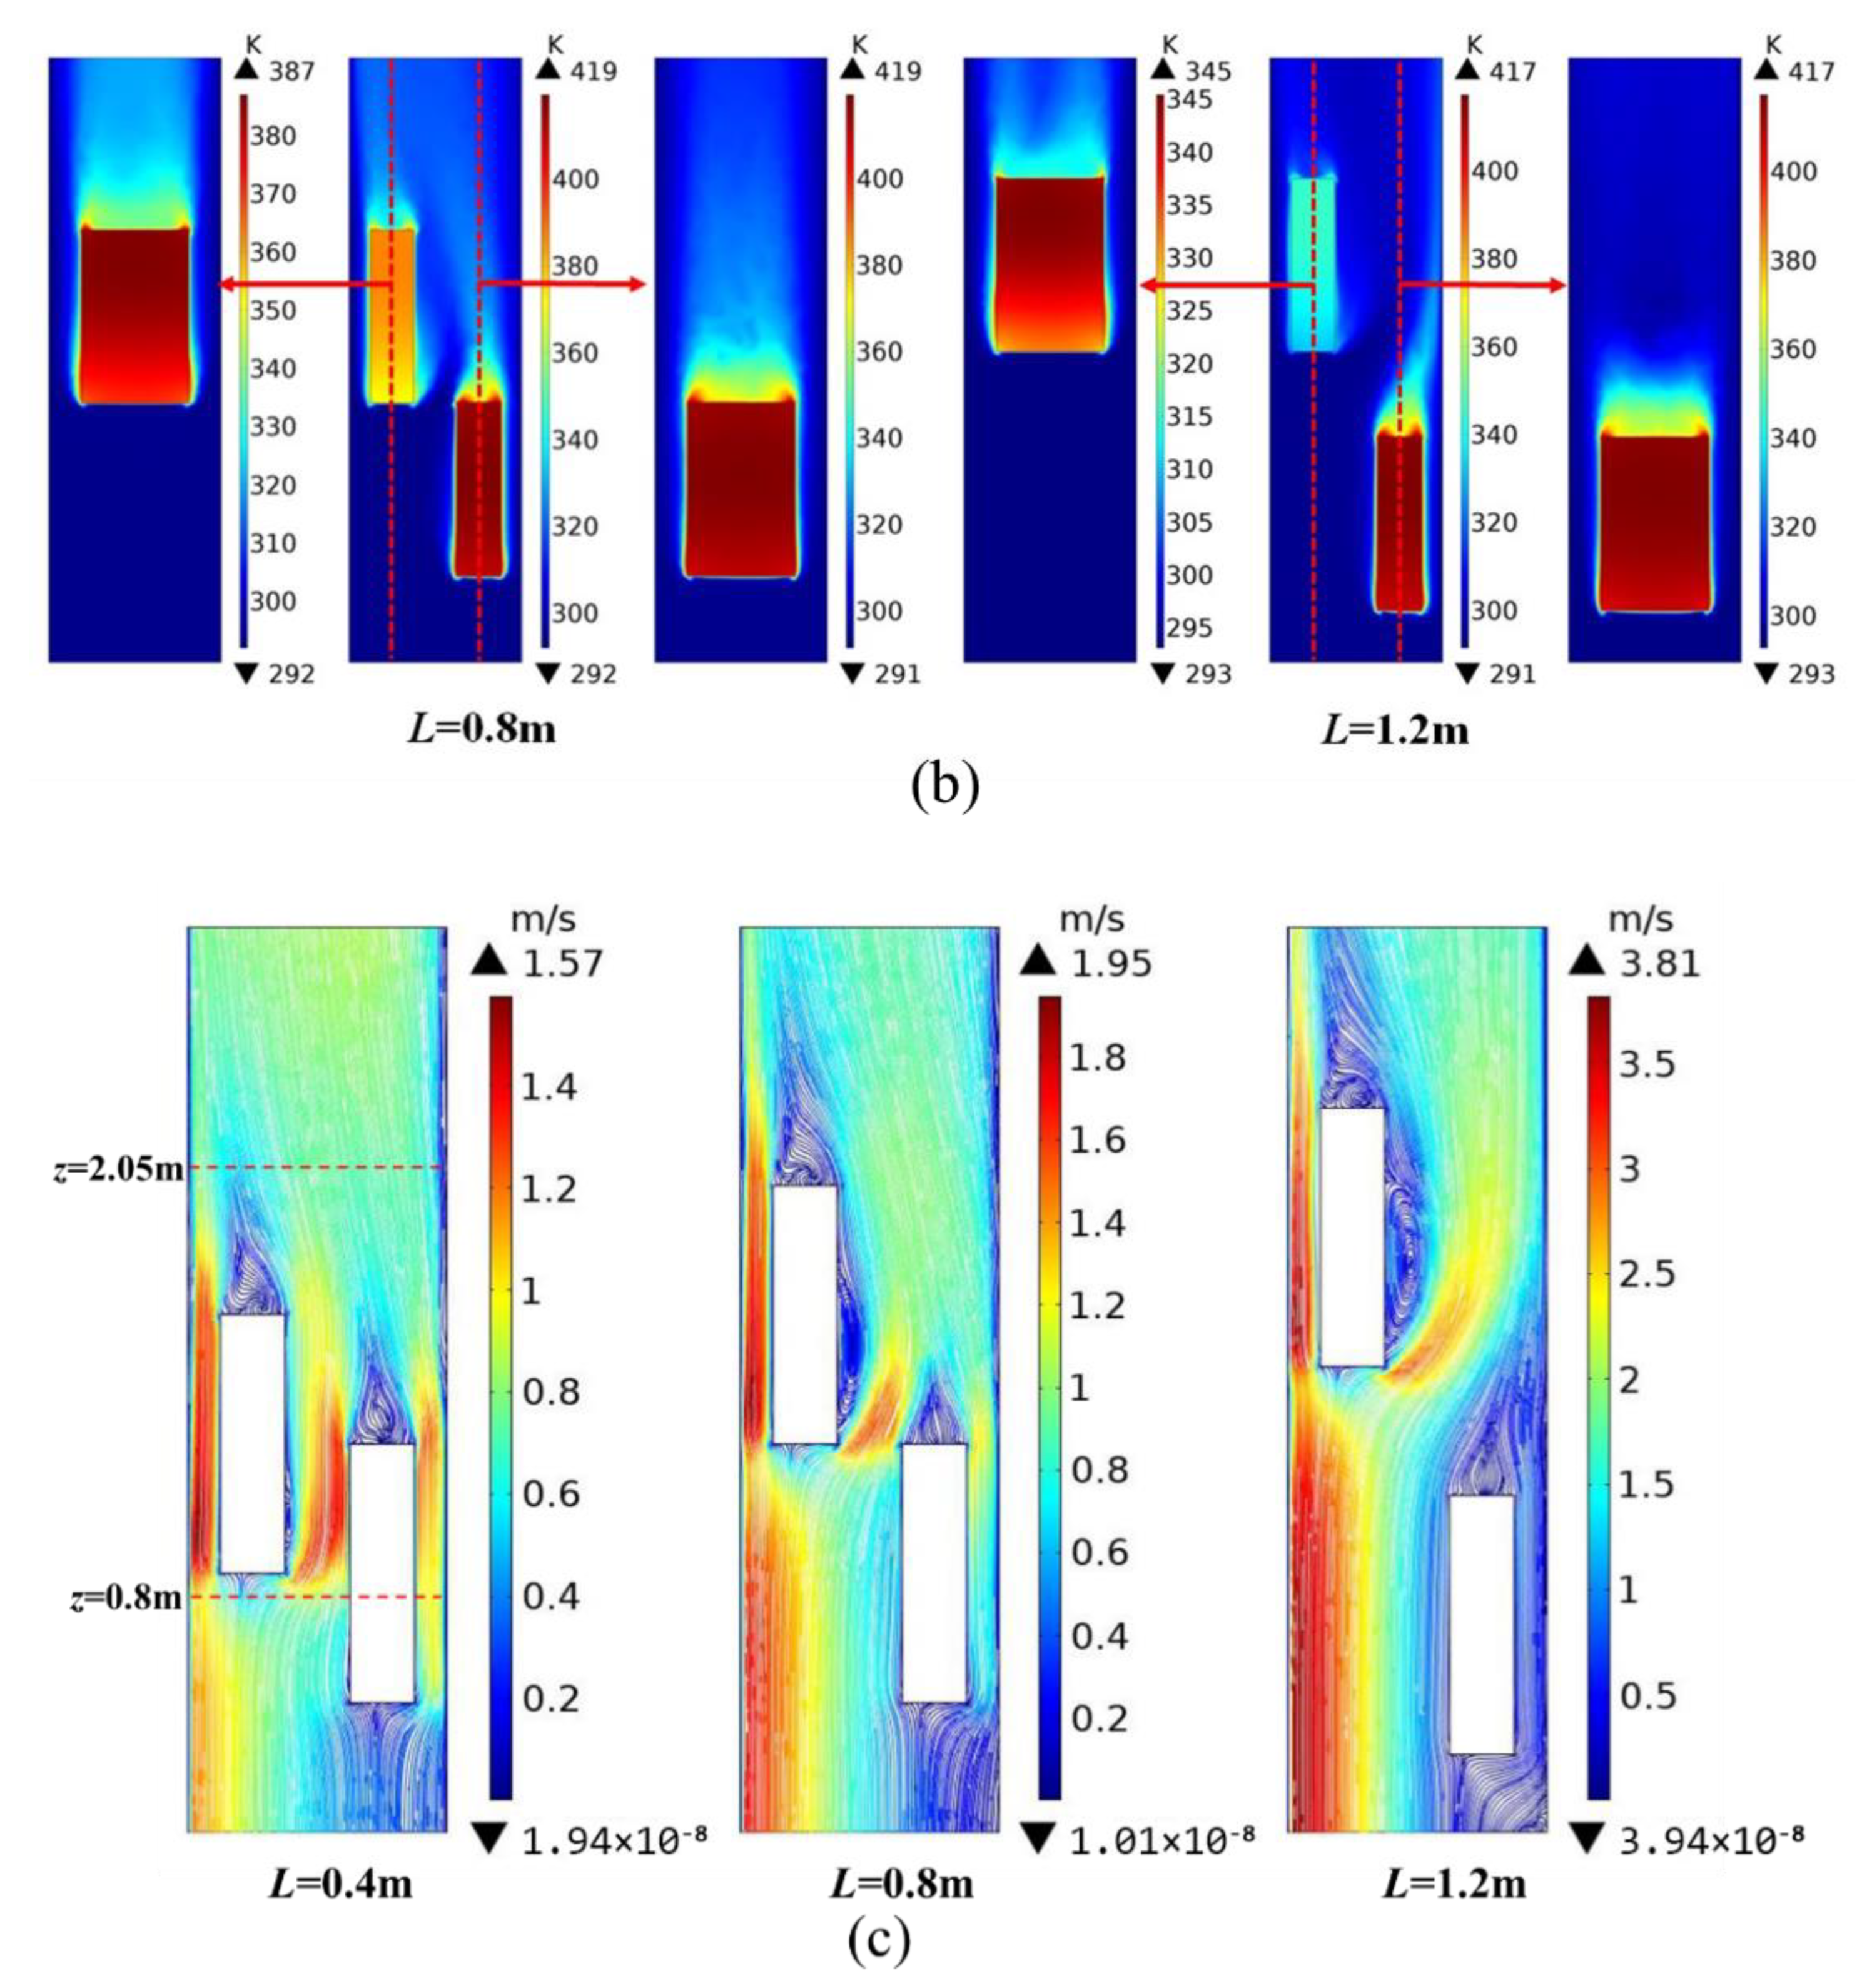
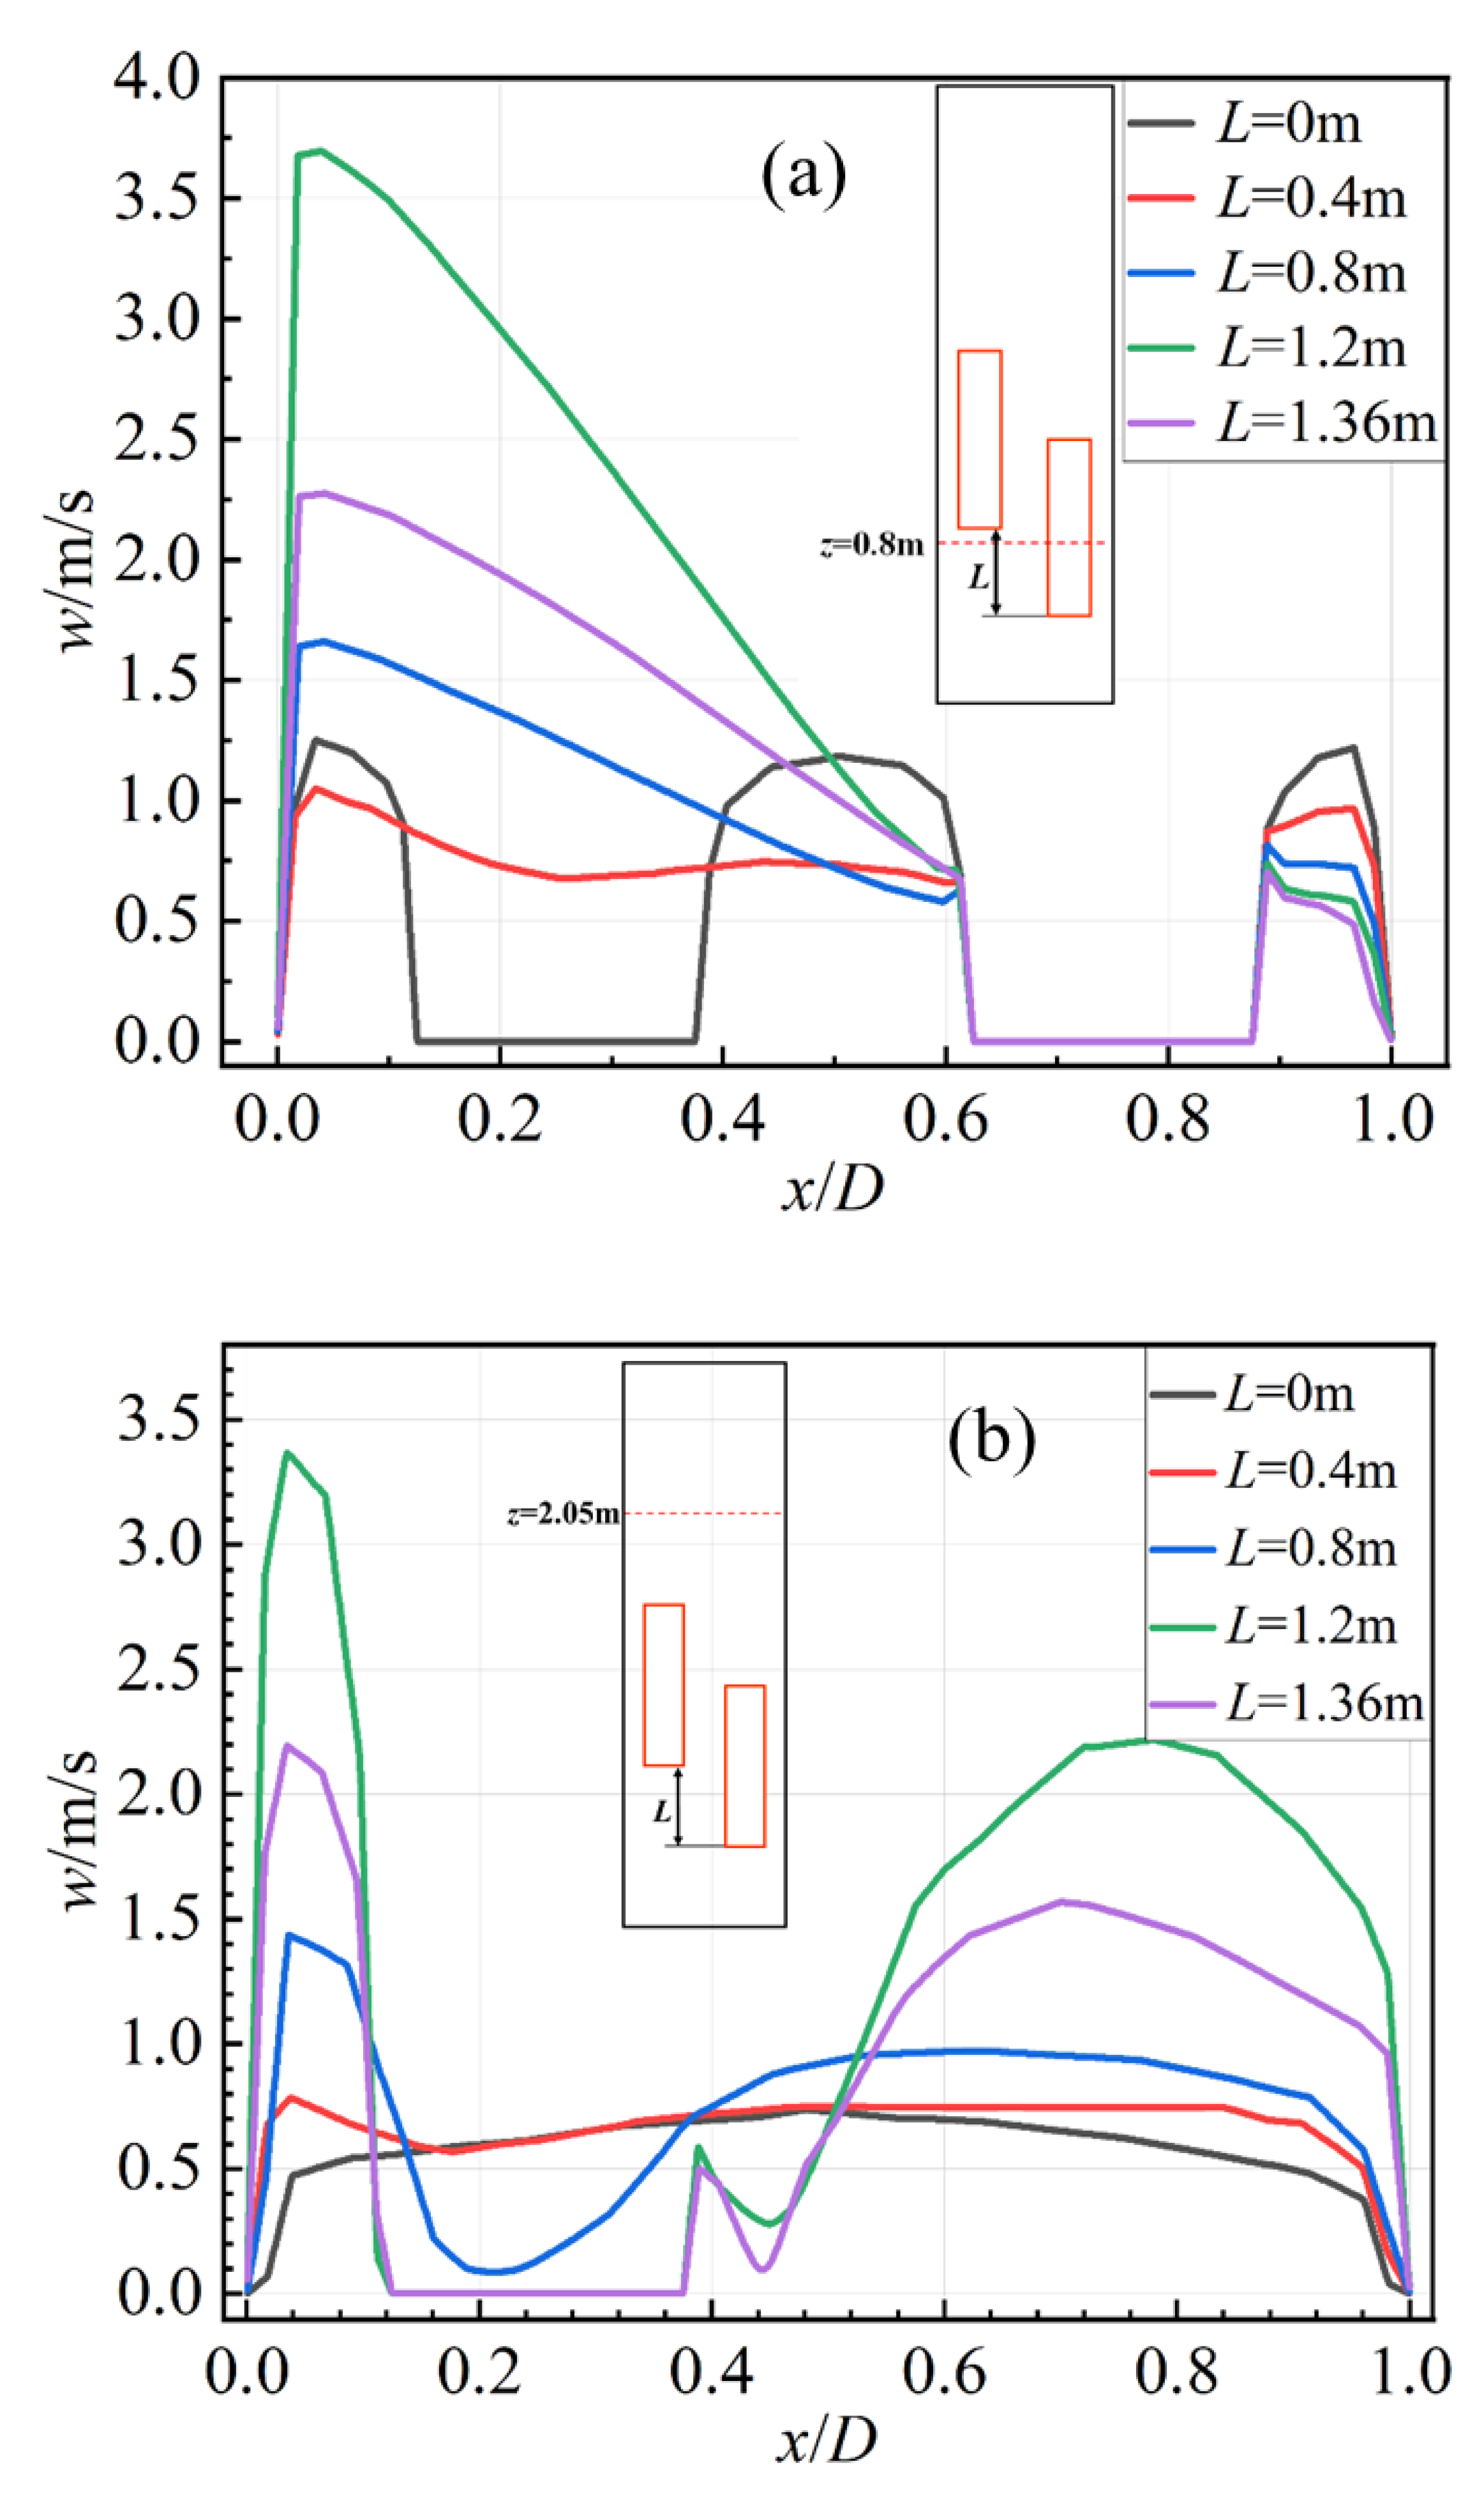
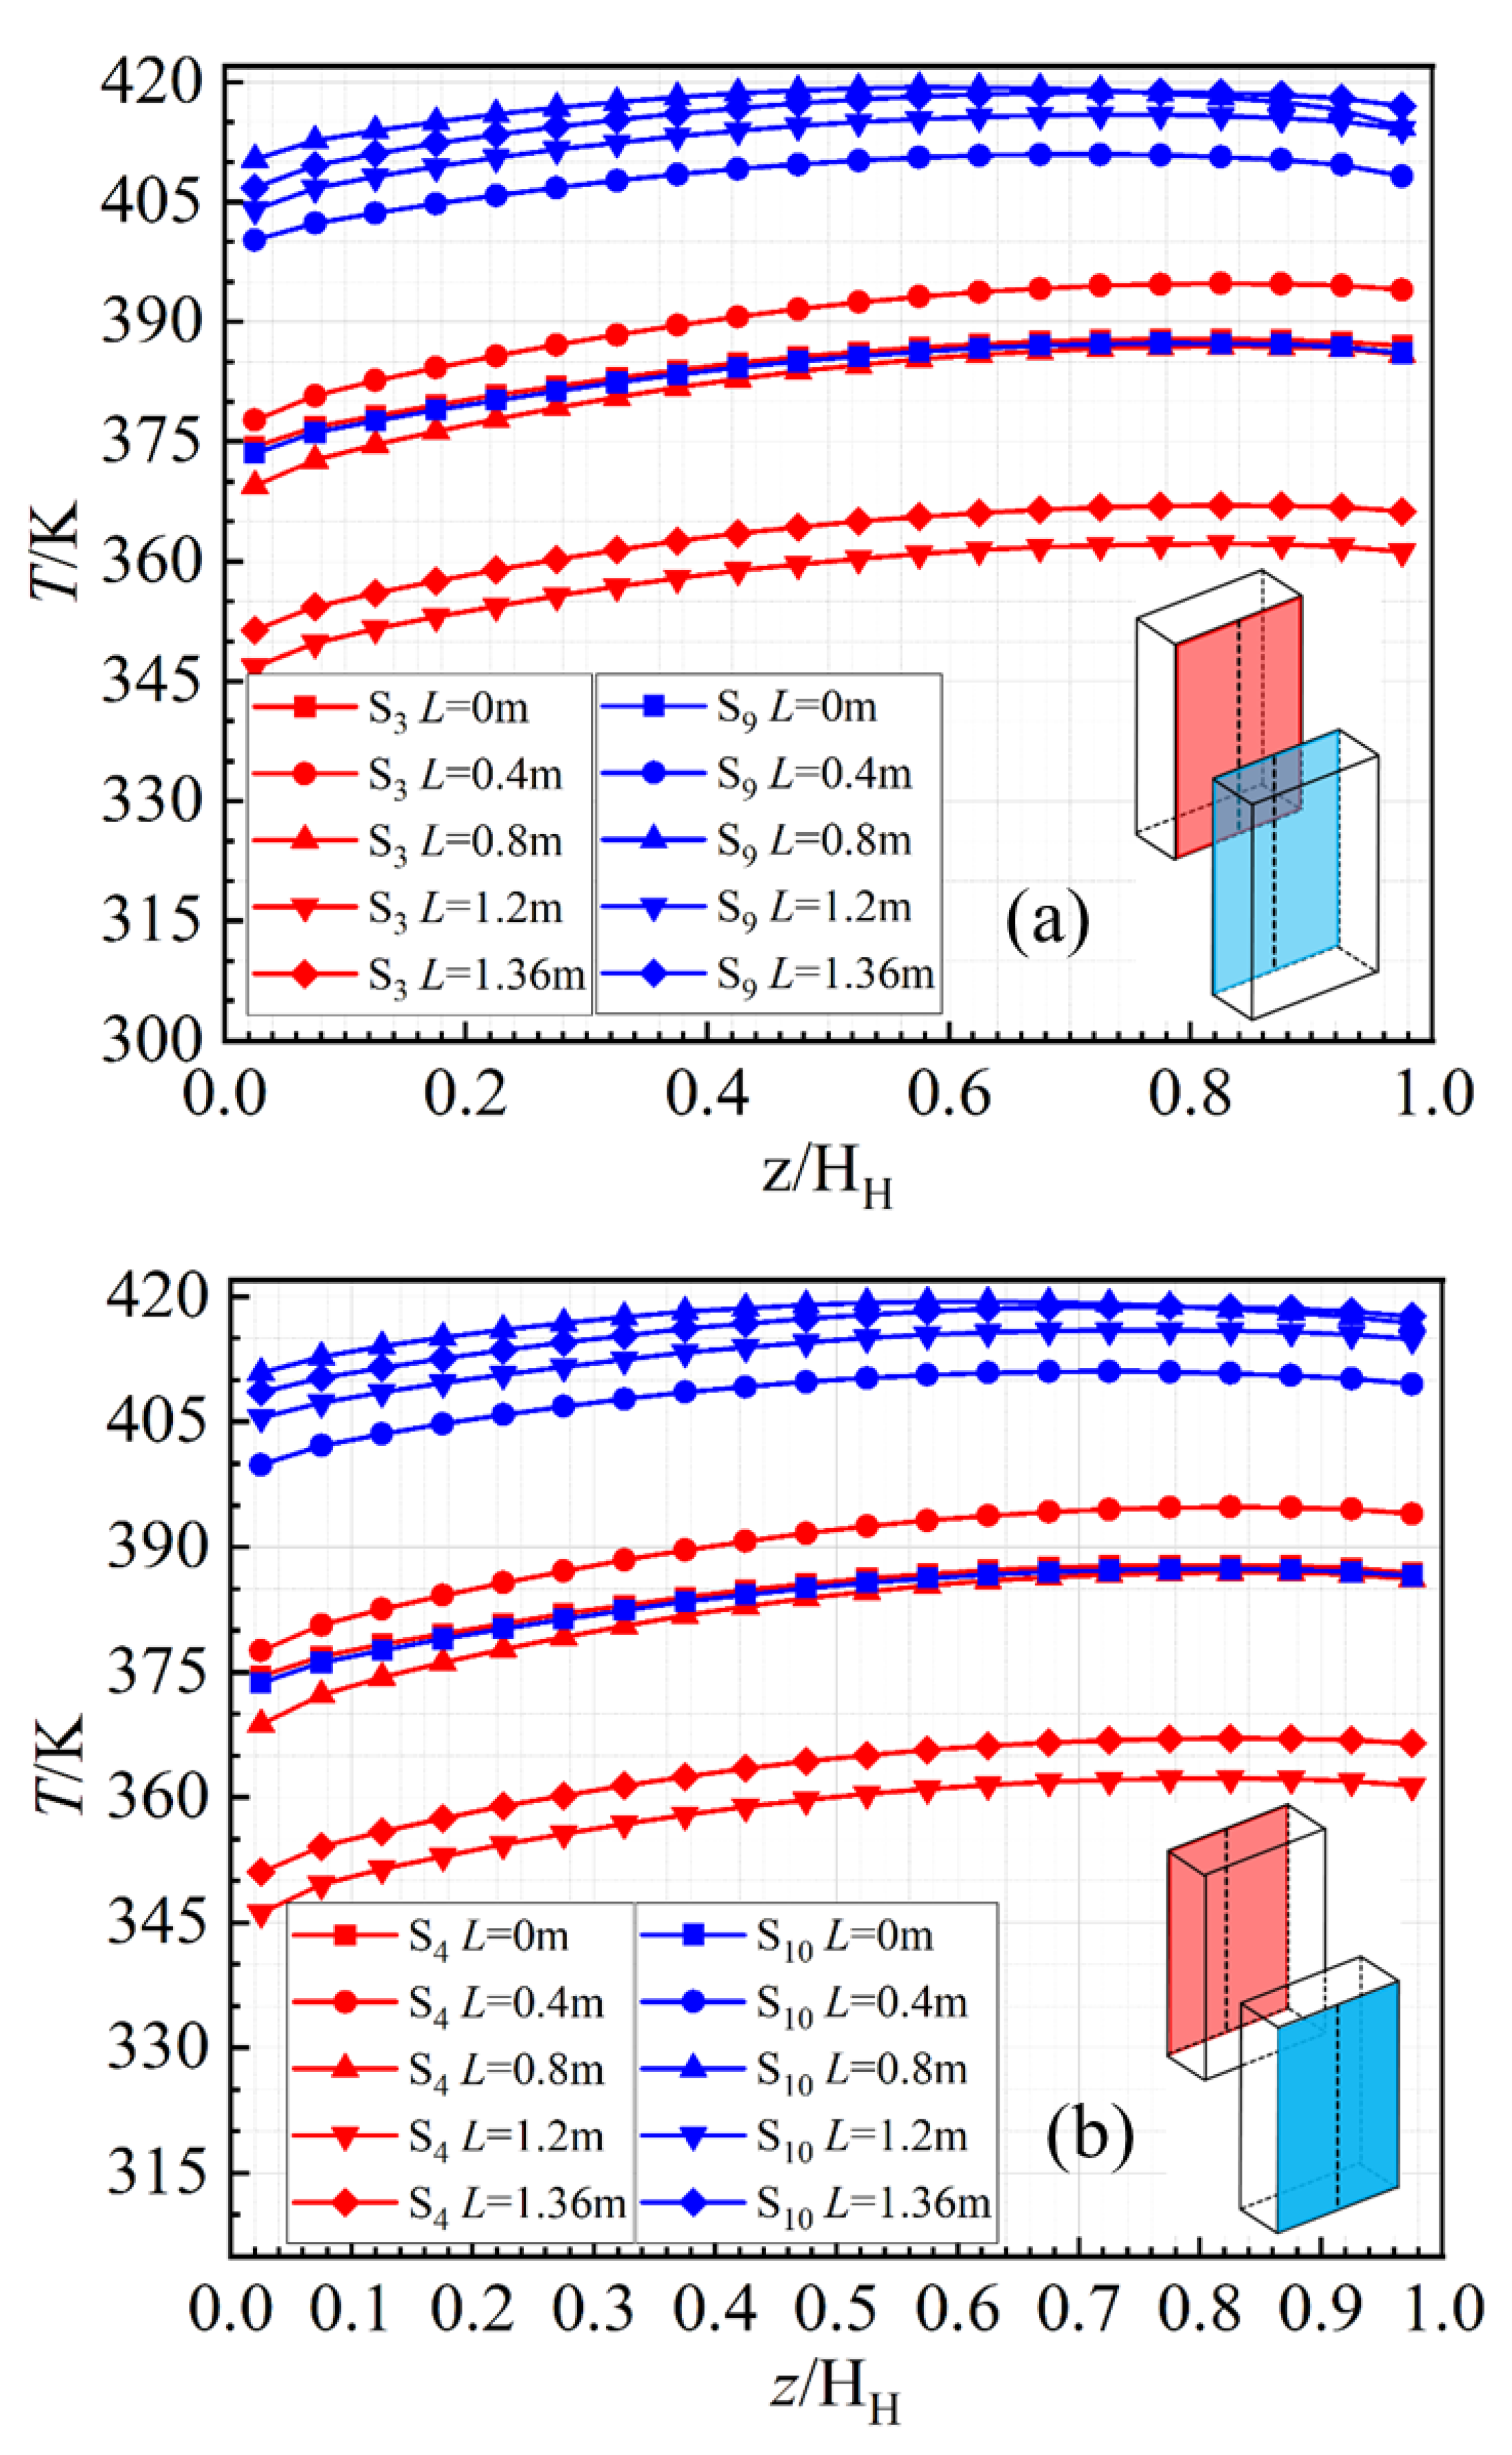
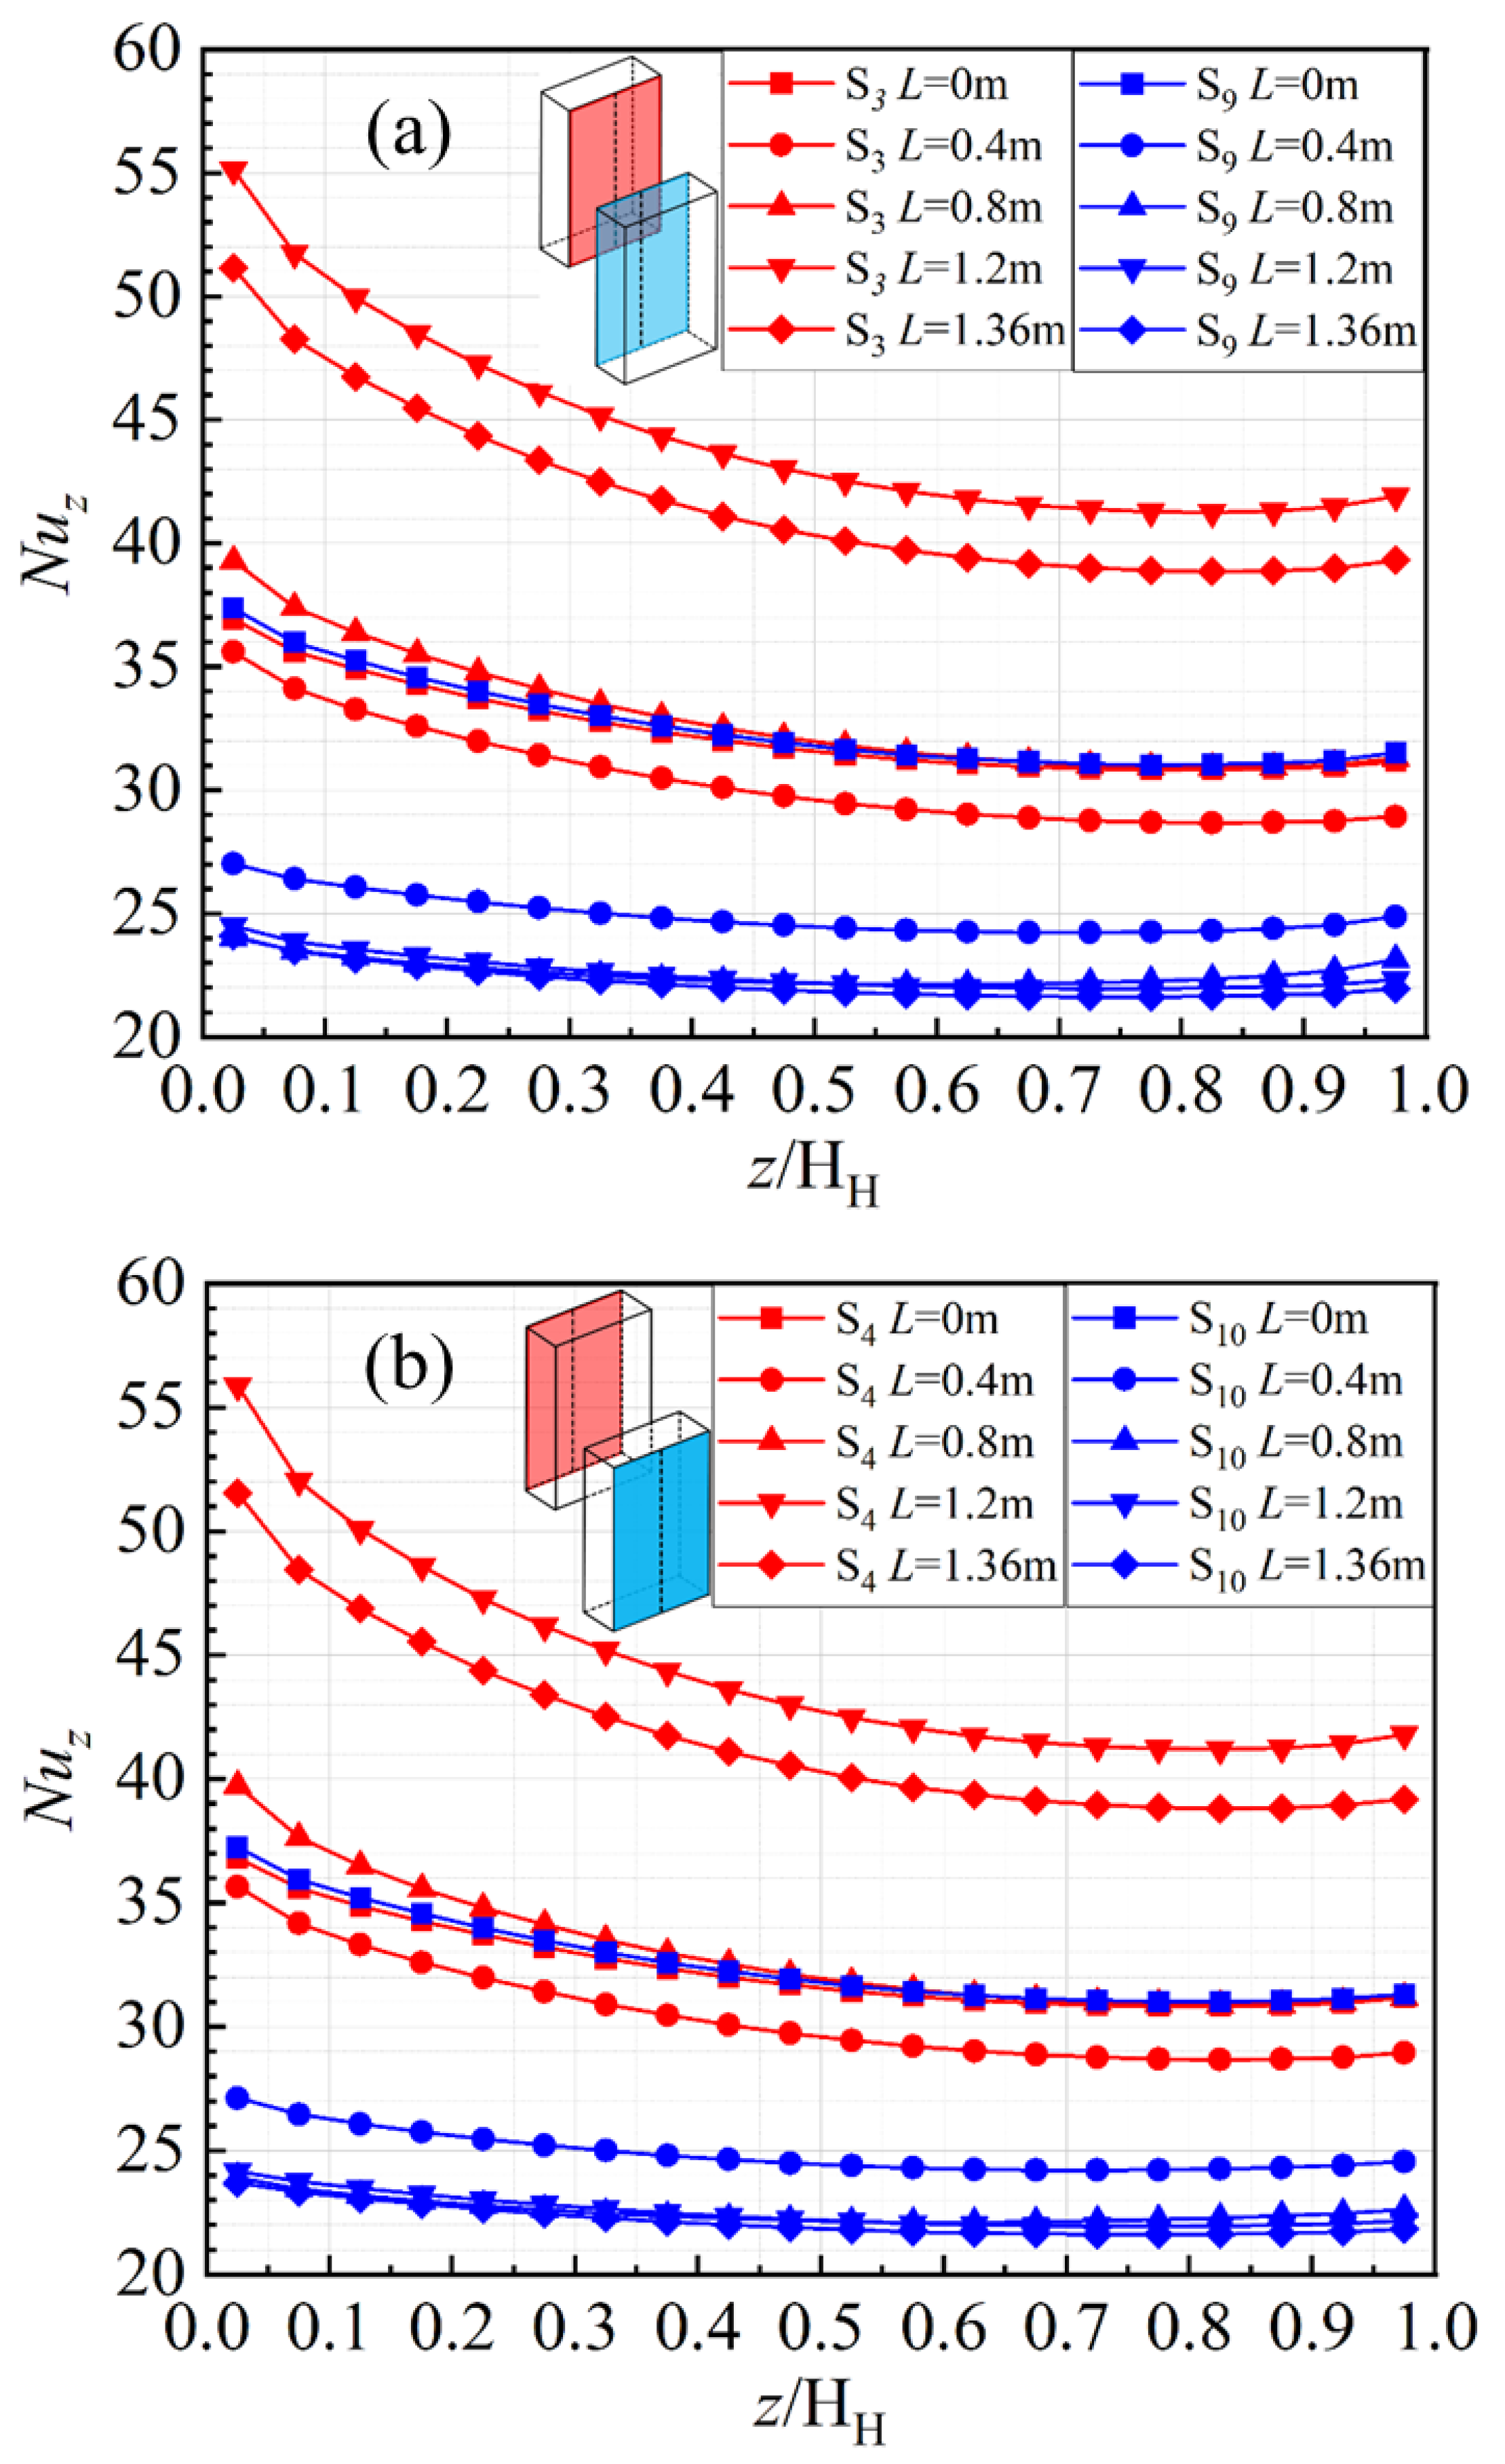
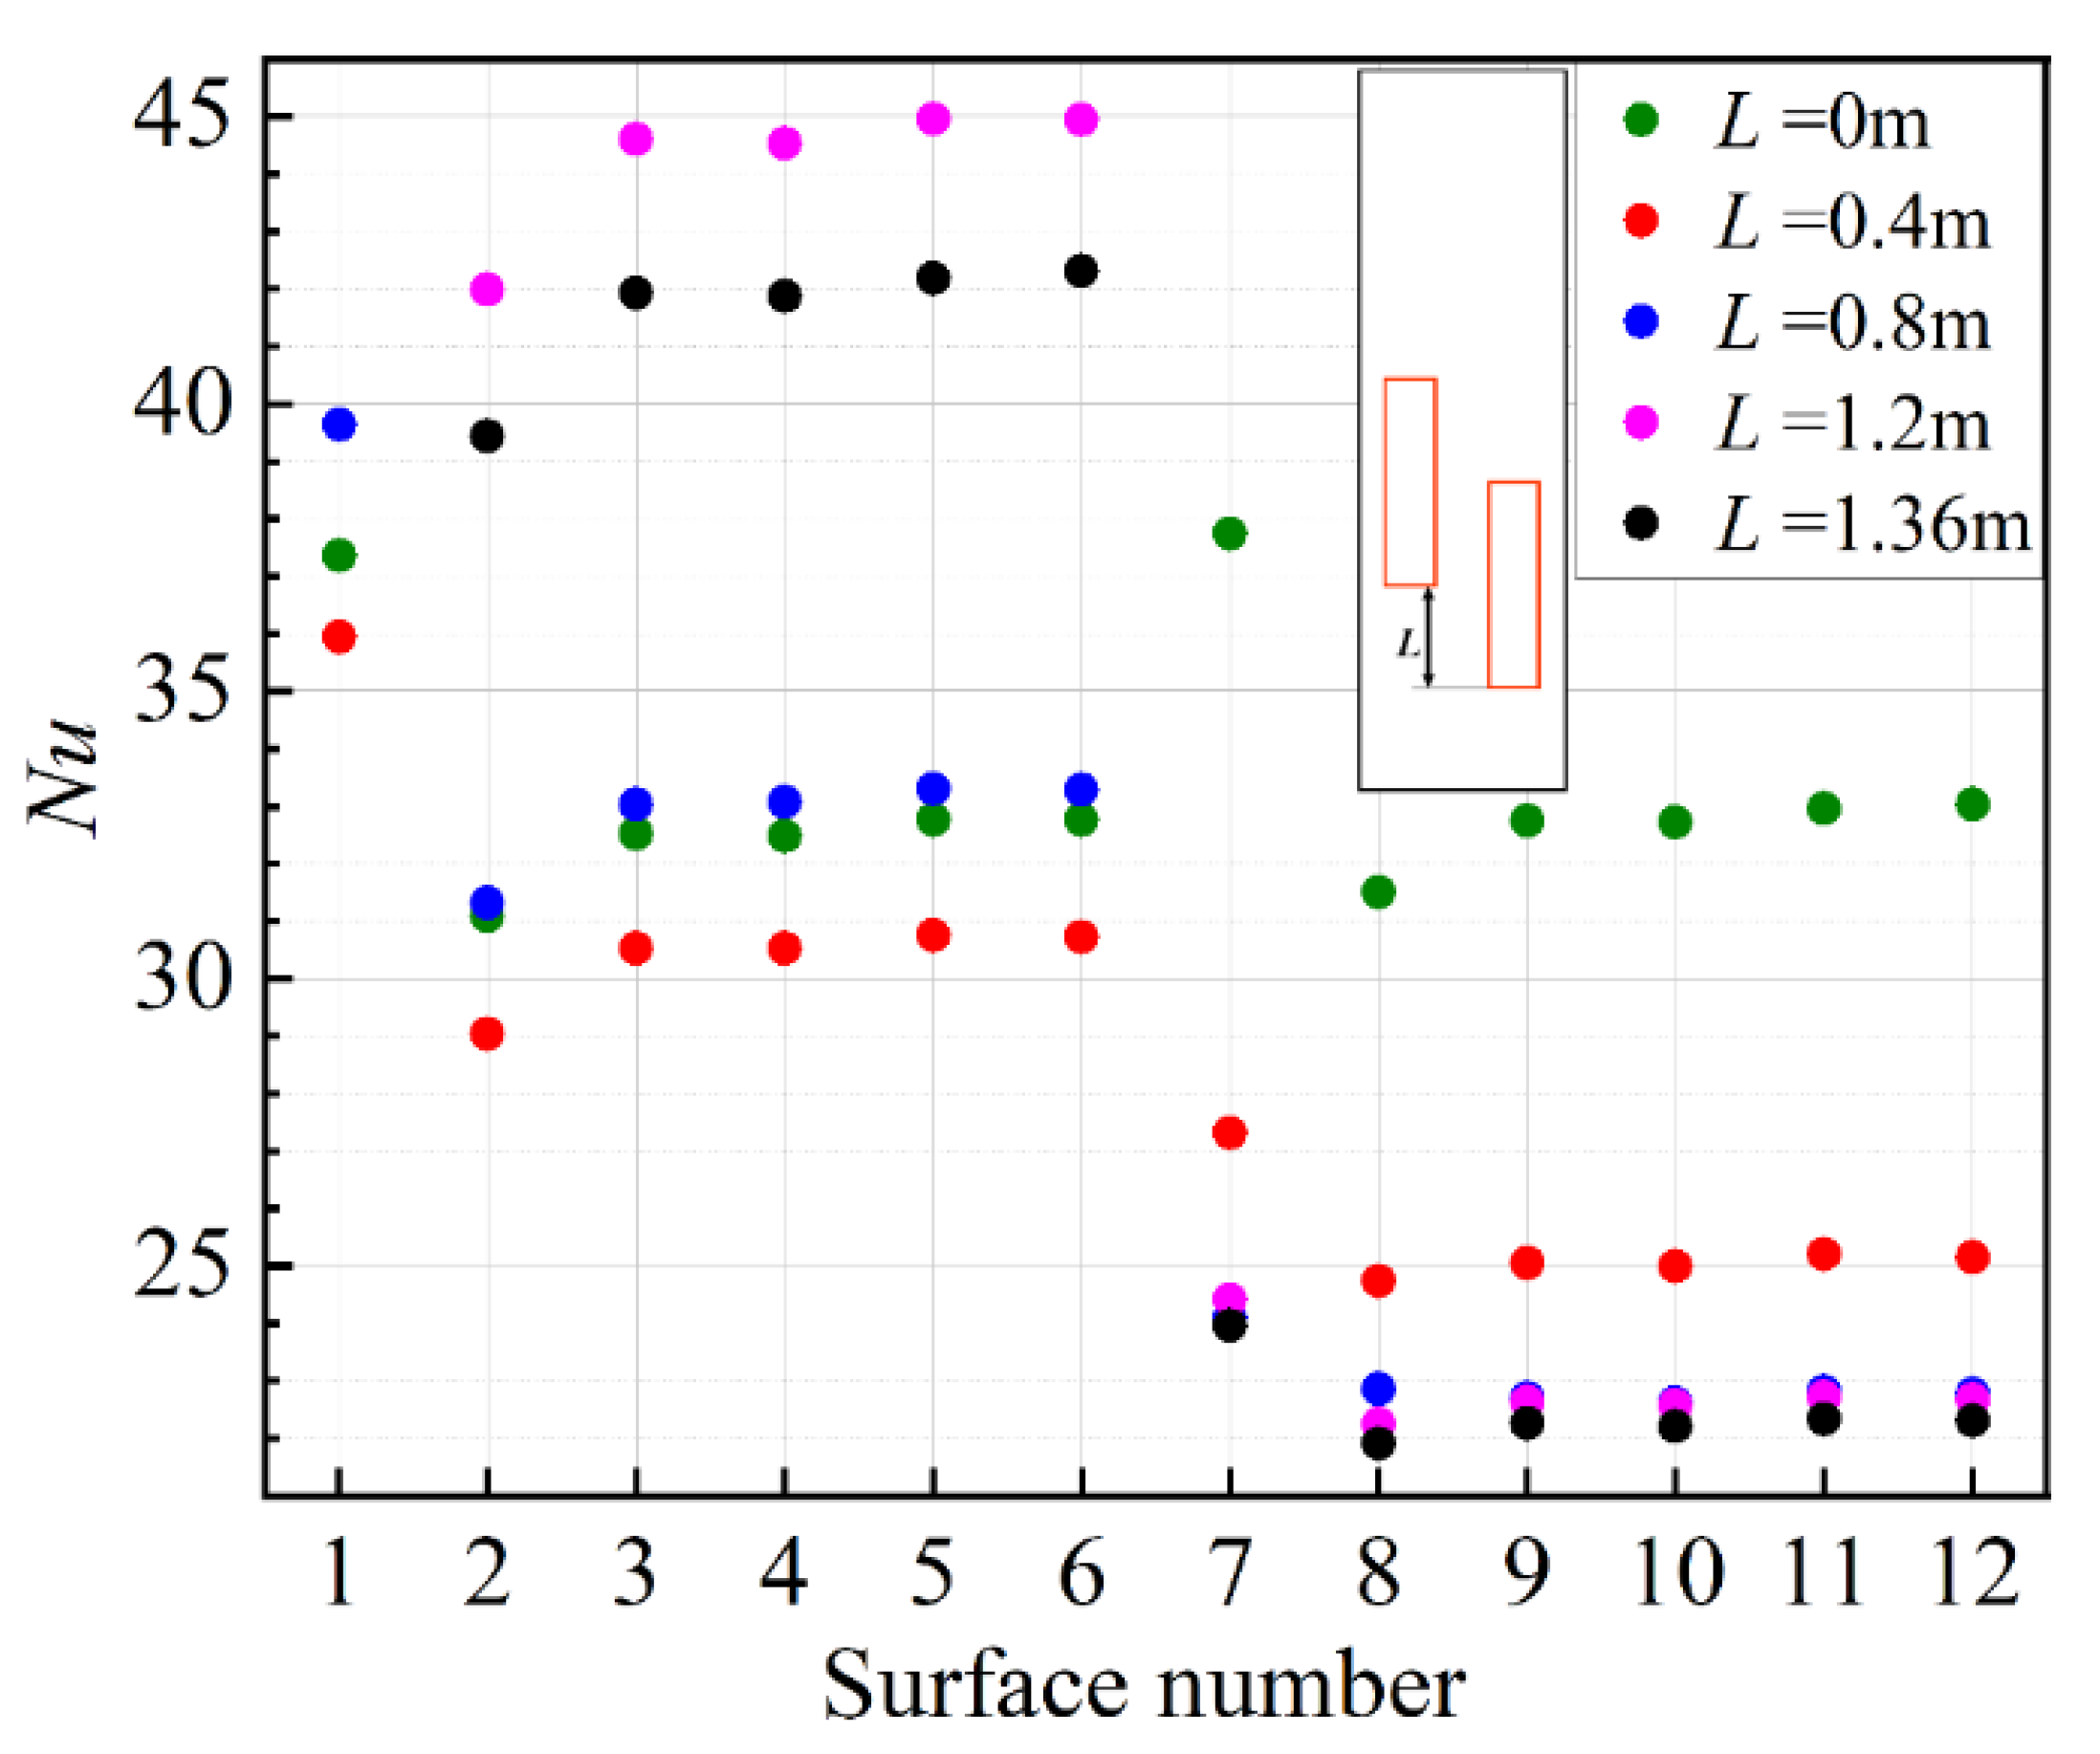
3.2. Effects of Vertical Altitude Difference L

In Figure 7, the temperature and velocity vector distributions in the channel with a different vertical altitude difference, L at X = 0.36 m, are presented. As shown in Figure 7a, the flow direction of the air in the channel is straight up around the heat sources. The maximum temperature appears on the surface of the right heat source, while the surface temperature of the left one is lower. The maximum surface temperature of the heat sources increases with the increase of L until it reaches around 419 K, while the maximum air velocity keeps increasing. As L increases, the temperature of the right heat source remains high while the temperature of another one decreases, as is shown in Figure 7b. Thus, it can be concluded that the increase of L hinders the heat exchange of the right heat source and enhances that of the left heat source. As is shown in Figure 7c, the average air velocity decreases around the right heat source and increases around the left one, while the maximum air velocity keeps increasing. Moreover, the increase of L lowers the air velocity at the entrance of the channel at the bottom of the right heat source, leading to a decrease in the air velocity between the right heat source and the walls of the channel.
Figure 8 shows the vertical velocity distributions of the cross section in Figure 7c at different vertical altitudes z marked in Figure 7c. As is shown in Figure 8, on the cross section where z = 0.8 m, with the increase of L, the left heat source rises. The air velocity of the region under the left heat source increases markedly to its maximum value at L = 1.2 m, and then decreases. In the region where 0.88 ≤ x/D ≤ 1.0 (the right spacing of the right heat source), the air velocity keeps decreasing, directly resulting in the weakening of the heat exchange, which is the reason why the temperature of the right heat source is higher. On the cross section where z = 2.05 m, with the increase of L, the rise of the left heat source leads to the increase of air velocity in the regions of 0 ≤ x/D ≤ 0.12 and 0.5 ≤ x/D ≤ 1.0, both reaching their maximum values at L = 1.2 m, which well enhances heat transfer and explains the temperature drop of the left heat source.
The influence of L on the local surface temperature of the heat sources is presented in Figure 9. As is shown in Figure 9, the local temperature on the surfaces of heat sources (S3, S4 on the left and S9, S10 on the right) increases with the increase in the vertical altitude. The temperature difference between S3 and S9 increases with the increase of L, especially at L = 1.2 m, while the minimum temperatures of S3 and S9 are 345 K and 405 K, respectively. For the left heat source, the temperature difference between S4 and S3 is low, and the local temperature gradually drops to the minimum at L = 1.2 m. For the right heat source, the temperature difference between S8 and S10 is low as well, while the local temperature increases and then decreases, with the maximum at L = 0.8 m.
The influence of L on Nuz on the surfaces of the heat sources is presented in Figure 10. With the increase of L, the Nuz of S3 and S4 increases and then decreases, while the Nuz of S9 and S10 gradually decreases to a certain constant value. This phenomenon corresponds to the change in the velocity distribution in Figure 8, while the increase of L results in the air flow in the channel leaning to the left heat source, and the increase in velocity leads to the enhancement of heat transfer. However, such enhancement is not persistent. The maximum value of the velocity in the channel decreases at L = 1.36 m, leading to the decrease of Nuz of the left heat source, which means that the increase of L only partially strengthens the convective heat transfer process of the left heat source. For the right heat source, the increase of L hardly affects Nuz while L is not less than 0.8 m. Therefore, the condition of the air flow around the right heat source is not apparently affected by the increase of L after it reaches a certain value. The condition of convective heat transfer remains stable, as is proven in Figure 7 as well.
The distributions of the average Nusselt number Nu of each surface of the heat sources with different L are illustrated in Figure 11. As the L increases, the Nu of the left heat source exhibits a fluctuating condition, with the minimum and maximum values at L = 0.4 m and L = 1.2 m, respectively. The Nu of the right heat source generally decreases, with the maximum value at L = 0 and the final values at around 20. The changes of Nu of all the surfaces are in good agreement with that for the single surface in Figure 10. In addition, comparing the different surfaces, the effect of heat exchange at the bottom is always better than the top, which is the same as the results shown in Figure 8. In summary, an increase in L enhances the heat dissipation of one heat source and weakens the heat dissipation of the other.

4. Conclusions

In this paper, the flow and heat transfer of natural convection in an open-ended square channel with two suspending heat sources are studied through numerical simulation. The layout of the heat sources directly affects the natural convection, which directly affects the heat dissipation on the surface of the heat sources. The flow field and temperature field in the channel with different geometric parameters of the heat sources are presented. The effects of the horizontal distance and vertical altitude difference of the heat sources on the average surface temperature and Nusselt number of the heat sources are discussed. The conclusions are as follows.
(1)
The local temperature of the suspended heat sources increases first and then decreases with the increase of the vertical altitude difference. The average Nusselt number reaches its maximum value at the bottom surface and its minimum value at the top surface. These patterns of the local temperature and average surface Nusselt number are independent of the horizontal distance and vertical altitude difference of the suspending heat sources.
(2)
As the horizontal distance increases, the maximum surface temperature increases from 388 K to 397 K, the air temperature around the top surfaces of the heat sources also increases to the maximum value of 0.36 m. The local Nusselt number at the side walls of the heat sources increases and then decreases, with a maximum value of 0.28 m and a minimum value of 0.36 m. In addition, the average maximum value of 33.5 and the difference between the average maximum value and the average minimum value remain at 6. In addition, the maximum vertical airflow velocity in the center increases from 2.03 m/s to 2.54 m/s, while the vertical airflow velocity near the channel walls decreases and the size of low-speed vortices over the top surfaces of the heat sources expands. The change in airflow velocity directly affects the heat dissipation and thus determines the temperature distribution. The layout with the best heat dissipation effect has a horizontal distance of 0.28 m.
(3)
As the vertical altitude difference increases, the surface temperature of the left heat source decreases while that of the right heat source increases, resulting in an increasing temperature difference from 0 K to 54 K between the two heat sources. In addition, the maximum vertical velocity around the right heat source is reduced by half, and the maximum vertical velocity around the left heat source is increased by a factor of 7. The change in the airflow velocity results in the slight fluctuation of the Nusselt number of the left heat source, together with the decreasing of the Nusselt number of the right heat source, and the minimum value is only 20. The increase in vertical altitude difference enhances the heat dissipation ability of one heat source and weakens the heat dissipation ability of the other heat source. To ensure the best heat dissipation of both heat sources, the best layout of vertical altitude difference is 0. It should be pointed out that the optimal arrangement of more suspended heat sources in a limited space open-ended channel is the future challenge in passive heat dissipation cooling technologies.

Author Contributions

Data curation, Q.L.; Formal analysis, Q.L.; Funding acquisition, Q.L. and P.L.; Investigation, Q.L., X.X., W.-P.L. and G.-Y.L.; Resources, J.X.; Supervision, J.-J.Y.; Writing—original draft, W.-P.L. and G.-Y.L.; Writing—review & editing, G.-Y.L. All authors have read and agreed to the published version of the manuscript.

Funding

This work is supported by National Science and Technology Major Project of China (2018ZX03001013-005), National Key Research and Development Program of China (2019YFF0303105), Open Fund of State Key Laboratory of High-Temperature Gas Dynamics (No. 2021KF14) and Guangdong Provincial Key Laboratory of Distributed Energy Systems (No. 2020B12120 60075).

Institutional Review Board Statement

Not applicable.

Informed Consent Statement

Not applicable.

Data Availability Statement

The data presented in this study are available on request from the corresponding author.

Acknowledgments

The authors thank the support of China Unicom Smart City Research Institute and School of Energy and Power Engineering, Chongqing University for offering sufficient resources during the investigation process.

Conflicts of Interest

The authors declare no conflict of interest.

Nomenclature

Avertical distance from the bottom of the right heat source to the inlet (m)
cpspecific heat capacity (J/kg K)
Ddepth of the vertical open-ended square channel (m)
DHdepth of heat source (m)
gacceleration due to gravity (m/s2)
hzlocal convection heat transfer coefficient (W/m2 K)
Hheight of the vertical open-ended square channel (m)
HHheight of heat source (m)
kthermal conductivity (W/m K)
Ldistance between two heat sources bottom surface (m)
Lzlength of heat source in z-direction (m)
Lsfeature length of selected surfaces (m)
NuNusselt number
Nuzlocal Nusselt number
ppressure (Pa)
patmatmospheric pressure (Pa)
Pthermal power (W)
P0thermal power of heat source (W)
Psthermal power of selected surfaces (W)
Ttemperature (K)
Twaverage temperature of one surface (K)
Tambient temperature (K)
uvelocity along x-direction (m/s)
vvelocity along y-direction (m/s)
Vvolume of a single heat source (m3)
wvelocity along z-direction, vertical velocity (m/s)
Wwidth of the vertical open-ended square channel (m)
WHwidth of heat source (m)
xcoordinates along the depth direction of the heat source
Xhorizontal distance between the heat sources
ycoordinates along the width direction of the heat source
zcoordinates along the height direction of the heat source
ΔTTemperature difference (K)
Greek symbols
αthermal diffusivity of air (m2/s)
αsthermal diffusivity of hear sources (m2/s)
βvolumetric thermal expansion coefficient (1/K)
ρDensity (kg/m3)

References

  1. Yang, C.; Liang, P.; Fu, L.; Cui, G.; Huang, F.; Teng, F.; Bangash, Y.A. Using 5G in smart cities: A systematic mapping study. Intell. Syst. Appl. 2022, 14, 2667–3053. [Google Scholar]
  2. Chen, H.T.; Ma, W.X.; Lin, P.Y. Natural convection of plate finned tube heat exchangers with two horizontal tubes in a chimney: Experimental and numerical study. Int. J. Heat Mass Transf. 2020, 147, 118948. [Google Scholar]
  3. Afridi, M.I.; Ashraf, M.U.; Qasim, M.; Wakif, A. Numerical simulation of entropy transport in the oscillating fluid flow with transpiration and internal fluid heating by GGDQM. Waves Random Complex Media 2022. [Google Scholar] [CrossRef]
  4. Schwurack, R.; Bärschneider, J. Performance enhancement of a thermoelectric system with improved natural convection cooling by utilizing the chimney effect. Energy Convers. Manag. 2021, 237, 114118. [Google Scholar]
  5. Afridi, M.I.; Wakif, A.; Alanazi, A.K.; Chen, Z.M.; Ashraf, M.U.; Qasim, M. A comprehensive entropic scrutiny of dissipative flows over a thin needle featured by variable thermophysical properties. Waves Random Complex Media 2022. [Google Scholar] [CrossRef]
  6. Yilmaz, T.; Fraser, S.M. Turbulent natural convection in a vertical parallel-plate channel with asymmetric heating. Int. J. Heat Mass Transf. 2007, 50, 2612–2623. [Google Scholar]
  7. Sankar, M.; Do, Y.; Ryu, S.; Jang, B. Cooling of Heat Sources by Natural Convection Heat Transfer in a Vertical Annulus. Numer. Heat Transf. Part A Appl. 2015, 68, 847–869. [Google Scholar]
  8. Mohanty, A.; Dash, S.K.; Roy, S. Natural convection cooling of an infrared suppression (IRS) device with cylindrical funnels. Int. J. Therm. Sci. 2019, 141, 103–113. [Google Scholar]
  9. Dadvand, A.; Saraei, S.H. Lattice Boltzmann simulation of natural convection in a square enclosure with discrete heat-ing. Math. Comput. Simulation. 2021, 179, 265–278. [Google Scholar]
  10. Nayaki, V.P.M.S.; Saravanan, S. Natural Convection Cooling of an Array of Flush Mounted Discrete Heaters Inside a 3D Channel. Adv. Appl. Math. Mech. 2017, 9, 698–721. [Google Scholar]
  11. Spizzichino, A.; Zemach, E. Oscillatory instability of a 3D natural convection flow around a tandem of cold and hot vertically aligned cylinders placed inside a cold cubic enclosure. Int. J. Heat Mass Transf. 2019, 141, 327–345. [Google Scholar]
  12. Lee, D.; Jang, H.; Lee, B.J.; Choi, W.; Byon, C. Internal natural convection around a sphere in a rectangular chamber. Int. J. Heat Mass Transf. 2019, 136, 501–509. [Google Scholar]
  13. Horimek, A.; Nekag, E. Natural convection cooling of a heat source placed at the bottom of a square channel. Effect of source length, position, thermal condition and Prandtl number. Int. J. Heat Technol. 2020, 38, 722–737. [Google Scholar]
  14. Da Silva, A.K.; Lorenzini, G.; Bejan, A. Distribution of heat sources in vertical open channels with natural convection. Int. J. Heat Mass Transf. 2005, 48, 1462–1469. [Google Scholar]
  15. Cheng, J.-C.; Tsay, Y.-L. Heat transfer from block heat sources mounted on the wall of a 3D cabinet to an ambient natural convective air stream. Numer. Heat Transf. Part A Appl. 2016, 69, 283–294. [Google Scholar]
  16. Talukdar, D.; Li, C.-G. Investigation of compressible laminar natural-convection for a staggered and symmetric arrangement of discrete heat sources in an open-ended vertical channel. Numer. Heat Transf. Part A Appl. Tions 2019, 76, 115–138. [Google Scholar]
  17. Talukdar, D.; Li, C.-G.; Tsubokura, M. Numerical investigation of laminar compressible natural convection flow in asymmetrically and isothermally heated open-ended inclined channel. Int. J. Heat Mass Transf. 2019, 130, 83–97. [Google Scholar]
  18. Chae, M.-S.; Chung, B.-J. Heat transfer effects of chimney height, diameter, and Prandtl number. Int. Commun. Heat Mass Transf. 2015, 66, 196–202. [Google Scholar]
  19. Acharya, S.; Dash, S.K. Turbulent natural convection heat transfer from a vertical hollow cylinder suspended in air: A numerical approach. Therm. Sci. Eng. Prog. 2020, 15, 100449. [Google Scholar]
  20. Chandrakar, V.; Senapati, J.R.; Mohanty, A. Conjugate heat transfer due to conduction, natural convection, and radiation from a vertical hollow cylinder with finite thickness. Numer. Heat Transfer Part A Appl. 2021, 79, 463–487. [Google Scholar] [CrossRef]
  21. Dash, M.K.; Dash, S.K. Natural convection heat transfer and fluid flow around a thick hollow vertical cylinder sus-pended in air: A numerical approach. Int. J. Therm. Sci. 2020, 152, 106312. [Google Scholar]
  22. Day, J.C.; Zemler, M.K.; Traum, M.J.; Boetcher, S.K.S. Laminar Natural Convection from Isothermal Vertical Cylinders: Revisting a Classical Subject. J. Heat Transf. 2013, 135, 022505. [Google Scholar]
  23. Luo, F.; Lin, Q.; Xie, H. Computing the lower and upper bounds of Laplace eigenvalue problem: By combining conforming and nonconforming finite element methods. Sci. China Math. 2012, 55, 1069–1082. [Google Scholar] [CrossRef]
  24. Akbari, A.; Mohammadian, E.; Fazel, S.A.A.; Shanbedi, M.; Bahreini, M.; Heidari, M.; Dehkordi, P.B.; Hussein, S.N.C.M. Natural convection from the outside surface of an inclined cylinder in pure liquids at low flux. ACS Omega 2019, 4, 7038–7046. [Google Scholar] [CrossRef]
  25. Durgam, S.; Venkateshan, S.P.; Sundararajan, T. Effect of Thermal Conductivity on Cooling of Square Heat Source Array under Natural Convection in a Vertical Channel. Heat Transf. Eng. 2020, 41, 947–960. [Google Scholar]
  26. Mayeli, P.; Sheard, G.J. Buoyancy-driven flows beyond the Boussinesq approximation: A brief review. Int. Commun. Heat Mass Transf. 2021, 125, 105416. [Google Scholar]
  27. Qiu, Y.; Zhai, H.; Zheng, Y.; Lei, G.; Wang, T.; Wang, L.; Shu, S. Numerical Investigation into the Natural Convection of Cryogenic Supercritical Helium in a Spherical Enclosure. Energies 2021, 14, 2584. [Google Scholar]
  28. Burman, E.; Fernandez, M.A. Galerkin Finite Element Methods with Symmetric Pressure Stabilization for the Transient Stokes Equations: Stability and Convergence Analysis. SIAM J. Numer. Anal. 2009, 47, 1. [Google Scholar]
  29. Babaharra, O.; Choukairy, K.; Khallaki, K.; Mounir, S.H. Numerical study of phase change material microencapsulated in a typical multilayer wall for a hot climatic zone. Heat Transf. 2022, 51, 1193–1212. [Google Scholar]
Figure 1. The physical model (a) and the x-z plane at y = W/2 of the open-ended square channel (b).
Processes 10 01774 g001
Figure 2. Temperature distribution and average temperature of the FR4 substrate obtained by Shankar Durgam et al. [25] and present results.
Processes 10 01774 g002
Figure 3. Temperature and velocity distributions in the open-ended square channel with different horizontal distance X at L = 0. (a) Temperature and velocity vector distributions. (b) Temperature distribution of the central cross section of both and each heat sources. (c) Velocity distribution in the z direction on the cross section where y = W/2.
Processes 10 01774 g003
Figure 4. Temperature and velocity distributions of specific cross sections with different X and z at L = 0 m. (a) Local surface temperature distribution of vertical lines on the heat source surfaces. (b) Vertical velocity distribution at different positions in the channel which X = 0.36 m (c) Vertical velocity distribution with different horizontal distance X in the channel which z = 0.45 m.
Processes 10 01774 g004aProcesses 10 01774 g004b
Figure 5. The distribution of Nusselt number on the surfaces of the heat sources. (a) The distribution of Nusselt number of S3 at L = 0. (b) The distribution of local Nusselt number Nuz of S3 and S4 at X = 0.36 m.
Processes 10 01774 g005
Figure 6. The distributions of average Nusselt number of all the surfaces of the heat sources with different horizontal distance X.
Processes 10 01774 g006
Figure 7. The temperature and velocity distributions in the channel with a different vertical altitude difference at X = 0.20 m. (a) The temperature and velocity vector distributions in the open-ended square channel. (b) The temperature distribution of the central cross section of the heat sources. (c) The velocity distribution in z direction at the cross section where y = W/2.
Processes 10 01774 g007aProcesses 10 01774 g007b
Figure 8. The vertical velocity distributions on the cross sections with different L. (a) z = 0.8 m. (b) z = 2.05 m.
Processes 10 01774 g008
Figure 9. The local temperature distributions of the side walls of the heat sources with different L. (a) S3 and S9. (b) S4 and S10.
Processes 10 01774 g009
Figure 10. The distribution of local Nusselt number of the side walls of the heat sources with different L. (a) S3 and S9. (b) S4 and S10.
Processes 10 01774 g010
Figure 11. The distributions of average Nusselt number of all the surfaces of the heat sources with different L.
Processes 10 01774 g011
Table 1. Thermophysical parameters of air and heat sources.
Nameρkcp
Air1.22570.026341006.5
Aluminum2710236902
Table 2. Nomenclature of surfaces of two discrete heat sources.
SurfaceLocationSchematic Figure (Left Heat Source)SurfaceLocationSchematic Figure (Right Heat Source)
S1(D − 2DH − X)/2 ≤ x ≤ (D − X)/2,
(W − WH)/2 ≤ y ≤ W − (W − WH)/2,
z = A + L
Processes 10 01774 i001S7(D + X)/2 ≤ x ≤ (D + 2DH + X)/2,
(W − WH)/2 ≤ y ≤ W − (W − WH)/2,
z = A
Processes 10 01774 i002
S2(D − 2DH − X)/2 ≤ x ≤ (D − X)/2,
(W − WH)/2 ≤ y ≤ W − (W − WH)/2,
z = A + L + HH
S8(D + X)/2 ≤ x ≤ (D + 2DH + X)/2,
(W − WH)/2 ≤ y ≤ W − (W − WH)/2,
z = A + HH
S3x = (D − X)/2,
(W − WH)/2 ≤ y ≤ W − (W − WH)/2,
A + L ≤ z ≤ A + L + HH
Processes 10 01774 i003S9x = (D + X)/2,
(W − WH)/2 ≤ y ≤ W − (W − WH)/2,
A ≤ z ≤ A + HH
Processes 10 01774 i004
S4x = (D − 2DH − X)/2,
(W − WH)/2 ≤ y ≤ W − (W − WH)/2,
A + L ≤ z ≤ A + L + HH
S10x = (D + 2DH + X)/2,
(W − WH)/2 ≤ y ≤ W − (W − WH)/2,
A ≤ z ≤ A + HH
S5(D − 2DH − X)/2 ≤ x ≤ (D − X)/2,
y = (W − WH)/2,
A + L ≤ z ≤ A + L + HH
Processes 10 01774 i005S11(D + X)/2 ≤ x ≤ (D + 2DH + X)/2,
y = (W − WH)/2,
A ≤ z ≤ A + HH
Processes 10 01774 i006
S6(D − 2DH − X)/2 ≤ x ≤ (D − X)/2,
y = W − (W − WH)/2,
A + L ≤ z ≤ A + L + HH
S12(D + X)/2 ≤ x ≤ (D + 2DH + X)/2,
y = W − (W − WH)/2,
A ≤ z ≤ A + HH
Table 3. Grid independence verification (P = 1000 W).
Total grid number2 × 1045 × 1041 × 1051.2 × 1051.5 × 105
Average air temperature (K)307.96306.21305.23305.11305.11
Relative Error (%)0.930.360.04-0.00
Publisher’s Note: MDPI stays neutral with regard to jurisdictional claims in published maps and institutional affiliations.

