Article

Digital Twin for HIV-Gag VLP Production in HEK293 Cells

1
Institute for Separation and Process Technology, Clausthal University of Technology, Leibnizstr. 15, 38678 Clausthal-Zellerfeld, Germany
2
Faculty of Applied Natural Sciences, Technische Hochschule Köln, 51368 Leverkusen, Germany
3
Institute of Technical Chemistry, Leibniz University Hannover, Callinstraße 5, 30167 Hannover, Germany
*
Author to whom correspondence should be addressed.
Processes 2022, 10(5), 866; https://doi.org/10.3390/pr10050866
Submission received: 14 March 2022 / Revised: 23 April 2022 / Accepted: 24 April 2022 / Published: 27 April 2022
(This article belongs to the Special Issue Towards Autonomous Operation of Biologics and Botanicals)

Abstract

:
The development and adoption of digital twins (DT) for Quality-by-Design (QbD)-based processes with flexible operating points within a proven acceptable range (PAR) and automation through Advanced Process Control (APC) with Process Analytical Technology (PAT) instead of conventional process execution based on offline analytics and inflexible process set points is one of the great challenges in modern biotechnology. Virus-like particles (VLPs) are part of a line of innovative drug substances (DS). VLPs, especially those based on human immunodeficiency virus (HIV), HIV-1 Gag VLPs, have very high potential as a versatile vaccination platform, allowing for pseudotyping with heterologous envelope proteins, e.g., the S protein of severe acute respiratory syndrome coronavirus 2 (SARS-CoV-2). As enveloped VLPs, optimal process control with minimal hold times is essential. This study demonstrates, for the first time, the use of a digital twin for the overall production process of HIV-1 Gag VLPs from cultivation, clarification, and purification to lyophilization. The accuracy of the digital twins is in the range of 0.8 to 1.4% in depth filtration (DF) and 4.6 to 5.2% in ultrafiltration/diafiltration (UFDF). The uncertainty due to variability in the model parameter determination is less than 4.5% (DF) and less than 3.8% (UFDF). In the DF, a prediction of the final filter capacity was demonstrated from as low as 5.8% (9mbar) of the final transmembrane pressure (TMP). The scale-up based on DT in chromatography shows optimization potential in productivity up to a factor of 2. The schedule based on DT and PAT for APC has been compared to conventional process control, and hold-time and process duration reductions by a factor of 2 have been achieved. This work lays the foundation for the short-term validation of the DT and PAT for APC in an automated S7 process environment and the conversion from batch to continuous production.

1. Introduction

The human immunodeficiency virus (HIV) is a retrovirus that is responsible for acquired immunodeficiency syndrome (AIDS) [1]. Due to the immunodeficiency that the disease causes, affected people are at greater risk of acquiring other diseases, which can be prevented by immunization through a vaccine [2]. In more than twenty-five years of research, several vaccine candidates have been developed, but they proved to be ineffective [3,4]. Therefore, further vaccines need to be developed [4], and virus-like particles for antigen representation have turned out to be a promising approach [5,6].
VLPs are multiprotein or membrane structures and mimic the organization and structure of real viruses. Unlike viruses, they lack the viral genome. Consequently, VLPs are replication-incompetent particles providing a high safety profile. No virus inactivation is required [7], thus qualifying them as ideal vaccine candidates.
The three viral polyproteins, Gag, Pol, and Env, form HIV particles. These are surrounded by a lipid layer and carry the RNA genomes within the Gag-formed capsid core. In mature and infectious HIV particles or virions, the precursor proteins are proteolytically processed to functional subunits, e.g., the Gag protein is mainly cleaved into its matrix (MA), capsid (CA), and nucleocapsid (NC) subunits. In contrast, VLPs may also be immature HIV-derived particles formed by the uncleaved Gag precursor proteins not maturing at all but still surrounded by a lipid layer of the host cell [8].
Unlike soluble antigens, which must be injected with adjuvants to elicit a protective immune response, VLPs can stimulate a better cellular and humoral immune response [9,10]. VLPs are very efficiently taken up by antigen-presenting cells (APCs) due to their particulate nature and repetitive structure, eliciting both humoral and cellular immune responses [8,11,12].
VLPs can be produced using various expression systems such as bacterial, yeast, insect, mammalian, and plant cells, respectively. Large-scale approaches for the production of HIV-1 Gag VLPs have primarily utilized the baculovirus expression system and insect cell lines [13,14,15,16].
Mammalian cells can produce more complex enveloped VLPs such as HIV-1-Gag VLPs, but this is associated with lower productivity [11,17]. Human embryonic kidney 293 cells (HEK293) are particularly well suited for the production of VLPs in mammalian cells. This is due to their good genetic manipulability, their ability to grow in suspension, and the resulting possibility of cultivation at high cell densities [18]. Furthermore, these 293F suspension cultures are already widely used for the production of many virus-based products such as viral vaccines and most viral vectors in the industry [19,20,21,22]. This leads to a rapid acceptance of 293 cells in the industry [18].
Few methods for the production of HIV-based VLPs in mammalian cells—particularly for suspension cultures—have been described in the literature [18]. Unlike non-enveloped VLPs, enveloped nanoparticles such as HIV-1-Gag VLPs are very sensitive to shear stress, pH variation, and osmotic pressure, rendering their production and purification especially challenging [8,23].
Quality-by-Design (QbD) methods can be used to establish the relationship between process parameters and the relevant quality characteristics of the product. Furthermore, QbD-based process development is becoming the standard in the biopharmaceutical industry and is also required by regulatory authorities. To ensure the quality target product profile (QTPP), a control strategy needs to be developed as part of QbD-based process development, which requires the spanning of design spaces [24,25]. Design spaces can be defined via validated process models to avoid OOS (out-of-specification) batches [26,27]. Advanced process control can also be realized based on a validated process model developed as a “digital twin” (DT) [28,29]. By applying the holistic QbD approach, consistent product quality can be ensured from development, through piloting to production [27,30]. Process models can be used for the real-time prediction of quality attributes. They allow changes to the process even after submission when optimizing it [31]. To achieve this, digital twins are needed that enable a digital representation of the process.
A digital twin can be divided into five levels, which are shown in Figure 1. The first three stages represent purely digital models whose level of detail increases as the stage progresses. The first stage is a steady-state model that describes the process by means of time-independent mass and energy balances. The steady-state model is used in the first design phase of the process for the initial optimization and calculation procedures [32,33,34,35]. The second stage of a digital twin is achieved by extending the steady-state model with accumulation terms and the system dynamics. By deriving all variables of interest over time, the model becomes time-dependent and consequently dynamic. It is used for the identification of optimal operating conditions, scaling planning, and process control [32,36,37,38]. The third stage, as the final stage of a digital model, is the validated model, which is validated against process data. This considers phenomena such as inhibition, which increases the number of states. Furthermore, equipment conditions, such as working capacity and hydraulics, are considered. The next stage, the digital shadow, is a validated model, which can be executed in real-time based on automatic inputs via a data link with the physical process [39]. The final stage of a digital twin involves model-based control. It enables the online optimization of the process. Through the digitization infrastructure, control structures can be implemented based on the model-based predictions [32].
The design space required for QbD-based process development, in which consistent quality can be ensured, can be spanned by experiments or rigorous process models. The workflow of a QbD process is shown in Figure 2 [40,41]. This first includes the definition of a quality target product profile. The QTPPs affect the bioavailability, strength of action, and stability of the drug. Consequently, there is a relationship between the QTPP and the quality, safety, and efficacy of the drug [42]. Characteristics that, when controlled within a certain limit, range, or distribution, result in the desired product quality are referred to as critical quality attributes (CQAs) and must be defined and classified [43,44,45]. They are the basis for further process development and, as new knowledge is gained about the process or product, must be dynamically adjusted. Experimentation and risk management can be used to determine the CQAs. Risk management includes risk assessment, which should be performed at the beginning of process development [45,46]. Risk analysis is followed by the definition of the design space, which is traditionally done through experiments. Design-of-experiments (DoE) methods are traditionally used to reduce the experimental effort [47]. The final steps of QbD-based process development include the development of a Process Analytical Technology (PAT)-assisted control strategy and continuous improvement, which are considered in detail for the production of HIV-1 gag VLPs by Helgers et al. [23,45,48].
By using predictive process models, a design space can be defined in a resource-efficient way and a quantitatively defined and knowledge-based process optimum can be determined. Since they are derived from physical chemistry, they do not lose their validity when the boundaries of the design space are exceeded, which reduces the experimental effort. Thus, process design becomes possible not only on a purely empirical basis but also enables model- and data-based process evaluation [45]. Furthermore, digital twins in combination with a PAT control strategy are the key enabler for automated, continuous biomanufacturing. Thus, the combination of both reduces time-to-market. In addition, this leads to a reduction in the workload of personnel due to lower cleaning and sterilization efforts. A process developed according to QbD guidelines allows better utilization of cost-intensive raw materials such as cultivation medium or feed and reduces the logistical effort [23,28,49,50,51].
The use of predictive models allows us to define a design space in a resource-efficient way and to determine a quantitatively defined and knowledge-based process optimum. They facilitate a reduction in experimental effort since they are derived from physics-chemistry and thus do not lose their validity when the boundaries of the design space are exceeded. Thus, process design becomes possible not only on a purely empirical basis but also leads to a model- and data-based process evaluation. A prerequisite for the possibility of using predictive models is that they are revealed to be at least as accurate and precise as the experiments they are intended to replace [45]. This can be investigated, for example, using Monte Carlo simulations by comparing the results of simulation studies with experimental data [45].
Therefore, the aim of this study was to develop a digital twin for the process developed and optimized by Helgers et al. [23] to produce HI-VLPs in HEK293 cells as illustrated in Figure 3. To this end, simulation studies were performed for cultivation, cell separation by depth filtration, product purification, and concentration by ultra- and diafiltration (UF/DF) anion exchange chromatography (AEX). In addition, in order to determine their suitability as a digital twin, the models were investigated in terms of accuracy compared to the experimental data and their precision. In addition, the modeling of lyophilization is performed as the formulation step.

2. Materials and Methods

The materials and methods used for the simulation of cultivation, depth filtration, ultrafiltration, anion exchange chromatography, and lyophilization are presented below. All simulations were performed using Aspen Custom Modeler (AspenTechnology Inc., Bedford, MA, USA). The materials and methods used to generate the experimental data are described in detail in [23].

2.1. Fed-Batch Cultivation

Fed-batch cultivations were described using a Monod-based model where glucose and glutamine were included as the carbon and nitrogen sources and lactate and ammonium were considered as the major byproducts of glucose and glutamine metabolism, respectively.
The concentration of viable cells, XV, was described by:
d X V d t = V ˙ i n · X V , i n V ˙ o u t · X V , o u t V + µ µ d · X V
where µ is the growth rate and µd is the death rate.
The growth rate was described by a multiplicative Monod equation considering the aforementioned substrates and metabolites:
µ = µ m a x · G L C K g l c + G L C · G L N K g l n + G L N · K I l a c K I l a c + L A C · K I a m m K I a m m + A M M  
Lactate and ammonium were considered growth-inhibiting at high concentrations.
Cell death was considered to be dependent on lactate and ammonium accumulation.
µ d = k d · L A C K D l a c + L A C · A M M K D a m m + A M M
The glucose concentration was described by the following equation, in which mglc is the maintenance coefficient of glucose:
d G L C d t = V ˙ i n · G L C i n V ˙ o u t · G L C o u t V µ µ d Y X V / g l c + m g l c · X V
The glutamine concentration was described by:
d G L N d t = V ˙ i n · G L N i n V ˙ o u t · G L N o u t V µ µ d Y X V / g l n + m g l n · X V
where mgln is the maintenance coefficient of glutamine, which is described by the following equation:
m g l n = a 1 · G L N a 2 + G L N
Lactate and ammonium formation were considered proportional to glucose and glutamine consumption, respectively:
d L A C d t = V ˙ i n · L A C i n V ˙ o u t · L A C o u t V + Y l a c / g l c · µ µ d Y X V / g l c · X V
d A M M d t = V ˙ i n · A M M i n V ˙ o u t · A M M o u t V + Y a m m / g l n · µ µ d Y X V g l n · X V r a m m · X V
The product formation was considered to be proportional to the viable cell concentration:
d V L P d t = V ˙ i n · V L P i n V ˙ o u t · V L P o u t V + Q V L P · X V
V ˙ is the volumetric flowrate either in or out of the reactor and V is the cultivation volume.
The change in volume over time was calculated using a volume balance:
d V d t = V ˙ i n V ˙ o u t .
Since the process considered in this study is fed-batch cultivation, the outflowing volume flow is zero.

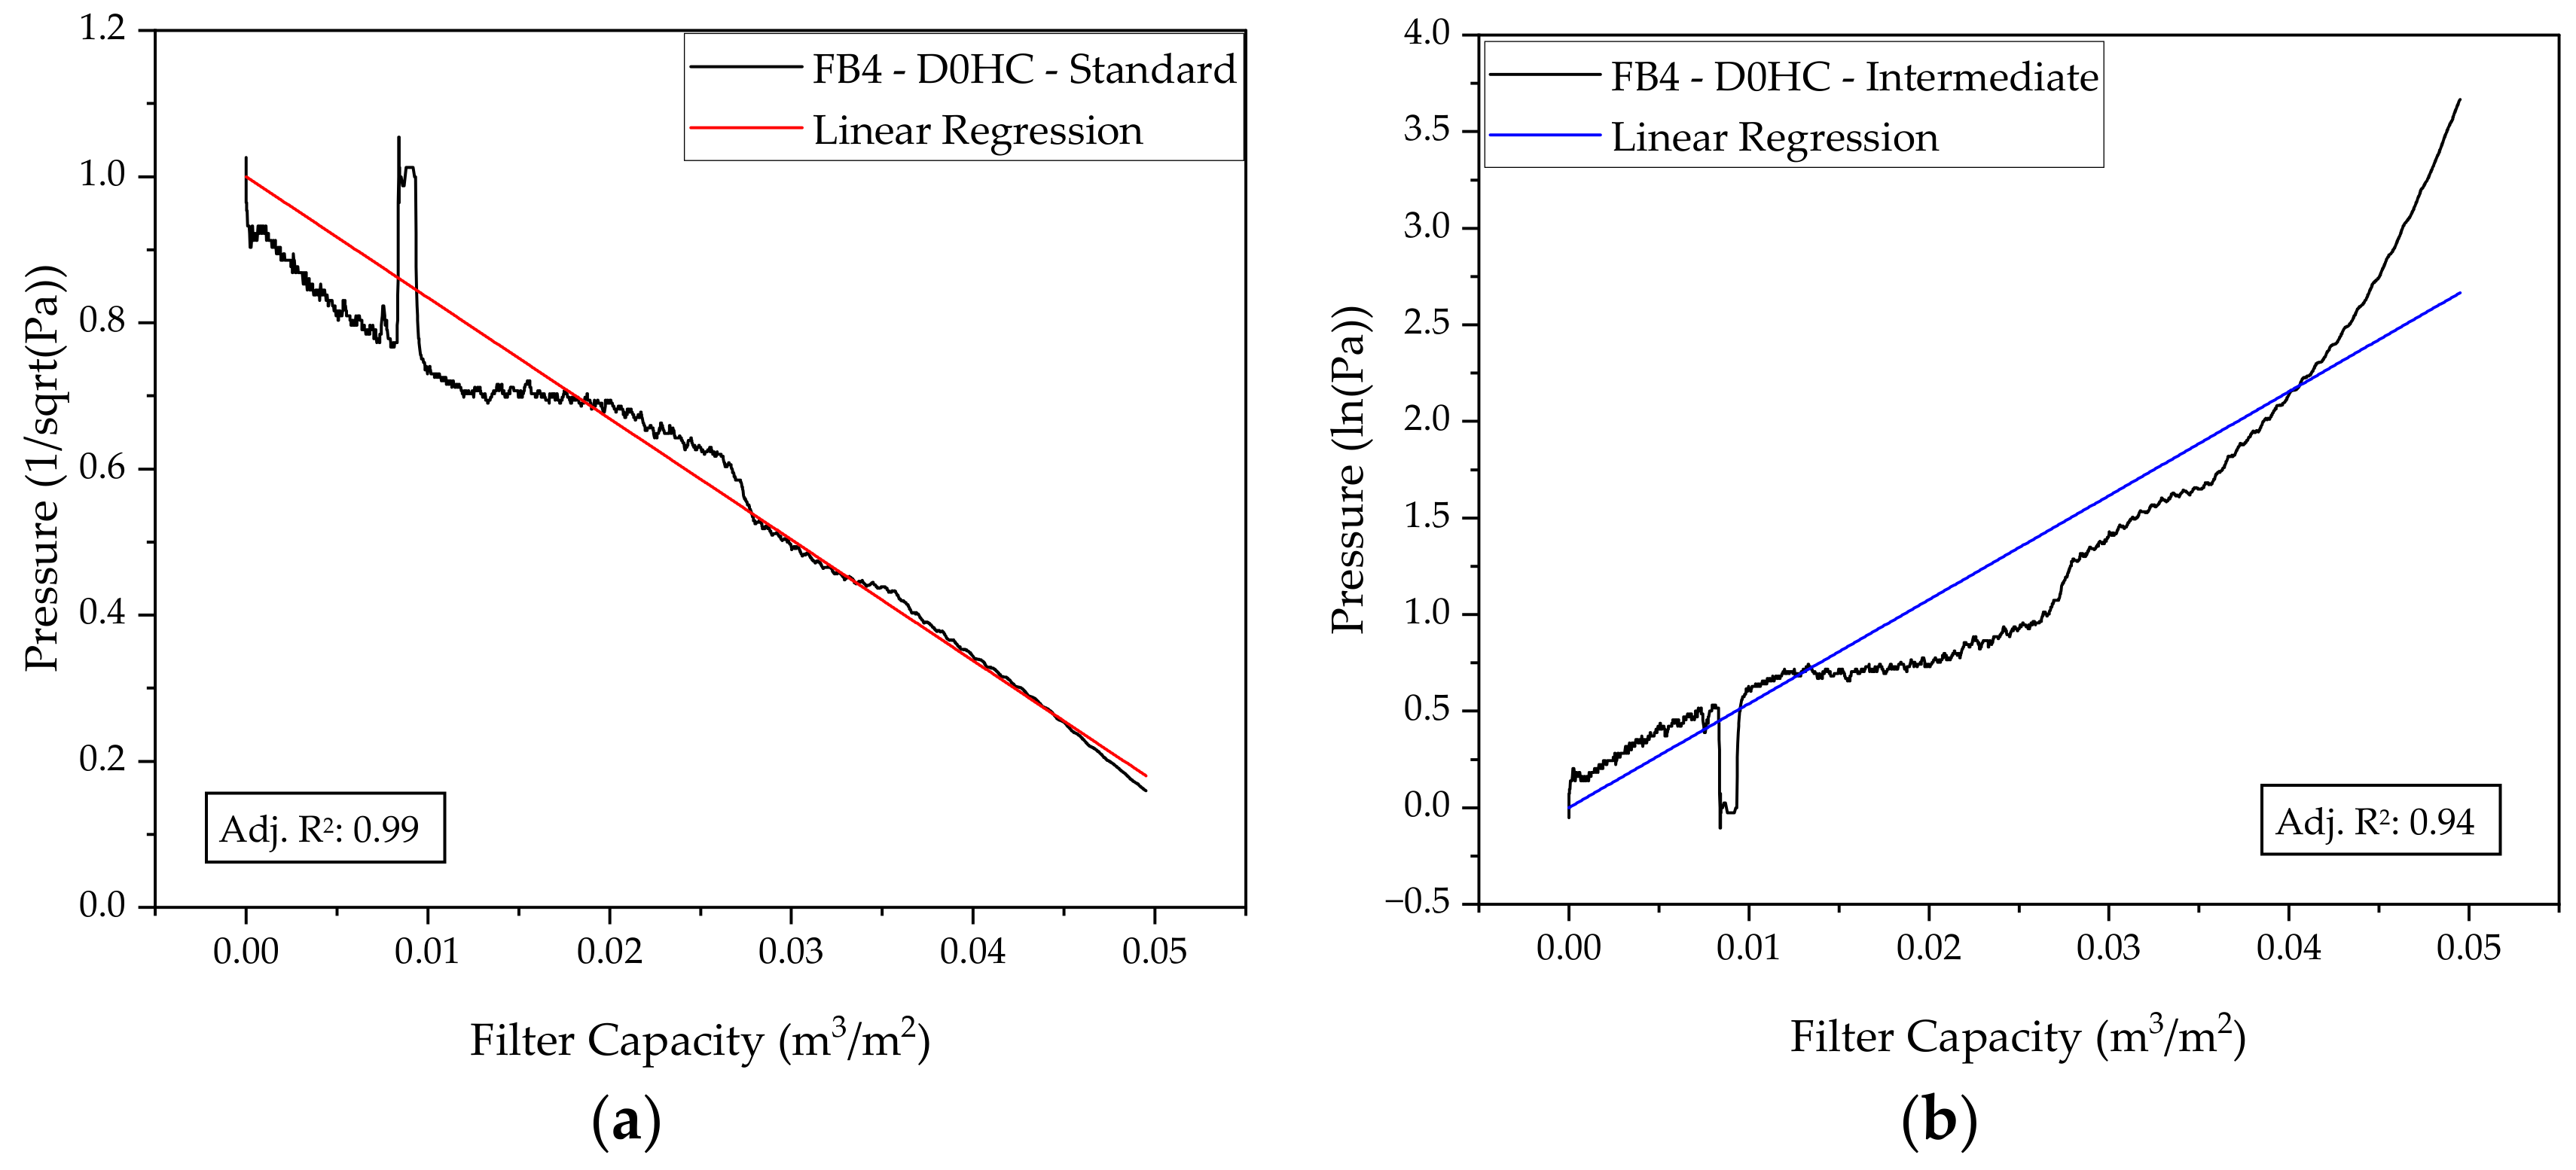
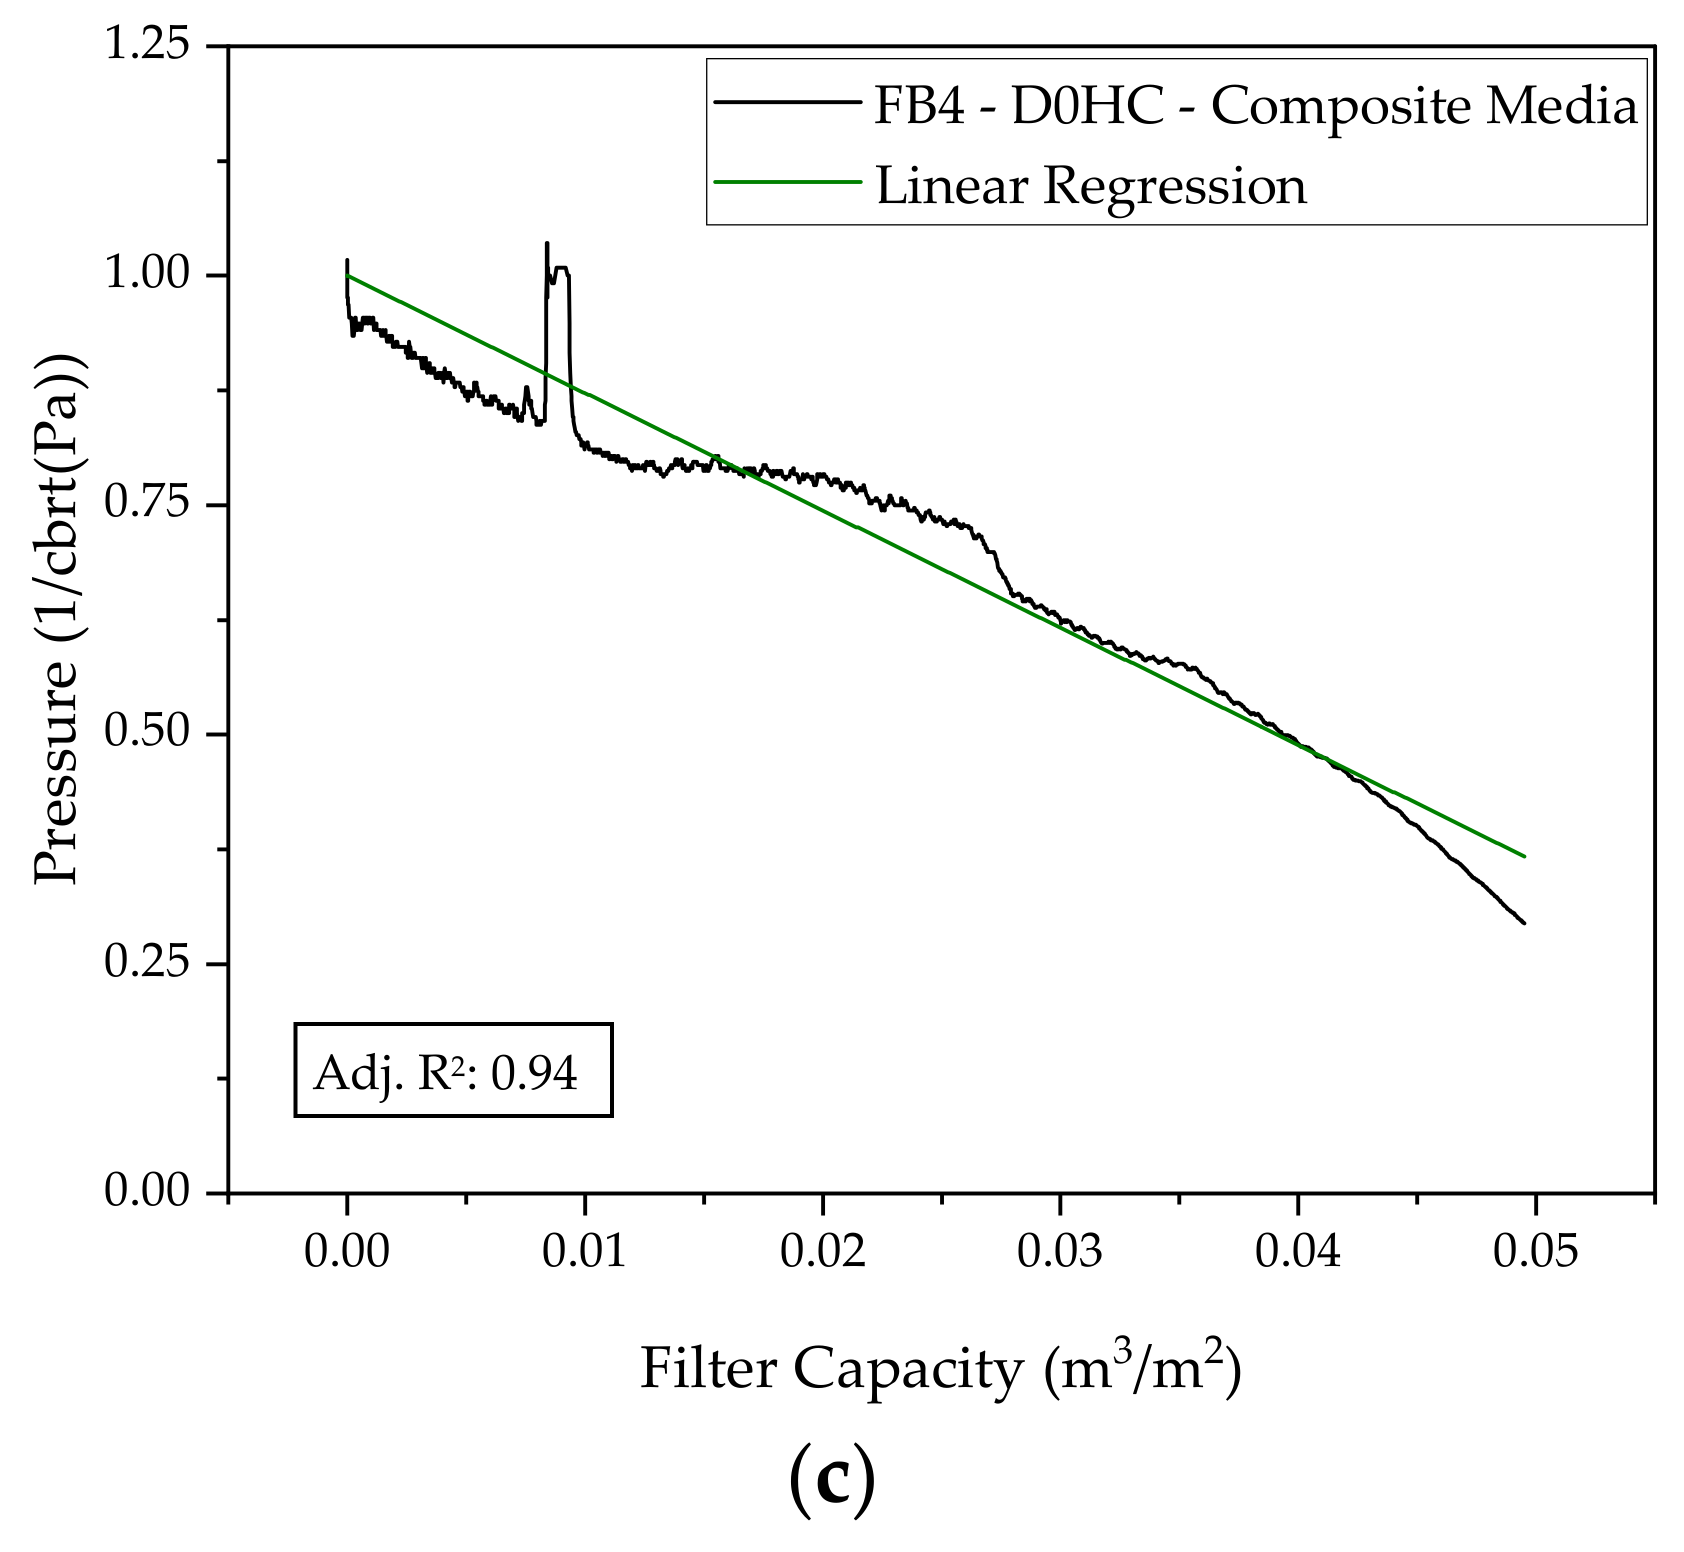
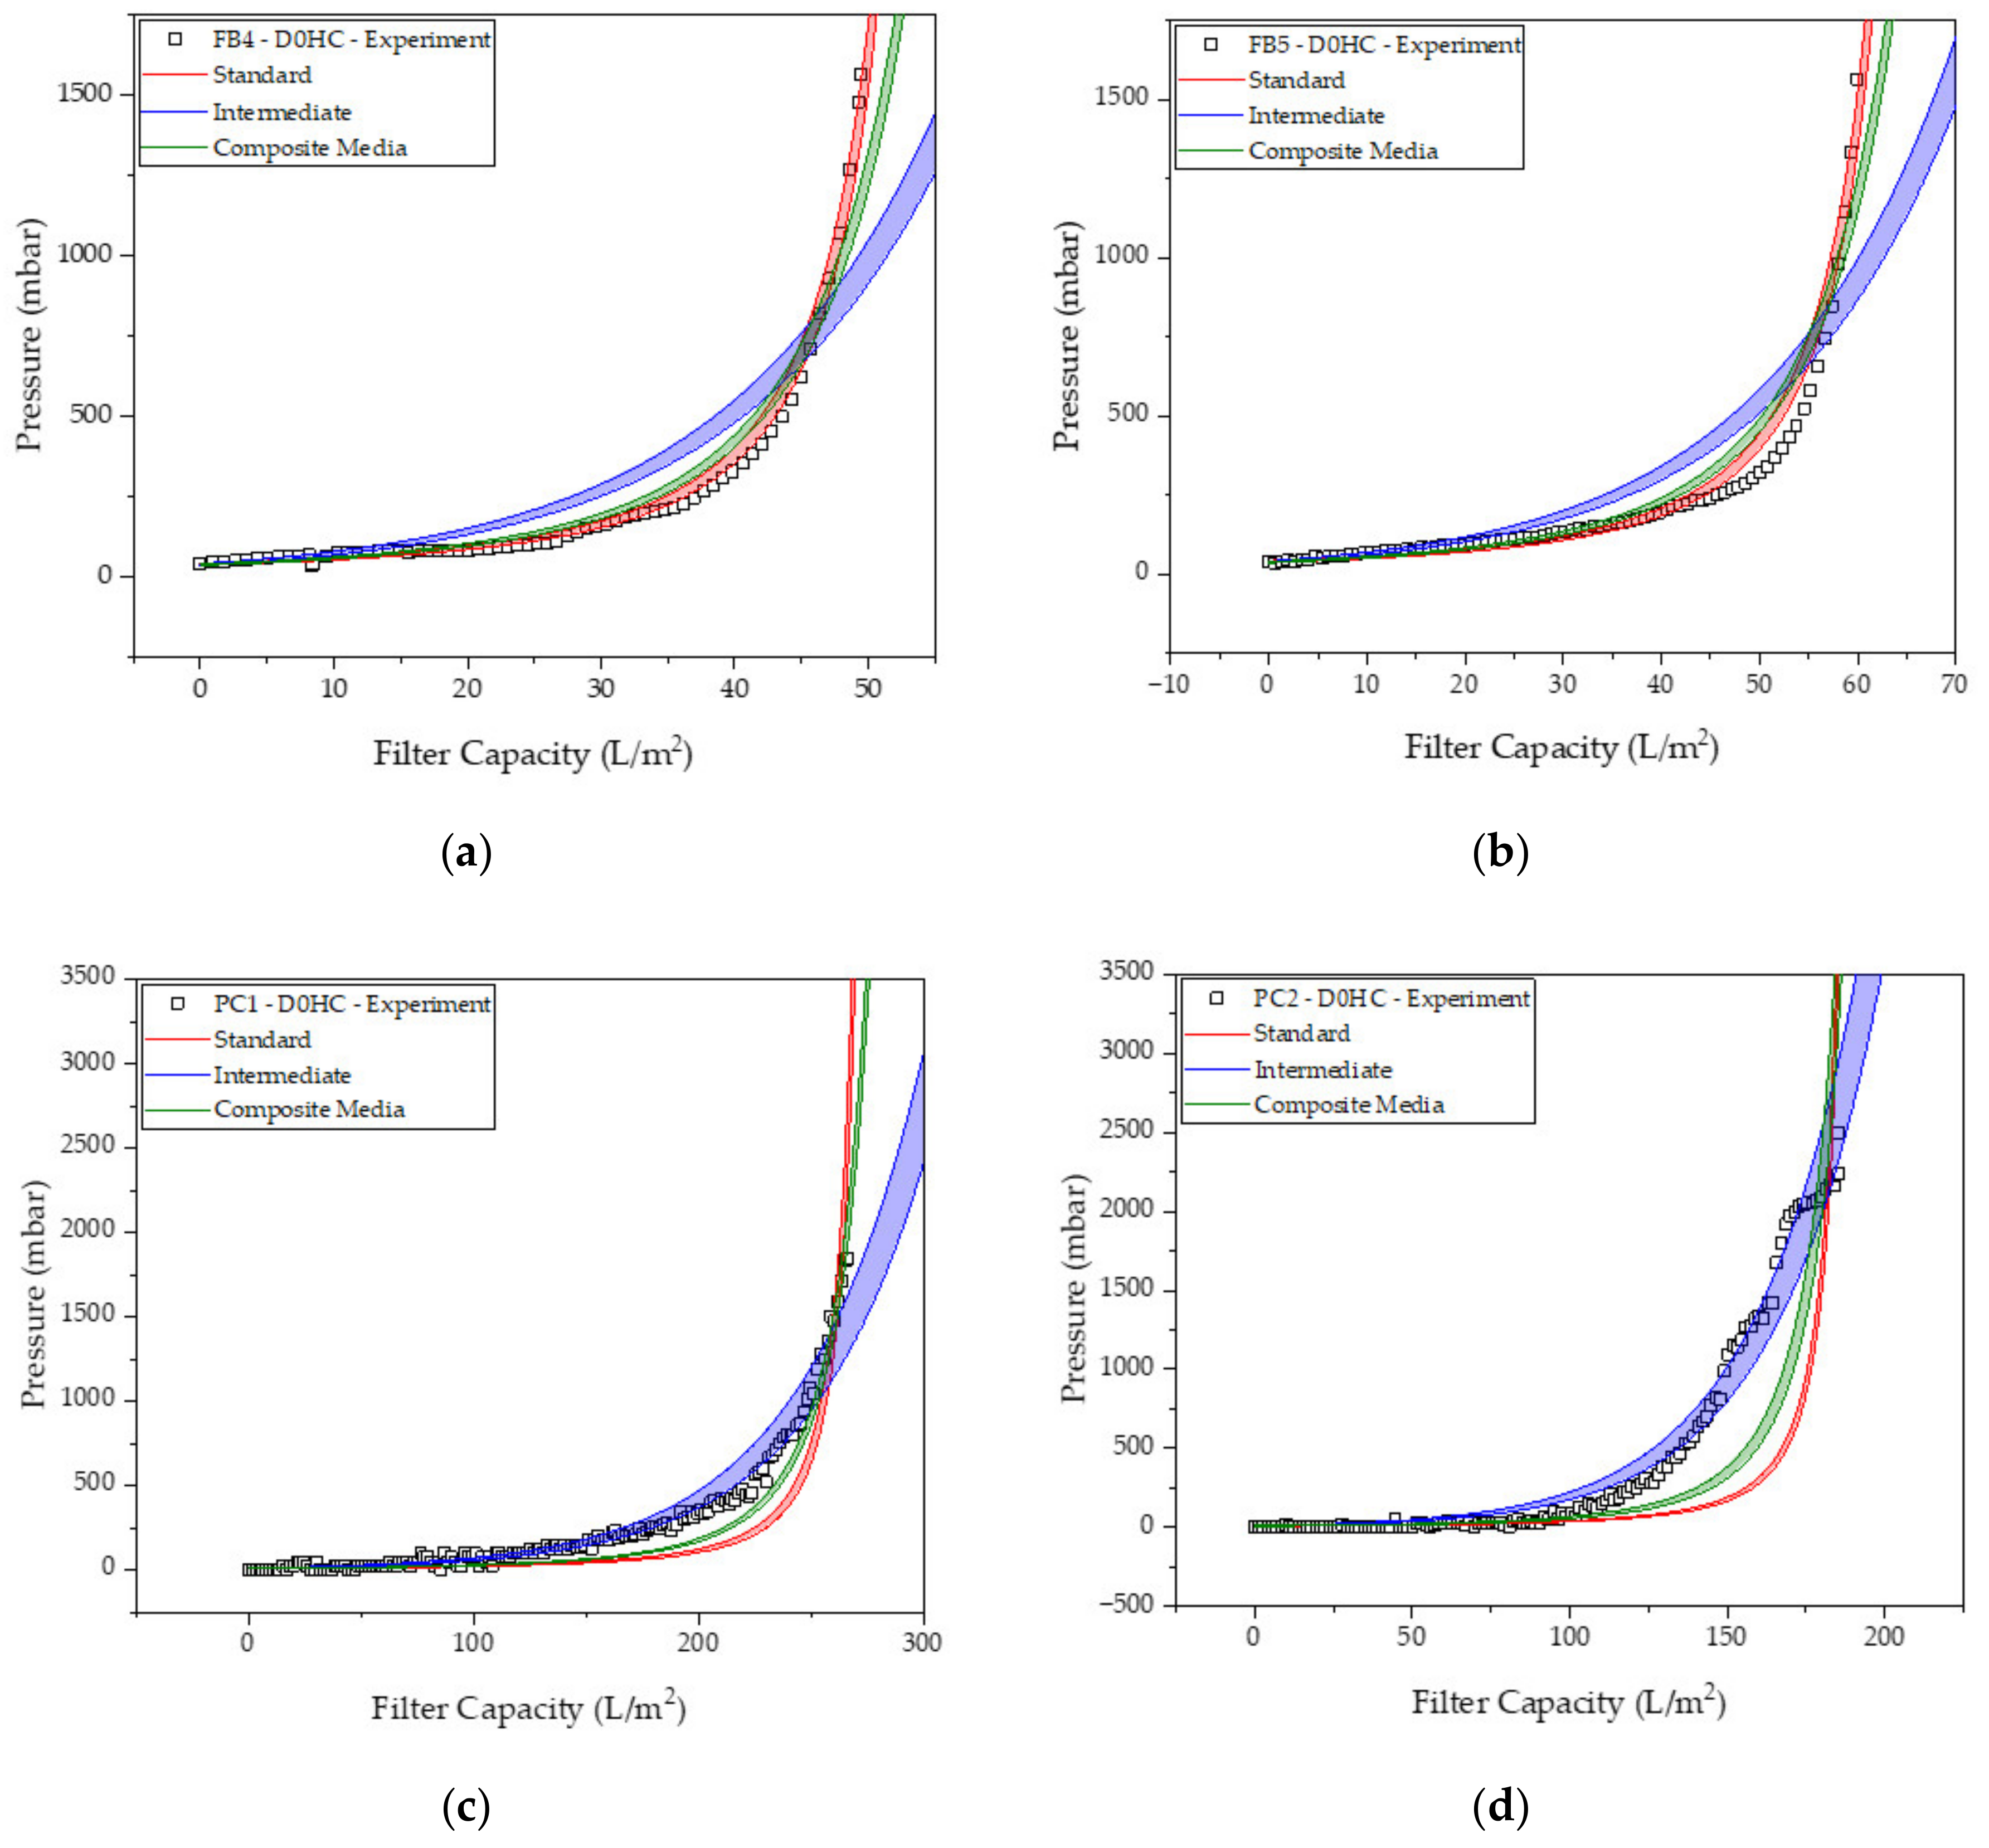
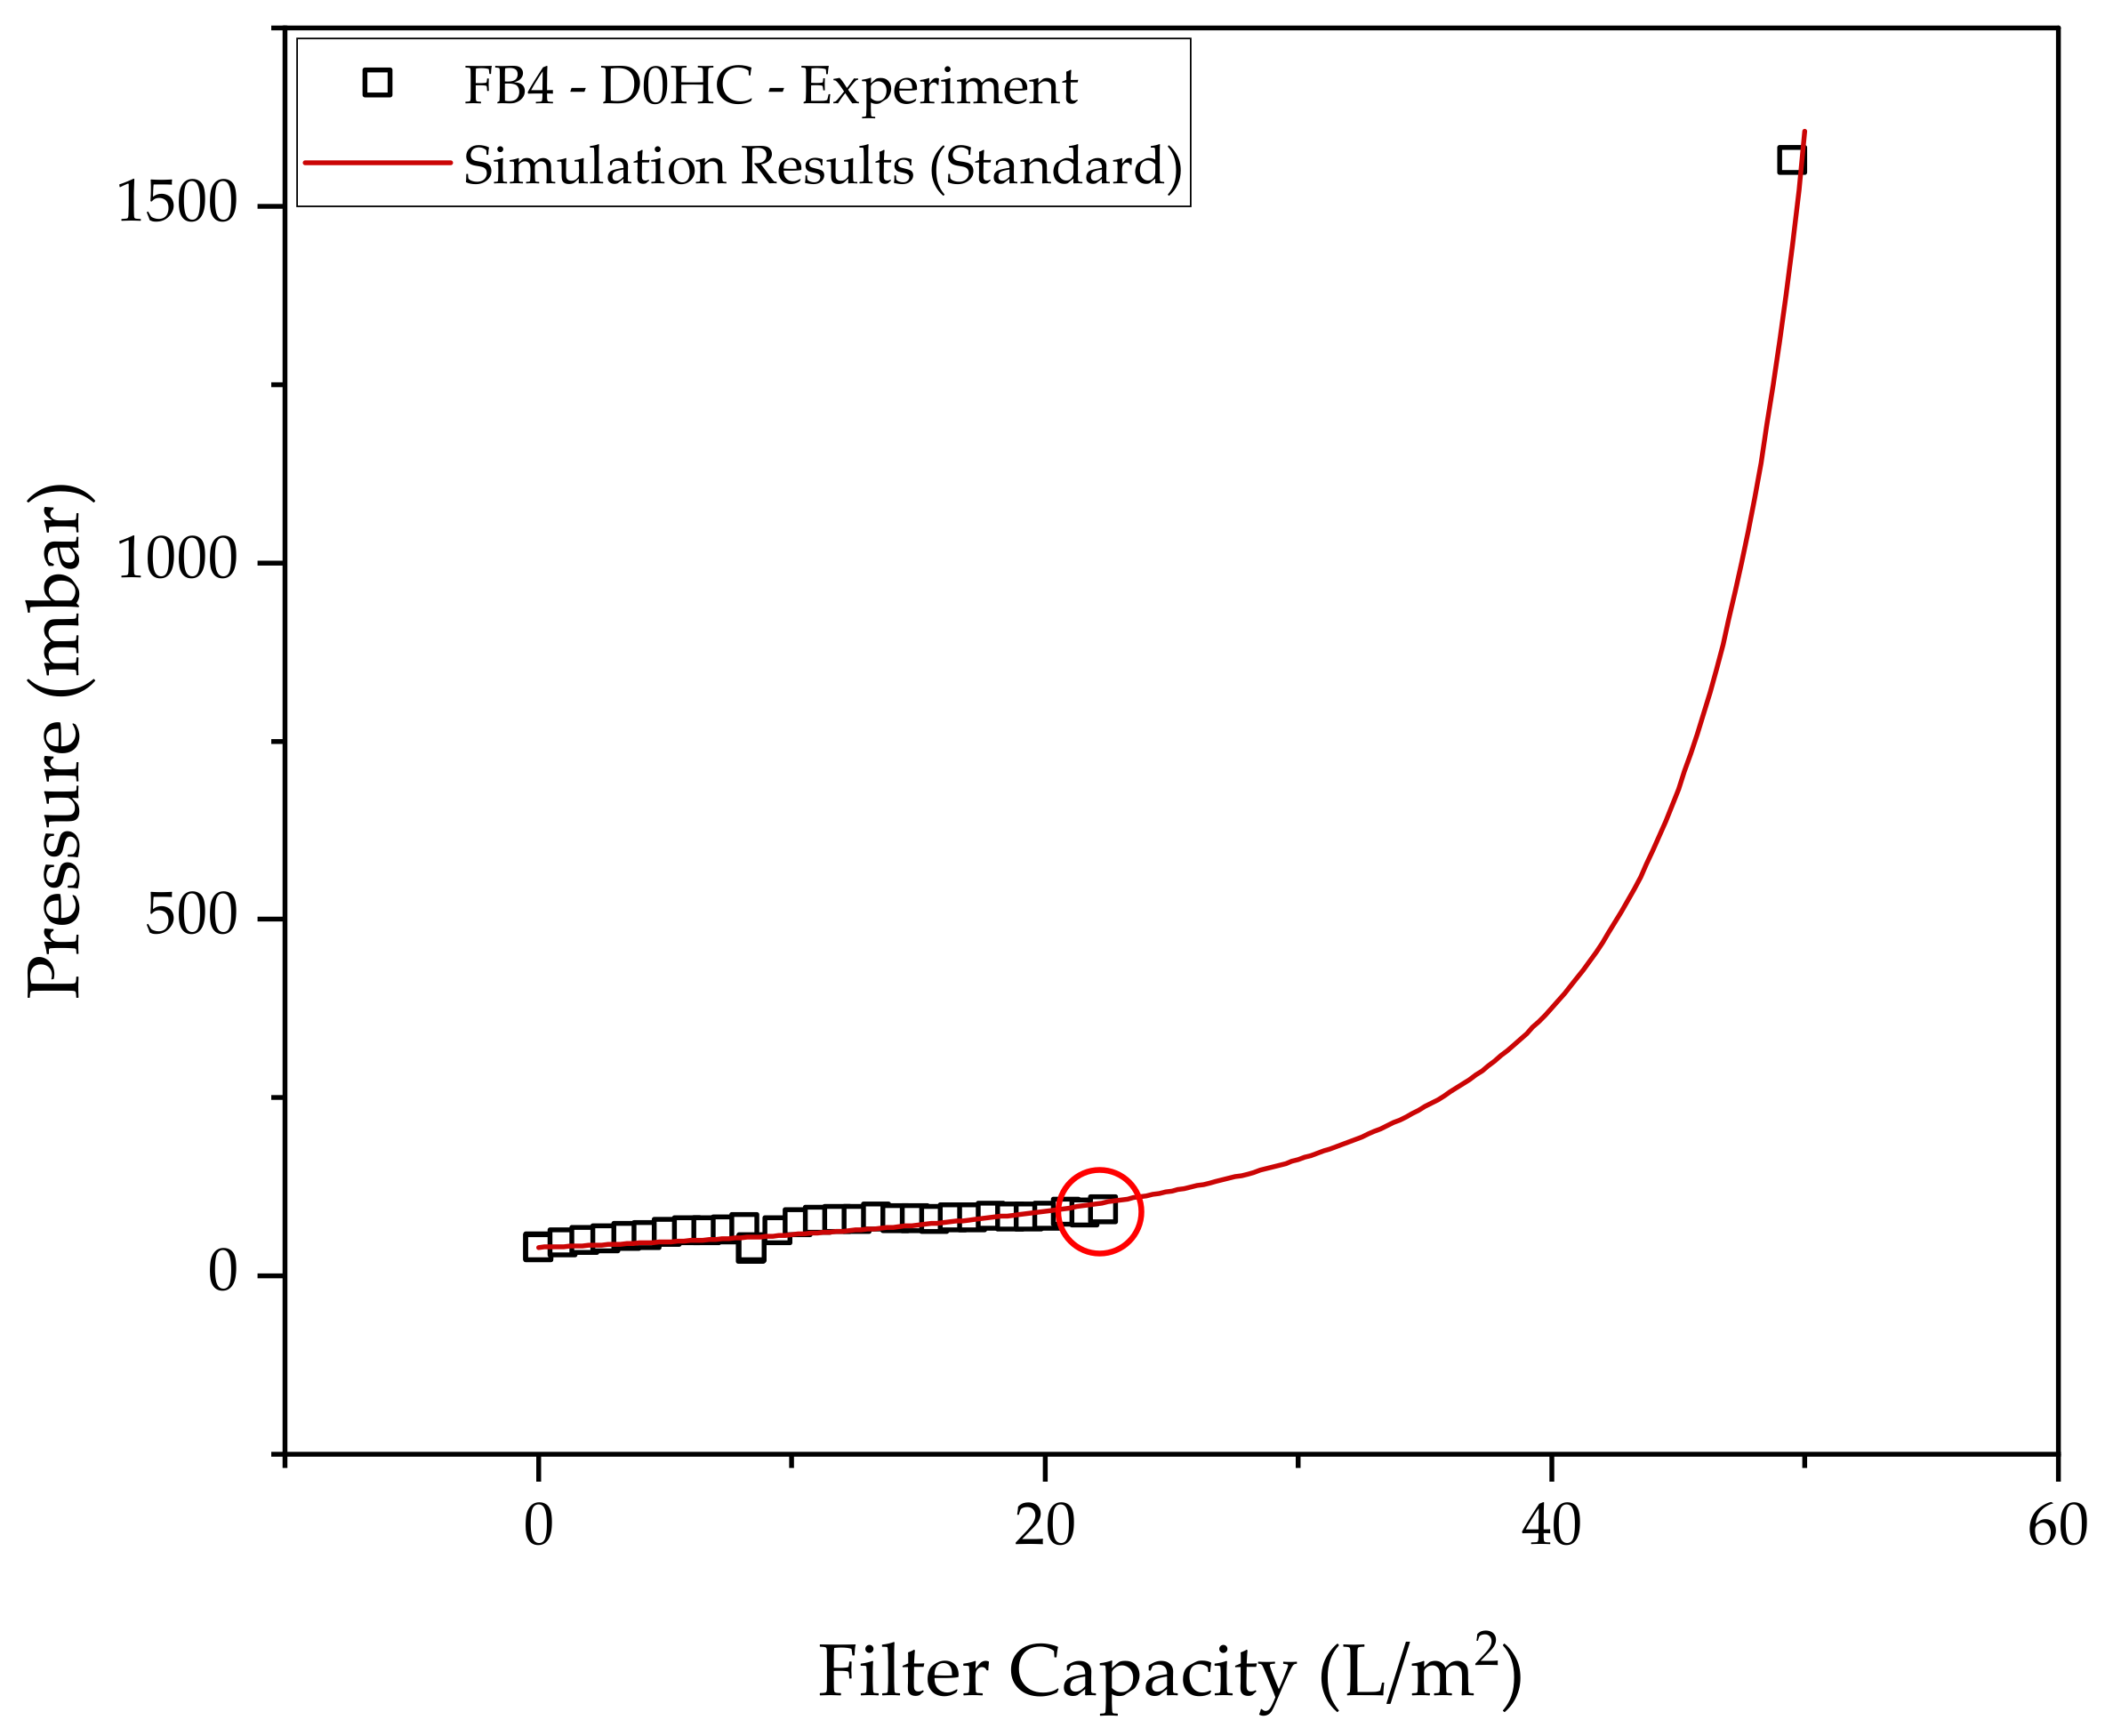
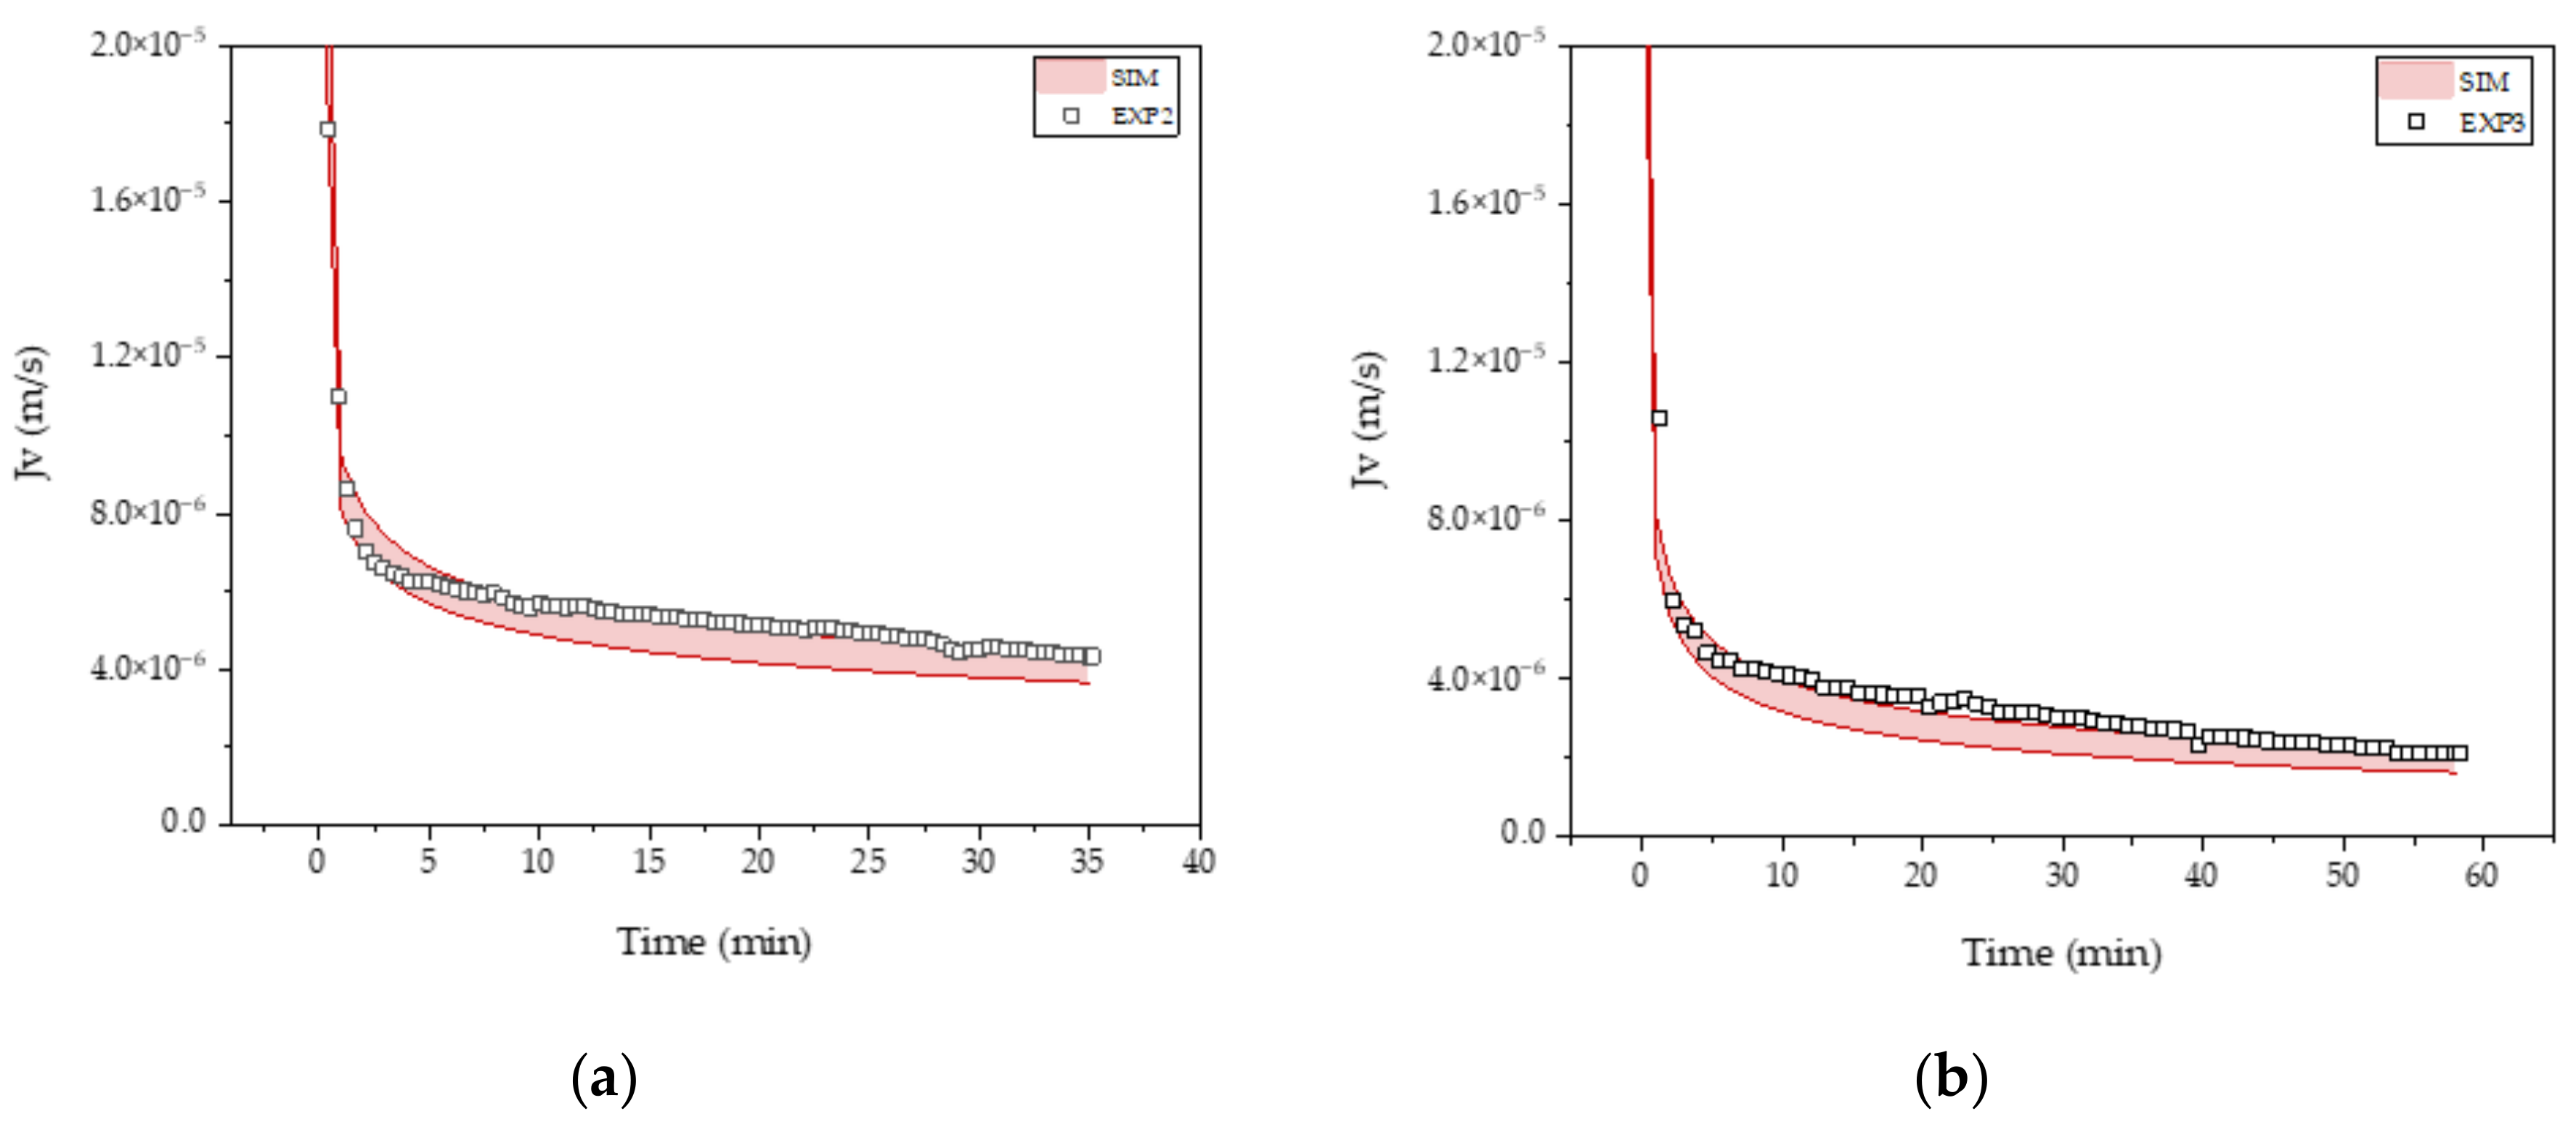
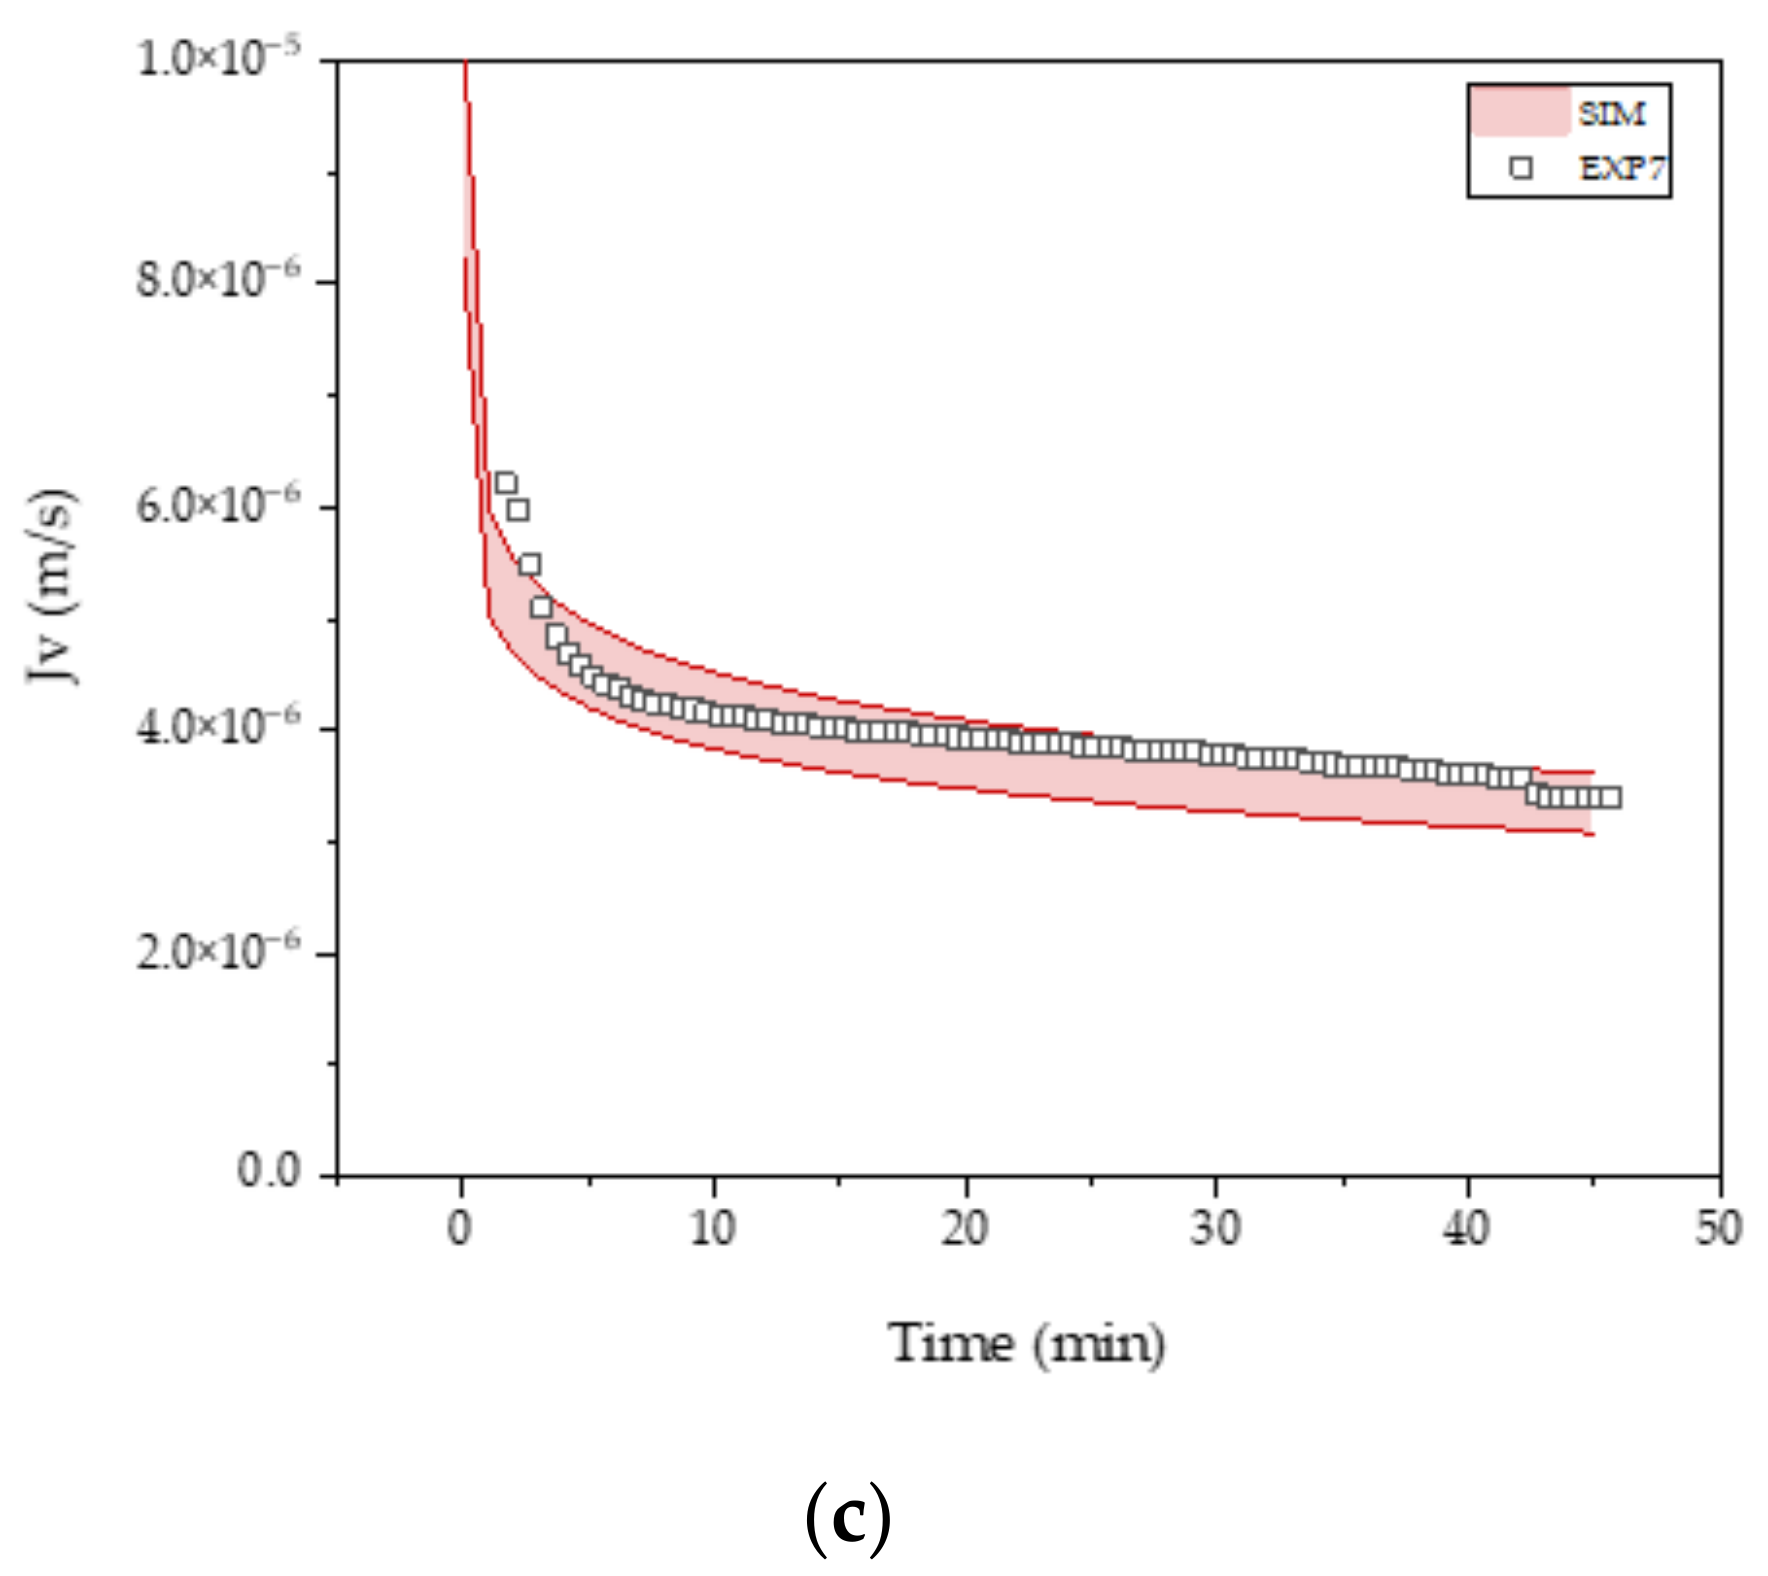
2.2. Depth Filtration

Cell separation and the initial purification of the product were performed using Millistak® + D0HC filter media (Merck Millipore, Burlington, MA, USA). The direct filtration of FB4 and FB5 as well as the filtration of pre-clarified feed (PC1, PC2) was performed at a constant LMH of 60 L∙m−2∙h−1 and the transmembrane pressure (TMP) was recorded.
In depth filtration, the four main blocking mechanisms of standard, complete, intermediate blocking, and cake filtration primarily occur. In addition, there are models which claim to be able to better match the structure of the filter media [52,53,54].
The TMP describes the pressure difference between retentate (pret) and permeate (pperm):
TMP = p r e t p p e r m
Furthermore, the TMP depends on the flux (J), the filtration resistance (R), and the permeate viscosity (η). This dependency can be described with the help of the Darcy–Weisbach equation:
TMP = J · R · η
The increase in filtration resistance (R) due to blocking caused by the deposition of particles on and in the filter material can be described by different models. In the formula, the standard blocking model is shown, which describes the blocking due to pore blocking [52,53]:
R 0 R = ( 1 K S 2 · v ) 2
A combination of pore blocking, and surface deposit can be described by the intermediate blocking model [52,53]:
ln R R 0 = K I · v
The composite media model developed by Zydney et al. considers that the pores are not ideally cylindrical [54]:
R 0 R = ( 1 K C M 2 · v ) 3
In the equations, R0 describes the membrane resistance present at the start of depth filtration and v the membrane area’s specific filtrate volume. KS is the blocking constant in the standard blocking model, KI the same in the intermediate blocking model, and KCM the same in the composite media model.

2.3. Ultra- and Diafiltration

Experimental materials, methods, and data have previously been published by Helgers et al. [23]. The investigated hollow fiber module consists of 60 fibers (0.5 mm inner diameter, 0.2m length, 190 cm2 surface area, 0.05 µm pore size). The process model applied is based on work by Grote et al. [55]. Filtration is described by the Darcy–Weisbach equation [56,57,58]:
Jv = TMP η × R
The three major approaches to model flux decline in tangential-flow ultrafiltration are resistance, gel-concentration, and osmotic-pressure models [59]. Since the retentate stream is a suspension of virus-like particles, flux decline is best described by the resistance model, where the total resistance R in Equation (16) is the sum of the initial membrane resistance Rm and the boundary-layer resistance Rbl, which is computed from experiments [60,61]. The transmembrane pressure TMP is defined by Equation (17):
TMP = p r e t , i n p r e t , o u t 2 p p e r
For process simulations, all model parameters are randomly varied inside the experimentally observed determination range to show model prediction precision and accuracy. Based on 31 simulations, the experimental results [23] are then compared to the simulation range of prediction.

2.4. Anion-Exchange Chromatography

As the capture process for enveloped virus-like particles (VLP), the use of anion-exchange chromatography (AEX) is widely spread [62,63,64,65,66,67,68]. There are multiple different approaches explored in the literature, such as the use of membrane adsorbers [63,64,65,68], monolithic columns [65,67], and standard chromatographic materials [65,66]. Based on this selection, after screening experiments, we decided to use POROS™ GoPure™ (0.5 mm × 50 mm) (Thermo Fisher Scientific Inc., Waltham, MA, USA). The buffer systems used consisted of a 50 mM HEPES buffer (VWR Chemicals LLC, Radnor, PA, USA) at pH = 7.2 for buffer A and the same buffer with 2 M NaCl (EMSURE ®, Merck KGaA, Darmstadt, Germany) for buffer B. The method is a four-step gradient with a length of five column volumes (CV) per modifier concentration. The modifier concentration was 0.3, 0.7, 0.9, and 1.2 M NaCl. Regeneration was done for 10 CV with 100 % buffer B.
The digital twin for anion exchange chromatography was based on the lumped pore diffusion model for chromatography in combination with Langmuir adsorption, as depicted in Equations (18)–(20) [69,70,71]:
ε p , i · c p , i t + 1 ε p , i q i t = 6 d P · 1 ε S ε S · k e f f , i · c i c p , i
k e f f , i = 1 1 k f , i + r p D p , i
q i = q m a x , i · K e q , i · c i 1 + K e q , i · c i
In the mass balance of the fluid phase (Equation (18), ε P , i is the inner porosity for the component, c p , i is the concentration of component i in the pores, t is time, q i is the concentration on the resin, d P is the mean diameter of the resin particle, ε S is the voidage, k e f f , i is the effective mass transport coefficient, and c i is the concentration in the continuous phase.
The mass transfer coefficient k e f f , i is given by Equation (19). Here, k f , i is the film mass transfer coefficient, r p is the particle radius, and D p , i is the pore diffusion coefficient. For the pore diffusion coefficient and the film mass transfer coefficient, the correlations of Carta and Wilson are available and used widely [72,73].
In the Langmuir isotherm, q m a x ,   i is the maximum loading capacity of the component and K e q , i is the Langmuir coefficient of the component. K e q , i and q m a x ,   i are related by the Henry coefficient, H i ; see Equation (4) [69]. Salt influence can be described by Equations (22) and (23), defining a 1 , a 2 , b 1 , and b 2 as correlation coefficients [74]:
q m a x , i · K e q , i = H i
q m a x , i = b 1 · c p , 1 + b 2
H i = a 1 · c p , 1 a 2
To more accurately describe the pore diffusion and evaluate a chromatography digital twin for the polishing step, we employed the general rate model for chromatography, as given in Equation (24) [69].
ε p , i · c p , i t + 1 ε p , i q t = 1 r 2 r r 2 ε p , i · D p , i · c p , i r + 1 ε p , i · D S , i q i r
Parameters in this study were taken from the supplier’s documents. The Langmuir parameters are determined using the experimental data obtained from the above-described experiment.

2.5. Lyophilization

The lyophilization process is modeled by a one-dimensional sorption sublimation model introduced by [75]. Here, the exact derivation of the proposed model is shown. It calculates the time-dependent product temperature and the residual moisture during the lyophilization process.
Conduction through the frozen layer is the main heat transfer mechanism during primary drying. Ice sublimates at the sublimation interface and flows through the porous dried layer. The energy balance is written as:
ρ P r o d u c t c p , a p p a r e n t T t = λ 2 T x 2
ρProduct describes the density of the product, cp,apparent is the apparent heat capacity, T is the product temperature inside the vial, and λ is the heat conductivity. The phase change at the sublimation interface is implemented by an apparent heat capacity.
In the overall mass, the balance of water, ice, and the dried product is considered. Since the phase change of water is much faster than convection, it controls the overall transport rate:
m W t = ρ W , g Δ p η W K A v i a l
where mw is the overall water mass, ρw,g is the density of the water vapor, Δ p is the pressure difference, η W is the dynamic vapor viscosity of water, K is the hydraulic flow resistance, and AVial is the cross-sectional area of the vial. Heat and mass transfer are coupled by the sublimation enthalpy [76].
The next step in lyophilization is secondary drying. Desorption is the main transport mechanism and is modeled by an Arrhenius approach because of its temperature dependency. The mass balance of the bound water during secondary drying can be written as:
w b w t = exp Δ h s u b l R T p r o d u c t a W w b w w b w , e q
where wbw is the mass fraction of the bound water in the dried product, Δhsubl is the sublimation enthalpy, R is the gas constant, αw is the water activity, and wbw,eq is the mass share of bound water at equilibrium.

3. Results and Discussion

3.1. Cultivation of HIV-Gag Producing HEK293 Cells

Figure 4 shows the course of the live cell count (a), the glucose and lactate concentration (b), the glutamine concentration (c), and the relative product concentration (d). The experimentally determined concentrations can be described well using the Monod-based model. The largest deviations in the predictions occur at the end of cultivation for the live cell count and the glutamine concentration. The experimental and simulated concentration curves for glucose and lactate are well matched over the entire process time. Product formation was experimentally only detectable from day nine onwards.

3.2. Harvest via Depth Filtration

The blocking constants required for the modeling were determined using linear regression and are shown as an example for FB4 (direct filtration, without pre-clarification) in Figure 5. In addition to standard blocking (Figure 5a), intermediate blocking (Figure 5b), and the composite media model (Figure 5c), complete blocking and cake formation are listed in the literature as further main blocking mechanisms. However, these mechanisms are not able to reproduce the experimental processes presented here with sufficient accuracy, which has previously been discussed by [23].
The membrane resistance is calculated from the initially present pressure difference via equation. This results in the parameters for the modeling shown in Table 1.
To describe the accuracy and precision of the model, 30 Monte Carlo simulations were performed, combining the parameter errors in a normally distributed and random manner. This obtained a t-test confidence interval of 94.97% with a certainty of 99%. The error of the viscosity, as well as the LMH, were assumed to be 5% each, whereas the error of the membrane resistance and the blocking constants were determined from the experiments.
The experimentally determined pressure curve and the simulation results of the Monte Carlo studies are shown in Figure 6. The harvesting by direct filtration of FB4 (Figure 6a) and FB5 (Figure 6b) can be reproduced well with a deviation of 0.8% (FB4) and 1.4% (FB5) of the achieved filter capacity at the experimentally achieved maximum transmembrane pressure of 1.6 bar (FB4) and 1.9 bar (FB5), respectively, using the standard blocking model. The intermediate model shows the largest deviation with 13.3% (FB4) and 17.0% (FB5).
For a pre-clarified feed (PC1, Figure 6c, and PC2, Figure 6d), the smallest deviations of 1.3% (PC1) and 1.4% (PC2) of the maximum filter capacity achieved in the experiment can be achieved using the standard blocking model. However, this deviates most strongly from the experimental results at lower transmembrane bridges, which are decisive for the prediction of the filtration profile in the application as a digital twin. The intermediate blocking model fits this course best and is still sufficiently accurate with a maximum deviation of 4.5% (PC1) of the filter capacity reached at the end.
For both the depth filtration of pre-clarified feed and direct filtration, the modeled pressure curve with the composite media model lies between the standard and the intermediate blocking model. The precision of the models is very accurate, with a deviation of 1.2% (standard) and 1.3% (composite media). With 4.5% the intermediate blocking model shows the largest deviation. Typical experimental reproducibilities are around 5%. The simulation results deviating by less than 4.5% can be assumed as sufficiently precise model predictions.
Figure 7 shows the data points used for the regression to determine the blocking constant and the modeling via the standard blocking model resulting from the parameter determination. Already, from 5.8% of the maximum TMP achieved, the further development of the process can be predicted.

3.3. Intermediate Purification and Concentration via Ultra-/Diafiltration

After clarification by depth filtration, volume reduction and the first separation of side components is performed by ultrafiltration/diafiltration. This process step can be divided into two phases. First, a concentration step is performed to reduce the subsequently needed exchange buffer volume as well as process time. Second, buffer exchange and partial purification are achieved by diafiltration with seven diafiltration volumes (DV). Process model predictions are shown in Figure 8 (concentration factor 3) and Figure 9 (concentration factor 7). The digital twin prediction for experiments aligns with the experimental results. The initial strong decline in flux, observed in all experiments, is well described as the slower decrease in flux during the increase in the boundary layer resistance. The model precision, described by the t-test derived confidence interval (alpha = 99%), is between 2.1% and 3.8% for concentration factor 3 runs and between 2.4% and 3.3% for concentration factor 7 runs.

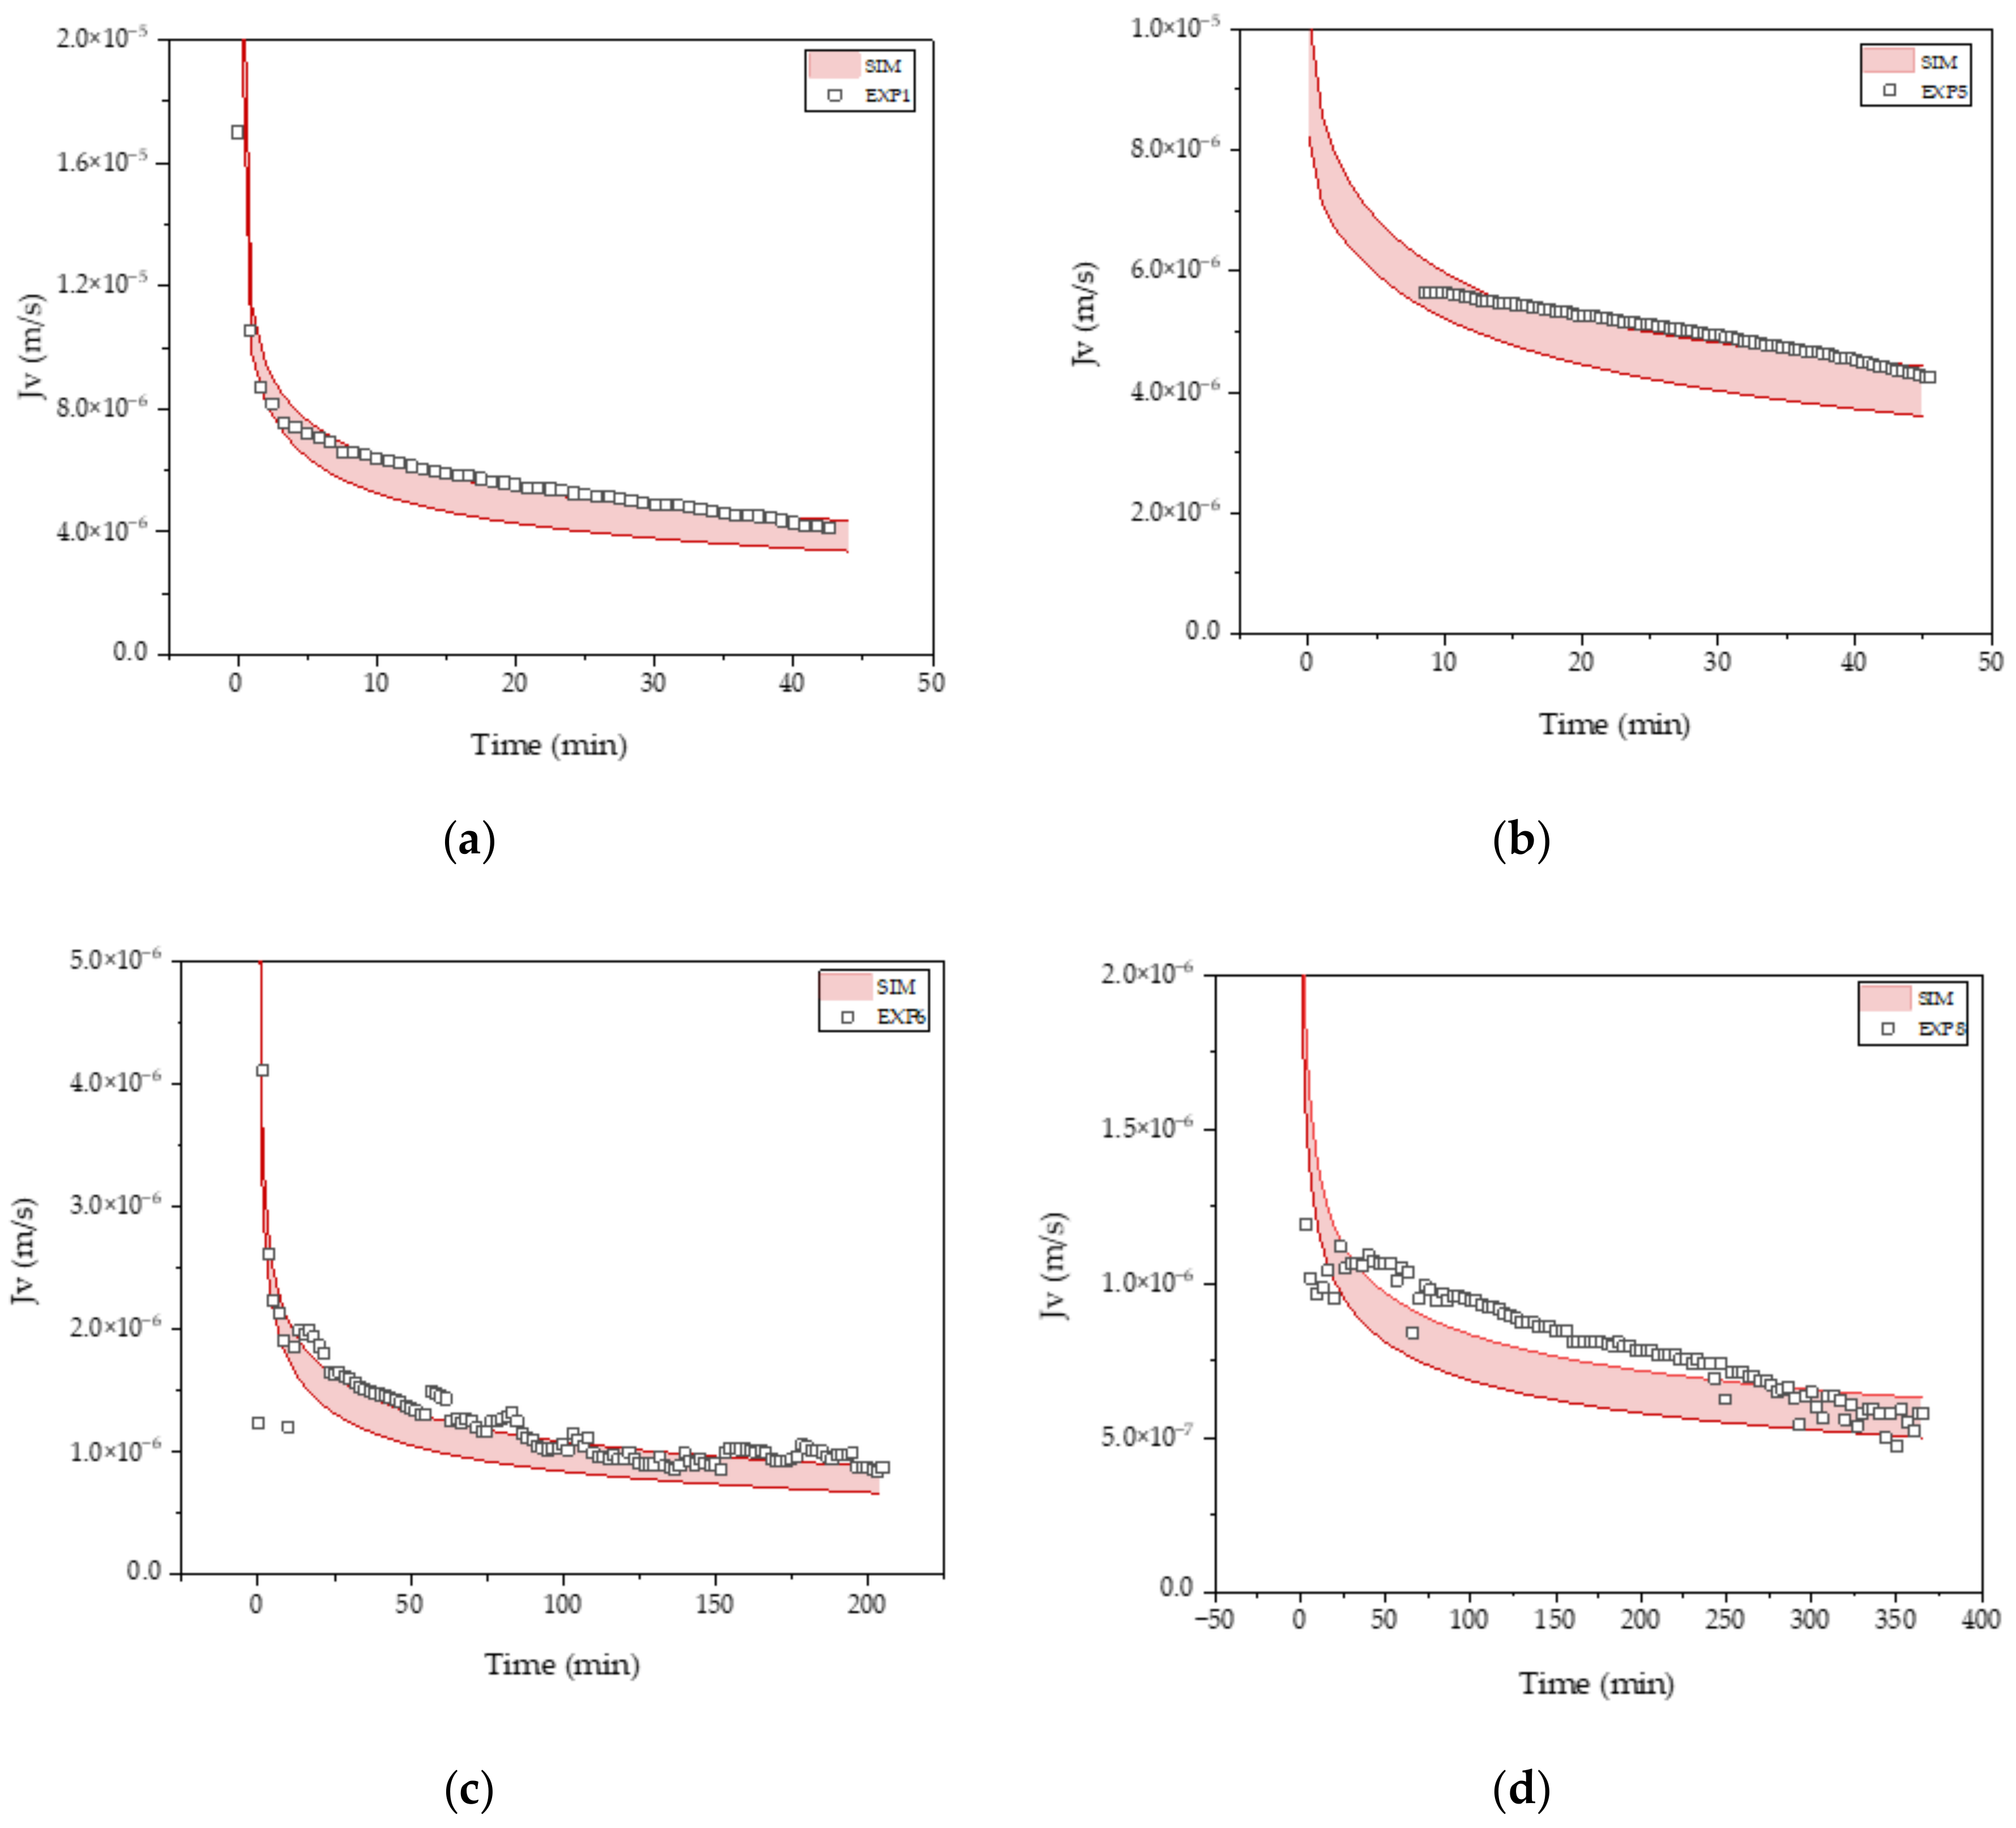
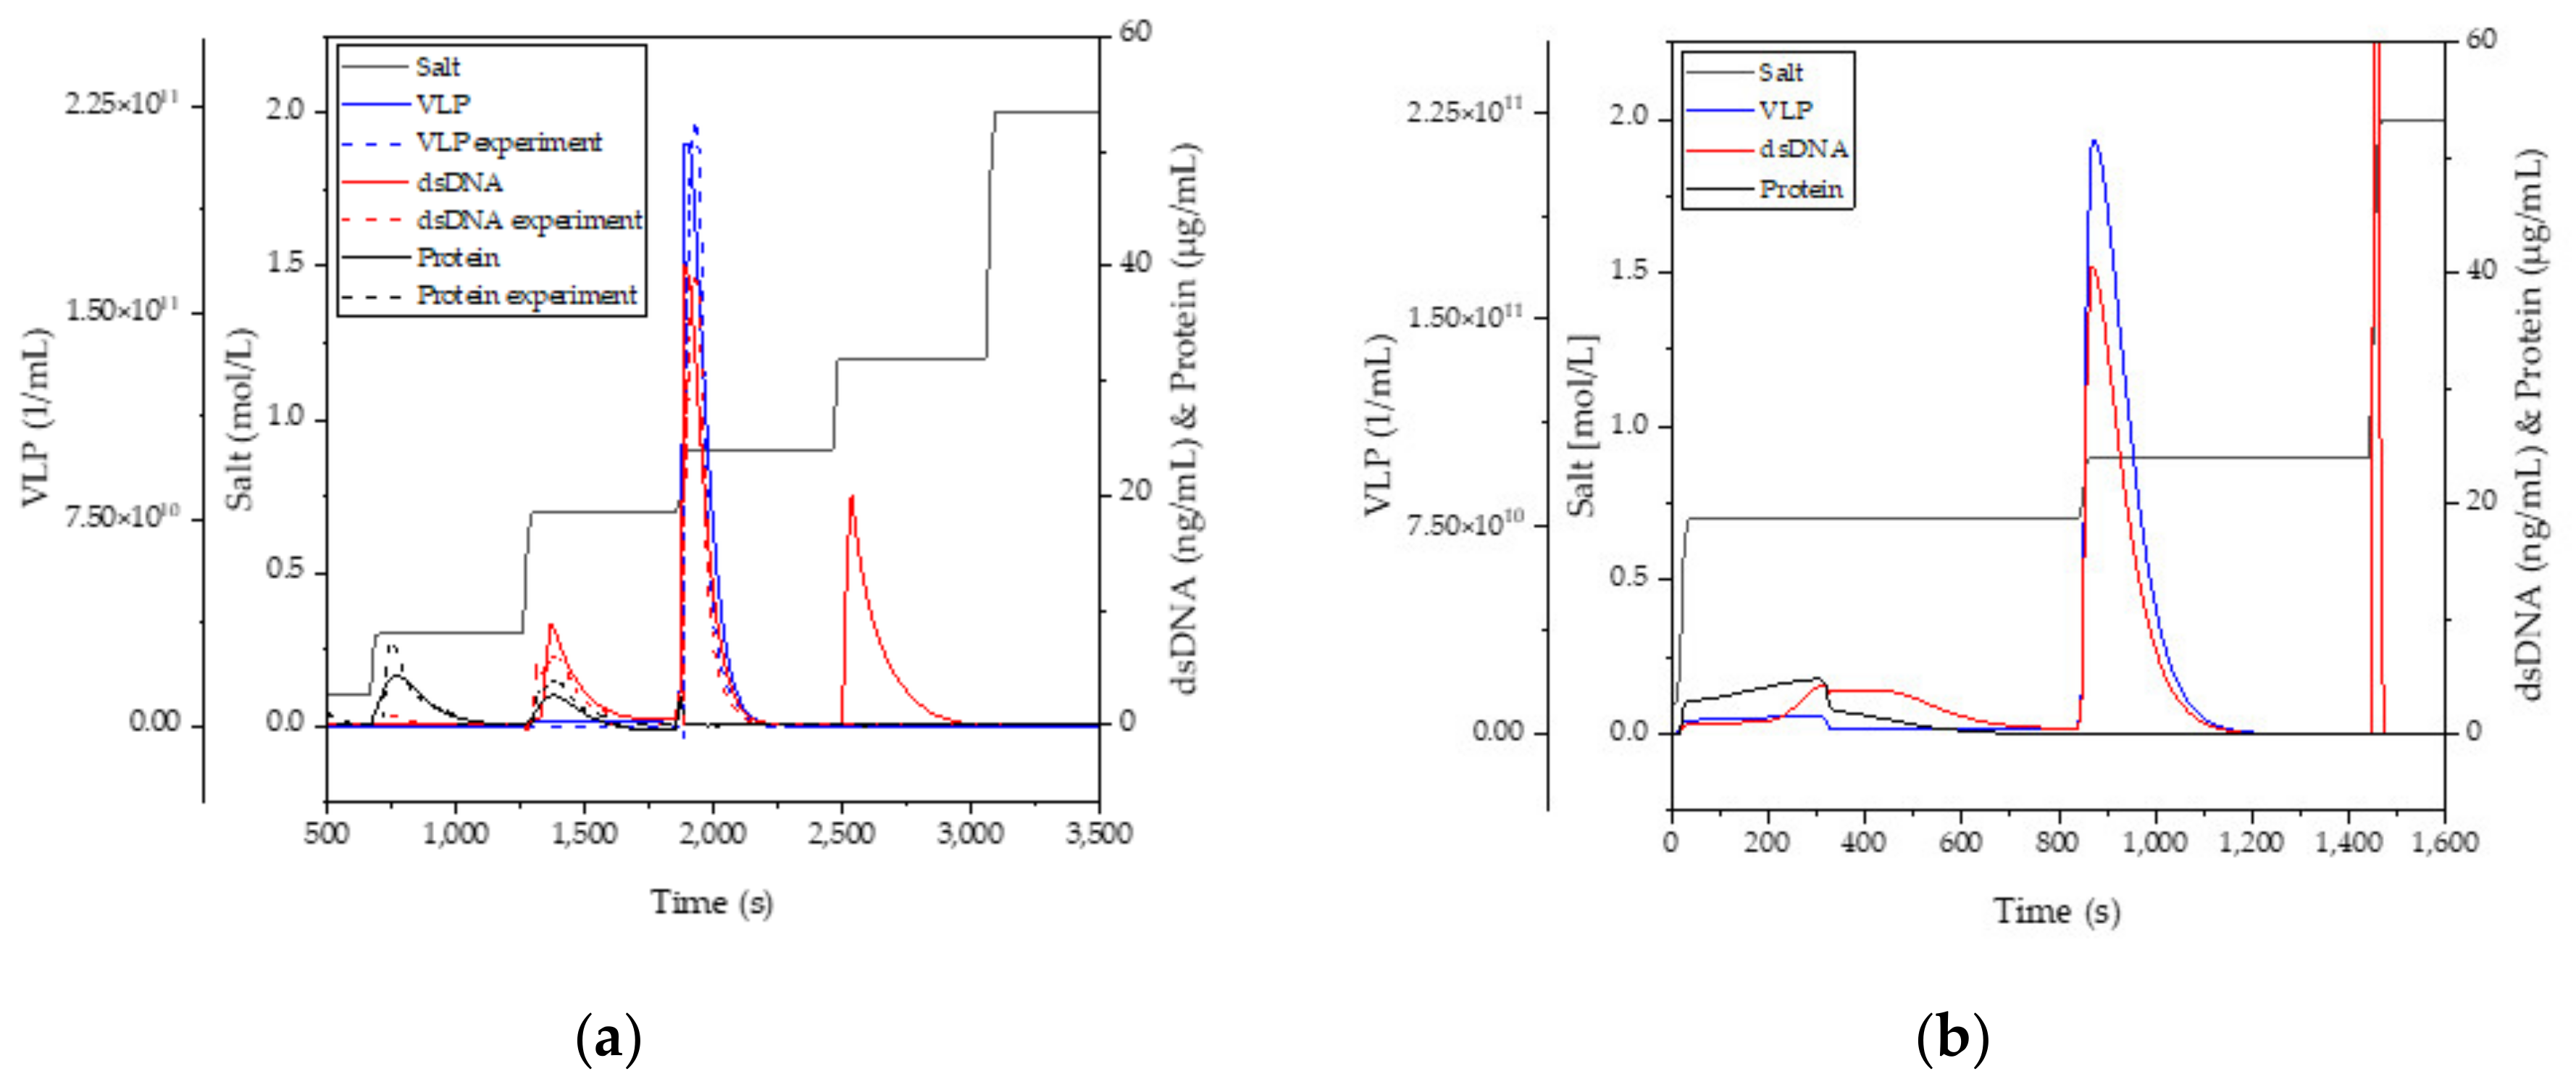
3.4. Anion-Exchange Chromatography

To model a batch purification with a 180 mL injection, we firstly needed to determine the isotherm parameters as described in Section 2.4. The results of the parameter determination are given in Figure 10a. The experimental results are sufficiently calculated by the digital twin and, as such, enable the scale-up. The laboratory process, employing a 5 mL injection volume, reaches a productivity of 8.87 × 10¹² particles per mL of column volume and day. A scale-up using up to 180 mL injection volume would require a 35 mL resin volume with a diameter of 30 mm and a length of 50 mm, which was set to be the same as the column used in the experiment.
To optimize this process, a high salt wash, instead of the first two gradient steps, could be employed. The chromatogram of such a potentially optimized and scaled-up process is depicted in Figure 10b. This scale-up and optimization offer an increase in productivity to 1.89 × 10¹³, which corresponds to a roughly two-fold increase.

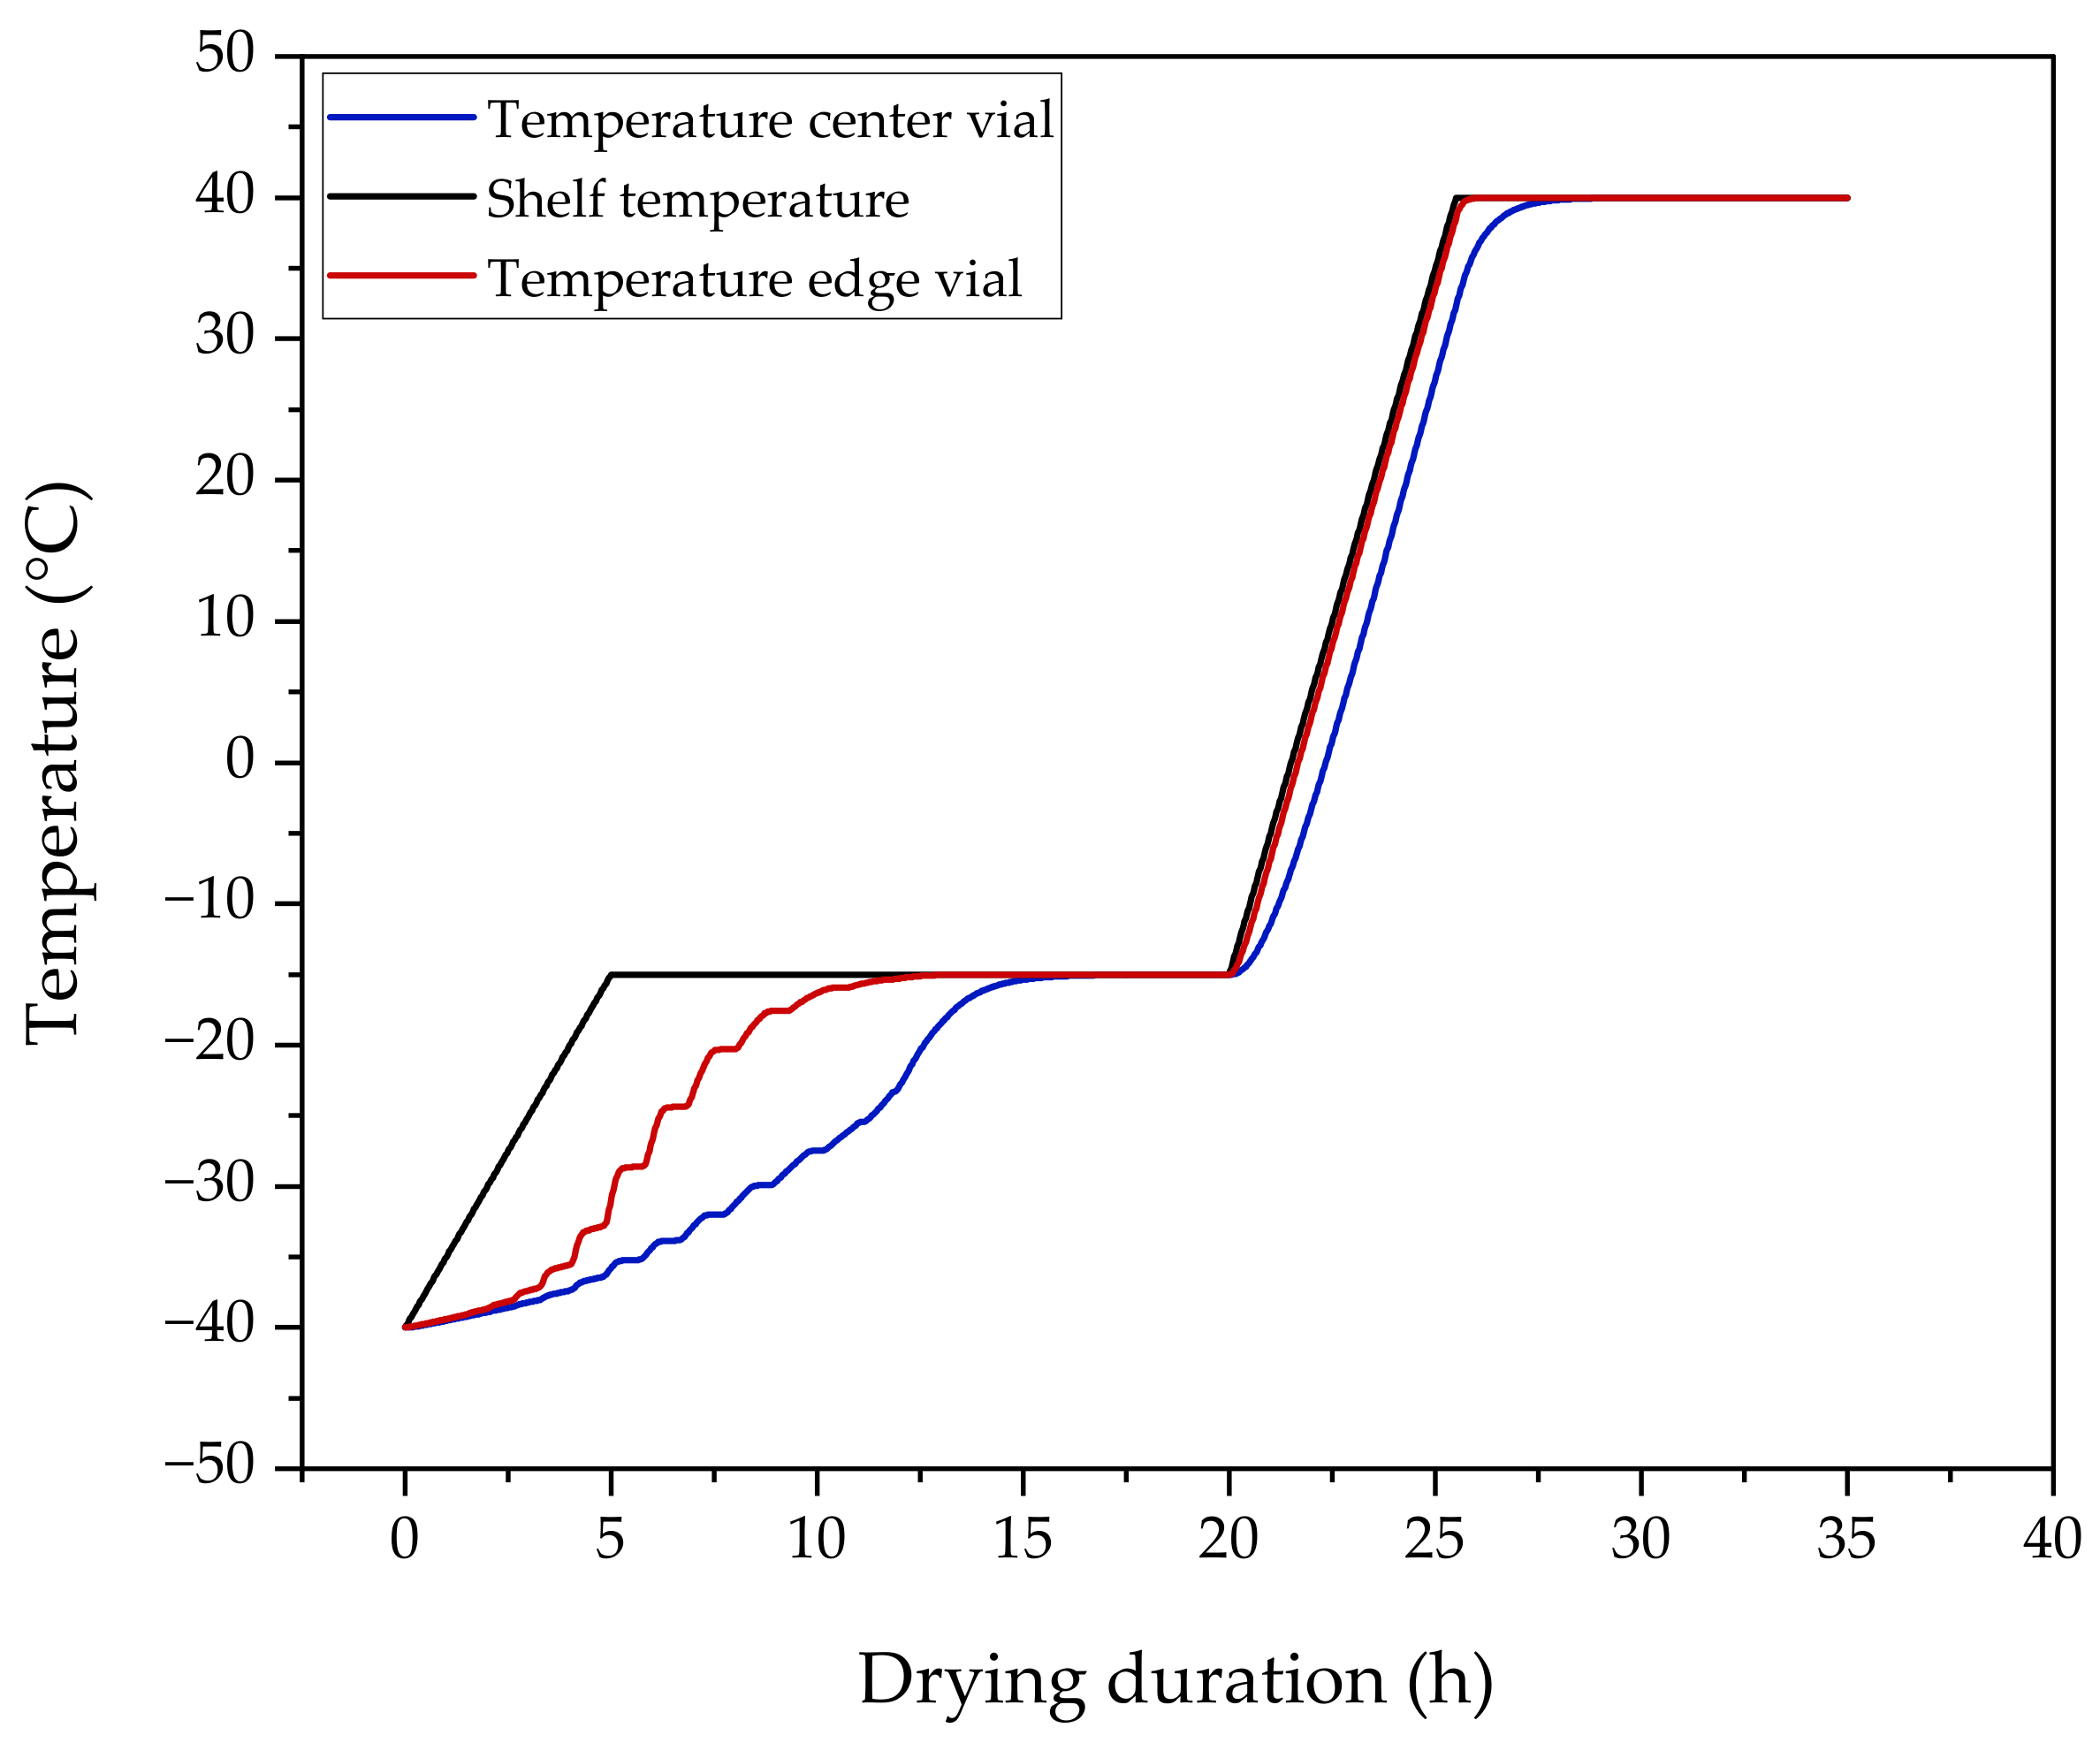
3.5. Formulation via Lyophilization

In this study, 167 2R vials are filled with 600 µL VLP solution and must be freeze-dried. This scale is manageable with an Epsilon 2-4 LSC-plus [77]. The main excipient is trehalose. Since the main excipient and the equipment scale are comparable, the two model parameters, vial heat transfer and hydraulic flow resistance, are adopted from the literature [75]. The edge vials receive a higher heat input during lyophilization due to radiation [78]. This so-called edge effect leads to a drying batch heterogeneity. Edge vials receive the highest heat input whereas the center vial receives heat mainly due to conduction. It is important both to keep the product temperature for each vial below the collapse temperature and to remove all ice during primary drying.
The lyophilization process for different vials is shown in Figure 11.
The freeze-drying protocol has been adopted from the literature [79]. During primary drying, the shelf temperature is raised from −40 °C to −5 °C and a chamber pressure of 0.045 mbar is set. During secondary drying, the shelf temperature is increased to 40 °C and the pressure is lowered to 0.007 mbar. The initial product temperatures lie at −40 °C and gradually approach the shelf temperature. The higher heat input of the edge vial leads to an increased product temperature compared to the center vial. The primary drying process of the edge vial is completed in 12.5 h, while the center vial needs an additional 3 h. The endpoint of the primary drying [80] can be determined as the point where the product and shelf temperatures are the same. The primary drying process can be considered completed and the secondary drying begins. The product temperature of the hottest vial is near the shelf temperature because bound water is already desorbed in primary drying. The final residual moisture of the vials is about <2%.

4. Discussion

With the digital twins presented in Section 3, it is possible to reproduce the physical process in real-time and, in combination with PAT, to predict the further course of the process and readjust it based on the control strategy within the design space, as illustrated in Figure 12.
During cultivation, the instantaneous VLP, glucose, lactate, and other minor component concentrations can be determined by using modern PAT detectors (especially Raman, FTIR, and MALS/DLS) [48,81,82,83] and the corresponding modeling [81]. The digital twin can use this process information to adjust feeding and other process parameters, such as gassing, as needed and provide important information for downstream, such as optimal harvest time, total cell density TCD at harvest time, and product concentration, purity, and expected size distribution.
Product concentration and size distribution determine the blocking mechanism and the associated maximum filter capacity [84,85]. Knowledge of this variable makes it possible to ensure that a sufficient filter area is available while avoiding oversizing. Product concentration is also an important process parameter for UF/DF to compensate for variations prior to AEX to a fixed target concentration and thus loading volume.
By using the digital twin during depth filtration, the differential pressure measurement can consistently predict the maximum filter capacity currently expected. This makes it possible to avoid holding times due to filter replacement or yield loss if the entire cultivation broth cannot be filtered due to fixed scheduling [86].
The digital twin in the UF/DF makes it possible to predict the further development of the filter resistance via the measured permeate flow and thus determine the expected endpoint [61]. Furthermore, the shear rate can be adjusted to ensure the timely loading of the AEX with the desired product concentration. This makes it possible to set the shear rate only as high as necessary and thus to work as gently as possible for the product [87].
In the context of QbD-based process development, shear stress as a Critical Process Parameter (CPP) as part of the control strategy would ensure that the process is operating within the proven acceptable range (PAR) [41,88]. Digital twins, in combination with PAT—for example, FTIR—create the flexibility to set the exchange volumes in the UF/DF based on the actual desalination and purity levels. This flexibility cannot be achieved with conventional process development and offline analytics, where fixed exchange volumes are set. Achieving optimal product purity or saving exchange buffers can therefore only be enabled by a digital twin and QbD-based process design.
For the AEX step, real-time product analysis using MALS/DLS in combination with the digital twin offers the possibility to dynamically adjust the cut points for the product fraction to achieve the optimum between yield and purity/concentration.
The digital twin also offers advantages in terms of critical raw materials, equipment technology, and process control [89]. In combination with PAT strategies, it also provides the basis for the transition from batch to continuous operation [90].
The most cost-intensive raw materials in the process, such as feed-in cultivation, can be dosed in a tailored ratio. This enables potential savings that directly reduce the cost of goods, making the process more profitable or more affordable for the healthcare system [91]. The independence from supply bottlenecks increases and a stable market supply is made possible.
In terms of choices of equipment technology, the use of digital twins in combination with online CIP/SIP measurement techniques (such as real-time total organic carbon, TOC, and bioburden, as well as conductivity) [92] offers the freedom to move away from the commonly used single-use technology. This is made possible by automated execution and validation [93]. This eliminates the simple and fast switch of campaigns, which is the main advantage of single-use technology [94]. There are even benefits in terms of sustainability [95]. The recently reported difficulties in the supply of single-use technology can be circumvented [96].
The step from batch-wise to continuous production is made possible last but not least by linking modern PAT-based control strategies with the digital twin. Only this link enables the realization of the main advantages of continuous production, such as real-time release-testing (RTRT) for a shorter time-to-market combined with lower batch failure rates [28,51,97].
The advantages of automated production enabled by PAT for APC and digital twins become particularly clear when this is compared with the conventional process based on offline analyses, as depicted in Figure 13. Ideally, the ongoing prediction of the digital twin enables subsequent process steps to be performed with minimal hold-time. This is secured by real-time PAT [23] in combination with a QbD-based control strategy to ensure operation within the NAR. Design Spaces NAR and PAR are available as part of a QbD-based process development, which was demonstrated for other systems [48,80]. This combination makes it possible for the process presented here to perform the entire downstream within one working day. In contrast, the conventional process flow requires time-consuming offline analytics, resulting in two working days for the downstream process. This additionally means longer holding times for the product, which increase the risk of quality degradation for sensitive products such as enveloped VLPs [98].

5. Conclusions

For the production and purification of HIV-1 Gag VLPs in HEK293 cells, this study demonstrates the applicability of digital twins in the context of QbD-based process development.
Based on the digital twin, optimized control allows for an optimized feeding strategy as well as the prediction of important KPA such as yield and VLP concentration as well as particle size distribution by MALS/DLS.
In depth filtration, it was shown that the early detection of real filter capacity is possible from as low as 5.8% (9 mbar) of the maximum TMP. The predicted capacity at this point is 50 L/m2 and deviates only 1% from the real capacity of 49.5 L/m2.
In UF/DF, the predicted product concentration can be used to determine the necessary process time. The maximum deviation in the prediction is less than 3.8%.
This allows the AEX to be loaded with a constant VLP concentration. The digital twin in the AEX can be used for a scale-up, which could increase productivity by up to a factor of 2.
Another important benefit of digital twins in combination with APC and PAT is the optimization of the process schedule. By avoiding hold times between process steps, the downstream can be fully started within one working day instead of two. This reduces the hold time until lyophilization by a factor of 2.
These advantages in raw materials, equipment technology, and the move to continuous production are made possible by the use of digital twins for APC with PAT.
Design Spaces NOR and PAR are available as part of QbD-based process development. Through real-time PAT measurement, the extension of the PAT portfolio with MALS/DLS in combination with digital twins for APC enables the automation of the process up to RTRT.
In summary, this study shows the applicability of the digital twins as process models with a maximum deviation of 4.5% from the experimental data. In combination with real-time PAT and a QbD-based control strategy, it is possible to improve the process schedule by a factor of two. The next steps in 2022 are the validation of the shown optimization potentials by linking PAT and the digital twins as well as the conversion from batch to continuous production in a Siemens S7 process environment.

Author Contributions

Conceptualization, J.S. (Jochen Strube); software, process, and analytics experiments, A.H., H.H., A.S., F.L.V. and A.J.; VLP cell line development, J.F.R. and J.S. (Jörn Stitz); writing—original draft preparation, A.H., H.H., A.S., F.L.V. and A.J.; writing—review and editing, A.H., H.H., A.S., F.L.V., A.J., J.F.R., J.S. (Jochen Strube) and J.S. (Jörn Stitz); supervision, J.S. (Jochen Strube) and J.S. (Jörn Stitz); project administration, J.S (Jochen Strube). All authors have read and agreed to the published version of the manuscript.

Funding

A part of this work was supported by a grant from the German Federal Ministry of Education and Research, funding program Forschung an Fachhoschulen, contract number 13FH767IA6 to J.S. (Jörn Stitz). The authors acknowledge financial support from the Open Access Publishing Fund of the Clausthal University of Technology.

Institutional Review Board Statement

Not applicable.

Informed Consent Statement

Not applicable.

Data Availability Statement

Data generated in this study are available from the authors upon reasonable request.

Acknowledgments

The authors would like to acknowledge the fruitful discussions with their Clausthal University of technology colleagues.

Conflicts of Interest

The authors declare no conflict of interest.

References

  1. Iqbal, N.; Karaca, Y. Complex Fractional-Order HIV Diffusion Model Based on Amplitude Equations with Turing Patterns and Turing Instability. Fractals 2021, 29, 2140013. [Google Scholar] [CrossRef]
  2. Yasmin, H. Effect of vaccination on non-integer dynamics of pneumococcal pneumonia infection. Chaos Solitons Fractals 2022, 158, 112049. [Google Scholar] [CrossRef]
  3. Flynn, N.M.; Forthal, D.N.; Harro, C.D.; Judson, F.N.; Mayer, K.H.; Para, M.F. Placebo-controlled phase 3 trial of a recombinant glycoprotein 120 vaccine to prevent HIV-1 infection. J. Infect. Dis. 2005, 191, 654–665. [Google Scholar] [CrossRef] [PubMed]
  4. Hammonds, J.; Chen, X.; Zhang, X.; Lee, F.; Spearman, P. Advances in methods for the production, purification, and characterization of HIV-1 Gag-Env pseudovirion vaccines. Vaccine 2007, 25, 8036–8048. [Google Scholar] [CrossRef] [PubMed]
  5. Deml, L.; Speth, C.; Dierich, M.P.; Wolf, H.; Wagner, R. Recombinant HIV-1 Pr55gag virus-like particles: Potent stimulators of innate and acquired immune responses. Mol. Immunol. 2005, 42, 259–277. [Google Scholar] [CrossRef]
  6. Mohsen, M.O.; Zha, L.; Cabral-Miranda, G.; Bachmann, M.F. Major findings and recent advances in virus-like particle (VLP)-based vaccines. Semin. Immunol. 2017, 34, 123–132. [Google Scholar] [CrossRef]
  7. Roldão, A.; Mellado, M.C.M.; Castilho, L.R.; Carrondo, M.J.T.; Alves, P.M. Virus-like particles in vaccine development. Expert Rev. Vaccines 2010, 9, 1149–1176. [Google Scholar] [CrossRef]
  8. Cervera, L.; Gòdia, F.; Tarrés-Freixas, F.; Aguilar-Gurrieri, C.; Carrillo, J.; Blanco, J.; Gutiérrez-Granados, S. Production of HIV-1-based virus-like particles for vaccination: Achievements and limits. Appl. Microbiol. Biotechnol. 2019, 103, 7367–7384. [Google Scholar] [CrossRef]
  9. Rosengarten, J.F.; Schatz, S.; Wolf, T.; Barbe, S.; Stitz, J. Components of a HIV-1 vaccine mediate virus-like particle (VLP)-formation and display of envelope proteins exposing broadly neutralizing epitopes. Virology 2022, 568, 41–48. [Google Scholar] [CrossRef]
  10. Ludwig, C.; Wagner, R. Virus-like particles-universal molecular toolboxes. Curr. Opin. Biotechnol. 2007, 18, 537–545. [Google Scholar] [CrossRef]
  11. Boix-Besora, A.; Lorenzo, E.; Lavado-García, J.; Gòdia, F.; Cervera, L. Optimization, Production, Purification and Characterization of HIV-1 GAG-Based Virus-like Particles Functionalized with SARS-CoV-2. Vaccines 2022, 10, 250. [Google Scholar] [CrossRef] [PubMed]
  12. Doan, L.X.; Li, M.; Chen, C.; Yao, Q. Virus-like particles as HIV-1 vaccines. Rev. Med. Virol. 2005, 15, 75–88. [Google Scholar] [CrossRef] [PubMed]
  13. Cruz, P.E.; Cunha, A.; Peixoto, C.C.; Clemente, J.; Moreira, J.L.; Carrondo, M.J. Optimization of the production of virus-like particles in insect cells. Biotechnol. Bioeng. 1998, 60, 408–418. [Google Scholar] [CrossRef]
  14. Pillay, S.; Meyers, A.; Williamson, A.-L.; Rybicki, E.P. Optimization of chimeric HIV-1 virus-like particle production in a baculovirus-insect cell expression system. Biotechnol. Prog. 2009, 25, 1153–1160. [Google Scholar] [CrossRef] [PubMed]
  15. Puente-Massaguer, E.; Grau-Garcia, P.; Strobl, F.; Grabherr, R.; Striedner, G.; Lecina, M.; Gòdia, F. Accelerating HIV-1 VLP production using stable High Five insect cell pools. Biotechnol. J. 2021, 16, e2000391. [Google Scholar] [CrossRef]
  16. Visciano, M.L.; Diomede, L.; Tagliamonte, M.; Tornesello, M.L.; Asti, V.; Bomsel, M.; Buonaguro, F.M.; Lopalco, L.; Buonaguro, L. Generation of HIV-1 Virus-Like Particles expressing different HIV-1 glycoproteins. Vaccine 2011, 29, 4903–4912. [Google Scholar] [CrossRef]
  17. Zhu, J. Mammalian cell protein expression for biopharmaceutical production. Biotechnol. Adv. 2012, 30, 1158–1170. [Google Scholar] [CrossRef]
  18. Cervera, L.; Gutiérrez-Granados, S.; Martínez, M.; Blanco, J.; Gòdia, F.; Segura, M.M. Generation of HIV-1 Gag VLPs by transient transfection of HEK 293 suspension cell cultures using an optimized animal-derived component free medium. J. Biotechnol. 2013, 166, 152–165. [Google Scholar] [CrossRef]
  19. Durocher, Y.; Pham, P.L.; St-Laurent, G.; Jacob, D.; Cass, B.; Chahal, P.; Lau, C.J.; Nalbantoglu, J.; Kamen, A. Scalable serum-free production of recombinant adeno-associated virus type 2 by transfection of 293 suspension cells. J. Virol. Methods 2007, 144, 32–40. [Google Scholar] [CrossRef]
  20. Kamen, A.; Henry, O. Development and optimization of an adenovirus production process. J. Gene Med. 2004, 6 (Suppl. 1), S184–S192. [Google Scholar] [CrossRef]
  21. Le Ru, A.; Jacob, D.; Transfiguracion, J.; Ansorge, S.; Henry, O.; Kamen, A.A. Scalable production of influenza virus in HEK-293 cells for efficient vaccine manufacturing. Vaccine 2010, 28, 3661–3671. [Google Scholar] [CrossRef] [PubMed]
  22. Segura, M.M.; Garnier, A.; Durocher, Y.; Coelho, H.; Kamen, A. Production of lentiviral vectors by large-scale transient transfection of suspension cultures and affinity chromatography purification. Biotechnol. Bioeng. 2007, 98, 789–799. [Google Scholar] [CrossRef] [PubMed]
  23. Helgers, H.; Hengelbrock, A.; Schmidt, A.; Rosengarten, J.; Stitz, J.; Strube, J. Process Design and Optimization towards Digital Twins for HIV-Gag VLP Production in HEK293 Cells, including Purification. Processes 2022, 10, 419. [Google Scholar] [CrossRef]
  24. Beg, S.; Hasnain, M.S.; Rahman, M.; Swain, S. Introduction to Quality by Design (QbD): Fundamentals, Principles, and Applications. In Pharmaceutical Quality by Design; Elsevier: Amsterdam, The Netherlands, 2019; pp. 1–17. ISBN 9780128157992. [Google Scholar]
  25. Rathore, A.S.; Winkle, H. Quality by design for biopharmaceuticals. Nat. Biotechnol. 2009, 27, 26–34. [Google Scholar] [CrossRef] [PubMed]
  26. Yu, L.X. Pharmaceutical quality by design: Product and process development, understanding, and control. Pharm. Res. 2008, 25, 781–791. [Google Scholar] [CrossRef] [PubMed]
  27. Chen, Y.; Yang, O.; Sampat, C.; Bhalode, P.; Ramachandran, R.; Ierapetritou, M. Digital Twins in Pharmaceutical and Biopharmaceutical Manufacturing: A Literature Review. Processes 2020, 8, 1088. [Google Scholar] [CrossRef]
  28. Schmidt, A.; Helgers, H.; Vetter, F.L.; Juckers, A.; Strube, J. Digital Twin of mRNA-Based SARS-COVID-19 Vaccine Manufacturing towards Autonomous Operation for Improvements in Speed, Scale, Robustness, Flexibility and Real-Time Release Testing. Processes 2021, 9, 748. [Google Scholar] [CrossRef]
  29. Lopez, P.C.; Udugama, I.A.; Thomsen, S.T.; Roslander, C.; Junicke, H.; Mauricio-Iglesias, M.; Gernaey, K.V. Towards a digital twin: A hybrid data-driven and mechanistic digital shadow to forecast the evolution of lignocellulosic fermentation. Biofuels Bioprod. Bioref. 2020, 14, 1046–1060. [Google Scholar] [CrossRef]
  30. Matsunami, K.; Ryckaert, A.; Peeters, M.; Badr, S.; Sugiyama, H.; Nopens, I.; de Beer, T. Analysis of the Effects of Process Parameters on Start-Up Operation in Continuous Wet Granulation. Processes 2021, 9, 1502. [Google Scholar] [CrossRef]
  31. Meitz, A.; Sagmeister, P.; Langemann, T.; Herwig, C. An Integrated Downstream Process Development Strategy along QbD Principles. Bioengineering 2014, 1, 213–230. [Google Scholar] [CrossRef] [Green Version]
  32. Udugama, I.A.; Lopez, P.C.; Gargalo, C.L.; Li, X.; Bayer, C.; Gernaey, K.V. Digital Twin in biomanufacturing: Challenges and opportunities towards its implementation. Syst. Microbiol. Biomanuf. 2021, 1, 257–274. [Google Scholar] [CrossRef]
  33. Brunet, R.; Guillén-Gosálbez, G.; Pérez-Correa, J.R.; Caballero, J.A.; Jiménez, L. Hybrid simulation-optimization based approach for the optimal design of single-product biotechnological processes. Comput. Chem. Eng. 2012, 37, 125–135. [Google Scholar] [CrossRef] [Green Version]
  34. Brunef, R.; Kumar, K.S.; Guillen-Gosalbez, G.; Jimenez, L. Integrating process simulation, multi-objective optimization and LCA for the development of sustainable processes. In 21st European Symposium on Computer Aided Process Engineering; Elsevier: Amsterdam, The Netherlands, 2011; pp. 1271–1275. ISBN 9780444538956. [Google Scholar]
  35. Del Castillo-Romo, A.Á.; Morales-Rodriguez, R.; Román-Martínez, A. Multi-objective optimization for the biotechnological conversion of lingocellulosic biomass to value-added products. In 26th European Symposium on Computer Aided Process Engineering; Elsevier: Amsterdam, The Netherlands, 2016; pp. 1515–1520. ISBN 9780444634283. [Google Scholar]
  36. Pérez, A.D.; van der Bruggen, B.; Fontalvo, J. Modeling of a liquid membrane in Taylor flow integrated with lactic acid fermentation. Chem. Eng. Process. Process Intensif. 2019, 144, 107643. [Google Scholar] [CrossRef]
  37. Mat Isham, N.K.; Mokhtar, N.; Fazry, S.; Lim, S.J. The development of an alternative fermentation model system for vinegar production. LWT 2019, 100, 322–327. [Google Scholar] [CrossRef]
  38. Da Costa Basto, R.M.; Casals, M.P.; Mudde, R.F.; van der Wielen, L.A.; Cuellar, M.C. A mechanistic model for oil recovery in a region of high oil droplet concentration from multiphasic fermentations. Chem. Eng. Sci. X 2019, 3, 100033. [Google Scholar] [CrossRef]
  39. Udugama, A.; Öner, I.; Lopez, M.; Beenfeldt, P.C.; Bayer, C.; Huusom, C.; Gernaey, J.K.; Sin, K.V. Towards Digitalization in Bio-Manufacturing Operations: A Survey on Application of Big Data and Digital Twin Concepts in Denmark. Front. Chem. Eng. 2021, 3, 727152. [Google Scholar] [CrossRef]
  40. Zurdo, J.; Arnell, A.; Obrezanova, O.; Smith, N.; La Gómez de Cuesta, R.; Gallagher, T.R.A.; Michael, R.; Stallwood, Y.; Ekblad, C.; Abrahmsén, L.; et al. Early implementation of QbD in biopharmaceutical development: A practical example. BioMed Res. Int. 2015, 2015, 605427. [Google Scholar] [CrossRef] [Green Version]
  41. ICH Expert Working Group. Pharmaceuticel Development Q8(R2): ICH Harmonised Tripartite Guideline; ICH Expert Working Group: Geneva, Switzerland, 2009. [Google Scholar]
  42. Keith Pugh. Prior Knowledge in Product Development/Design. Available online: https://www.google.com/url?sa=t&rct=j&q=&esrc=s&source=web&cd=&ved=2ahUKEwjE5a-Y9vbzAhU0g_0HHSUvCk4QFnoECAoQAQ&url=https%3A%2F%2Fwww.ema.europa.eu%2Fdocuments%2Fpresentation%2Fpresentation-regulators-perspective-session-2-keith-pugh_en.pdf&usg=AOvVaw0NxD1cs8-EMstl-sdm9IxA (accessed on 13 March 2022).
  43. Yu, L.X.; Amidon, G.; Khan, M.A.; Hoag, S.W.; Polli, J.; Raju, G.K.; Woodcock, J. Understanding pharmaceutical quality by design. AAPS J. 2014, 16, 771–783. [Google Scholar] [CrossRef] [Green Version]
  44. Alt, N.; Zhang, T.Y.; Motchnik, P.; Taticek, R.; Quarmby, V.; Schlothauer, T.; Beck, H.; Emrich, T.; Harris, R.J. Determination of critical quality attributes for monoclonal antibodies using quality by design principles. Biologicals 2016, 44, 291–305. [Google Scholar] [CrossRef]
  45. Schmidt, A.; Strube, J. Distinct and Quantitative Validation Method for Predictive Process Modeling with Examples of Liquid-Liquid Extraction Processes of Complex Feed Mixtures. Processes 2019, 7, 298. [Google Scholar] [CrossRef] [Green Version]
  46. Zobel-Roos, S.; Schmidt, A.; Mestmäcker, F.; Mouellef, M.; Huter, M.; Uhlenbrock, L.; Kornecki, M.; Lohmann, L.; Ditz, R.; Strube, J. Accelerating Biologics Manufacturing by Modeling or: Is Approval under the QbD and PAT Approaches Demanded by Authorities Acceptable Without a Digital-Twin? Processes 2019, 7, 94. [Google Scholar] [CrossRef] [Green Version]
  47. Kis, Z.; Kontoravdi, C.; Shattock, R.; Shah, N. Resources, Production Scales and Time Required for Producing RNA Vaccines for the Global Pandemic Demand. Vaccines 2020, 9, 3. [Google Scholar] [CrossRef] [PubMed]
  48. Kornecki, M.; Schmidt, A.; Strube, J. PAT as key-enabling technology for QbD in pharmaceutical manufacturing A conceptual review on upstream and downstream processing. Chim. Oggi-Chem. Today 2018, 36, 44–48. [Google Scholar]
  49. Woodcock, J. Modernizing Pharmaceutical Manufacturing—Continuous Manufacturing as a Key Enabler: MIT-CMAC International Symposium on Continuous Manufacturing of Pharmaceuticals. Available online: https://iscmp.mit.edu/sites/default/files/documents/ISCMP%202014%20-%20Keynote_Slides.pdf (accessed on 6 December 2021).
  50. Helgers, H.; Hengelbrock, A.; Schmidt, A.; Strube, J. Digital Twins for Continuous mRNA Production. Processes 2021, 9, 1967. [Google Scholar] [CrossRef]
  51. Schmidt, A.; Helgers, H.; Vetter, F.L.; Juckers, A.; Strube, J. Fast and Flexible mRNA Vaccine Manufacturing as a Solution to Pandemic Situations by Adopting Chemical Engineering Good Practice—Continuous Autonomous Operation in Stainless Steel Equipment Concepts. Processes 2021, 9, 1874. [Google Scholar] [CrossRef]
  52. Giglia, S.; Straeffer, G. Combined mechanism fouling model and method for optimization of series microfiltration performance. J. Membr. Sci. 2012, 417, 144–153. [Google Scholar] [CrossRef]
  53. Iritani, E.; Katagiri, N. Developments of Blocking Filtration Model in Membrane Filtration. KONA 2016, 33, 179–202. [Google Scholar] [CrossRef] [Green Version]
  54. Zydney, A.L. Development of a new blocking model for membrane fouling based on a composite media model. J. Membr. Sci. Lett. 2022, 2, 100018. [Google Scholar] [CrossRef]
  55. Grote, F.; Fröhlich, H.; Strube, J. Integration of Ultrafiltration Unit Operations in Biotechnology Process Design. Chem. Eng. Technol. 2011, 34, 673–687. [Google Scholar] [CrossRef]
  56. Weisbach, J.L. Lehrbuch der Ingenieur-und Maschinen-Mechanik. In Theoretische Mechanik; Druck und Verlag von Friedrich Vieweg und Sohn: Berlin, Germany, 1845. [Google Scholar]
  57. Darcy, H. Les Fontaines Publiques de la Ville de Dijon in Exposition et Application; Victor Dalmont: Paris, France, 1856. [Google Scholar]
  58. Brown, G.O. The History of the Darcy-Weisbach Equation for Pipe Flow Resistance. In Environmental and Water Resources History, Proceedings of the Environmental and Water Resources History Sessions at ASCE Civil Engineering Conference and Exposition, Washington, DC, USA, 3–7 November 2002; Rogers, J.R., Fredrich, A.J., Eds.; American Society of Civil Engineers: Reston, VA, USA, 2002; pp. 34–43. ISBN 9780784406502. [Google Scholar]
  59. Van den Berg, G.B.; Smolders, C.A. Flux decline in ultrafiltration processes. Desalination 1990, 77, 101–133. [Google Scholar] [CrossRef] [Green Version]
  60. Wijmans, J.G.; Nakao, S.; van den Berg, J.; Troelstra, F.R.; Smolders, C.A. Hydrodynamic resistance of concentration polarization boundary layers in ultrafiltration. J. Membr. Sci. 1985, 22, 117–135. [Google Scholar] [CrossRef] [Green Version]
  61. Huter, M.J.; Strube, J. Model-Based Design and Process Optimization of Continuous Single Pass Tangential Flow Filtration Focusing on Continuous Bioprocessing. Processes 2019, 7, 317. [Google Scholar] [CrossRef] [Green Version]
  62. Effio, C.L.; Hubbuch, J. Next generation vaccines and vectors: Designing downstream processes for recombinant protein-based virus-like particles. Biotechnol. J. 2015, 10, 715–727. [Google Scholar] [CrossRef] [PubMed]
  63. Ladd Effio, C.; Hahn, T.; Seiler, J.; Oelmeier, S.A.; Asen, I.; Silberer, C.; Villain, L.; Hubbuch, J. Modeling and simulation of anion-exchange membrane chromatography for purification of Sf9 insect cell-derived virus-like particles. J. Chromatogr. A 2016, 1429, 142–154. [Google Scholar] [CrossRef]
  64. McNally, D.J.; Darling, D.; Farzaneh, F.; Levison, P.R.; Slater, N.K.H. Optimised concentration and purification of retroviruses using membrane chromatography. J. Chromatogr. A 2014, 1340, 24–32. [Google Scholar] [CrossRef] [Green Version]
  65. Pereira Aguilar, P.; Reiter, K.; Wetter, V.; Steppert, P.; Maresch, D.; Ling, W.L.; Satzer, P.; Jungbauer, A. Capture and purification of Human Immunodeficiency Virus-1 virus-like particles: Convective media vs porous beads. J. Chromatogr. A 2020, 1627, 461378. [Google Scholar] [CrossRef]
  66. Pereira Aguilar, P.; Schneider, T.A.; Wetter, V.; Maresch, D.; Ling, W.L.; Tover, A.; Steppert, P.; Jungbauer, A. Polymer-grafted chromatography media for the purification of enveloped virus-like particles, exemplified with HIV-1 gag VLP. Vaccine 2019, 37, 7070–7080. [Google Scholar] [CrossRef]
  67. Steppert, P.; Burgstaller, D.; Klausberger, M.; Berger, E.; Aguilar, P.P.; Schneider, T.A.; Kramberger, P.; Tover, A.; Nöbauer, K.; Razzazi-Fazeli, E.; et al. Purification of HIV-1 gag virus-like particles and separation of other extracellular particles. J. Chromatogr. A 2016, 1455, 93–101. [Google Scholar] [CrossRef] [Green Version]
  68. Vicente, T.; Sousa, M.F.; Peixoto, C.; Mota, J.P.; Alves, P.M.; Carrondo, M.J. Anion-exchange membrane chromatography for purification of rotavirus-like particles. J. Membr. Sci. 2008, 311, 270–283. [Google Scholar] [CrossRef]
  69. Guiochon, G.; Felinger, A.; Shirazi, D.G.; Katti, A.M. Fundamentals of Preparative and Nonlinear Chromatography, 2nd ed.; Elsevier Academic Press: Cambridge, MA, USA, 2006; ISBN 9780123705372. [Google Scholar]
  70. Zobel-Roos, S.; Mouellef, M.; Ditz, R.; Strube, J. Distinct and Quantitative Validation Method for Predictive Process Modelling in Preparative Chromatography of Synthetic and Bio-Based Feed Mixtures Following a Quality-by-Design (QbD) Approach. Processes 2019, 7, 580. [Google Scholar] [CrossRef] [Green Version]
  71. Seidel-Morgenstern, A. Experimental determination of single solute and competitive adsorption isotherms. J. Chromatogr. A 2004, 1037, 255–272. [Google Scholar] [CrossRef] [PubMed]
  72. Carta, G.; Rodrigues, A.E. Diffusion and convection in chromatographic processes using permeable supports with a bidisperse pore structure. Chem. Eng. Sci. 1993, 48, 3927–3935. [Google Scholar] [CrossRef]
  73. Wilson, E.J.; Geankoplis, C.J. Liquid Mass Transfer at Very Low Reynolds Numbers in Packed Beds. Ind. Eng. Chem. Fund. 1966, 5, 9–14. [Google Scholar] [CrossRef]
  74. Leśko, M.; Åsberg, D.; Enmark, M.; Samuelsson, J.; Fornstedt, T.; Kaczmarski, K. Choice of Model for Estimation of Adsorption Isotherm Parameters in Gradient Elution Preparative Liquid Chromatography. Chromatographia 2015, 78, 1293–1297. [Google Scholar] [CrossRef] [PubMed] [Green Version]
  75. Klepzig, L.S.; Juckers, A.; Knerr, P.; Harms, F.; Strube, J. Digital Twin for Lyophilization by Process Modeling in Manufacturing of Biologics. Processes 2020, 8, 1325. [Google Scholar] [CrossRef]
  76. Juckers, A.; Knerr, P.; Harms, F.; Strube, J. Advanced Process Analytical Technology in Combination with Process Modeling for Endpoint and Model Parameter Determination in Lyophilization Process Design and Optimization. Processes 2021, 9, 1600. [Google Scholar] [CrossRef]
  77. Martin Christ Gefriertrocknungsanlagen Gmbh. Pilot-Gefriertrocknungsanlagen Innovative Technologie. Available online: https://www.martinchrist.de/fileadmin/user_upload/christ/PDF/Broschueren/Pilot/Christ_Pilot_GT_dt_2021-08.pdf (accessed on 22 February 2022).
  78. Rambhatla, S.; Pikal, M.J. Heat and mass transfer scale-up issues during freeze-drying, I: Atypical radiation and the edge vial effect. AAPS PharmSciTech 2003, 4, E14. [Google Scholar] [CrossRef] [Green Version]
  79. Lang, R.; Winter, G.; Vogt, L.; Zurcher, A.; Dorigo, B.; Schimmele, B. Rational design of a stable, freeze-dried virus-like particle-based vaccine formulation. Drug Dev. Ind. Pharm. 2009, 35, 83–97. [Google Scholar] [CrossRef]
  80. Helgers, H.; Schmidt, A.; Lohmann, L.J.; Vetter, F.L.; Juckers, A.; Jensch, C.; Mouellef, M.; Zobel-Roos, S.; Strube, J. Towards Autonomous Operation by Advanced Process Control—Process Analytical Technology for Continuous Biologics Antibody Manufacturing. Processes 2021, 9, 172. [Google Scholar] [CrossRef]
  81. Helgers, H.; Schmidt, A.; Strube, J. Towards Autonomous Process Control—Digital Twin for CHO Cell-Based Antibody Manufacturing Using a Dynamic Metabolic Model. Processes 2022, 10, 316. [Google Scholar] [CrossRef]
  82. Matthews, T.E.; Berry, B.N.; Smelko, J.; Moretto, J.; Moore, B.; Wiltberger, K. Closed loop control of lactate concentration in mammalian cell culture by Raman spectroscopy leads to improved cell density, viability, and biopharmaceutical protein production. Biotechnol. Bioeng. 2016, 113, 2416–2424. [Google Scholar] [CrossRef] [PubMed]
  83. Santos, R.M.; Kessler, J.-M.; Salou, P.; Menezes, J.C.; Peinado, A. Monitoring mAb cultivations with in-situ raman spectroscopy: The influence of spectral selectivity on calibration models and industrial use as reliable PAT tool. Biotechnol. Prog. 2018, 34, 659–670. [Google Scholar] [CrossRef] [PubMed]
  84. Van Reis, R.; Zydney, A. Bioprocess membrane technology. J. Membr. Sci. 2007, 297, 16–50. [Google Scholar] [CrossRef]
  85. Taylor, N.; Ma, W.; Kristopeit, A.; Wang, S.-C.; Zydney, A.L. Enhancing the performance of sterile filtration for viral vaccines and model nanoparticles using an appropriate prefilter. J. Membr. Sci. 2022, 647, 120264. [Google Scholar] [CrossRef]
  86. Dryden, W.A.; Larsen, L.M.; Britt, D.W.; Smith, M.T. Technical and economic considerations of cell culture harvest and clarification technologies. Biochem. Eng. J. 2021, 167, 107892. [Google Scholar] [CrossRef]
  87. Negrete, A.; Pai, A.; Shiloach, J. Use of hollow fiber tangential flow filtration for the recovery and concentration of HIV virus-like particles produced in insect cells. J. Virol. Methods 2014, 195, 240–246. [Google Scholar] [CrossRef]
  88. Loewe, D.; Häussler, J.; Grein, T.A.; Dieken, H.; Weidner, T.; Salzig, D.; Czermak, P. Forced Degradation Studies to Identify Critical Process Parameters for the Purification of Infectious Measles Virus. Viruses 2019, 11, 725. [Google Scholar] [CrossRef] [Green Version]
  89. Bayer, B.; Dalmau Diaz, R.; Melcher, M.; Striedner, G.; Duerkop, M. Digital Twin Application for Model-Based DoE to Rapidly Identify Ideal Process Conditions for Space-Time Yield Optimization. Processes 2021, 9, 1109. [Google Scholar] [CrossRef]
  90. Chopda, V.; Gyorgypal, A.; Yang, O.; Singh, R.; Ramachandran, R.; Zhang, H.; Tsilomelekis, G.; Chundawat, S.P.S.; Ierapetritou, M.G. Recent advances in integrated process analytical techniques, modeling, and control strategies to enable continuous biomanufacturing of monoclonal antibodies. J. Chem. Technol. Biotechnol. 2021. [Google Scholar] [CrossRef]
  91. Walther, J.; Godawat, R.; Hwang, C.; Abe, Y.; Sinclair, A.; Konstantinov, K. The business impact of an integrated continuous biomanufacturing platform for recombinant protein production. J. Biotechnol. 2015, 213, 3–12. [Google Scholar] [CrossRef]
  92. Aristoteleio Panepistēmio Thessalonikēs; Associazione Italiana di Ingegneria Chimica. In Proceedings of the PRES’13: 16th Conference on Process Integration, Modelling and Optimisation for Energy Saving and Pollution Reduction, Rhodes, Greece, 29 September–2 October 2013; AIDIC: Milano, Italy, 2013. ISBN 9788895608266.
  93. Andersen, T.M.; Toftegaard, O. CIP Technology. In Challenges and Trends; MORK Process Inc.: Copenhagen, Denmark, 2010. [Google Scholar]
  94. Roy, K.; Undey, C.; Mistretta, T.; Naugle, G.; Sodhi, M. Multivariate statistical monitoring as applied to clean-in-place (CIP) and steam-in-place (SIP) operations in biopharmaceutical manufacturing. Biotechnol. Prog. 2014, 30, 505–515. [Google Scholar] [CrossRef] [PubMed]
  95. Schmidt, A.; Uhlenbrock, L.; Strube, J. Technical Potential for Energy and GWP Reduction in Chemical–Pharmaceutical Industry in Germany and EU—Focused on Biologics and Botanicals Manufacturing. Processes 2020, 8, 818. [Google Scholar] [CrossRef]
  96. Dakin, J. Supply Chain Challenges Creating Hurdles to COVID-19 Vaccine Production No. 4. 2021. Available online: https://www.pharmtech.com/view/supply-chain-challenges-creating-hurdles-to-covid-19-vaccine-production (accessed on 7 March 2022).
  97. Badman, C.; Cooney, C.L.; Florence, A.; Konstantinov, K.; Krumme, M.; Mascia, S.; Nasr, M.; Trout, B.L. Why We Need Continuous Pharmaceutical Manufacturing and How to Make It Happen. J. Pharm. Sci. 2019, 108, 3521–3523. [Google Scholar] [CrossRef] [PubMed]
  98. Deng, F. Advances and challenges in enveloped virus-like particle (VLP)-based vaccines. J. Immunol. Sci. 2018, 2, 36–41. [Google Scholar] [CrossRef] [Green Version]
Figure 1. Levels of a digital twin, starting from a steady-state model to a dynamic model, a validated model, and a digital shadow to a model-based control.
Processes 10 00866 g001
Figure 2. Workflow of model validation based on a QbD-oriented approach. In the first step, the QTPPs are defined. Subsequently, the CQAs are defined and a risk assessment of the influence of various process parameters on the CQAs is carried out. The risk assessment results in a design space for the process parameters to be investigated, which can be examined either via experiments or by means of a rigorous process model. Based on the results, a control strategy is defined, which can be continuously compared online via PAT with the actual state of the system. The strict implementation of this strategy allows continuous process optimization.
Processes 10 00866 g002
Figure 3. Process flow diagram showing the production and subsequent three-step purification of HIV-gag VLPs. Capture is achieved by depth filtration, ultrafiltration/diafiltration (UF/DF) is used for concentration and initial purification, anion exchange chromatography is used for further purification and concentration, and lyophilization is used for the formulation of HIV-gag VLPs.
Processes 10 00866 g003
Figure 4. Concentration profiles of viable cell concentration (a), glucose (GLC) and lactate (LAC) concentration (b), glutamine concentration (c), and relative product concentration (d). Experimental results are shown as data points; simulation results are shown as lines. In plot (d), experimental data were only available in the last five days of cultivation since the VLP concentration was below the detection limit before then.
Processes 10 00866 g004aProcesses 10 00866 g004b
Figure 5. Characterization of blocking mechanism during constant flux direct (not pre-clarified) depth filtration of FB4 (Millistak® + D0HC) by linear regression. Regression results of standard (a), intermediate (b), and composite media models (c). Black squares represent the experimental pressure values.
Processes 10 00866 g005aProcesses 10 00866 g005b
Figure 6. Increase in pressure over filter capacity during constant flux direct (not pre-clarified) depth filtration of FB4 (a) and FB5 (b) as well as of pre-clarified feed PC1 (c) and PC2 (d). Experimental pressure values (black squares) are compared with the modeling of standard blocking (red lines), intermediate blocking (blue lines), and composite media models (green lines). The dashed lines indicate the maximum/minimum deviation resulting from Monte Carlo simulation studies.
Processes 10 00866 g006
Figure 7. Data points used for the regression to determine the blocking constant and the modeling via the standard blocking model resulting from the parameter determination.
Processes 10 00866 g007
Figure 8. Flux Jv over time for experimental (squares) as well as digital twin prediction (red area) for ultrafiltration/diafiltration experiments and concentration factor 3. (a) Experiment 2 (EXP2): 1.5 bar transmembrane pressure (TMP), 3738 s−1 shear rate. (b) Experiment 3 (EXP3): 1.5 bar TMP, 1249 s−1 shear rate. (c) Experiment7 (EXP7): 0.5 bar TMP, 3738 s−1 shear rate.
Processes 10 00866 g008aProcesses 10 00866 g008b
Figure 9. Flux Jv over time for experimental (squares) as well as digital twin prediction (red area) for ultrafiltration/diafiltration experiments and concentration factor 7. (a) Experiment 1 (EXP1): 1.5 bar transmembrane pressure (TMP), 3738 s−1 shear rate. (b) Experiment 5 (EXP5): 0.5 bar TMP, 3738 s−1 shear rate. (c) Experiment 6 (EXP6): 0.5 bar TMP, 1249 s−1 shear rate. (d) Experiment 8 (EXP8): 1.5 bar TMP, 1249 s−1 shear rate.
Processes 10 00866 g009
Figure 10. Results of the parameter determination (a). Dashed lines are the experimental results; solid lines are the digital twin results. In (b), the results for a potential optimized and scaled-up capture step are given.
Processes 10 00866 g010
Figure 11. Shelf and product temperature profiles.
Processes 10 00866 g011
Figure 12. Process flowsheet including APC by digital twins and optimized PAT. Critical Process Parameter (CPP), Well-Controlled Critical Process Parameter (WC-CPP), Key Process Attribute (KPA), particle size distribution (PSD), Viable Cell Density (VCD), transmembrane pressure (TMP), virus-like particle (VLP).
Processes 10 00866 g012
Figure 13. Optimized process schedule enabled by PAT for APC and DT (a) vs. conventional process schedule based on offline analytics (b).
Processes 10 00866 g013
Table 1. Resulting parameters for the modeling of the harvest via depth filtration.
R0 (m−1)KS (m−1)KI (m−1)KCM (m−1)
FB42.4 × 101133.7 ± 0.0164.2 ± 0.1327.5 ± 0.02
FB52.3 × 101127.9 ± 0.0153.5 ± 0.1222.9 ± 0.02
PC16.0 × 10107.0 ± 0.00118.8 ± 0.016.3 ± 0.001
PC26.0 × 101010.2 ± 0.00330.2 ± 0.019.3 ± 0.004
Publisher’s Note: MDPI stays neutral with regard to jurisdictional claims in published maps and institutional affiliations.

