
Digital Twins for scFv Production in Escherichia coli

 ,
,  ,
,  and
and 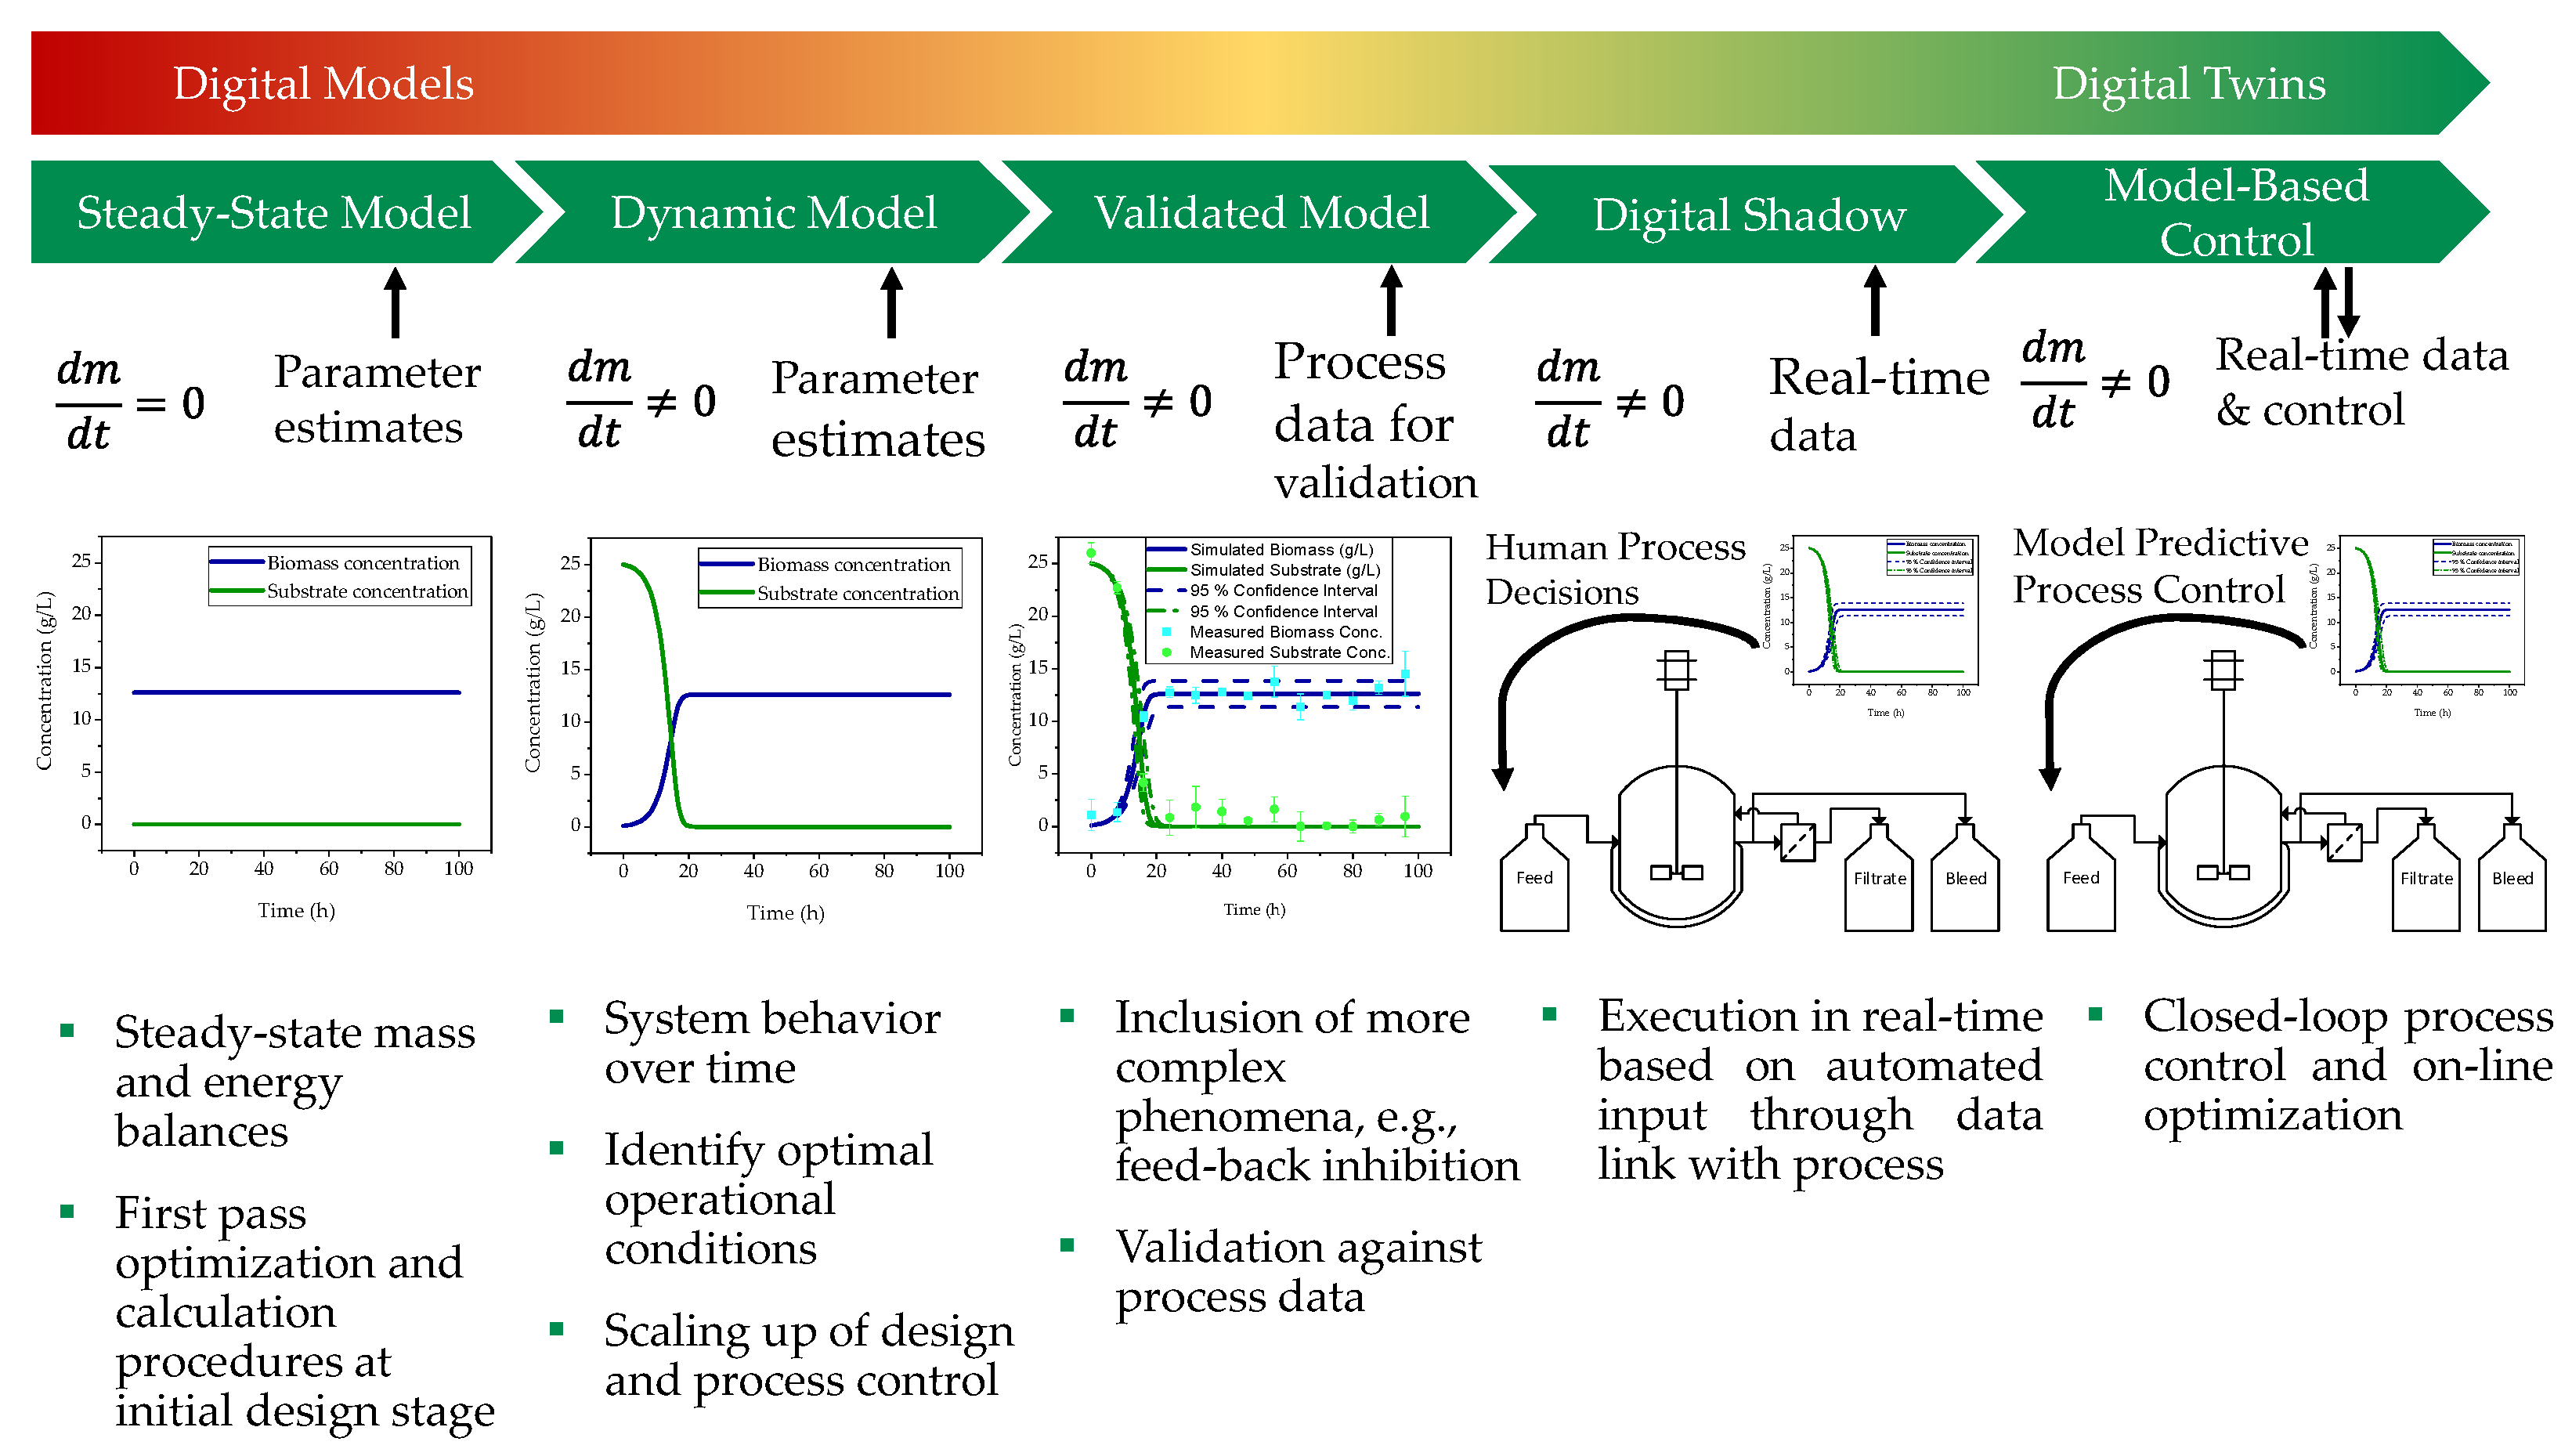
Abstract
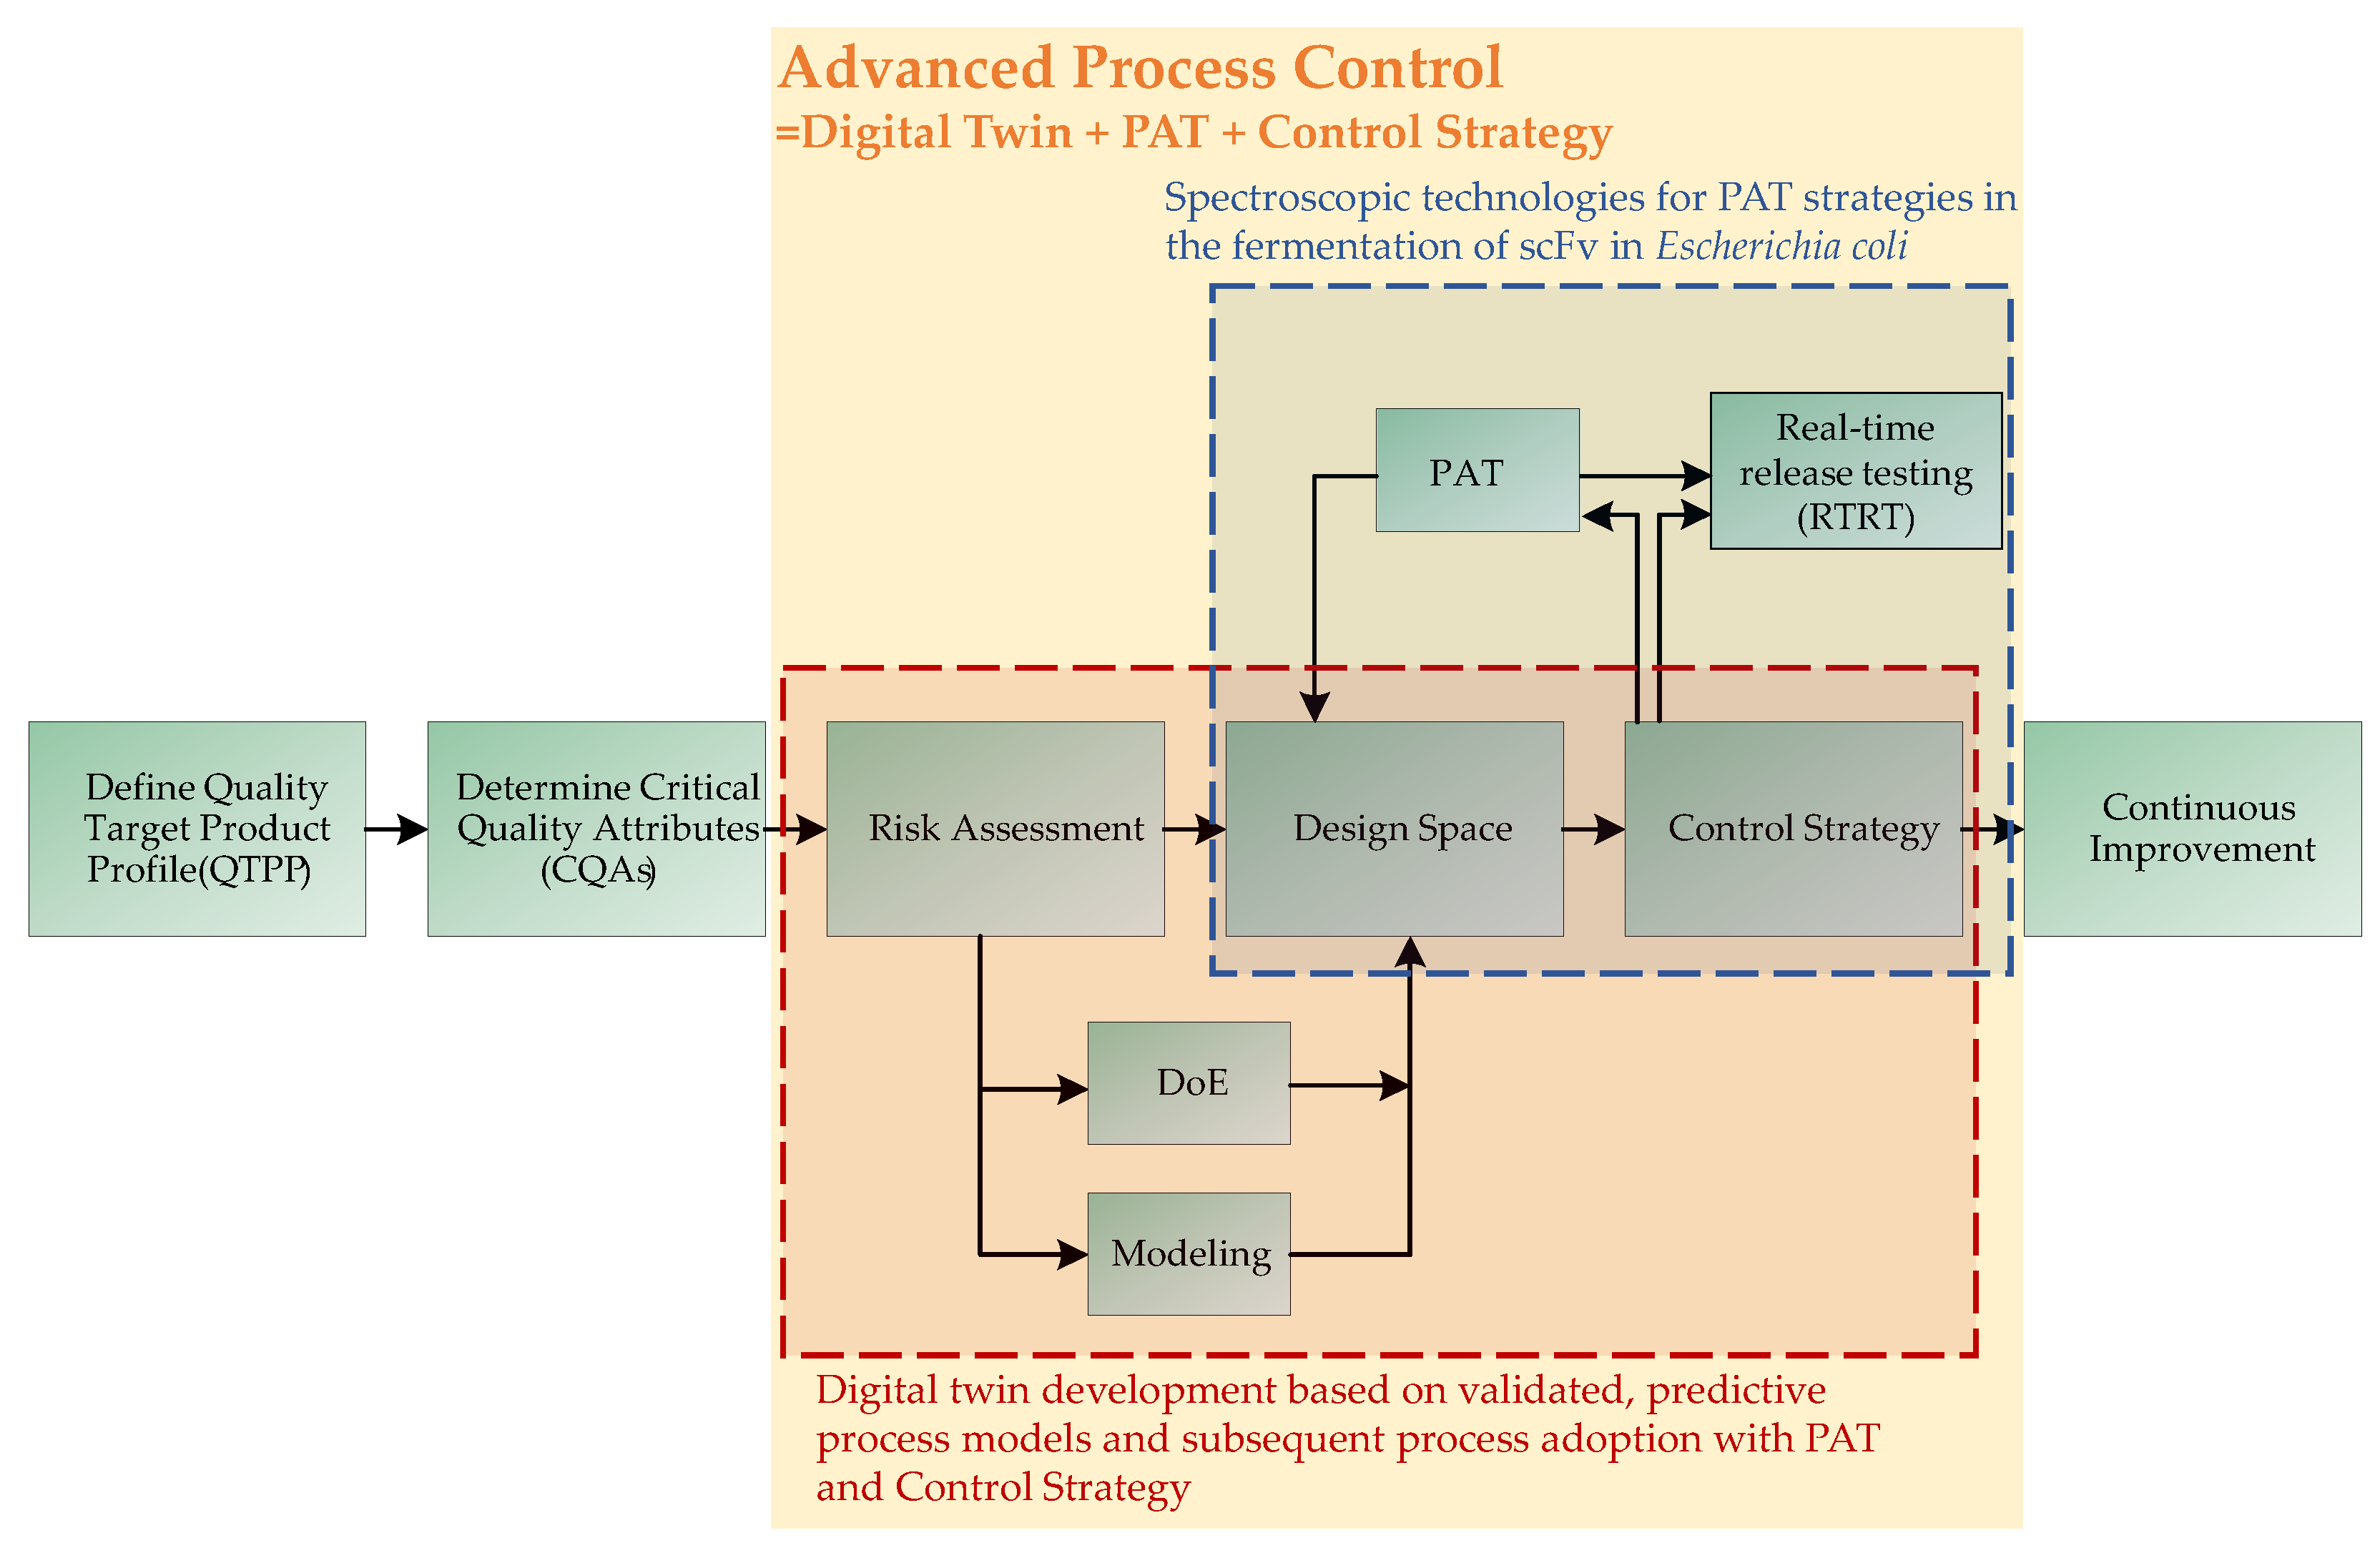
:1. Introduction
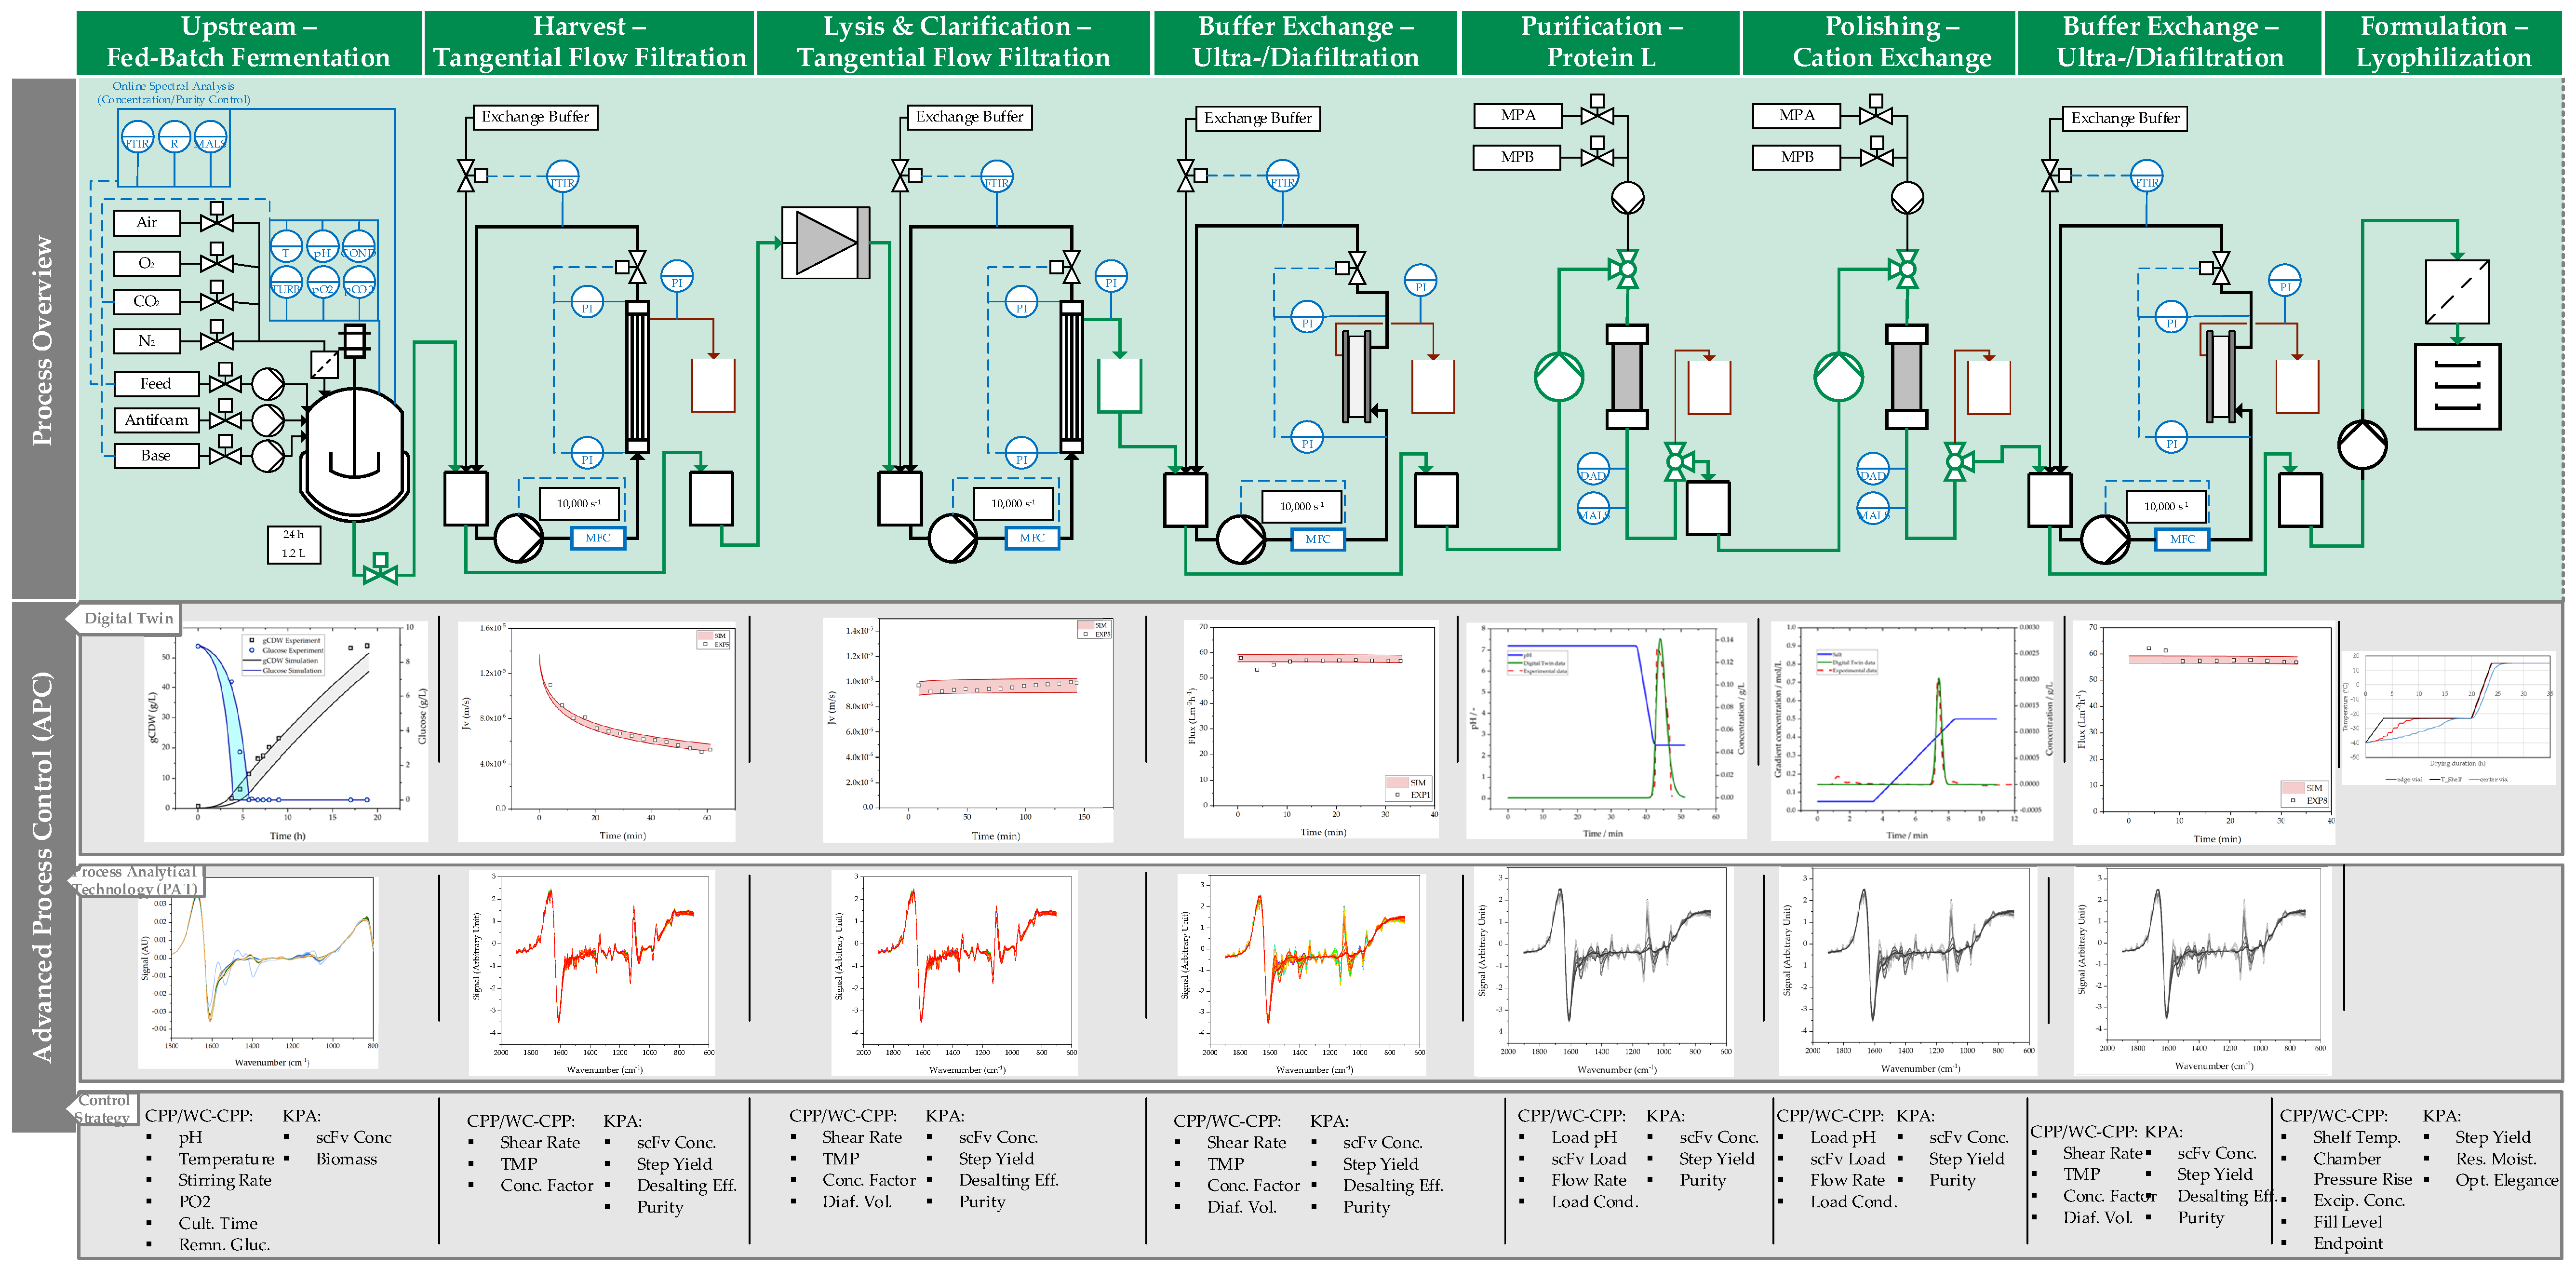
2. Materials and Methods
2.1. Fed-Batch Fermentation
2.2. Ultrafiltration/Diafiltration
2.3. Chromatography
2.4. Lyophilization
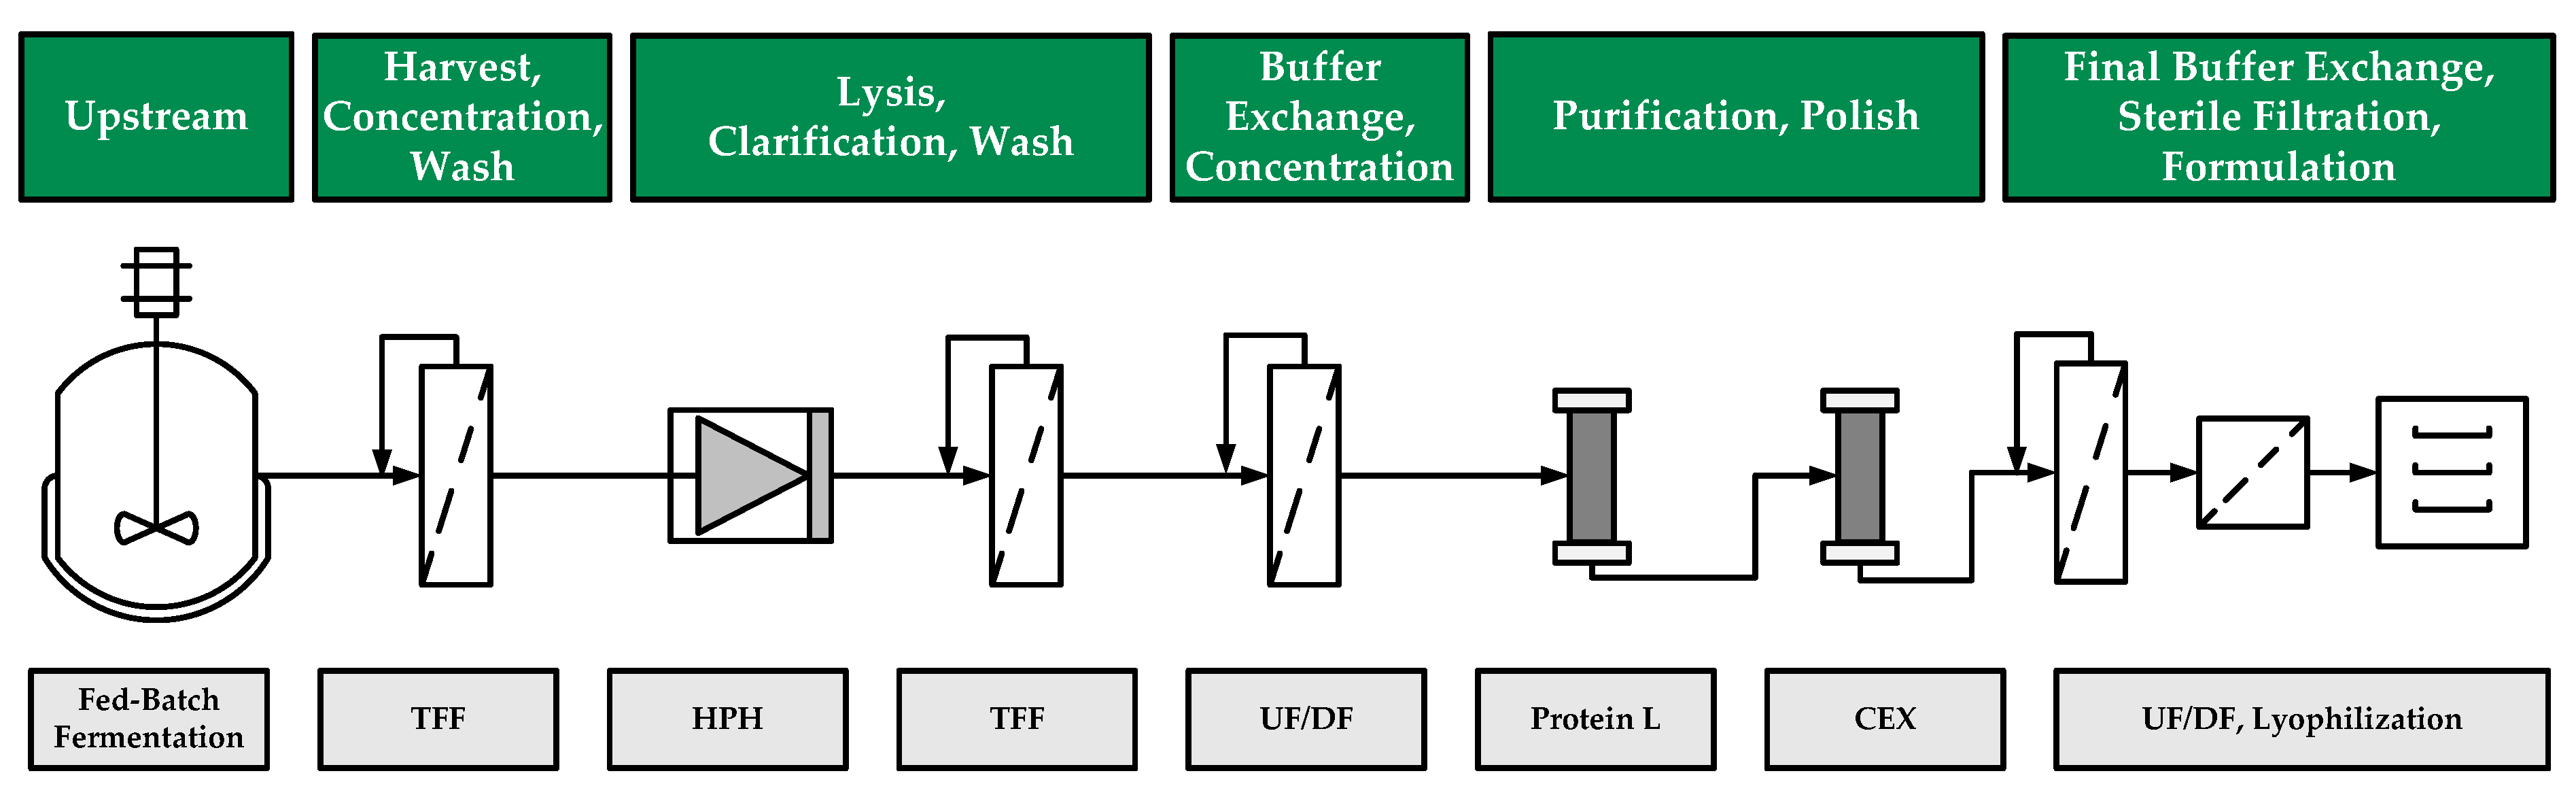
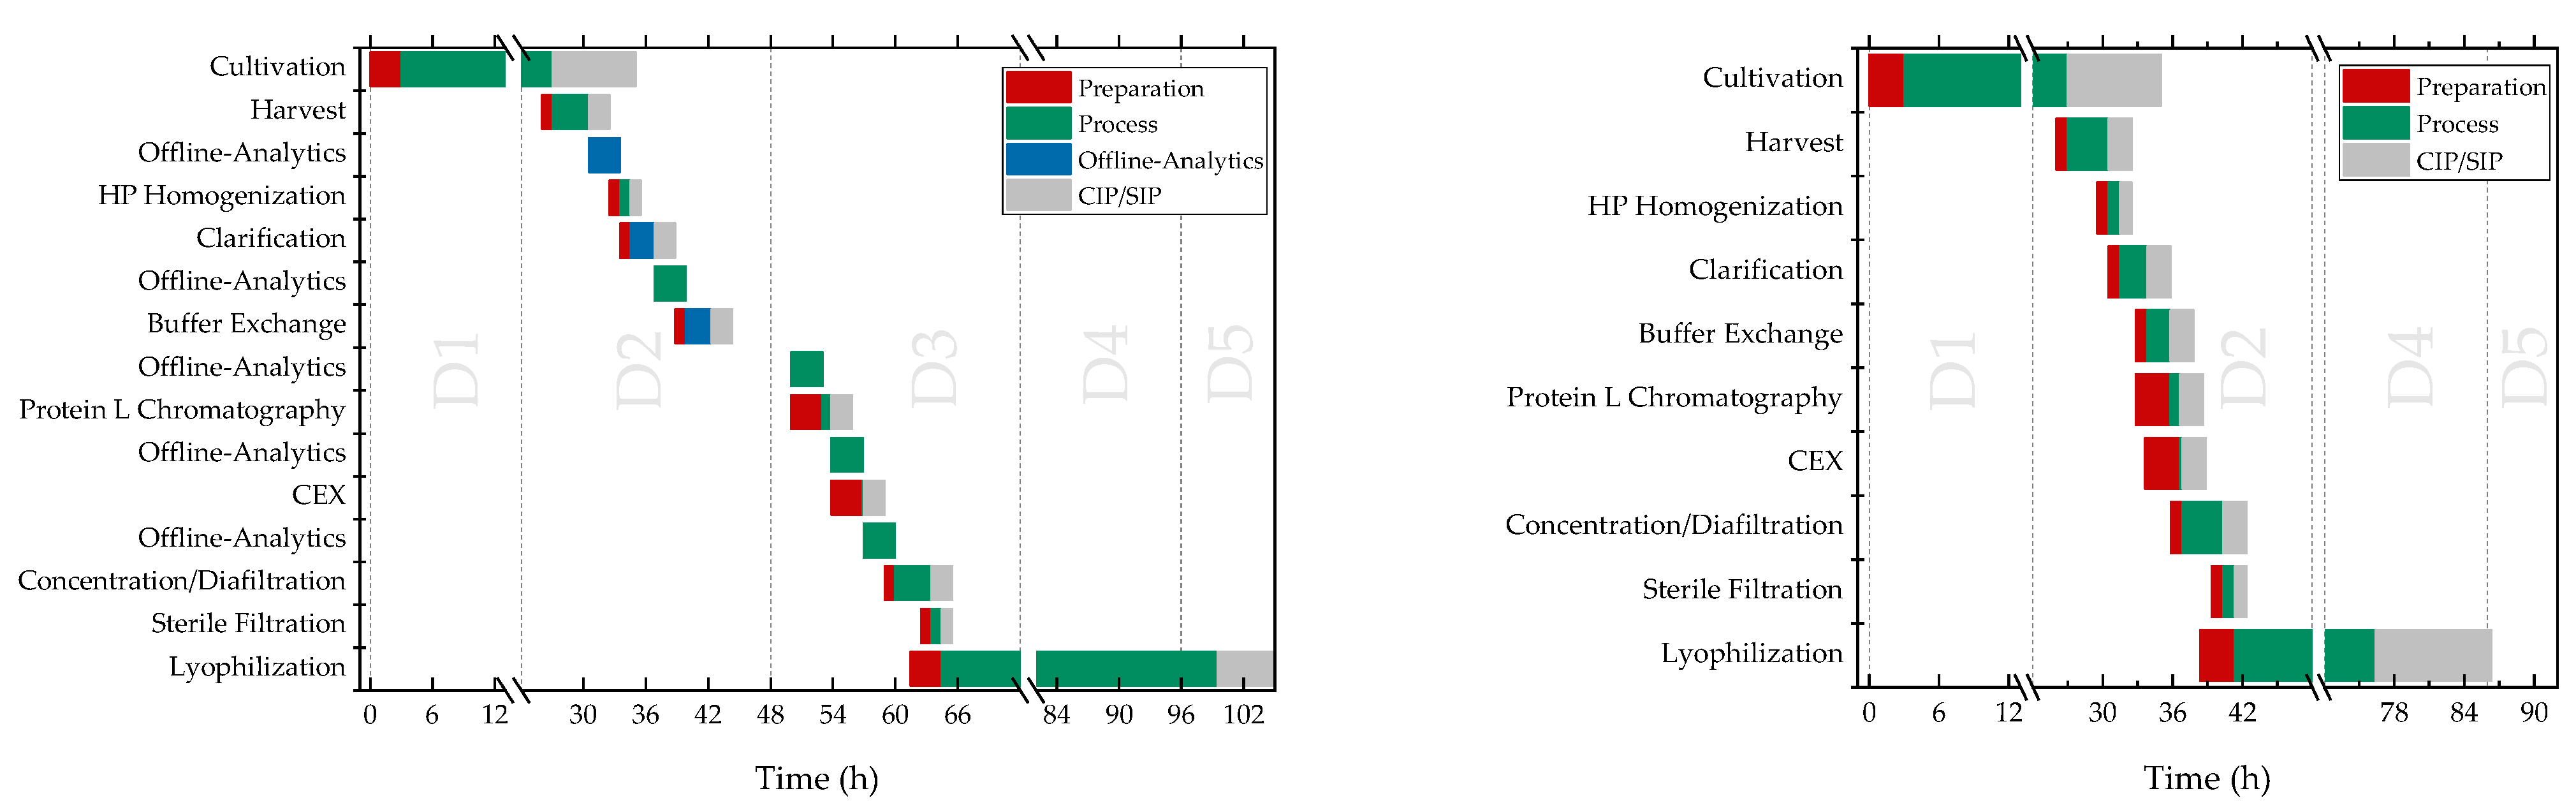
3. Results
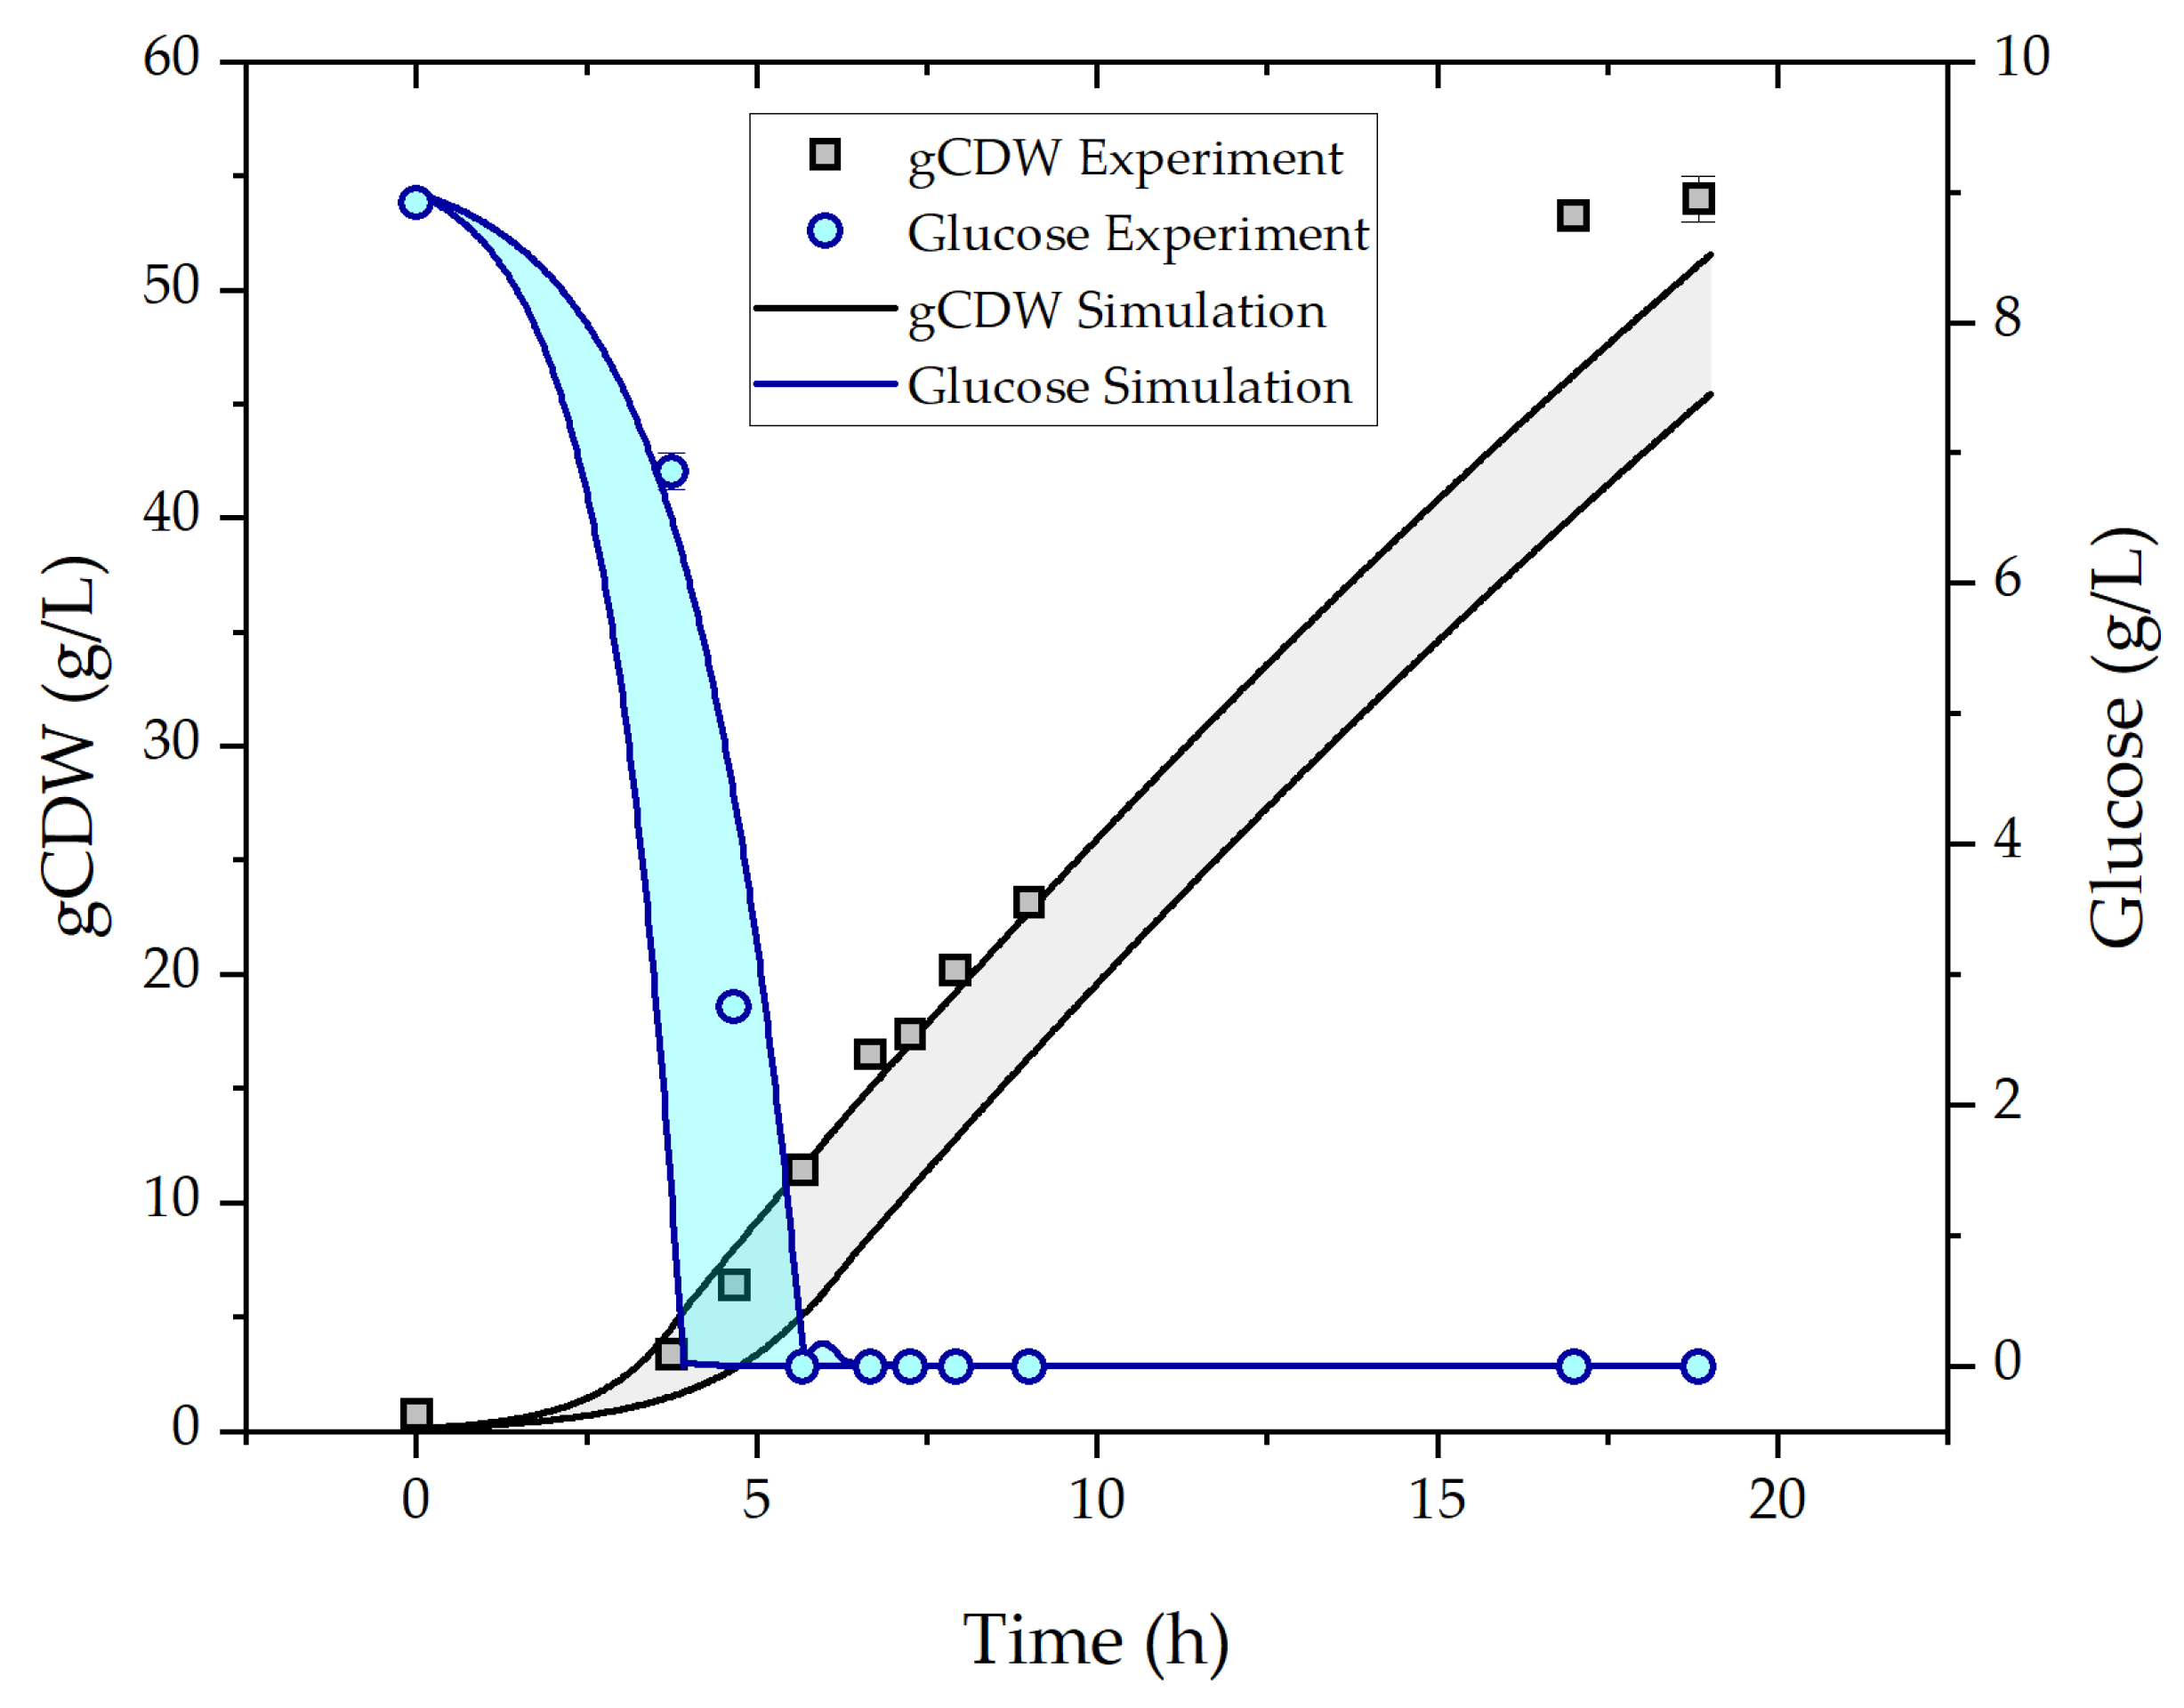
3.1. Fed-Batch Fermentation
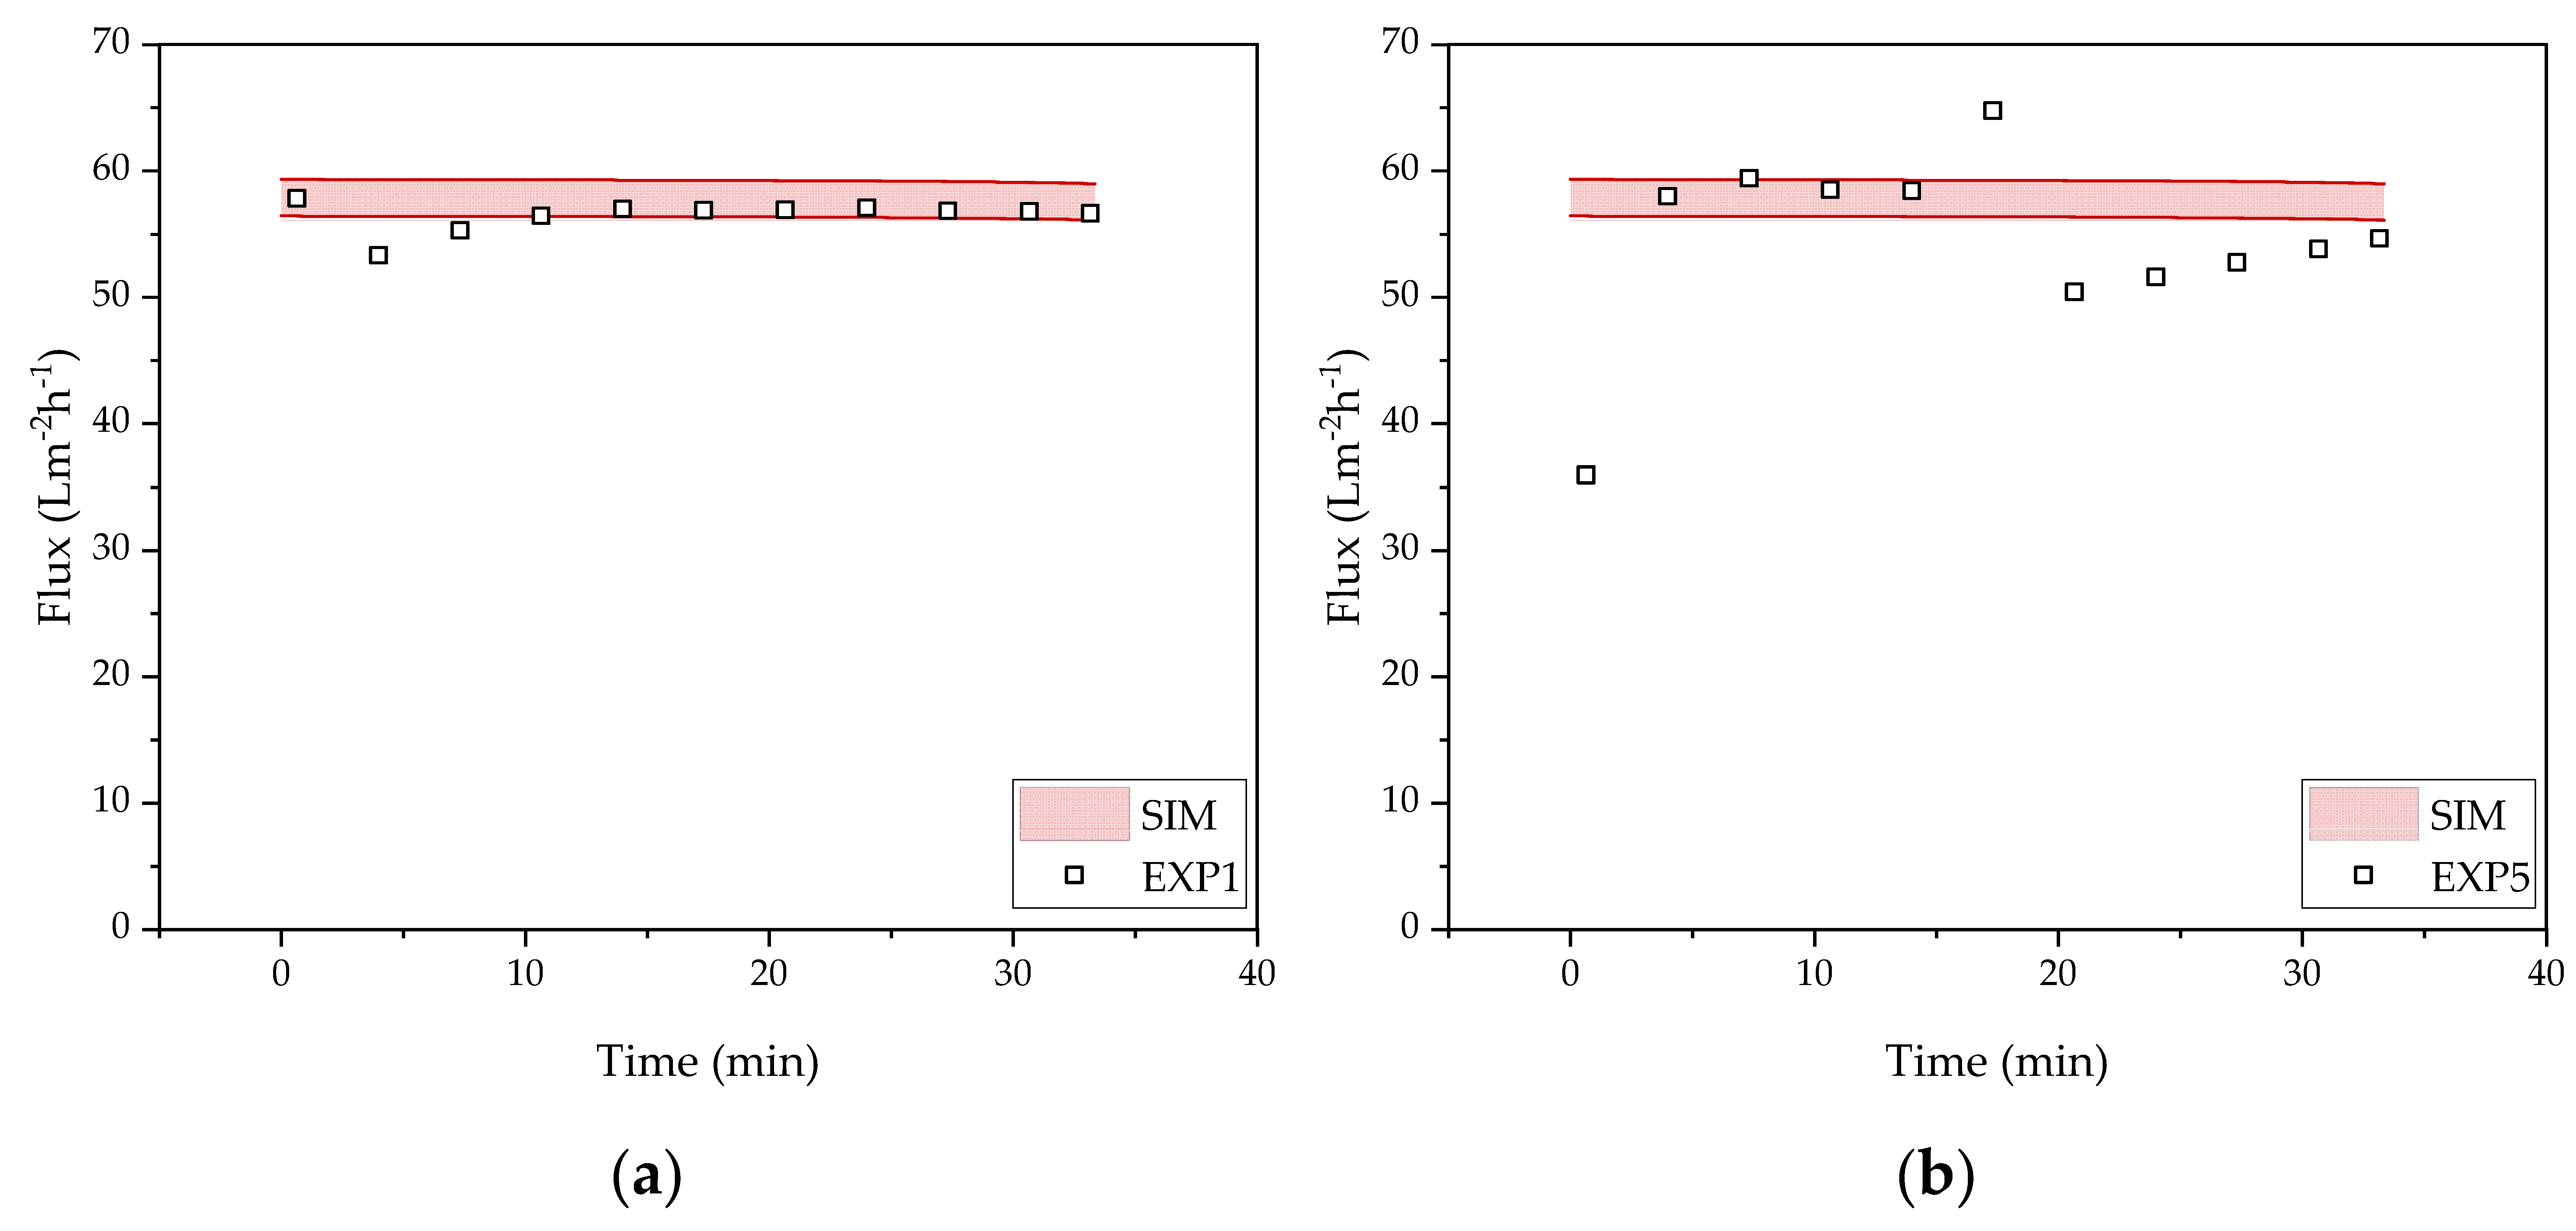
3.2. Harvest by UFDF
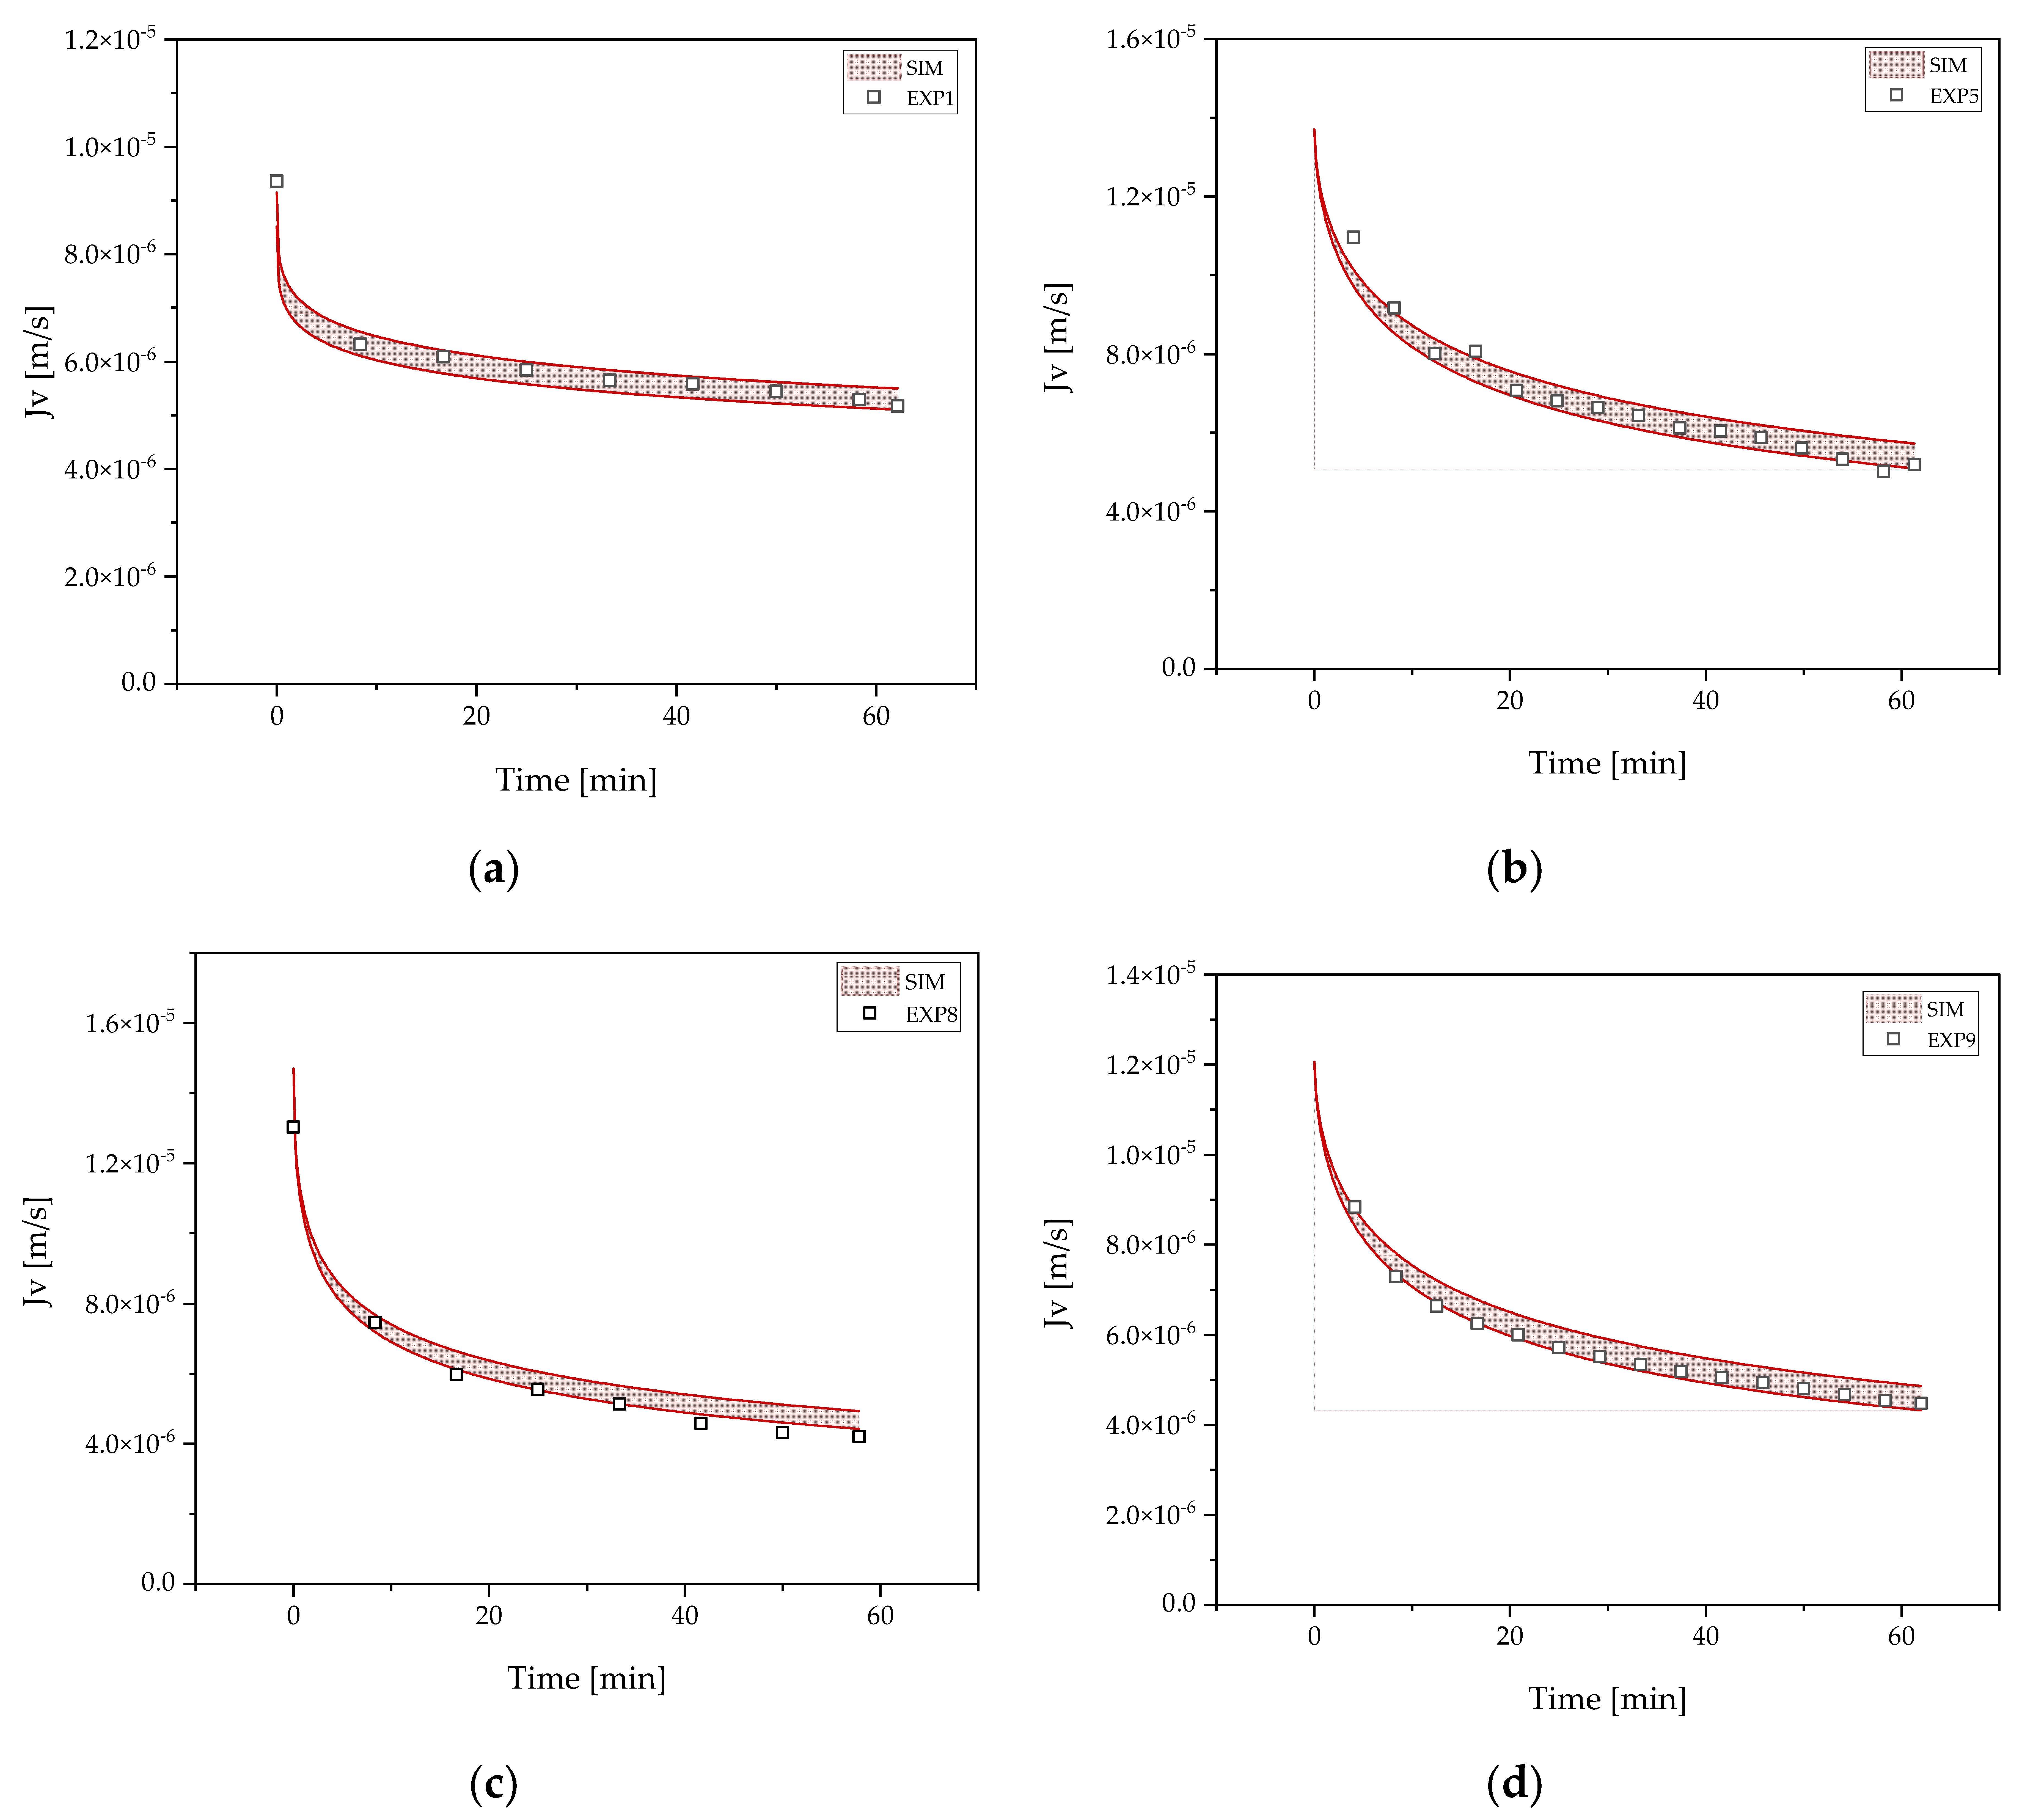
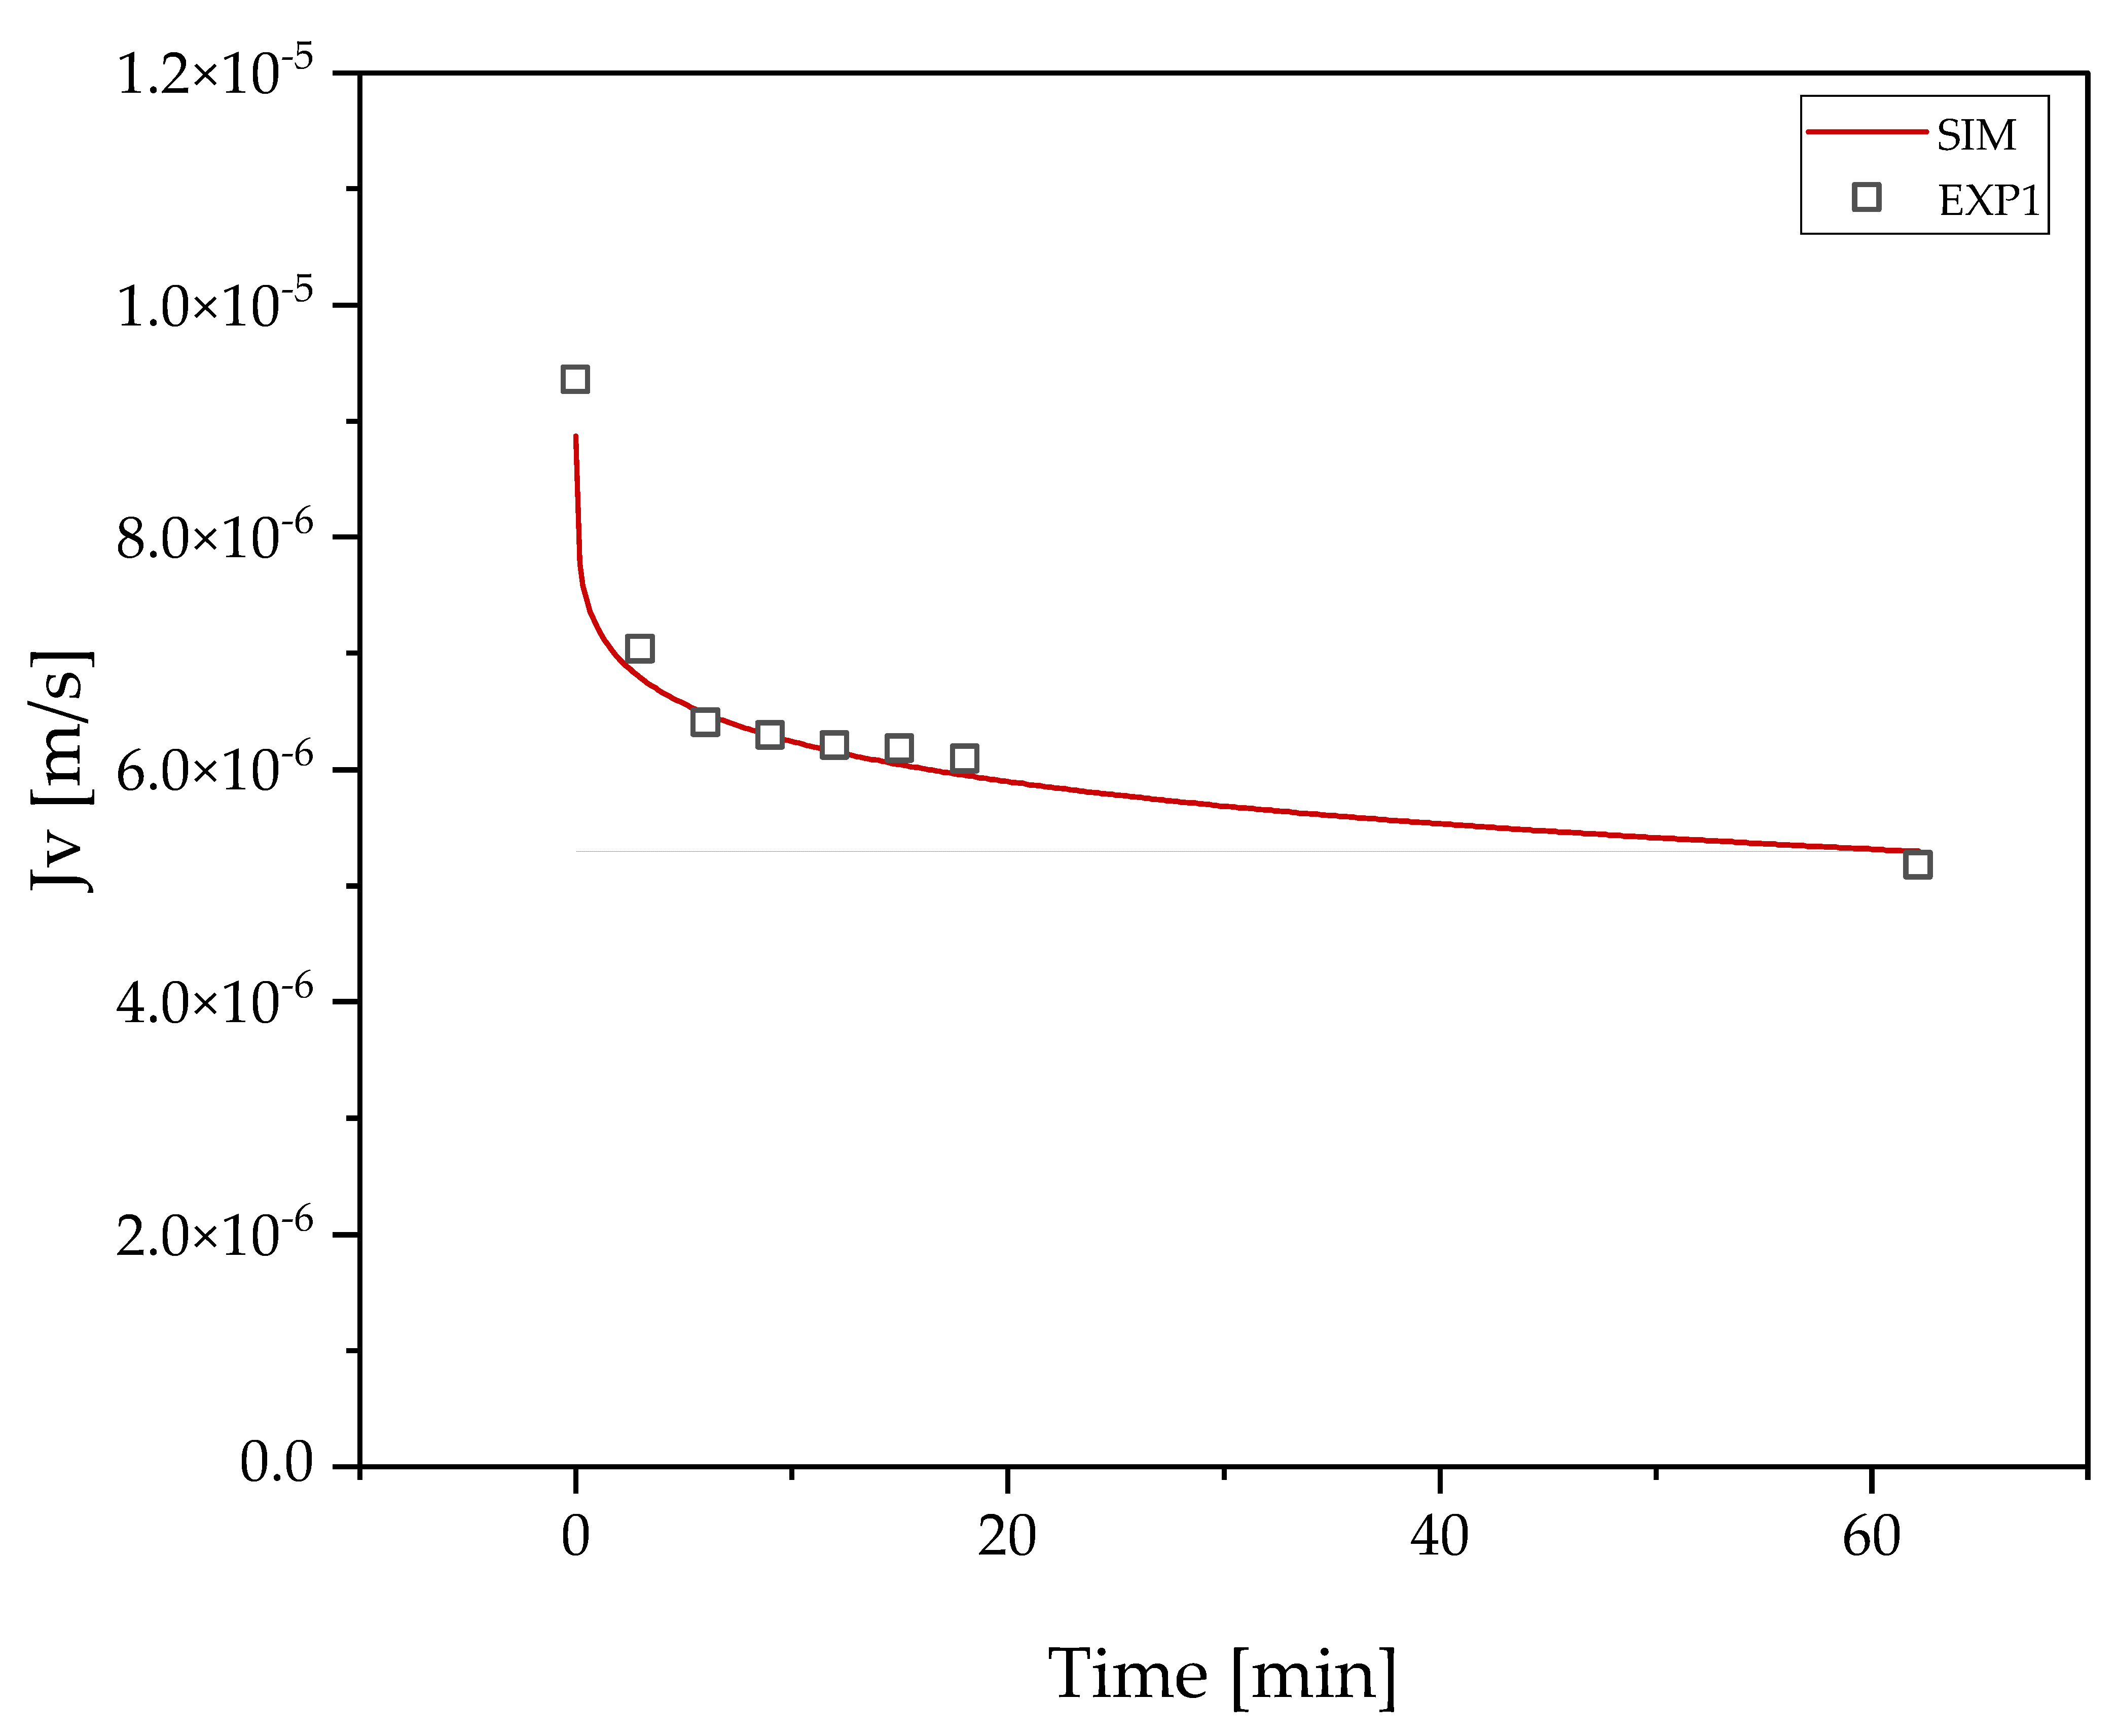
3.3. Clarification by UFDF
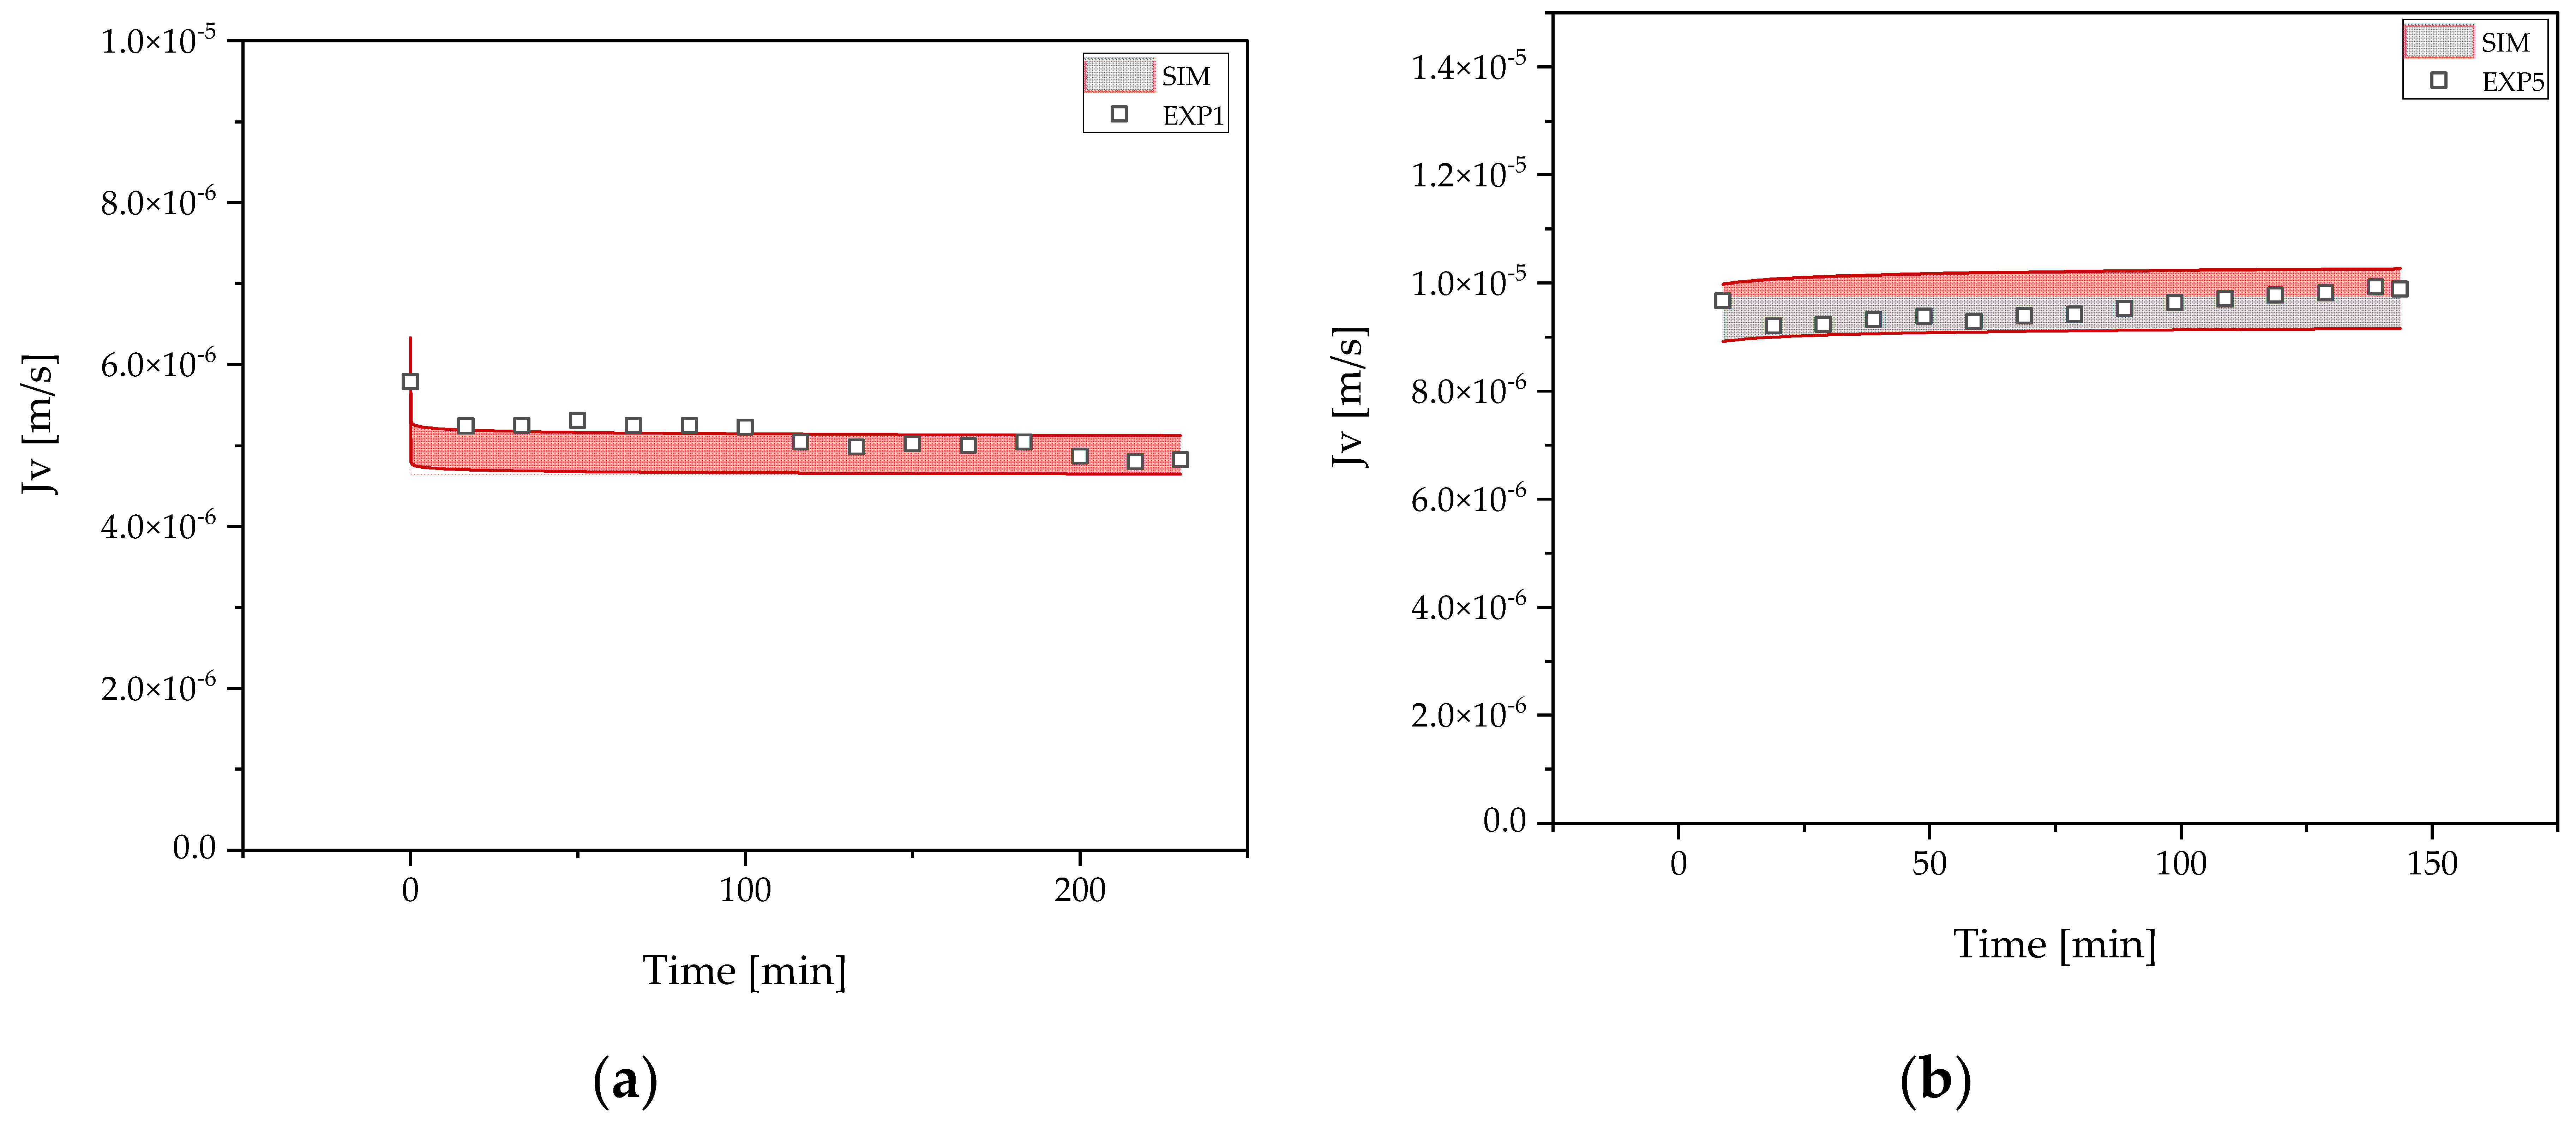
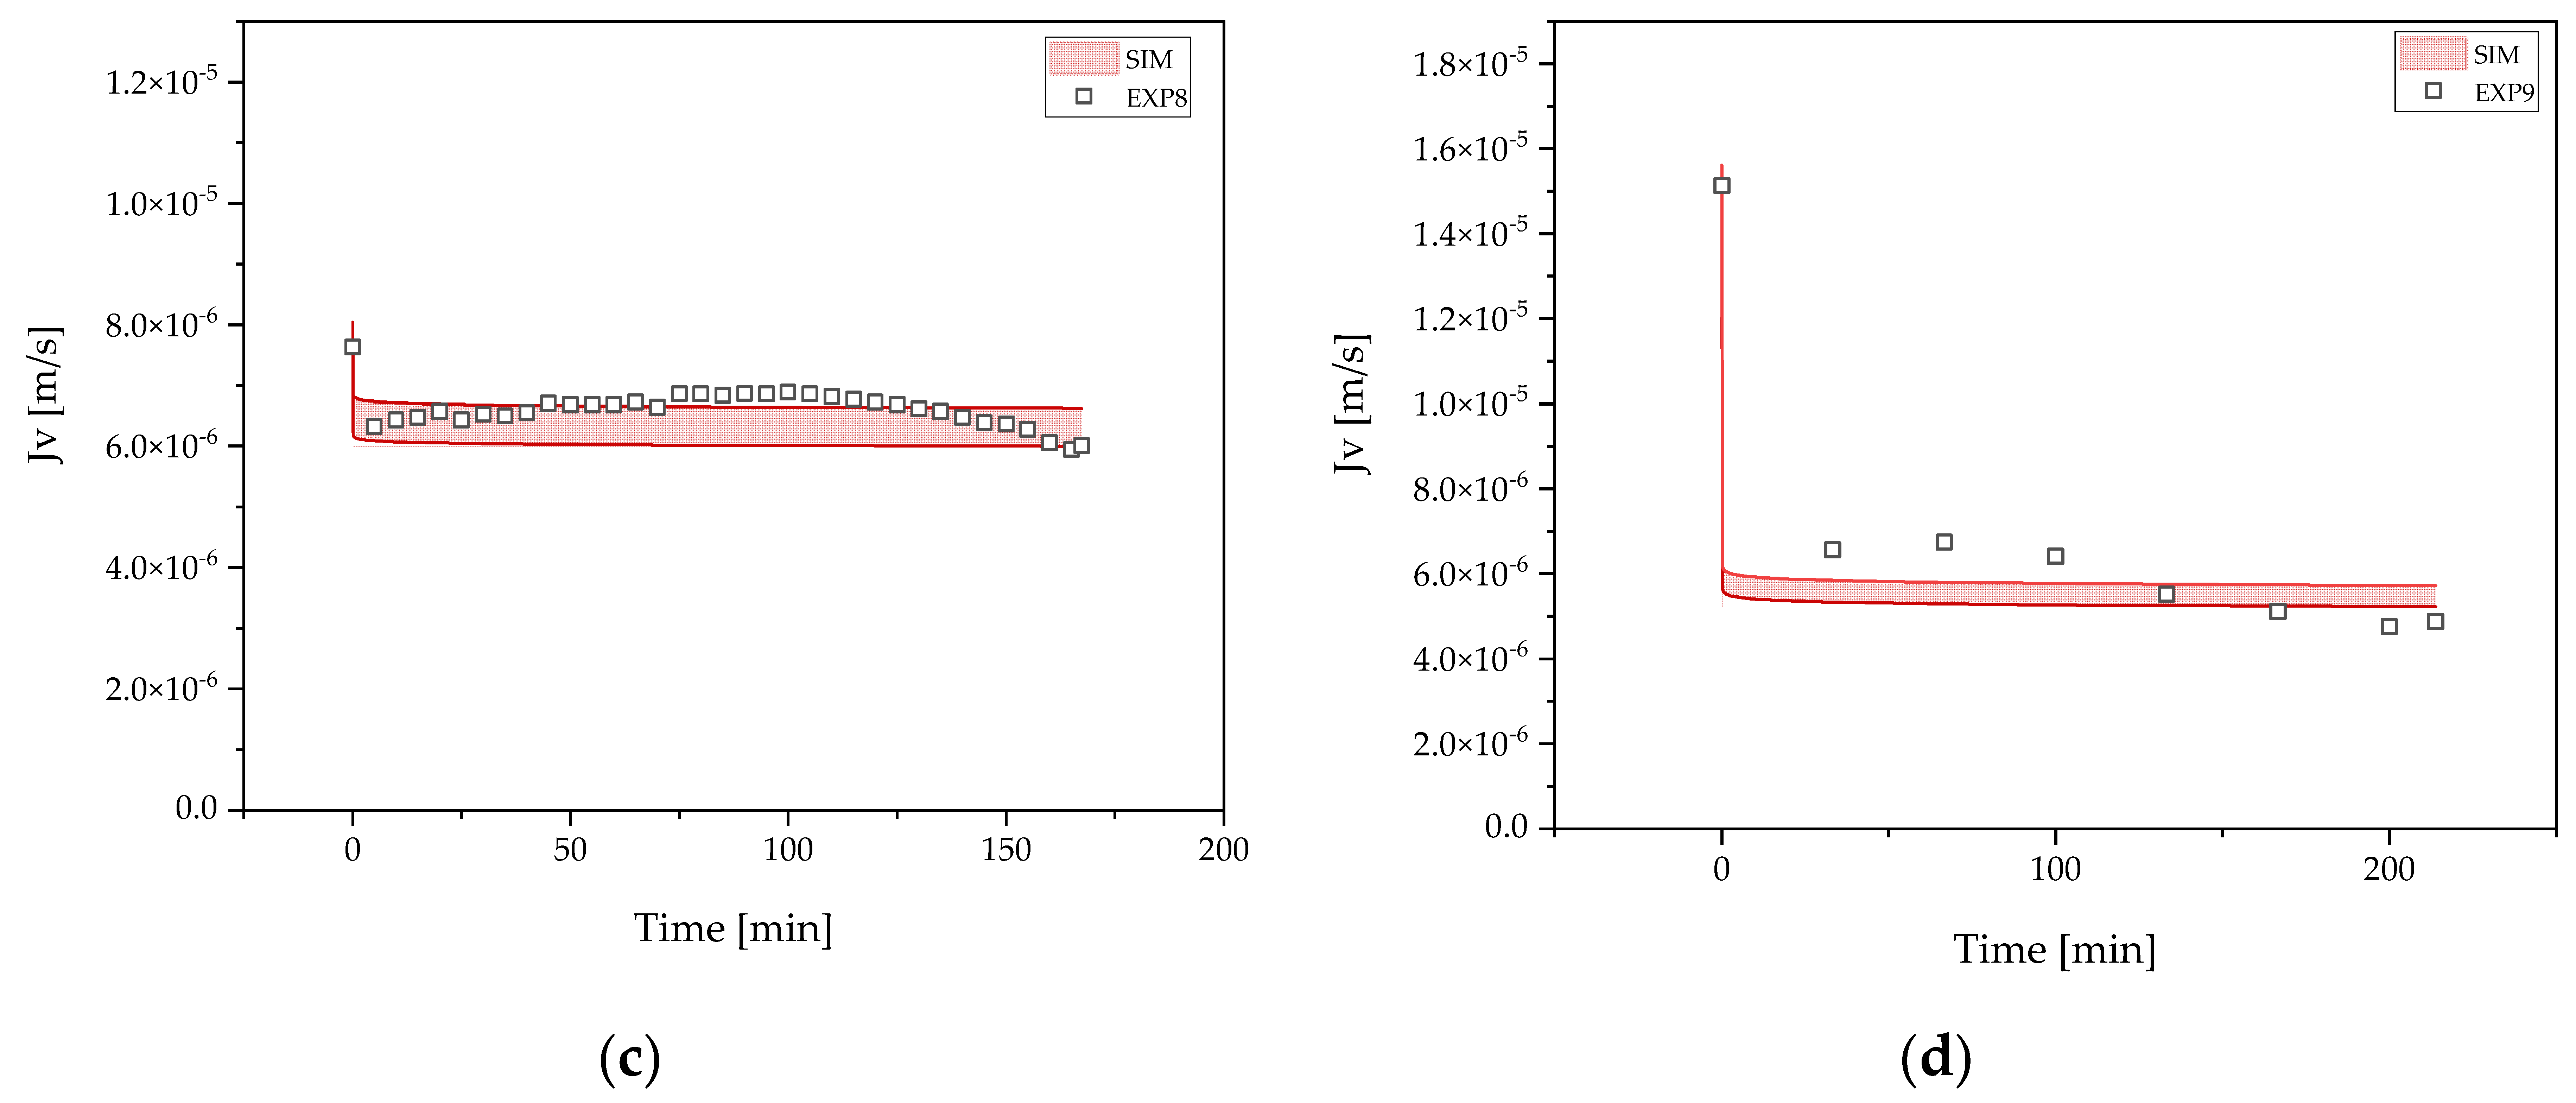
3.4. Concentration and Buffer Exchange by UFDF
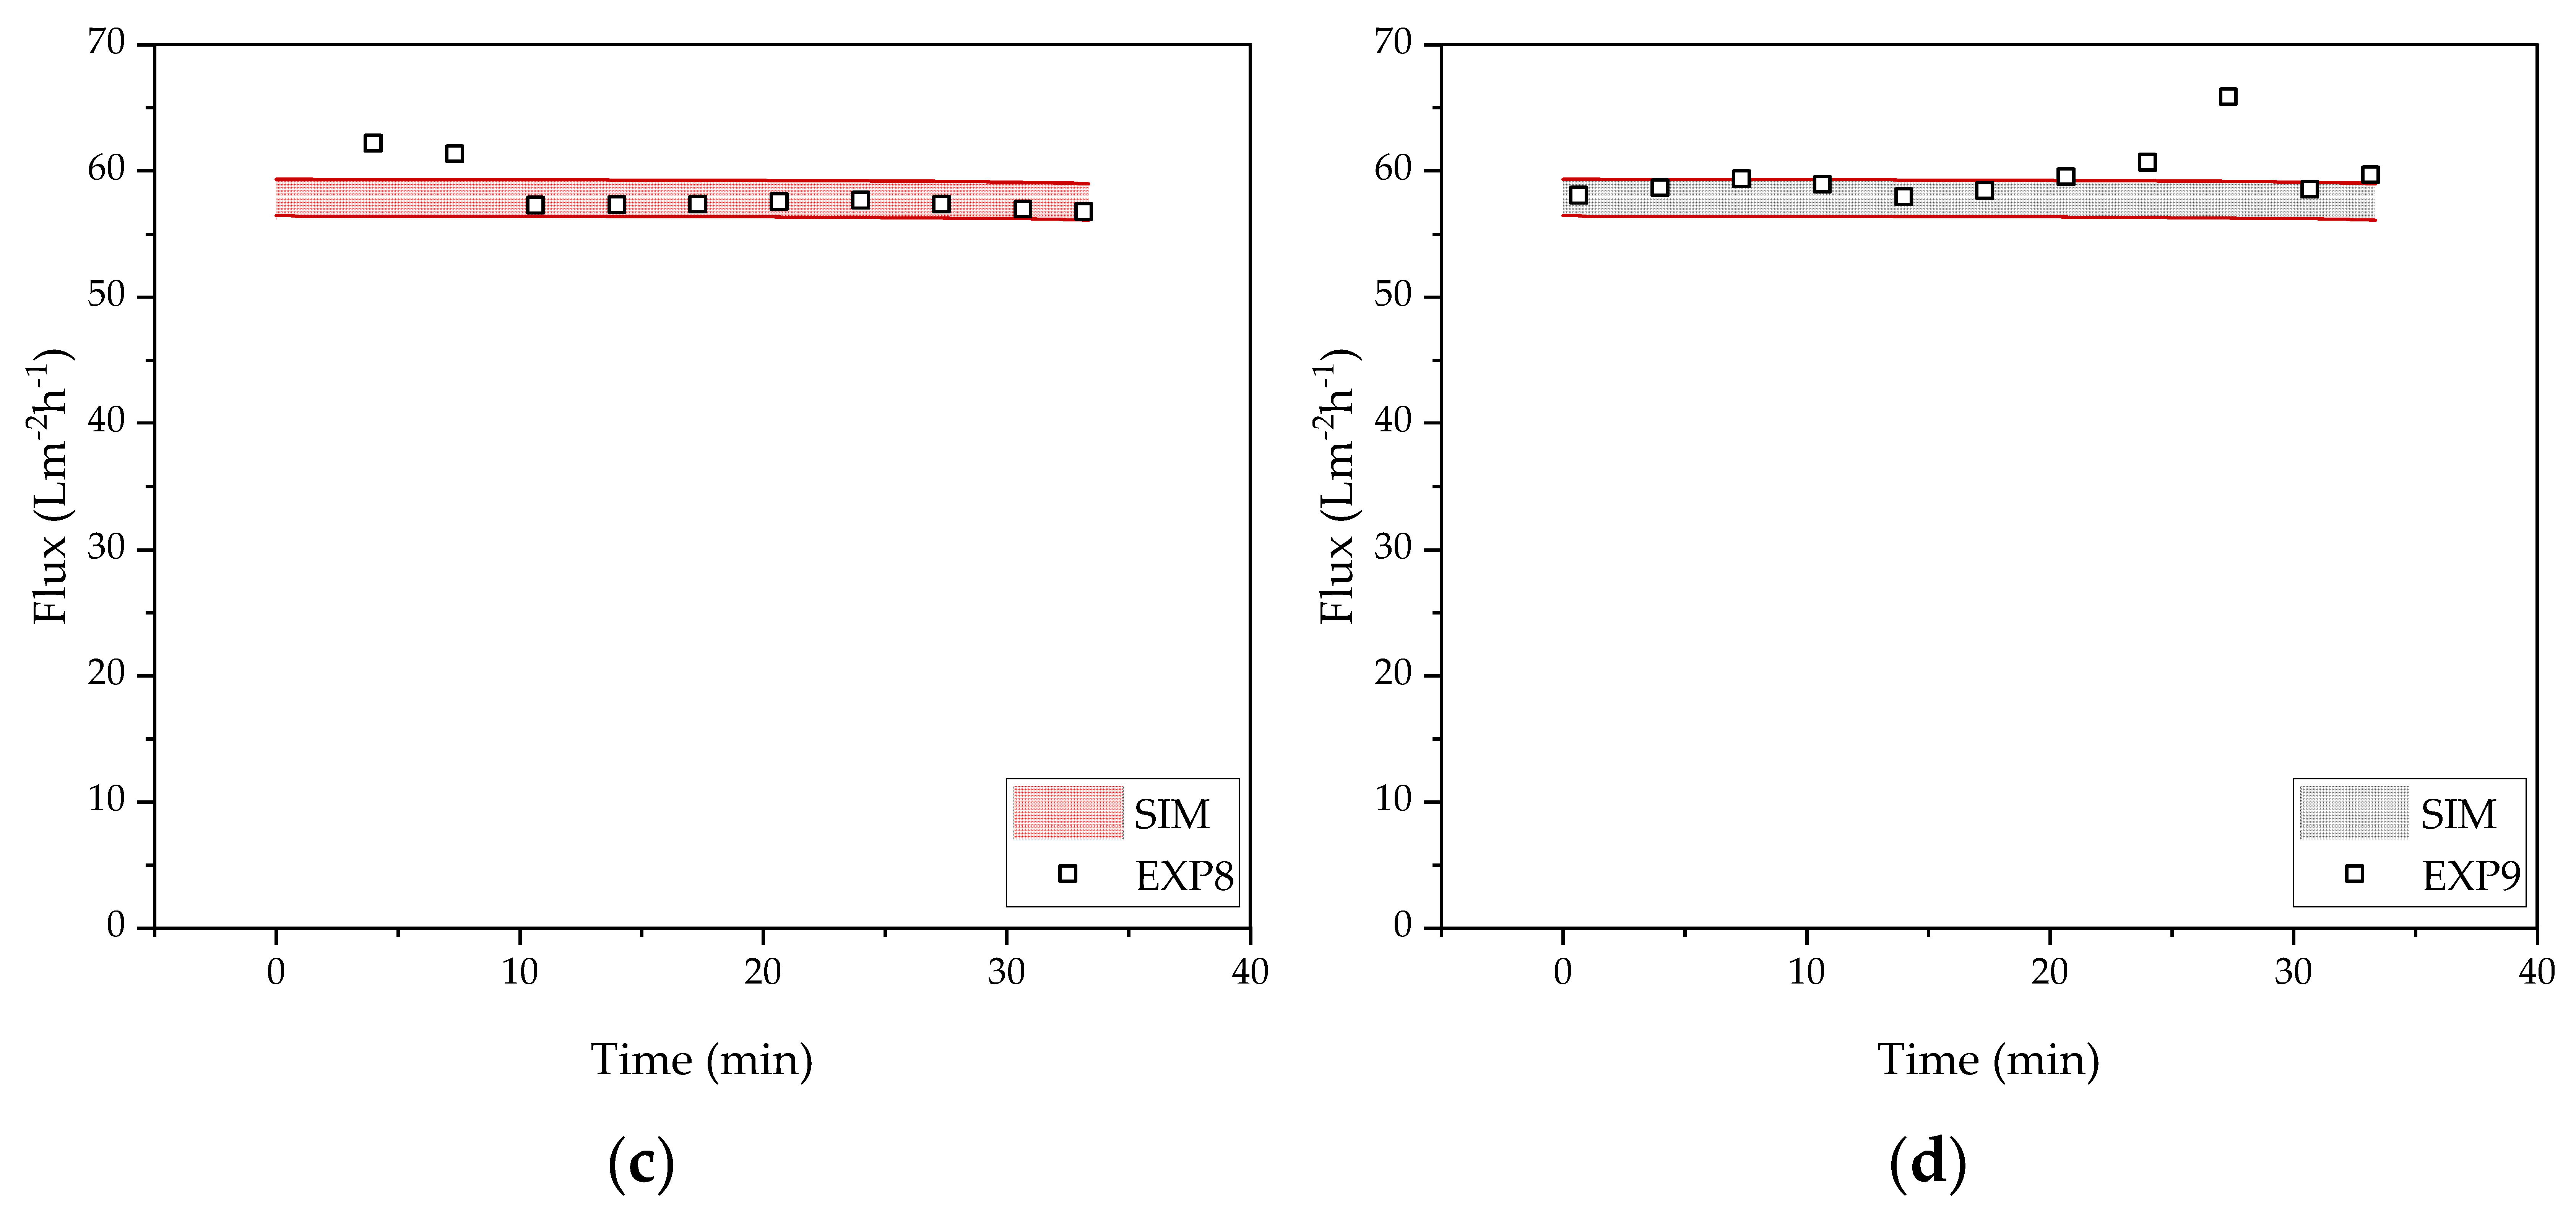
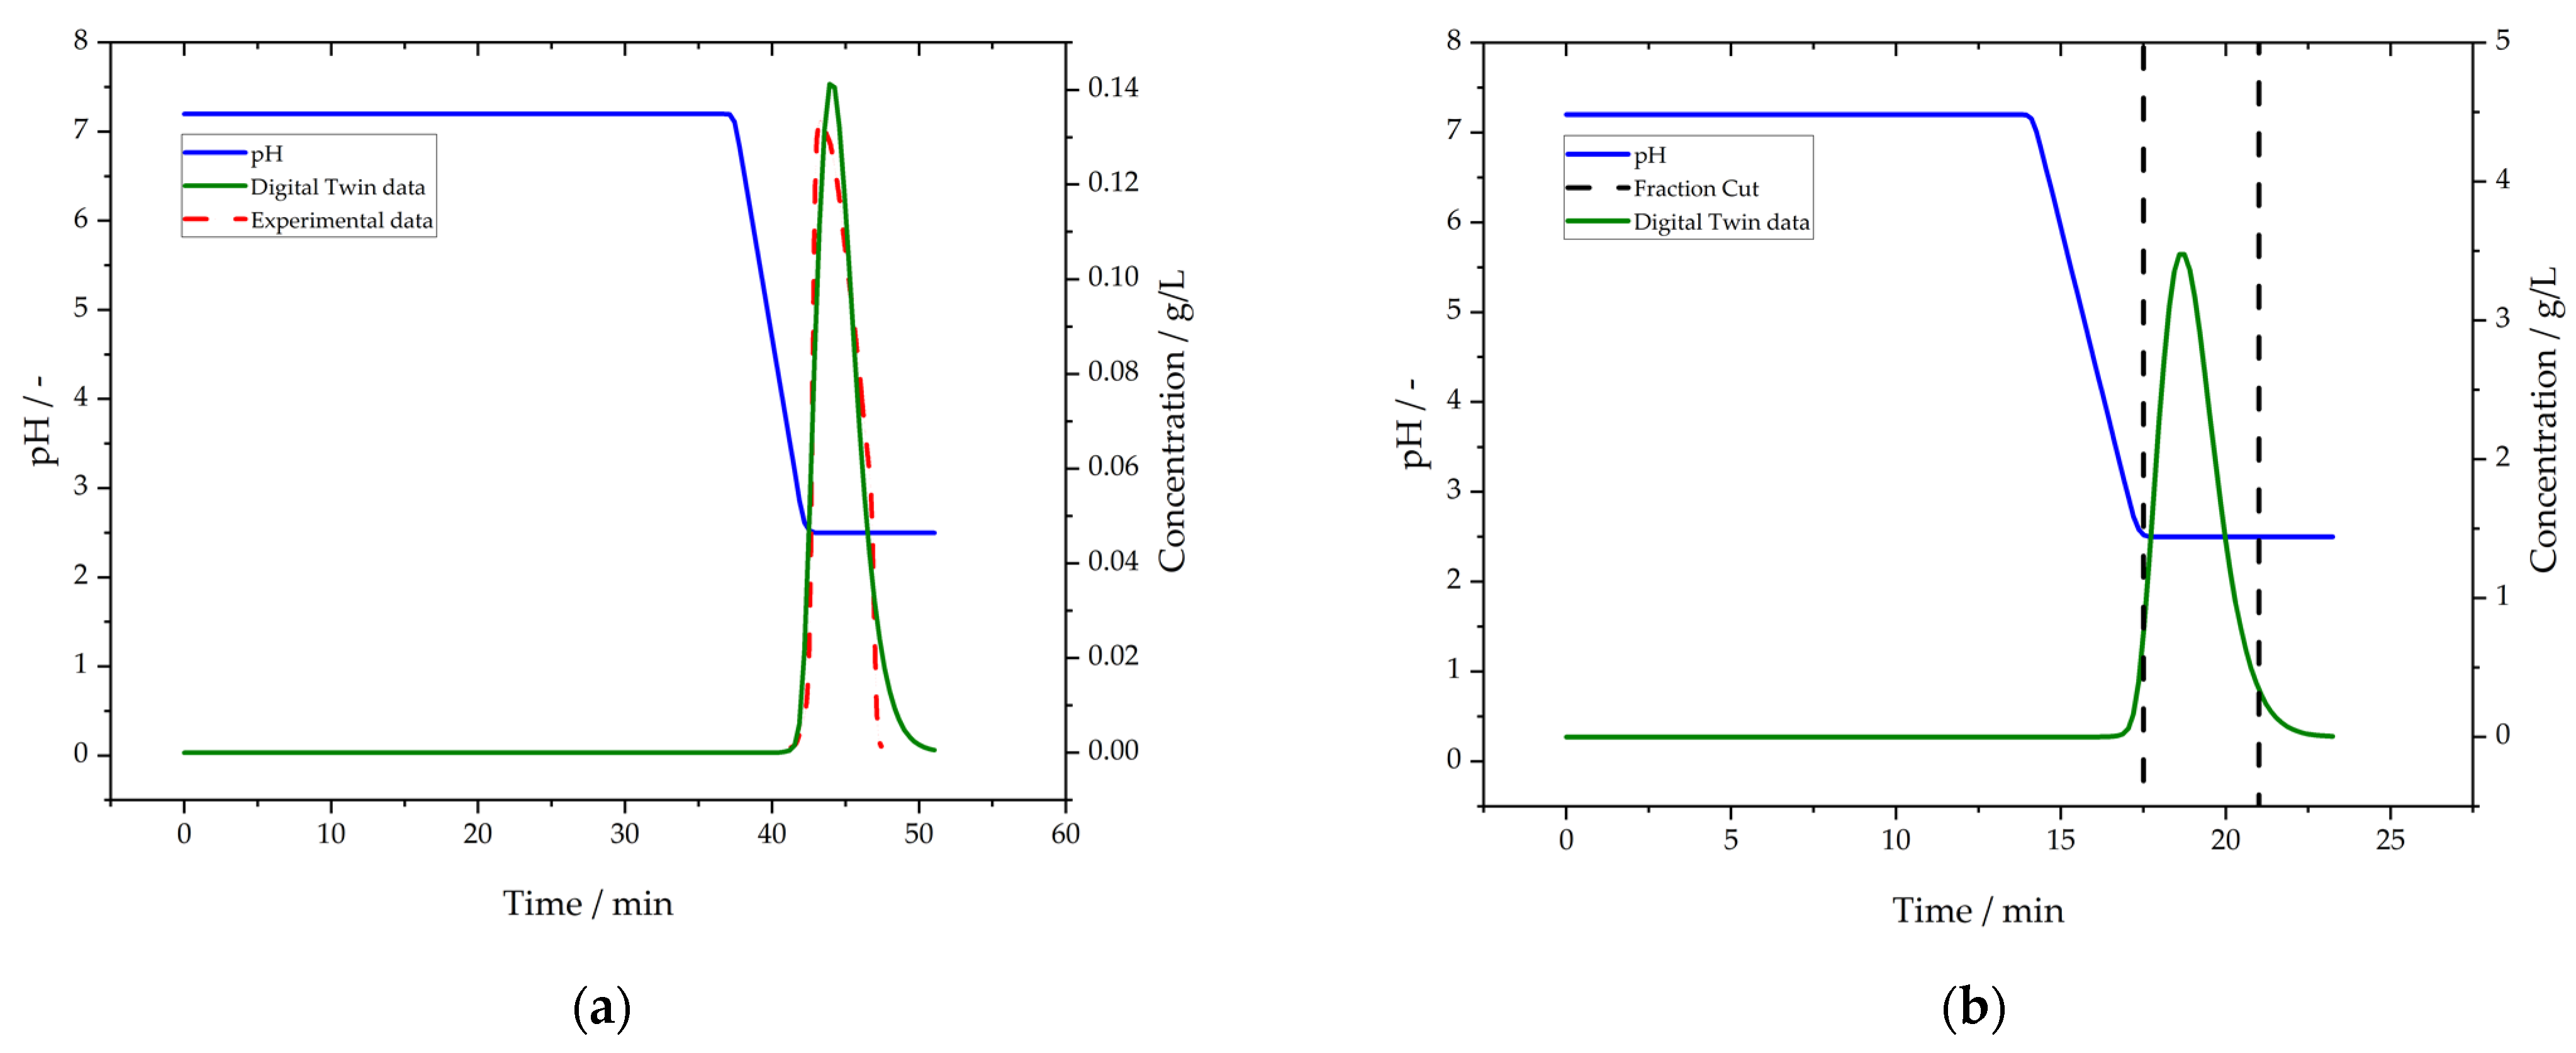
3.5. Purification by Protein L Chromatography
3.6. Polishing by Cation Exchange Chromatography (CEX)
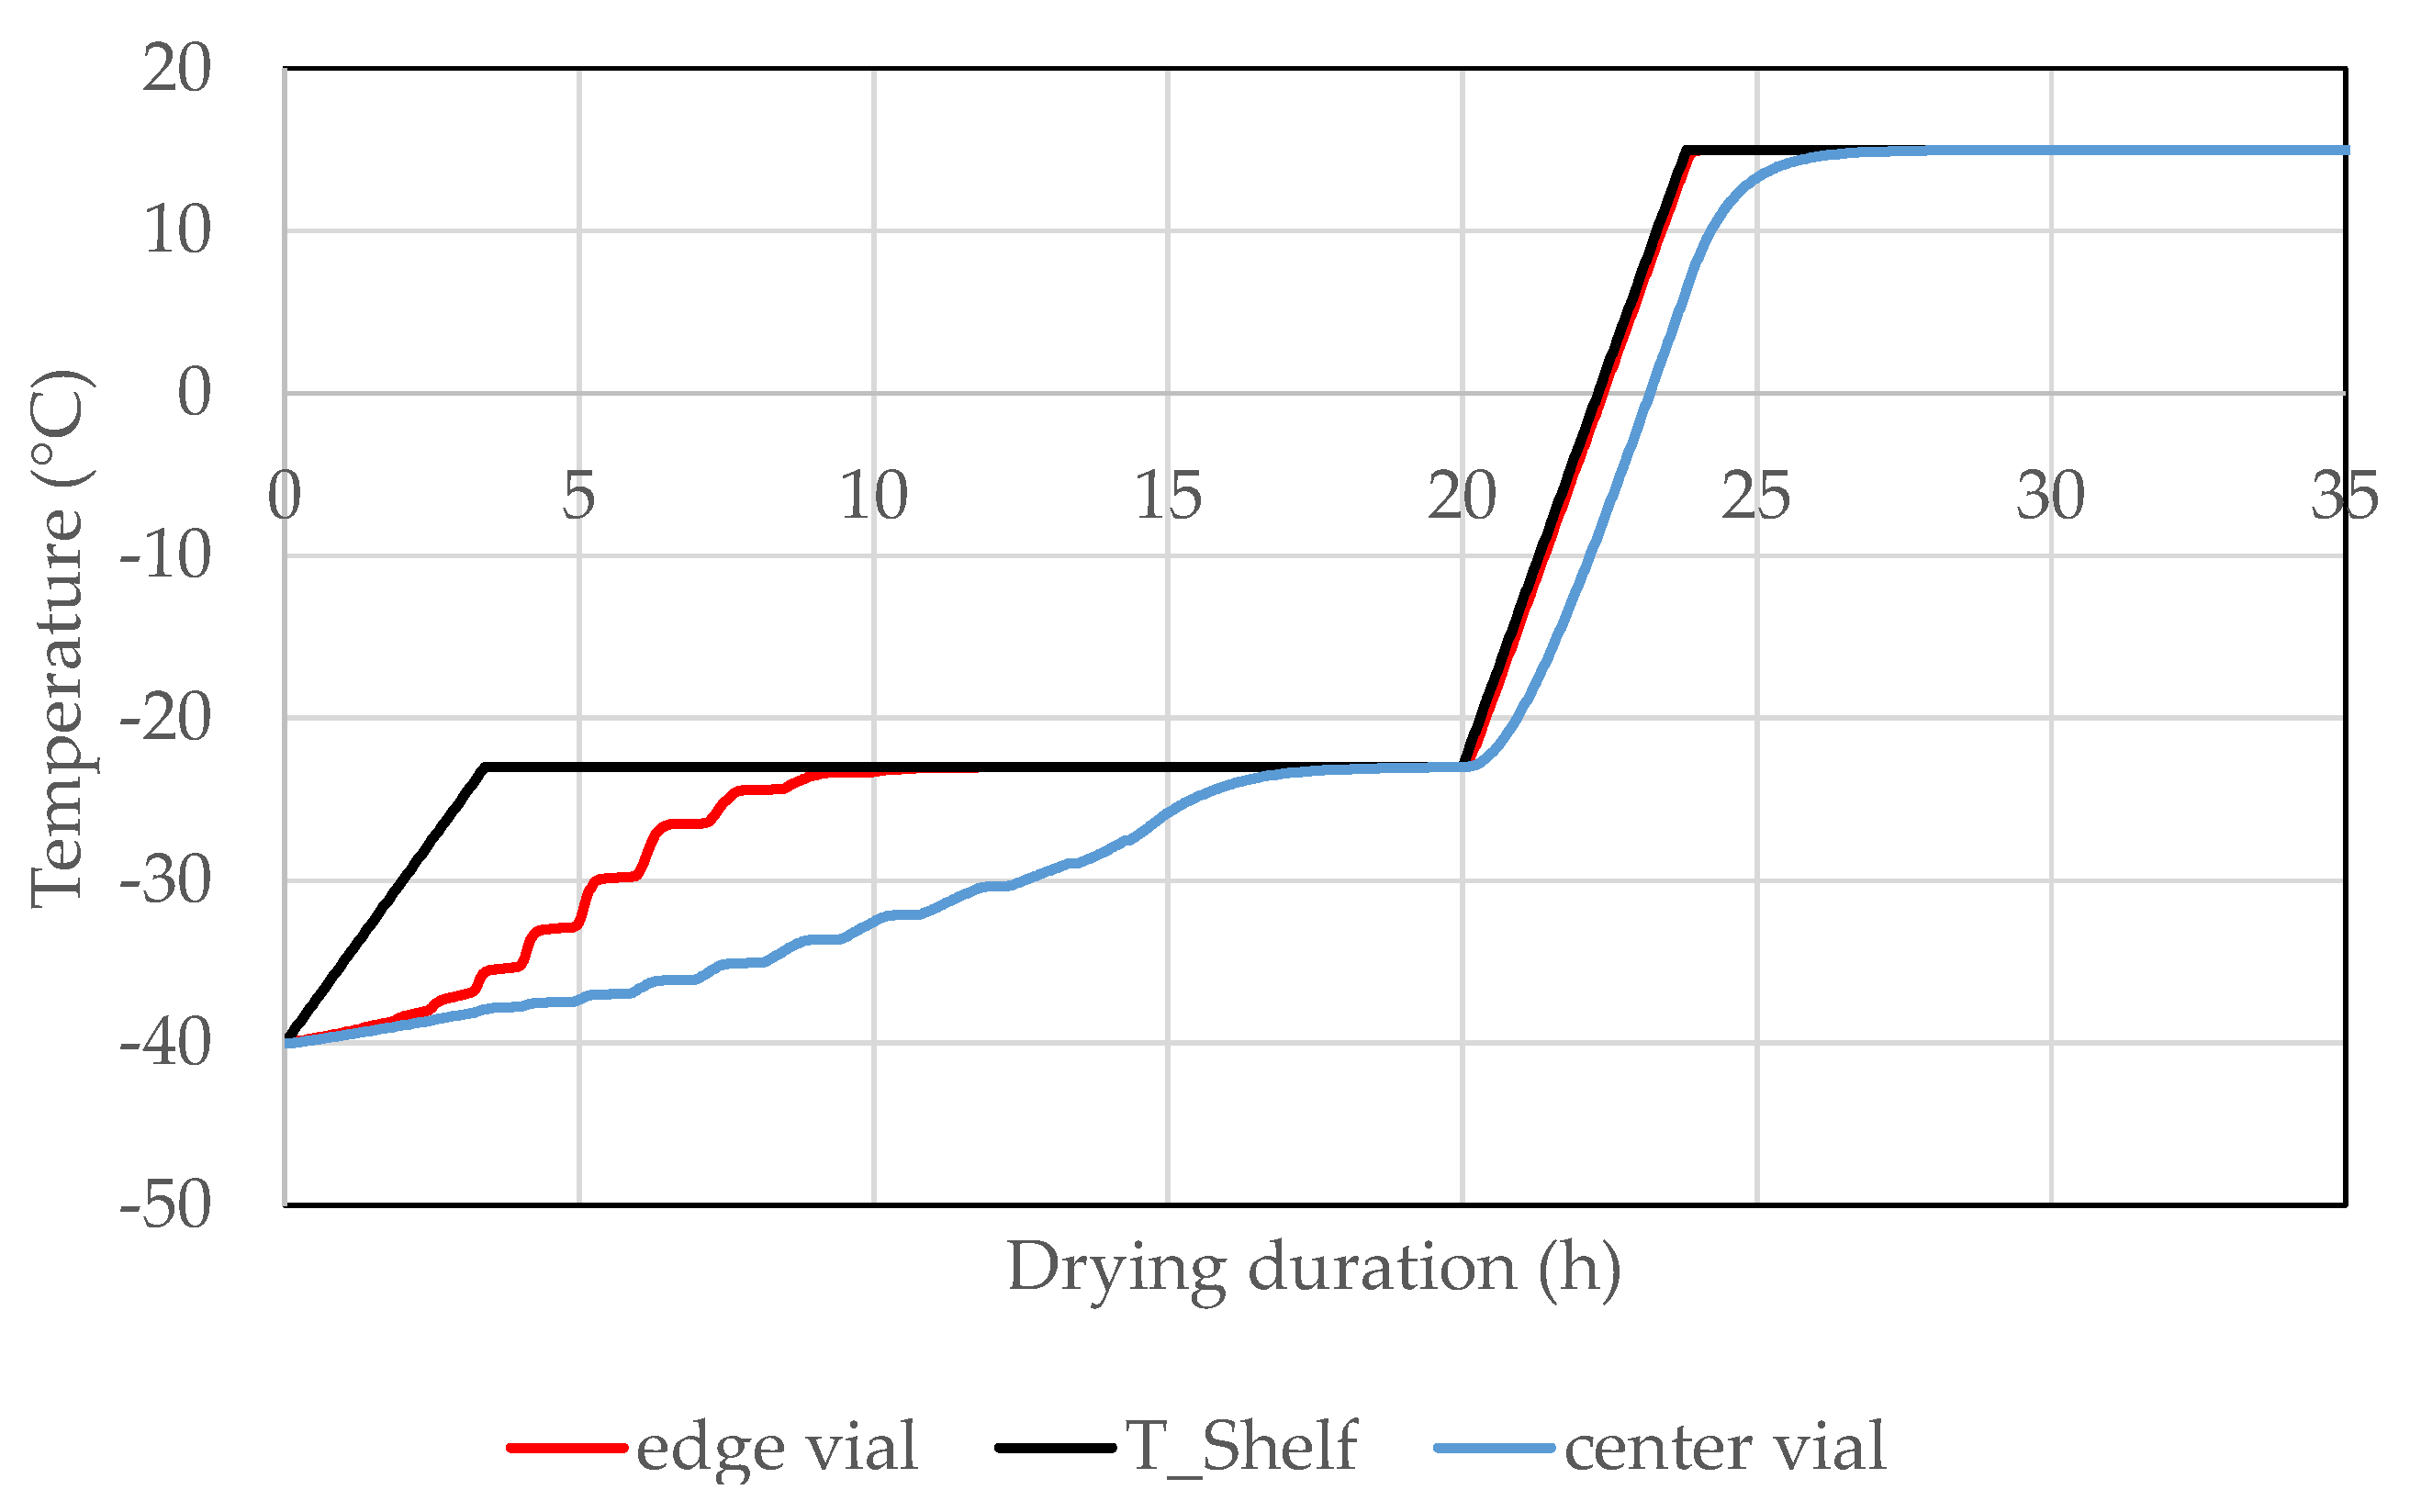
3.7. Formulation by Lyophilization
4. Discussion
5. Conclusions
Author Contributions
Funding
Data Availability Statement
Acknowledgments
Conflicts of Interest
References
- Casali, N. Escherichia coli host strains. Methods Mol. Biol. 2003, 235, 27–48. [Google Scholar] [CrossRef] [PubMed]
- Sørensen, H.P.; Mortensen, K.K. Advanced genetic strategies for recombinant protein expression in Escherichia coli. J. Biotechnol. 2005, 115, 113–128. [Google Scholar] [CrossRef] [PubMed]
- Terpe, K. Overview of bacterial expression systems for heterologous protein production: From molecular and biochemical fundamentals to commercial systems. Appl. Microbiol. Biotechnol. 2006, 72, 211–222. [Google Scholar] [CrossRef] [PubMed]
- Sanchez-Garcia, L.; Martín, L.; Mangues, R.; Ferrer-Miralles, N.; Vázquez, E.; Villaverde, A. Recombinant pharmaceuticals from microbial cells: A 2015 update. Microb. Cell Fact. 2016, 15, 33. [Google Scholar] [CrossRef] [Green Version]
- Walsh, G. Biopharmaceutical benchmarks 2014. Nat. Biotechnol. 2014, 32, 992–1000. [Google Scholar] [CrossRef]
- Baeshen, N.A.; Baeshen, M.N.; Sheikh, A.; Bora, R.S.; Ahmed, M.M.M.; Ramadan, H.A.I.; Saini, K.S.; Redwan, E.M. Cell factories for insulin production. Microb. Cell Fact. 2014, 13, 141. [Google Scholar] [CrossRef] [Green Version]
- Ferrer-Miralles, N.; Domingo-Espín, J.; Corchero, J.L.; Vázquez, E.; Villaverde, A. Microbial factories for recombinant pharmaceuticals. Microb. Cell Fact. 2009, 8, 17. [Google Scholar] [CrossRef] [Green Version]
- Swartz, J.R. Advances in Escherichia coli production of therapeutic proteins. Curr. Opin. Biotechnol. 2001, 12, 195–201. [Google Scholar] [CrossRef]
- Tripathi, N.K. Production and Purification of Recombinant Proteins from Escherichia coli. ChemBioEng Rev. 2016, 3, 116–133. [Google Scholar] [CrossRef]
- Daegelen, P.; Studier, F.W.; Lenski, R.E.; Cure, S.; Kim, J.F. Tracing ancestors and relatives of Escherichia coli B, and the derivation of B strains REL606 and BL21(DE3). J. Mol. Biol. 2009, 394, 634–643. [Google Scholar] [CrossRef]
- Rosano, G.L.; Ceccarelli, E.A. Recombinant protein expression in Escherichia coli: Advances and challenges. Front. Microbiol. 2014, 5, 172. [Google Scholar] [CrossRef] [PubMed] [Green Version]
- Baneyx, F. Recombinant protein expression in Escherichia coli. Curr. Opin. Biotechnol. 1999, 10, 411–421. [Google Scholar] [CrossRef]
- Studier, F.; Moffatt, B.A. Use of bacteriophage T7 RNA polymerase to direct selective high-level expression of cloned genes. J. Mol. Biol. 1986, 189, 113–130. [Google Scholar] [CrossRef]
- Weickert, M.J.; Doherty, D.H.; Best, E.A.; Olins, P.O. Optimization of heterologous protein production in Escherichia coli. Curr. Opin. Biotechnol. 1996, 7, 494–499. [Google Scholar] [CrossRef]
- Chen, C.W. Implementation of ICH Q8 and QbD—An FDA Perspective; International Society for Pharmaceutical Engineering (ISPE): Yokohama, Japan, 2006. [Google Scholar]
- ICH Expert Working Group. Pharmaceutical Development Q8 (R2): ICH Harmonised Tripartite Guideline; ICH: Geneva, Switzerland, 2009. [Google Scholar]
- Beg, S.; Hasnain, M.S.; Rahman, M.; Swain, S. Introduction to Quality by Design (QbD): Fundamentals, Principles, and Applications. In Pharmaceutical Quality by Design; Elsevier: Amsterdam, The Netherlands, 2019; pp. 1–17. ISBN 9780128157992. [Google Scholar]
- Rathore, A.S.; Winkle, H. Quality by design for biopharmaceuticals. Nat. Biotechnol. 2009, 27, 26–34. [Google Scholar] [CrossRef]
- Chen, Y.; Yang, O.; Sampat, C.; Bhalode, P.; Ramachandran, R.; Ierapetritou, M. Digital Twins in Pharmaceutical and Biopharmaceutical Manufacturing: A Literature Review. Processes 2020, 8, 1088. [Google Scholar] [CrossRef]
- Yu, L.X. Pharmaceutical quality by design: Product and process development, understanding, and control. Pharm. Res. 2008, 25, 781–791. [Google Scholar] [CrossRef]
- Matsunami, K.; Ryckaert, A.; Peeters, M.; Badr, S.; Sugiyama, H.; Nopens, I.; Beer, T.D. Analysis of the Effects of Process Parameters on Start-Up Operation in Continuous Wet Granulation. Processes 2021, 9, 1502. [Google Scholar] [CrossRef]
- Meitz, A.; Sagmeister, P.; Langemann, T.; Herwig, C. An Integrated Downstream Process Development Strategy along QbD Principles. Bioengineering 2014, 1, 213–230. [Google Scholar] [CrossRef] [Green Version]
- Schmidt, A.; Helgers, H.; Vetter, F.L.; Juckers, A.; Strube, J. Digital Twin of mRNA-Based SARS-COVID-19 Vaccine Manufacturing towards Autonomous Operation for Improvements in Speed, Scale, Robustness, Flexibility and Real-Time Release Testing. Processes 2021, 9, 748. [Google Scholar] [CrossRef]
- Lopez, P.C.; Udugama, I.A.; Thomsen, S.T.; Roslander, C.; Junicke, H.; Mauricio-Iglesias, M.; Gernaey, K.V. Towards a digital twin: A hybrid data-driven and mechanistic digital shadow to forecast the evolution of lignocellulosic fermentation. Biofuels Bioprod. Bioref. 2020, 14, 1046–1060. [Google Scholar] [CrossRef]
- Del Castillo-Romo, A.Á.; Morales-Rodriguez, R.; Román-Martínez, A. Multi-objective optimization for the biotechnological conversion of lingocellulosic biomass to value-added products. In 26th European Symposium on Computer Aided Process Engineering; Elsevier: Amsterdam, The Netherlands, 2016; pp. 1515–1520. ISBN 9780444634283. [Google Scholar]
- Brunef, R.; Kumar, K.S.; Guillen-Gosalbez, G.; Jimenez, L. Integrating process simulation, multi-objective optimization and LCA for the development of sustainable processes. In 21st European Symposium on Computer Aided Process Engineering; Elsevier: Amsterdam, The Netherlands, 2011; pp. 1271–1275. ISBN 9780444538956. [Google Scholar]
- Brunet, R.; Guillén-Gosálbez, G.; Pérez-Correa, J.R.; Caballero, J.A.; Jiménez, L. Hybrid simulation-optimization based approach for the optimal design of single-product biotechnological processes. Comput. Chem. Eng. 2012, 37, 125–135. [Google Scholar] [CrossRef] [Green Version]
- Udugama, I.A.; Lopez, P.C.; Gargalo, C.L.; Li, X.; Bayer, C.; Gernaey, K.V. Digital Twin in biomanufacturing: Challenges and opportunities towards its implementation. Syst. Microbiol. Biomanuf. 2021, 1, 257–274. [Google Scholar] [CrossRef]
- Da Costa Basto, R.M.; Casals, M.P.; Mudde, R.F.; van der Wielen, L.A.; Cuellar, M.C. A mechanistic model for oil recovery in a region of high oil droplet concentration from multiphasic fermentations. Chem. Eng. Sci. X 2019, 3, 100033. [Google Scholar] [CrossRef]
- Mat Isham, N.K.; Mokhtar, N.; Fazry, S.; Lim, S.J. The development of an alternative fermentation model system for vinegar production. LWT 2019, 100, 322–327. [Google Scholar] [CrossRef]
- Pérez, A.D.; van der Bruggen, B.; Fontalvo, J. Modeling of a liquid membrane in Taylor flow integrated with lactic acid fermentation. Chem. Eng. Process.-Process Intensif. 2019, 144, 107643. [Google Scholar] [CrossRef]
- Udugama, I.; Öner, M.; Lopez, P.C.; Beenfeldt, C.; Bayer, C.; Huusom, J.K.; Gernaey, K.V.; Sin, G. Towards Digitalization in Bio-Manufacturing Operations: A Survey on Application of Big Data and Digital Twin Concepts in Denmark. Front. Chem. Eng. 2021, 3, 727152. [Google Scholar] [CrossRef]
- Zurdo, J.; Arnell, A.; Obrezanova, O.; Smith, N.; La Gómez de Cuesta, R.; Gallagher, T.R.A.; Michael, R.; Stallwood, Y.; Ekblad, C.; Abrahmsén, L.; et al. Early implementation of QbD in biopharmaceutical development: A practical example. Biomed Res. Int. 2015, 2015, 605427. [Google Scholar] [CrossRef] [Green Version]
- Pugh, K. Prior Knowledge in Product Development/Design. Available online: https://www.google.com/url?sa=t&rct=j&q=&esrc=s&source=web&cd=&ved=2ahUKEwjE5a-Y9vbzAhU0g_0HHSUvCk4QFnoECAoQAQ&url=https%3A%2F%2Fwww.ema.europa.eu%2Fdocuments%2Fpresentation%2Fpresentation-regulators-perspective-session-2-keith-pugh_en.pdf&usg=AOvVaw0NxD1cs8-EMstl-sdm9IxA (accessed on 1 March 2022).
- Schmidt, A.; Strube, J. Distinct and Quantitative Validation Method for Predictive Process Modeling with Examples of Liquid-Liquid Extraction Processes of Complex Feed Mixtures. Processes 2019, 7, 298. [Google Scholar] [CrossRef] [Green Version]
- Alt, N.; Zhang, T.Y.; Motchnik, P.; Taticek, R.; Quarmby, V.; Schlothauer, T.; Beck, H.; Emrich, T.; Harris, R.J. Determination of critical quality attributes for monoclonal antibodies using quality by design principles. Biologicals 2016, 44, 291–305. [Google Scholar] [CrossRef]
- Yu, L.X.; Amidon, G.; Khan, M.A.; Hoag, S.W.; Polli, J.; Raju, G.K.; Woodcock, J. Understanding pharmaceutical quality by design. AAPS J. 2014, 16, 771–783. [Google Scholar] [CrossRef] [PubMed] [Green Version]
- Zobel-Roos, S.; Schmidt, A.; Mestmäcker, F.; Mouellef, M.; Huter, M.; Uhlenbrock, L.; Kornecki, M.; Lohmann, L.; Ditz, R.; Strube, J. Accelerating Biologics Manufacturing by Modeling or: Is Approval under the QbD and PAT Approaches Demanded by Authorities Acceptable Without a Digital-Twin? Processes 2019, 7, 94. [Google Scholar] [CrossRef] [Green Version]
- Kis, Z.; Kontoravdi, C.; Shattock, R.; Shah, N. Resources, Production Scales and Time Required for Producing RNA Vaccines for the Global Pandemic Demand. Vaccines 2020, 9, 3. [Google Scholar] [CrossRef] [PubMed]
- Kornecki, M.; Schmidt, A.; Strube, J. PAT as key-enabling technology for QbD in pharmaceutical manufacturing A conceptual review on upstream and downstream processing. Chim. Oggi-Chem. Today 2018, 36, 44–48. [Google Scholar]
- Helgers, H.; Schmidt, A.; Lohmann, L.J.; Vetter, F.L.; Juckers, A.; Jensch, C.; Mouellef, M.; Zobel-Roos, S.; Strube, J. Towards Autonomous Operation by Advanced Process Control—Process Analytical Technology for Continuous Biologics Antibody Manufacturing. Processes 2021, 9, 172. [Google Scholar] [CrossRef]
- Helgers, H.; Hengelbrock, A.; Schmidt, A.; Rosengarten, J.; Stitz, J.; Strube, J. Process Design and Optimization towards Digital Twins for HIV-Gag VLP Production in HEK293 Cells, including Purification. Processes 2022, 10, 419. [Google Scholar] [CrossRef]
- Schmidt, A.; Helgers, H.; Vetter, F.L.; Juckers, A.; Strube, J. Fast and Flexible mRNA Vaccine Manufacturing as a Solution to Pandemic Situations by Adopting Chemical Engineering Good Practice—Continuous Autonomous Operation in Stainless Steel Equipment Concepts. Processes 2021, 9, 1874. [Google Scholar] [CrossRef]
- Helgers, H.; Hengelbrock, A.; Schmidt, A.; Strube, J. Digital Twins for Continuous mRNA Production. Processes 2021, 9, 1967. [Google Scholar] [CrossRef]
- Woodcock, J. Modernizing Pharmaceutical Manufacturing—Continuous Manufacturing as a Key Enabler: MIT-CMAC International Symposium on Continuous Manufacturing of Pharmaceuticals. Available online: https://iscmp.mit.edu/sites/default/files/documents/ISCMP%202014%20-%20Keynote_Slides.pdf (accessed on 6 December 2021).
- Grote, F.; Fröhlich, H.; Strube, J. Integration of Ultrafiltration Unit Operations in Biotechnology Process Design. Chem. Eng. Technol. 2011, 34, 673–687. [Google Scholar] [CrossRef]
- Weisbach, J.L. Lehrbuch der Ingenieur-und Maschinen-Mechanik: Theoretische Mechanik; Druck und Verlag von Friedrich Vieweg und Sohn: Braunschweig, Germany, 1845. [Google Scholar]
- Darcy, H. Les Fontaines Publiques de la ville de Dijon: Exposition et Application; Victor Dalmont: Paris, France, 1856. [Google Scholar]
- Brown, G.O. The History of the Darcy-Weisbach Equation for Pipe Flow Resistance. In Proceedings of the Environmental and Water Resources History, Environmental and Water Resources History Sessions at ASCE Civil Engineering Conference and Exposition 2002, Washington, DC, USA, 3–7 November 2002; Rogers, J.R., Fredrich, A.J., Eds.; American Society of Civil Engineers: Reston, VA, USA, 2002; pp. 34–43. ISBN 9780784406502. [Google Scholar]
- van den Berg, G.B.; Smolders, C.A. Flux decline in ultrafiltration processes. Desalination 1990, 77, 101–133. [Google Scholar] [CrossRef] [Green Version]
- Wijmans, J.G.; Nakao, S.; van den Berg, J.; Troelstra, F.R.; Smolders, C.A. Hydrodynamic resistance of concentration polarization boundary layers in ultrafiltration. J. Membr. Sci. 1985, 22, 117–135. [Google Scholar] [CrossRef] [Green Version]
- Huter, M.J.; Strube, J. Model-Based Design and Process Optimization of Continuous Single Pass Tangential Flow Filtration Focusing on Continuous Bioprocessing. Processes 2019, 7, 317. [Google Scholar] [CrossRef] [Green Version]
- Kumar, A.; Wahlund, P.-O.; Kepka, C.; Galaev, I.Y.; Mattiasson, B. Purification of histidine-tagged single-chain Fv-antibody fragments by metal chelate affinity precipitation using thermoresponsive copolymers. Biotechnol. Bioeng. 2003, 84, 494–503. [Google Scholar] [CrossRef] [PubMed]
- Rodrigo, G.; Gruvegård, M.; van Alstine, J. Antibody Fragments and Their Purification by Protein L Affinity Chromatography. Antibodies 2015, 4, 259–277. [Google Scholar] [CrossRef] [Green Version]
- Sakhnini, L.I.; Pedersen, A.K.; León, I.R.; Greisen, P.J.; Hansen, J.J.; Vester-Christensen, M.B.; Bülow, L.; Dainiak, M.B. Optimizing selectivity of anion hydrophobic multimodal chromatography for purification of a single-chain variable fragment. Eng. Life Sci. 2019, 19, 490–501. [Google Scholar] [CrossRef] [PubMed] [Green Version]
- Guiochon, G.; Felinger, A.; Shirazi, D.G.; Katti, A.M. Fundamentals of Preparative and Nonlinear Chromatography, 2nd ed.; Elsevier Academic Press: Amsterdam, The Netherlands; Boston, MA, USA; Heidelberg, Germany; London, UK; New York, NY, USA; Oxford, UK; Paris, Franch; San Diego, CA, USA; San Francisco, CA, USA; Singapore; Sydney, Australia; Tokyo, Japan, 2006; ISBN 9780123705372. [Google Scholar]
- Gottesman, S. Proteases and their targets in Escherichia coli. Annu. Rev. Genet. 1996, 30, 465–506. [Google Scholar] [CrossRef]
- Zobel-Roos, S.; Mouellef, M.; Ditz, R.; Strube, J. Distinct and Quantitative Validation Method for Predictive Process Modelling in Preparative Chromatography of Synthetic and Bio-Based Feed Mixtures Following a Quality-by-Design (QbD) Approach. Processes 2019, 7, 580. [Google Scholar] [CrossRef] [Green Version]
- Zobel-Roos, S. Entwicklung, Modellierung und Validierung von Integrierten Kontinuierlichen Gegenstrom-Chromatographie-Prozessen. Ph.D. Thesis, Shaker Verlag GmbH, Technische Universität Clausthal, Clausthal-Zellerfeld, Germany, 2018. [Google Scholar]
- Brooks, C.A.; Cramer, S.M. Steric mass-action ion exchange: Displacement profiles and induced salt gradients. AIChE J. 1992, 38, 1969–1978. [Google Scholar] [CrossRef]
- Carta, G.; Jungbauer, A. Protein Chromatography: Process Development and Scale-Up; Wiley-VCH: Weinheim, Germany, 2010; ISBN 978-3-527-31819-3. [Google Scholar]
- Seidel-Morgenstern, A.; Guiochon, G. Modelling of the competitive isotherms and the chromatographic separation of two enantiomers. Chem. Eng. Sci. 1993, 48, 2787–2797. [Google Scholar] [CrossRef]
- Langmuir, I. the adsorption of gases on plane surfaces of glass, mica and platinum. J. Am. Chem. Soc. 1918, 40, 1361–1403. [Google Scholar] [CrossRef] [Green Version]
- Seidel-Morgenstern, A. Experimental determination of single solute and competitive adsorption isotherms. J. Chromatogr. A 2004, 1037, 255–272. [Google Scholar] [CrossRef] [PubMed]
- Carta, G.; Rodrigues, A.E. Diffusion and convection in chromatographic processes using permeable supports with a bidisperse pore structure. Chem. Eng. Sci. 1993, 48, 3927–3935. [Google Scholar] [CrossRef]
- Wilson, E.J.; Geankoplis, C.J. Liquid Mass Transfer at Very Low Reynolds Numbers in Packed Beds. Ind. Eng. Chem. Fund. 1966, 5, 9–14. [Google Scholar] [CrossRef]
- Klepzig, L.S.; Juckers, A.; Knerr, P.; Harms, F.; Strube, J. Digital Twin for Lyophilization by Process Modeling in Manufacturing of Biologics. Processes 2020, 8, 1325. [Google Scholar] [CrossRef]
- Juckers, A.; Knerr, P.; Harms, F.; Strube, J. Advanced Process Analytical Technology in Combination with Process Modeling for Endpoint and Model Parameter Determination in Lyophilization Process Design and Optimization. Processes 2021, 9, 1600. [Google Scholar] [CrossRef]
- Martin Christ Gefriertrocknungsanlagen Gmbh. Pilot-Gefriertrocknungsanlagen Innovative Technologie. Available online: https://www.martinchrist.de/fileadmin/user_upload/christ/PDF/Broschueren/Pilot/Christ_Pilot_GT_dt_2021-08.pdf (accessed on 22 February 2022).
- Rambhatla, S.; Pikal, M.J. Heat and mass transfer scale-up issues during freeze-drying, I: Atypical radiation and the edge vial effect. AAPS PharmSciTech 2003, 4, E14. [Google Scholar] [CrossRef] [Green Version]
- Lindner, R. Prozessentwicklung zur Produktion und Reinigung eines PEGylierten Antikörperfragmentes. Ph.D. Thesis, University of Stuttgart, Stuttgart, Germany, 2019. [Google Scholar]


Publisher’s Note: MDPI stays neutral with regard to jurisdictional claims in published maps and institutional affiliations. |
© 2022 by the authors. Licensee MDPI, Basel, Switzerland. This article is an open access article distributed under the terms and conditions of the Creative Commons Attribution (CC BY) license (https://creativecommons.org/licenses/by/4.0/).
Share and Cite
Helgers, H.; Hengelbrock, A.; Schmidt, A.; Vetter, F.L.; Juckers, A.; Strube, J. Digital Twins for scFv Production in Escherichia coli. Processes 2022, 10, 809. https://doi.org/10.3390/pr10050809
Helgers H, Hengelbrock A, Schmidt A, Vetter FL, Juckers A, Strube J. Digital Twins for scFv Production in Escherichia coli. Processes. 2022; 10(5):809. https://doi.org/10.3390/pr10050809
Chicago/Turabian StyleHelgers, Heribert, Alina Hengelbrock, Axel Schmidt, Florian Lukas Vetter, Alex Juckers, and Jochen Strube. 2022. "Digital Twins for scFv Production in Escherichia coli" Processes 10, no. 5: 809. https://doi.org/10.3390/pr10050809