Article

Diffusion of Ethanol in Supercritical Carbon Dioxide—Investigation of scCO2-Cosolvent Mixtures Used in Pharmaceutical Applications

by
Cecília I. A. V. Santos
*,
Marisa C. F. Barros
and
Ana C. F. Ribeiro
Department of Chemistry, University of Coimbra, CQC-IMS, 3004-535 Coimbra, Portugal
*
Author to whom correspondence should be addressed.
Processes 2022, 10(4), 660; https://doi.org/10.3390/pr10040660
Submission received: 27 February 2022 / Revised: 22 March 2022 / Accepted: 23 March 2022 / Published: 29 March 2022
(This article belongs to the Special Issue Drug Delivery Systems: Theory, Methods and Applications)

Abstract

:
Diffusion coefficients, D, for ethanol in supercritical carbon dioxide (scCO2) were measured in the temperature range 306.15–331.15 K and along the 10.5 MPa isobar, using the Taylor dispersion technique. The obtained diffusivities ranged from 1.49 × 10⁻⁸ to 2.98 × 10⁻⁸ m2 s−1, an order of magnitude higher than in usual liquids. The dependence of D on temperature and solvent density was examined. Various correlation models based in the hydrodynamic theory were assessed to estimate the diffusion coefficients, with reasonable results obtained for the Wilke–Chang and Lai–Tan models.

1. Introduction

Transport coefficients are essential properties for modeling, designing, and scaling-up rate-controlled processes. Supercritical fluids (SCFs) have the remarkable ability to be applied at the industrial level in mass-transfer operations, phase transition processes, reactive systems, and nanostructured and materials related processes [1]. Carbon dioxide (CO2), among SCFs, has been widely used due to its chemical stability, considerable inertness, low critical temperature, relatively non-toxicity, non-flammability, and availability in high purity at relatively low cost [2]. Physical properties of supercritical CO2, namely, density, viscosity, and diffusivity, can be controlled by the simple adjustment of the working conditions (temperature and pressure). Response to minor changes in the temperature and pressure of this fluid near the critical region result in high variations in its density and solubility. These features, together with the fact that supercritical CO2 presents low viscosity and high diffusivity like gases and high density and solvating power like liquids [3] and that it is classified as a safe solvent for the FDA [4], make it a very convenient and resourceful solvent and anti-solvent to be used in the pharmaceutical industry in a wide variety of processes and technologies related to drug formulation such as purification, micronization, and encapsulation of drugs, in contrast to more conventional methods.
Application of scCO2 through technologies such as rapid expansion of supercritical solutions (RESS), supercritical anti-solvent (SAS) and derivatives, and depressurization of an expanded liquid organic solution (DELOS) has been used to overcome poor physio-chemical, pharmacokinetic, and pharmacodynamic properties of drugs that limit their therapeutic effect [5,6,7,8,9] and to produce micro-particles for drug delivery in which the active principle is encapsulated within biocompatible polymers [10,11,12,13,14]. Such formulations, in the form of microparticles, nanoparticles, polymeric membranes, aerogels, microporous foams, solid lipid nanoparticles, and/or liposomes, encapsulate the active principle ideally at high drug loads, transport it to the site of action, and release it in a controlled manner, hence improving the efficacy and safety of the drug [15]. In common, all these methods use a step of mixture of a drug (or a solution of the drug) with scCO2 as a solvent (or co-solvent), followed by a depressurization step, through a nozzle, according to the principle that the decrease in pressure leads to decrease in density and thus, in the drug solubility, creates a supersaturated solution and further precipitation, producing small particles with uniform size distributions. In RESS, scCO2 is used as the solvent and so is applied for drugs that have a good solubility in them. In SAS, the precipitation occurs by addition of scCO2 to a liquid solution of the drug, where the solvent is usually an alcohol (ethanol/methanol/propanol), ketone (acetone), or dimethyl sulfoxide. The addition of scCO2 gives place to a mixture in which the drug is not soluble anymore. In this case, the drug is insoluble or slightly soluble in the supercritical fluid, whereas the liquid solvent and the fluid are highly miscible [16]. In the DELOS process [17], the precipitation occurs by depressurization of a solution the drug plus an organic solvent plus scCO2 to atmospheric pressure. This depressurization goes along with a decrease of the solution temperature, both contributing to the solution supersaturation and to the precipitation yield. In such process, the drug is soluble in the organic solvent plus scCO2 mixture.
The major advantage of these technologies is that the size of the particles can be controlled by solely manipulating the scCO2 temperature and pressure conditions, and the conditions met provide a final product without solvent residues. However, the choice of which process to use for a defined drug and what would be the ideal operative conditions is, in itself, a unique challenge because it requires knowledge of the involved phase equilibria. Behavior of general solutes in SCFs near the critical point is highly non-ideal [18], and the prediction of their behavior based on their properties in aqueous media with traditional models might fail. Moreover, supercritical CO2 is a non-polar solvent, and thus, it does not dissolve well all compounds, which can limit the applicability of the scCO2 based technologies. This limitation can be overcome by introducing small amounts of co-solvents and/or surfactants together with scCO2 (like in SAS and DELOS technologies) [19], but the addition of more components increases the complexity of the system and ultimately requires deeper knowledge of the system properties and further process optimization.
When employing co-solvents to enhance the drug solubility, many times the choice relies on ethanol. The presence of this co-solvent increases the solvent mixture density, the polarity and also the specific interactions like hydrogen bonding. Moreover, ethanol is generally safe and has a relatively high affinity with for supercritical CO2, being extensively used for supercritical extraction [20,21].
Fundamental properties in supercritical CO2, such as mass transport, have been objects of great interest, and it is possible to find data available far from the critical point, but information under near-critical conditions is lacking in the literature. Thus, detailed and accurate information about diffusion of ethanol in supercritical CO2, as co-solvent, is of great importance, in view of its role in the rational design and efficient operation in the process of creating a controlled drug delivery device. This study aims to investigate the diffusion of ethanol in carbon dioxide, at temperature and pressure above the critical point (314.18 K and 7.38 MPa), in a broad range of densities of this fluid covering areas close and far from the critical point, in order to understand the transport phenomena occurring in this mixture.

2. Materials and Methods

2.1. Materials

Toluene 99.85% (CAS Number: 110-82-7) was supplied by Acros Organics and ethanol absolute 99.97% (CAS Number: 64-17-5) was supplied by VWR Chemicals Prolabo. All liquids were used as received, with no further purification. CO2 with purity higher than 99.995% (water content < 40 ppm) was supplied by Air Liquide.

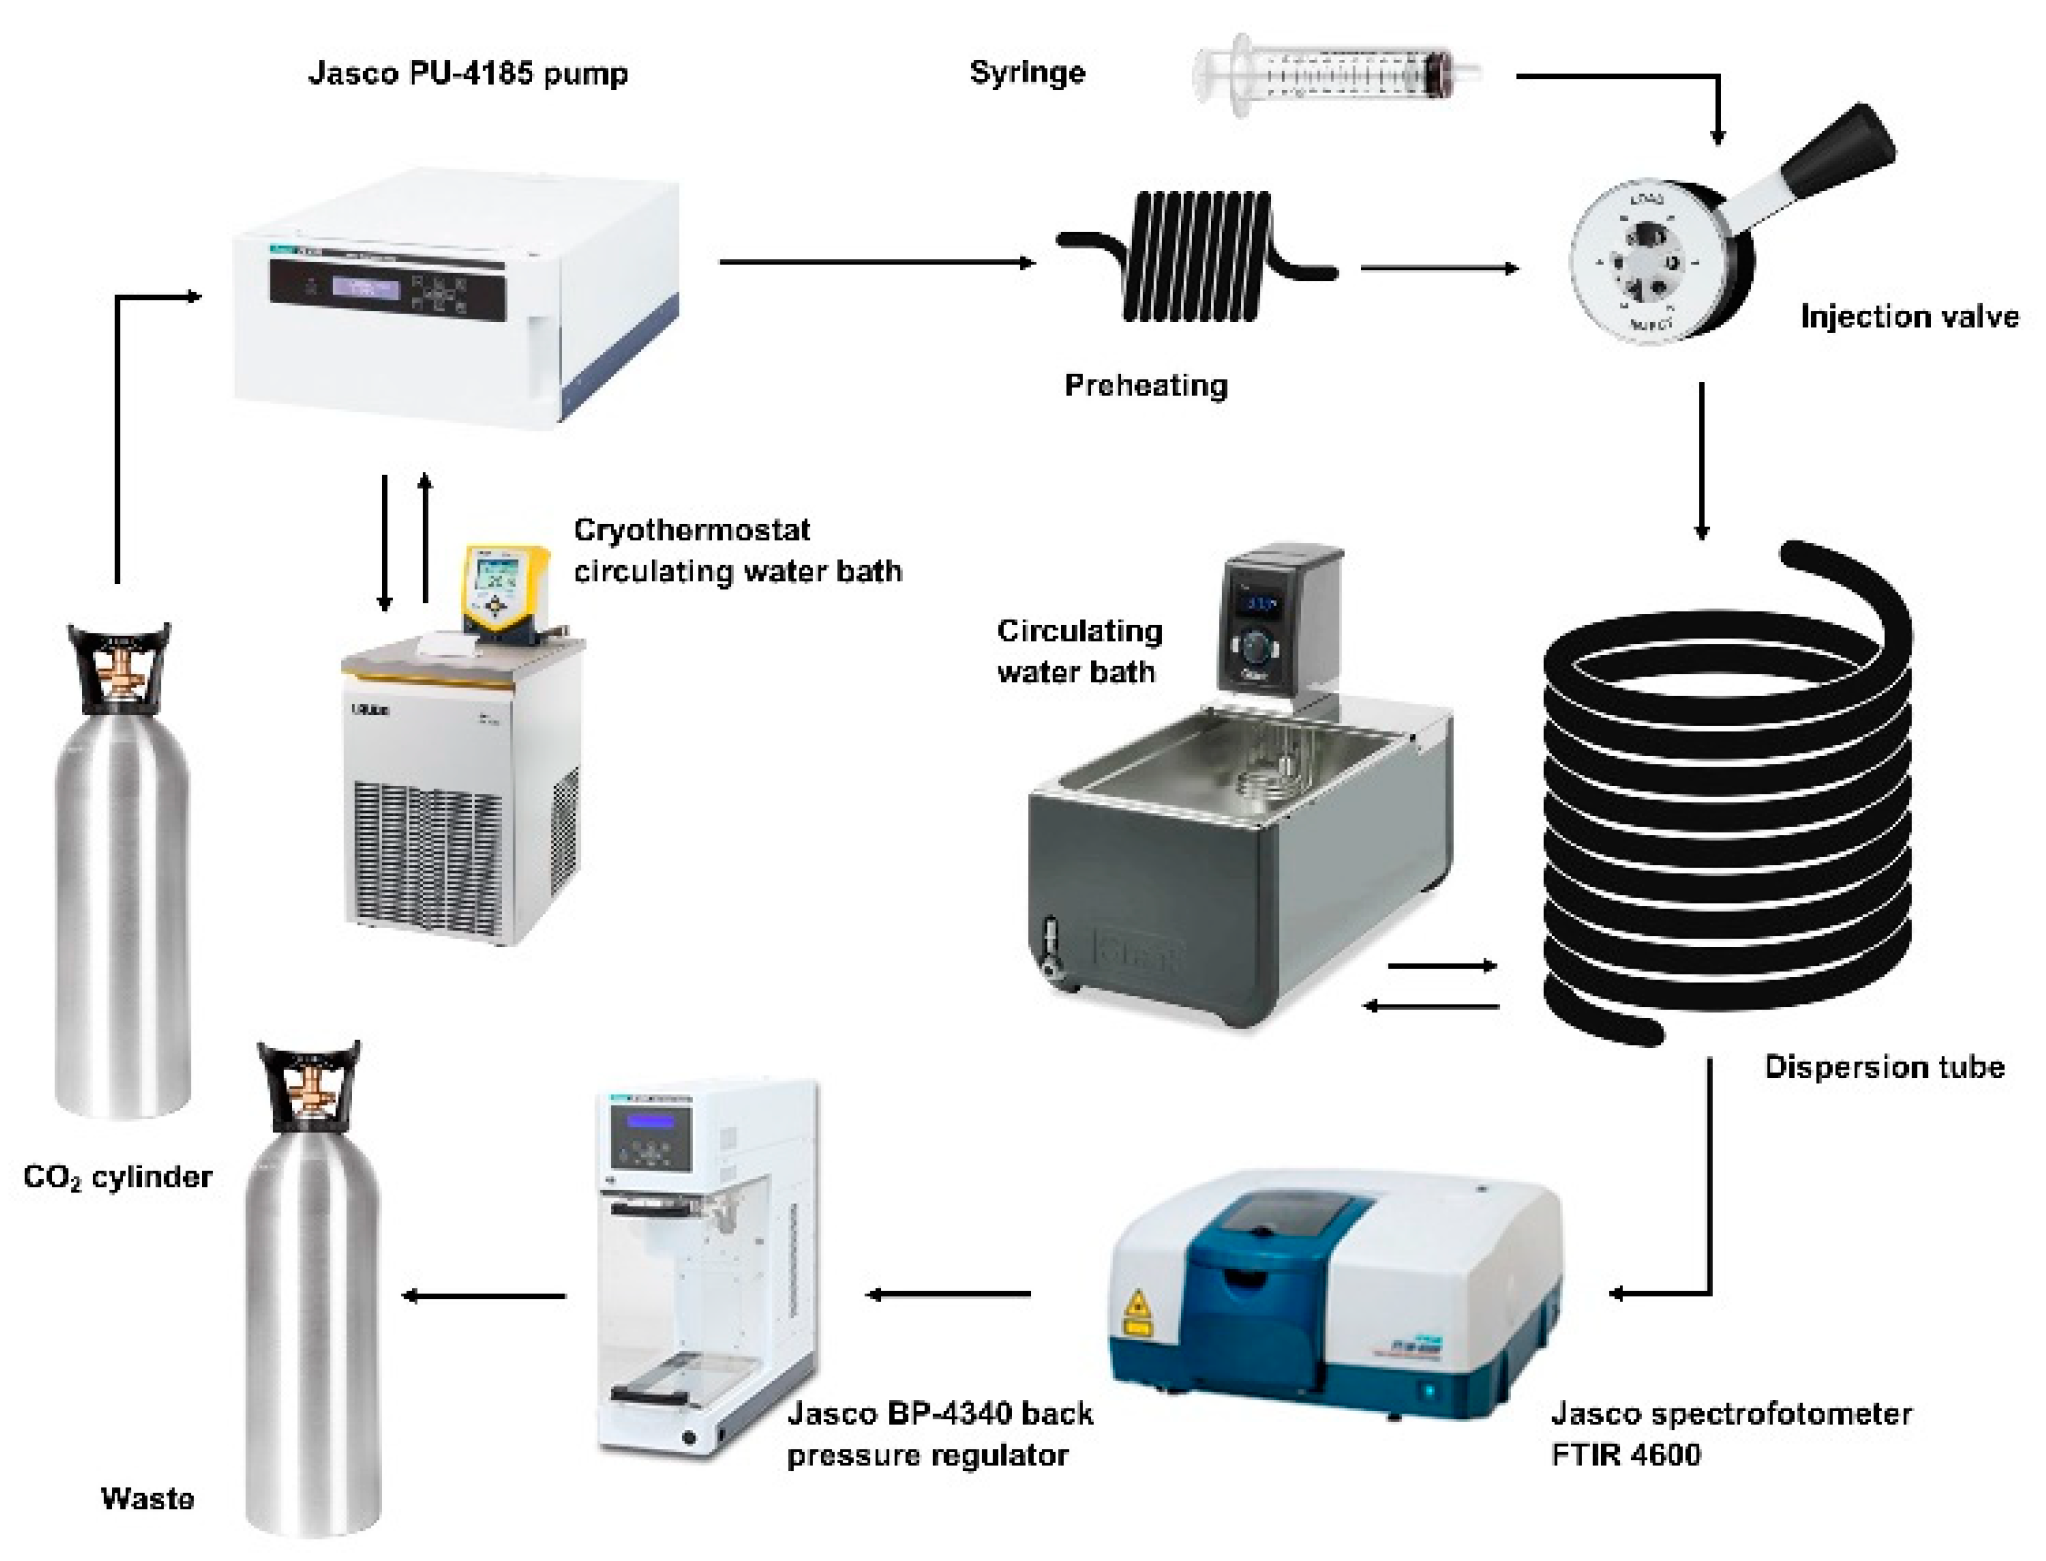
2.2. Equipment and Procedure

The present equipment was built based on the principle of the Taylor dispersion method and is represented in Figure 1. The basis of the method is as follows: when a pulse of a solute is injected into a solvent stream flowing under a laminar regime through a capillary tube of circular cross section, the pulse will broaden due to the combined action of convection along the longitudinal axis and molecular diffusion in the radial direction. A stainless-steel capillary tube of (30.916 ± 0.001) m length and 0.375 mm inner radii was used. It was coiled on a grooved aluminum cylinder in the form of a helix with 0.36 m diameter, for both support and temperature regulation, and kept at the study temperature ±0.1 K using a temperature-regulated water bath (Lauda Eco RE415G). At the start of each run, a pulse of 5 μL of pure solute was injected through a 6-port injection valve (Knauer model A1357) into CO2 at a constant flow rate of 0.3 cm3 min−1, maintained by a HPLC analytical pump (Jasco PU-4185). Attached to the pump head, there is a custom designed cooling device; temperature is regulated by a Peltier module and thermostated through a circulating water bath set to 260.15 K to ensure CO2 is in the liquid state and the pump can pressurize liquid CO2 above its critical pressure. At the pump outlet, a heat exchanger of about 1.5 m long is used for preheating subcooled liquid CO2 to its supercritical state before the injection valve. Dispersion of the injected samples was monitored at the outlet of the dispersion tube using an FT-IR refractometer (Jasco FT-IR 4600), equipped with a high-pressure demountable cell (Harrick). Response curves, corresponding to the changes in the flow with time were monitored in terms of absorbance/transmittance spectra at wavenumbers corresponding to different vibration modes of the studied molecules. The lower range of T and p parameters required to perform the diffusion study in supercritical CO2 is limited by the critical parameters of carbon dioxide: Tc = 304.18K and pc = 7.38MPa [22]. The detector is connected to a computer for digital data acquisition using the Spectra Manager software provided by Jasco. The pressure in the system was established by a back pressure regulator (Jasco BP-4340) and was controlled within ±0.05 MPa accuracy with a pressure sensor (Jumo dTrans p30). Data were recorded at increments of 4 cm−1 and at time intervals of 4 s, for each measurement. Diffusion coefficients are the average of 4 to 6 injections of sample.
To determine the diffusion coefficients from the response curve of the absorbance of the solute, we have adopted the same procedure that we apply in with a conventional Taylor refractive index refractometer [23,24,25,26], and assuming that small changes in concentration C are proportional to variations in absorbance, it is possible to extract the diffusion coefficients by fitting the experimentally measured signal to
A ( t ) = A 0 + A 1 t + A 2 t 2 + R ( C ( t ) C 0 ) = A 0 + A 1 t + A 2 t 2 + Δ A t R t exp ( 12 D ( t t R ) 2 R 2 t )
where the three first terms A0 + A1t + A2t2 consider the drift and curvature of the baseline due to small concentration and temperature variations; tR is retention time of the peak, R = (∂A/∂C)λ is the sensitivity of the detector (that depends on the wavenumber upon which the measurements are carried); ΔA is the peak height relative to the baseline. Diffusion coefficients D are then obtained by fitting the response curve to the theoretical solution expressed by Equation (1), withdrawing the baseline and offset.

3. Results and Discussion

3.1. Optimization of Experimental Parameters

Conventional setup for Taylor dispersion experiments generally adopts a refractive index detector (RID) [26,27,28], but these operate only in low pressure range, generally bellow 0.5 MPa. Performing measurements of diffusion in supercritical fluids requires a detector that can be equipped with high pressure cells [29,30], as it is the case of FT-IR spectrometers. Jasco FT-IR 4600 detector allows to perform measurements simultaneously in an extensive range of wavenumbers, and since the FT-IR spectra of a solute will reflect the vibration modes of that specific molecule, it will work as a digital fingerprint of the injected solute.
This means that, prior to any designed experiment, the IR transmittance spectra for the solute of interest must be analyzed against the infrared spectra for pure supercritical CO2. The latter presents three IR transparent regions ranging from 850–1200, 1400–2100, and 2600–3400 cm−1 [31], and thus meaning that it will be possible to detect to any vibrational modes of the solute molecules that appear in those regions.
Validation and optimization of the Taylor setup for high pressure was done by carrying out measurements of diffusion coefficients of toluene in supercritical CO2, and results have been compared against the available literature data [32,33,34,35,36]. An extensive description of all parameters’ optimization can be found elsewhere [37]. Transmittance spectra of pure toluene (see Figure 2) shows the lowest transmittance values (that is maximum absorbance) at wavenumbers 1506 cm−1, 2925 cm−1, and 3036 cm−1, which correspond, respectively, to C = C stretching, C-CH3, and aromatic C-H stretches. All of these vibration modes appear in the supercritical CO2 IR transparent regions; therefore, the detected signal corresponds to the dispersion of the pulse of injected toluene in supercritical CO2. Additionally, we have selected from the IR transmittance spectra for scCO2 a wavenumber at which absorbance is minimum, allowing us to control the stability of the baseline during the experiments.
The typical response curve for the injection of toluene in supercritical carbon dioxide is represented in Figure 3. It is possible to identify three peaks for toluene in supercritical CO2, by following the absorbance of the flow at the upper defined wavenumbers. The response curves show no peak tailing effects (their gaussian shape is symmetrical). Moreover, we have one response signal at wavenumber, 2100 cm−1, where absorption is minimum. The latter provides reference on the stability of the experiment, giving us the reading of a baseline signal, and it is noticeable that it remains stable during the measurements.
Diffusion coefficients for toluene in supercritical carbon dioxide were measured at 306.15 K and at 7.5 MPa, 10.5 MPa, and 12.5 MPa. The obtained diffusion coefficients are an average from 4 to 6 replicate dispersion profiles, and the standard deviation is estimated from the averaged diffusion coefficients over different wavenumbers for each run, over repeated runs. The obtained values are D = (2.89 ± 0.02) × 10−8 m2/s, D = (1.44 ± 0.03) × 10−8 m2/s and D = (1.14 ± 0.02) × 10−8 m2/s, respectively. As it was expected, observed diffusion coefficients decrease with the increase of pressure at a constant temperature.
Figure 4 shows the measured binary diffusion coefficients for toluene in supercritical carbon dioxide against supercritical carbon dioxide density. Values of density for supercritical carbon dioxide were obtained from NIST [38]. We can see that diffusion coefficients for toluene decrease with increasing density of scCO2, because the increase in density brings molecules in closer proximity, and the mean free path available is smaller. Moreover, we found an excellent agreement between our results and the available literature data [32,33,34,35,36,39], with less than 6% difference for the measurements in similar conditions of Sengers et al. [36] and Lai et al. [34].
Constrains usually applied to Taylor dispersion method [40] were also verified, namely:
(i)
Laminar regime of the solvent flow, with Reynolds number, Re ranging from 55 to 144 for supercritical CO2   ( R e = 2 a 0 u 0 ¯ ρ / η , where a0 is the radius of the tube, u 0 ¯ is the average velocity of the flow, ρ is the density, and η is the viscosity of the solvent);
(ii)
The peaks presented a Gaussian shape (D/ u ¯ L < 0.0024) [41];
(iii)
Secondary flow effects associated to coiled columns were negligible with De2Sc < 14, where De and Sc are the Dean and Schmidt numbers, respectively ( D e = R e ω 1 2 , ω = R c / a 0   and S c = η / ρ D , where Rc is the radius of dispersion coil).
This validates the high-pressure Taylor setup developed here for the measurement of diffusion coefficients in supercritical carbon dioxide.

3.2. Diffusion Coefficients for Ethanol in Supercritical CO2

Before the measurements of diffusion coefficients of ethanol in supercritical carbon dioxide, we have selected the working wavenumbers from the ethanol infrared spectrum. Due to the region of high absorbance in supercritical CO2 spectra, at wavelengths 3500–3800 cm−1, superimposed with main stretching frequencies for ethanol (O-H bond), this solute can be identified in an FTIR measurement by its bending frequencies [31]. Thus, we have followed the vibration modes response with time at the positions 1087 cm−1 (C–C single bond) and 2973 cm−1 (C–H aromatic bond) not existent in the solvent.
Diffusion coefficients for ethanol in supercritical carbon dioxide, at temperatures ranging from 306.15 to 331.15 K and pressure of 10.5 MPa are presented in Table 1 and were determined from four to six replicate dispersion profiles, together with the calculated density and viscosity [38] for supercritical carbon dioxide in the range of temperatures studied. The obtained diffusion coefficients are an average from 4 to 6 replicate dispersion profiles, and the standard deviation is estimated from the averaged diffusion coefficients over different wavenumbers for each run, over repeated runs.
The diffusion coefficient for ethanol in supercritical CO2, illustrated in Figure 5, increases with the increase of temperature, as expected. Values for diffusivities of ethanol in scCO2 are one order of magnitude higher than those in usual liquids (e.g., water) showing that supercritical CO2 special features, namely, gas-like viscosity and liquid-like density, facilitate mass transference, and this is of high importance considering its application in many pharmaceutical manufacturing processes, for example, in the preparation of drug release systems. Studies performed for this system in a different isobar [42] have shown that the relation is non-linear, and there is an inversion of the slope, corresponding to the region where the mobility (in terms of the inverse of the viscosity) is the maximum for CO2. Authors have related this change of slope to the so-called Widom line, corresponding to the transition between liquid-like and gas-like states, which would significantly affect the thermodynamic and transport properties of supercritical carbon dioxide, even in a region that is distant from the critical point. This trend is also observed in our case, and the inversion point occurs before, at around 322.15 K, corresponding to the maximum of mobility at 10.5 MPa (330.15 K for the 12.0 MPa isobar).
The operating conditions frequently fixed for the measurements of diffusion coefficients are temperature and pressure, which directly influence the solvent density and viscosity. In this way, it is interesting to examine the dependence of the diffusion coefficients D on carbon dioxide density, plotted in Figure 6. The diffusion coefficient for ethanol decreases with the increasing density of supercritical CO2, and the reason for this decrease is related to the larger number of molecular collisions and the lessened mean free path available for the molecules.
Several approaches for the estimate of diffusion coefficients in liquids have been proposed in the literature, and hydrodynamic models, based on the Stokes–Einstein equation [43], have shown to be a simple and useful tool to derive valuable information about the diffusion process. Wilke–Chang (WC) [44], Scheibel (Sch) [45] and Lusis–Ratcliff (LR) [46] are well known models developed for liquid systems and have recently been improved [47] aiming to provide precise estimates of diffusion coefficients in supercritical carbon dioxide. The above-mentioned models, together with the Lai–Tan (LT) [34] model, also based on hydrodynamic theory and validated for solutes diffusing in supercritical carbon dioxide, have been used to calculate the diffusion coefficients for ethanol in carbon dioxide. Equations (2)–(5) for the WC, Sch, LR, and LT models are presented below.
D W C = 7.4 × 10 8 T ϕ M 1 η 1 V b p , 2 0.6
D S c h = 8.2 × 10 8 T η 1 V b p , 2 1 / 3 [ 1 + ( 3 V b p , 1 V b p , 2 ) 2 3 ]
D L R = 8.52 × 10 8   T η 1 V b p , 1 1 / 3 [ 1.4 ( V b p , 1 V b p , 2 ) 1 3 + ( V b p , 1 V b p , 2 ) ]
D L T = 2.5 × 10 7 T M 1 ( 10 η 1 ) 0.688 V c , 2 1 / 3
In the Equations (2)–(5), temperature T is in K, η1 is the solvent viscosity in cP; φ is a dimensionless association factor of the solvent, M1 is the solvent molecular weight in g/mol, Vbp,1 and Vbp,2 are the solvent and solute molar volumes at their normal boiling points in cm3/mol, respectively, and Vc,2 is the solute critical volume in cm3/mol.
A general idea on the performance of these hydrodynamic models for the prediction of the diffusion coefficients can be obtained when examining the average absolute deviation (AAD) which comes defined as
A A D   ( % ) = 100 n i = 1 n | D e x p D p r e d D e x p |
where the subscripts “exp” and “pred” refer to the experimental and calculated diffusion coefficients, and n is the number of experimental points, in our case 28. Table 2 shows results for the various correlations tested for the prediction of diffusion coefficients of ethanol in supercritical CO2.
Although WC, Sch, and LS equations were derived from diffusion coefficients in solvents other than CO2, they can reasonably predict the diffusion coefficients in supercritical carbon dioxide, with values of AAD of 13 to 16%. The improved models can increase the accuracy of prediction, cutting AAD % to roughly half than the original equations. The Lai-Tan model shows an average absolute deviation of only 7%, so statistically, we should expect a very precise prediction of the diffusion coefficients. However, this statistical reading should be prudent, and a careful analysis should be carried out when applying these models over a broadened density range of the solvent, especially for supercritical carbon dioxide as in our case.
Values for the calculated diffusion coefficients for ethanol using the modified WC and LT models are presented in Figure 6. They show capacity to calculate relatively well the diffusion coefficients in the high-density range (15% or less deviation) but fail at lower densities of carbon dioxide, presenting deviations that can go up to 30%. All the other models show even higher deviations when used for prediction of individual points in the lower density range of carbon dioxide, with deviations that can range up to 60% from experimental data.
The Wilke–Chang model (Equation (2)) has been proposed in 1955, and so far, it remains one of the most extensively used equations to estimate binary diffusion coefficients, largely due to its simplicity, since it only requires simple information on the solvent and the solute and operating conditions like temperature. Bearing in mind that water is, by excellence, the most widely used solvent and the principal media to define the solubility of a drug, it is interesting to see that the predictions from the WC model for the diffusion coefficients of ethanol in aqueous solution would result in similar deviations (around 15%) towards experimental results [48], notwithstanding the different properties of water and scCO2. In fact, the one order of magnitude difference between the diffusion coefficients for ethanol in water (lower diffusivity) and in scCO2 (higher diffusivity) is the result of the latter characteristics of both liquid and gas because CO2 in its supercritical state exhibits viscosity and compressibility like a gas but density like a liquid, consequently facilitating mass transfer processes, an important feature when designing a drug delivery system. In general, the WC model shows to be a reasonably good model considering the needs of information on diffusivities of solutes in different media, not always available in the literature.
On the other hand, the deviations attained using the Lai–Tan model, a model validated by using a database for solutes diffusing in supercritical CO2, become even more significative when looking for an accurate prediction for a specific system in supercritical conditions, as it is the case with the data needed to model the nano devices for drug release systems using SAS technology. The authors of the Lai–Tan model believe that their approach fails in the supercritical region at lower densities due to the significant amount of clustering around the solutes, which results in an overestimation of the diffusion coefficients [34]; thus, the model still requires some improvement. The fact is, in the near critical region, which is in conditions close to the supercritical CO2 critical point, is where diffusion coefficients information is absent and where the theoretical models fail. Complexity in performing experiments together with the higher uncertainty of the data, caused by sharper fluctuations in density associated with the critical phase transition is the main issue. Improvement of experimental methods for the measurement of supercritical fluids, to be capable of more precise measures, is the first step to help overcome this lacune and provide information on mass transport data to build more accurate models. In effect, difficulty in predicting accurately the diffusion coefficients from the available theoretical models emphasizes the importance to achieve experimental data in the near critical region, even if measurements in critical conditions are difficult to perform. This does not only provide more accuracy for the development of supercritical based technologies for drug release production in the pharmaceutical industry but ultimately will help to progressively improve the actual prevision models to a point were experimental and estimation coincide.

4. Conclusions

Molecular diffusion coefficients for ethanol in supercritical CO2 were measured by the Taylor dispersion technique in the temperature range of 306.15 to 331.15 K and along the 10.5 MPa isobar. The obtained values ranged from 1.49 × 10⁻⁸ to 2.98 × 10⁻⁸ m2 s−1. D increased non-linearly with temperature and decreased with the increase of carbon dioxide density, and results were consistent with similar studies in the literature. Various correlation models were assessed to estimate the diffusion coefficients, with the best results obtained for the Wilke–Chang and Lai–Tan models but still with 15 to 30 % deviations, reinforcing the need to provide accurate experimental data on the diffusion coefficients, so both the pharmaceutical industry and the scientific community can better develop prevision models.

Author Contributions

Conceptualization and methodology C.I.A.V.S.; investigation: C.I.A.V.S. and M.C.F.B.., formal analysis, C.I.A.V.S. and A.C.F.R., writing–review and editing, C.I.A.V.S., A.C.F.R. and M.C.F.B. funding acquisition, C.I.A.V.S. and A.C.F.R. All authors have read and agreed to the published version of the manuscript.

Funding

This research was funded by FEDER–European Regional Development Fund through the COMPETE Programme and FCT-Fundação para a Ciência e a Tecnologia, for the KIDIMIX project POCI-01-0145-FEDER-030271, and by “The Coimbra Chemistry Centre” which is supported by the Fundação para a Ciência e a Tecnologia (FCT), Portuguese Agency for Scientific Research, through the programmes UIDB/00313/2020 e UIDP/00313/2020 and COMPETE.

Institutional Review Board Statement

Not applicable.

Informed Consent Statement

Not applicable.

Data Availability Statement

The data that support the findings of this study are available from the corresponding author upon reasonable request.

Conflicts of Interest

The authors declare no conflict of interest.

References

  1. Brunner, G. Applications of Supercritical Fluids. Annu. Rev. Chem. Biomol. Eng. 2010, 1, 321–342. [Google Scholar] [CrossRef] [PubMed]
  2. Davies, O.R.; Lewis, A.L.; Whitaker, M.J.; Tai, H.; Shakesheff, K.; Howdle, S.M. Applications of Supercritical CO2 in the Fabrication of Polymer Systems for Drug Delivery and Tissue Engineering. Adv. Drug Deliv. Rev. 2008, 60, 373–387. [Google Scholar] [CrossRef] [PubMed]
  3. Yasuji, T.; Takeuchi, H.; Kawashima, Y. Particle Design of Poorly Water-Soluble Drug Substances Using Supercritical Fluid Technologies. Adv. Drug Deliv. Rev. 2008, 60, 388–398. [Google Scholar] [CrossRef]
  4. Djerafi, R.; Masmoudi, Y.; Crampon, C.; Meniai, A.; Badens, E. Supercritical Anti-Solvent Precipitation of Ethyl Cellulose. J. Supercrit. Fluids 2015, 105, 92–98. [Google Scholar] [CrossRef]
  5. Yeo, S.-D.; Lim, G.-B.; Debendetti, P.G.; Bernstein, H. Formation of Microparticulate Protein Powder Using a Supercritical Fluid Antisolvent. Biotechnol. Bioeng. 1993, 41, 341–346. [Google Scholar] [CrossRef] [PubMed]
  6. Chattopadhyay, P.; Gupta, R.B. Production of Griseofulvin Nanoparticles Using Supercritical CO2 Antisolvent with Enhanced Mass Transfer. Int. J. Pharm. 2001, 228, 19–31. [Google Scholar] [CrossRef]
  7. Reverchon, E. Supercritical Antisolvent Precipitation of Micro- and Nano-Particles. J. Supercrit. Fluids 1999, 15, 1–21. [Google Scholar] [CrossRef]
  8. Thiering, R.; Dehghani, F.; Dillow, A.; Foster, N.R. Solvent Effects on the Controlled Dense Gas Precipitation of Model Proteins. J. Chem. Technol. Biotechnol. 2000, 75, 42–53. [Google Scholar] [CrossRef]
  9. Türk, M.; Hils, P.; Helfgen, B.; Schaber, K.; Martin, H.-J.; Wahl, M. Micronization of Pharmaceutical Substances by the Rapid Expansion of Supercritical Solutions (RESS): A Promising Method to Improve Bioavailability of Poorly Soluble Pharmaceutical Agents. J. Supercrit. Fluids 2002, 22, 75–84. [Google Scholar] [CrossRef]
  10. Phillips, E.M.; Stella, V.J. Rapid Expansion from Supercritical Solutions: Application to Pharmaceutical Processes. Int. J. Pharm. 1993, 94, 1–10. [Google Scholar] [CrossRef]
  11. Dixon, D.J.; Johnston, K.P.; Bodmeier, R.A. Polymeric Materials Formed by Precipitation with a Compressed Fluid Antisolvent. AIChE J. 1993, 39, 127–139. [Google Scholar] [CrossRef]
  12. Benedetti, L.; Bertucco, A.; Pallado, P. Production of Micronic Particles of Biocompatible Polymer Using Supercritical Carbon Dioxide. Biotechnol. Bioeng. 1997, 53, 232–237. [Google Scholar] [CrossRef]
  13. Young, T.J.; Johnston, K.P.; Mishima, K.; Tanaka, H. Encapsulation of Lysozyme in a Biodegradable Polymer by Precipitation with a Vapor-over-Liquid Antisolvent. J. Pharm. Sci. 1999, 88, 640–650. [Google Scholar] [CrossRef] [PubMed]
  14. Badens, E.; Magnan, C.; Charbit, G. Microparticles of Soy Lecithin Formed by Supercritical Processes. Biotechnol. Bioeng. 2000, 72, 194–204. [Google Scholar] [CrossRef]
  15. Gref, R.; Minamitake, Y.; Peracchia, M.T.; Trubetskoy, V.; Torchilin, V.; Langer, R. Biodegradable Long-Circulating Polymeric Nanospheres. Science 1994, 263, 1600–1603. [Google Scholar] [CrossRef] [Green Version]
  16. Subra, P.; Jestin, P. Powders Elaboration in Supercritical Media: Comparison with Conventional Routes. Powder Technol. 1999, 103, 2–9. [Google Scholar] [CrossRef]
  17. Ventosa, N.; Sala, A.S.; Veciana, J.; Torres, J.; Llibre, J. Depressurization of an Expanded Liquid Organic Solution (DELOS): A New Procedure for Obtaining Submicron- or Micron-Sized Crystalline Particles. Cryst. Growth Des. 2001, 1, 299–303. [Google Scholar] [CrossRef]
  18. Behnejad, H.; Sengers, J.V.; Anisimov, M.A. Chapter 10: Thermodynanic Behaviour of Fluids near Critical Points. In Applied Thermodynamics of Fluids; RSC Publishing: Cambridge, UK, 2010; Volume 8, pp. 321–367. ISBN 9781849730983. [Google Scholar]
  19. Bush, J.R.; Akgerman, A.; Hall, K.R. Synthesis of Controlled Release Device with Supercritical CO2 and Co-Solvent. J. Supercrit. Fluids 2007, 41, 311–316. [Google Scholar] [CrossRef]
  20. Al-Hamimi, S.; Mayoral, A.A.; Cunico, L.P.; Turner, C. Carbon Dioxide Expanded Ethanol Extraction: Solubility and Extraction Kinetics of α-Pinene and cis-Verbenol. Anal. Chem. 2016, 88, 4336–4345. [Google Scholar] [CrossRef] [Green Version]
  21. Araus, K.A.; Casado, V.; del Valle, J.M.; Robert, P.S.; de la Fuente, J.C. Cosolvent Effect of Ethanol on the Solubility of Lutein in Supercritical Carbon Dioxide. J. Supercrit. Fluids 2018, 143, 205–210. [Google Scholar] [CrossRef]
  22. Suehiro, Y.; Nakajima, M.; Yamada, K.; Uematsu, M. Critical Parameters of {xCO2+ (1−x) CHF3} forx= (1.0000, 0.7496, 0.5013, and 0.2522). J. Chem. Thermodyn. 1996, 28, 1153–1164. [Google Scholar] [CrossRef]
  23. Tyrell, H.J.V.; Harris, K.R. Diffusion in Liquids, A Theoretical and Experimental Study; Butterworths-Heinemann: Oxford, UK, 1985. [Google Scholar]
  24. Callendar, R.; Leaist, D.G. Diffusion Coefficients for Binary, Ternary, and Polydisperse Solutions from Peak-Width Analysis of Taylor Dispersion Profiles. J. Solut. Chem. 2006, 35, 353–379. [Google Scholar] [CrossRef]
  25. Leaist, D.G. Ternary Diffusion Coefficients of 18-Crown-6 Ether–KCl–Water by Direct Least-Squares Analysis of Taylor Dispersion Measurements. J. Chem. Soc. Faraday Trans. 1991, 87, 597–601. [Google Scholar] [CrossRef]
  26. Santos, C.; Ribeiro, A.C.F.; Esteso, M.A. Drug Delivery Systems: Study of Inclusion Complex Formation between Methylxanthines and Cyclodextrins and Their Thermodynamic and Transport Properties. Biomolecules 2019, 9, 196. [Google Scholar] [CrossRef] [Green Version]
  27. Santos, C.I.; Esteso, M.A.; Lobo, V.M.; Cabral, A.M.; Ribeiro, A.C. Taylor Dispersion Technique as a Tool for Measuring Multicomponent Diffusion in Drug Delivery Systems at Physiological Temperature. J. Chem. Thermodyn. 2015, 84, 76–80. [Google Scholar] [CrossRef]
  28. Santos, C.I.; Ramos, M.L.; Justino, L.L.; Burrows, H.D.; Valente, A.J.; Esteso, M.A.; Leaist, D.G.; Ribeiro, A.C. Effect of pH in the Structure and Mass Transport by Diffusion of Theophylline. J. Chem. Thermodyn. 2017, 110, 162–170. [Google Scholar] [CrossRef]
  29. Secuianu, C.; Maitland, G.C.; Trusler, J.P.M.; Wakeham, W.A. Mutual Diffusion Coefficients of Aqueous KCl at High Pressures Measured by the Taylor Dispersion Method. J. Chem. Eng. Data 2011, 56, 4840–4848. [Google Scholar] [CrossRef]
  30. Cadogan, S.P.; Maitland, G.; Trusler, J.P.M. Diffusion Coefficients of CO2 and N2 in Water at Temperatures between 298.15 K and 423.15 K at Pressures up to 45 MPa. J. Chem. Eng. Data 2014, 59, 519–525. [Google Scholar] [CrossRef] [Green Version]
  31. Morin, P.; Caude, M.; Richard, H.; Rosset, R. Carbon Dioxide Supercritical Fluid Chromatography-Fourier Transform Infrared Spectrometry. Chromatographia 1986, 21, 523–530. [Google Scholar] [CrossRef]
  32. Lee, C.H.; Holder, G.D. Use of Supercritical Fluid Chromatography for Obtaining Mass Transfer Coefficients in Fluid-Solid Systems at Supercritical Conditions. Ind. Eng. Chem. Res. 1995, 34, 906–914. [Google Scholar] [CrossRef]
  33. Suárez, J.J.; Medina, I.; Bueno, J.L. Diffusion Coefficients in Supercritical Fluids: Available Data and Graphical Correlations. Fluid Phase Equilibria 1998, 153, 167–212. [Google Scholar] [CrossRef]
  34. Lai, C.-C.; Tan, C.-S. Measurement of Molecular Diffusion Coefficients in Supercritical Carbon Dioxide Using a Coated Capillary Column. Ind. Eng. Chem. Res. 1995, 34, 674–680. [Google Scholar] [CrossRef]
  35. Bruno, T. A Supercritical Fluid Chromatograph for Physicochemical Studies. J. Res. Natl. Bur. Stand. 1989, 94, 105–112. [Google Scholar] [CrossRef]
  36. Sengers, J.M.H.L.; Deiters, U.; Klask, U.; Swidersky, P.; Schneider, G.M. Application of the Taylor Dispersion Method in Supercritical Fluids. Int. J. Thermophys. 1993, 14, 893–922. [Google Scholar] [CrossRef]
  37. Santos, C.I.A.V.; Barros, M.C.F.; Faro, M.P.R.T.; Ribeiro, A.C.F. FTIR as Powerful Tool for Measurements of Diffusion in Supercritical Carbon Dioxide Using Taylor Dispersion Method. Microgravity Sci. Technol. 2022; to be submitted. [Google Scholar]
  38. Lemmon, E.W.; McLinden, M.O.; Friend, D.G. Thermophysical Properties of Fluid Systems. In NIST Chemistry Webbook; NIST Standard Reference Database: Gaitherburg, MD, USA, 2017; No. 69. [Google Scholar]
  39. Bueno, J.L.; Suarez, J.J.; Dizy, J.; Medina, I. Infinite Dilution Diffusion Coefficients: Benzene Derivatives as Solutes in Supercritical Carbon Dioxide. J. Chem. Eng. Data 1993, 38, 344–349. [Google Scholar] [CrossRef]
  40. Alizadeh, A.; De Castro, C.A.N.; Wakeham, W.A. The Theory of the Taylor Dispersion Technique for Liquid Diffusivity Measurements. Int. J. Thermophys. 1980, 1, 243–284. [Google Scholar] [CrossRef]
  41. Levenspiel, O.; Smith, W. Notes on the Diffusion-Type Model for the Longitudinal Mixing of Fluids in Flow. Chem. Eng. Sci. 1995, 50, 3891–3896. [Google Scholar] [CrossRef]
  42. Gaponenko, Y.; Gousselnikov, V.; Santos, C.; Shevtsova, V. Near-Critical Behavior of Fick Diffusion Coefficient in Taylor Dispersion Experiments. Microgravity Sci. Technol. 2019, 31, 475–486. [Google Scholar] [CrossRef]
  43. Hertz, H.G. T. Erdey-Grúz: Transport Phenomena in Aqueous Solutions; 512 Seiten, Berichte der Bunsengesellschaft für physikalische Chemie; Adam Hilger Ltd.: London, UK, 1975; Volume 79, p. 841. [Google Scholar] [CrossRef]
  44. Wilke, C.R.; Chang, P. Correlation of Diffusion Coefficients in Dilute Solutions. AIChE J. 1955, 1, 264–270. [Google Scholar] [CrossRef]
  45. Scheibel, E.G. Correspondence. Liquid Diffusivities. Viscosity of Gases. Ind. Eng. Chem. 1954, 46, 2007–2008. [Google Scholar] [CrossRef]
  46. Lusis, M.A.; Ratcliff, C.A. Diffusion in Binary Liquid Mixtures at Infinite Dilution. Can. J. Chem. Eng. 1968, 46, 385–387. [Google Scholar] [CrossRef]
  47. Vaz, R.V.; Magalhães, A.L.; Silva, C.M. Improved Stokes–Einstein Based Models for Diffusivities in Supercritical CO2. J. Taiwan Inst. Chem. Eng. 2014, 45, 1280–1284. [Google Scholar] [CrossRef]
  48. Tyn, M.T.; Calus, W.F. Temperature and Concentration Dependence of Mutual Diffusion Coefficients of Some Binary Liquid Systems. J. Chem. Eng. Data 1975, 20, 310–316. [Google Scholar] [CrossRef]
Figure 1. Schematic representation of high-pressure Taylor dispersion set-up.
Processes 10 00660 g001
Figure 2. Transmittance in the infrared spectrum of Toluene at 298.15 K and 101.3 kPa.
Processes 10 00660 g002
Figure 3. Typical response curves for toluene in supercritical carbon dioxide at different wavenumbers.
Processes 10 00660 g003
Figure 4. Diffusion coefficient for toluene in scCO2 and comparison with literature data [32,33,34,35,36,39].
Processes 10 00660 g004
Figure 5. Diffusion coefficient for ethanol in scCO2 and comparison with literature data [42].
Processes 10 00660 g005
Figure 6. Experimental and calculated diffusion coefficient for ethanol in scCO2 at pressure p = 10.5 MPa and temperatures from 306.15 to 331.15 K.
Processes 10 00660 g006
Table 1. Measured diffusion coefficients D for ethanol in supercritical CO2 at pressure p =10.5 MPa and calculated density ρ and viscosity η [38] for supercritical CO2 at different temperatures from 306.15 to 331.15 K.
T/Kρ/kg/m3η/(10−5 cP)(D ± SD) a/(10−8 m2 s−1)
306.15752.306.371.49 ± 0.01
311.15690.795.511.69 ± 0.04
316.15604.794.521.98 ± 0.05
321.15489.183.492.10± 0.08
326.15393.922.852.57 ± 0.09
331.15338.032.572.98 ± 0.15
a Standard deviation of the mean. Standard uncertainties are uc(T) = 0.01 K and uc(P) = 0.005 MPa. The expanded uncertainties uc(D) ≅ 0.05 × 10⁻⁸ m2 s−1 (level of confidence 0.95).
Table 2. The average absolute deviation (AAD) for the hydrodynamic models adopted for the prediction of the diffusion coefficients for ethanol in supercritical carbon dioxide.
ModelAAD %
OriginalModified
Wilke–Chang (Equation (2))13.2 a5.8 e
Scheibel (Equation (3))16.4 b12.7 e
Lusis–Ratcliff (Equation (4))15.8 c7.4 e
Lai-Tan (Equation (5))6.8 d
a [44], b [45], c [46], d [34], e [47], n is 28.
Publisher’s Note: MDPI stays neutral with regard to jurisdictional claims in published maps and institutional affiliations.

