Article

The Mechanism Research of Low-Frequency Pressure Oscillation in the Feeding Pipe of Cryogenic Rocket Propulsion System

1
State Key Laboratory of Technologies in Space Cryogenic Propellants, Beijing 100028, China
2
Institute of Refrigeration and Cryogenic Engineering, Xi’an Jiaotong University, Xi’an 710049, China
*
Author to whom correspondence should be addressed.
Processes 2022, 10(11), 2448; https://doi.org/10.3390/pr10112448
Submission received: 30 October 2022 / Revised: 15 November 2022 / Accepted: 16 November 2022 / Published: 18 November 2022
(This article belongs to the Special Issue CFD Applications in Heat Transfer Research and Simulation)

Abstract

:
In the propulsion system of cryogenic liquid rockets, low-frequency pressure oscillation is a long-standing issue occurring in its feeding pipe, and is not conducive to the normal operation of the rocket. Its mechanism and excitation process are not very clear due to the limitation of the existing numerical method and the difficulty of the real dynamic experiment. Inspired by the periodic suck-back flow phenomenon of steam condensation, the fluctuation of the two-phase interface might be the crucial factor to initiate the low-frequency pressure oscillation. To simulate this interfacial characteristic of cryogenic propellant, a novel numerical model is proposed to predict the mass transfer rate weighted by the interfacial curvature. Aiming at the oxygen jet condensation simulation, the low-frequency pressure oscillation phenomenon is obtained successfully with the excitation frequency of 10.6 Hz, consistent with the natural frequency of the engine test run. It is conducted so the low-frequency pressure oscillation is caused by the periodic condensation of the continuous oxygen vapour plume, along with an oxygen suck-back flow phenomenon. In addition, the results indicate that both the oxygen and liquid oxygen mass flux promote the rise in the frequency of pressure oscillation. These conclusions provide theoretical instructions for the design and operation of the propulsion system of a cryogenic liquid rocket.

1. Introduction

Low-frequency pressure oscillation is a long-standing issue occurring in the feeding pipe of the cryogenic rocket-propulsion system [1]. It is harmful to the normal operation of the cryogenic rocket engine, which may occur at any moment during the launch flight. It will cause the resonance phenomenon of the rocket, resulting in structural damage. Figure 1a shows the typical pressure oscillation curves of the feeding pipe system during the whole rocket flight. From the enlarged view in Figure 1b, the fluctuation phenomenon exhibits low-frequency characteristics with a frequency of approximately 7~8 Hz. There is a consensus [1,2] that low-frequency pressure oscillation occurs in the liquid oxygen-feeding pipe of the propulsion system. It may be relevant to the oxygen jet condensation in the oxygen delivery pipe. However, the mechanism of low-frequency pressure oscillation is not very clear yet. Further fundamental research is needed on the excitation frequency of the pressure oscillation in oxygen jet condensation.
Few scholars have investigated the mechanism of pressure oscillation in the feeding pipe system. Up to now, the prevailing view [1,3,4,5] is that the low-frequency pressure oscillation is caused by the oxygen jet condensation process in liquid-oxygen flow in the delivery pipeline. Chen et al. [1] studied the intrinsic frequency of the oxygen-feeding system using the acoustic theory and the second-order intrinsic frequency was 8.77 Hz. Chen et al. [5] conducted a modal analysis on the YF-100 engine system and the first-order intrinsic frequency was 14.2 Hz. Zhang et al. [4] adopted the transfer matrix model and obtained the second-order intrinsic frequency of 11 Hz. However, these studies can only obtain the intrinsic frequency of the liquid oxygen feeding-pipe system, which is the inherent attribute of the system. These results cannot reveal the mechanism of the pressure oscillation. Therefore, to validate the mechanism of pressure oscillation in the propulsion system, it is essential to study the oxygen-jet condensation process and eventually obtain the excitation frequency of pressure fluctuation.
Oxygen jet condensation is a form of direct contact condensation (DCC) with cryogenic fluid. The DCC process has been widely used in many industrial applications due to its high efficiency of heat and mass transfer. The experimental method is mainly used in this field, and there is very little numerical research on pressure oscillation in the DCC process. It is difficult to calculate the pressure oscillation frequency accurately [6]. Mass transfer rate evaluation through the two-phase interface is the key to the DCC numerical simulation. The energy balance model [7] is the most acceptable mass-transfer model and is commonly used in the research of submerged condensation [8,9,10,11] and flow condensation [12,13,14]. However, in this model, the interfacial area density is always treated by the algebraic spherical model, and the mean bubble diameter (dg) is estimated by Anglart and Nylund’s [15] experimental correlation. This method is just a numerical simplification without enough physical basis, which cannot reflect the real interfacial oscillation characteristics and will obtain an inaccurate result. For example, Tanskanen et al. [6] also found that the oscillation frequency of the simulation was higher than that of the experiment. Li et al. [12,13,16] conducted the steam flow condensation simulation by the energy balance model and found that the frequency was overestimated. The experimental data for the large and small chugging frequencies were 3.7 Hz and 9 Hz, while the numerical data were 6 Hz and 13 Hz, respectively [16], with a big deviation of about 44~62%. Therefore, it is necessary to develop an accurate mass transfer model for direct contact condensation simulation.
In this paper, to reveal the mechanism of low-frequency pressure oscillation, an oxygen jet condensation numerical simulation is conducted using a novel mass-transfer model. The model combines the mass transfer rate and the curvature of the two-phase interface, which can be calculated by the height function method. The new model is convincing by the verification of a steam flow condensation simulation. The numerical results of low-frequency pressure oscillation can be obtained by the new model successfully.

2. Numerical Method Description

2.1. Mass and Heat Transfer

This section describes the novel model to calculate the interfacial mass-transfer rate based on the energy balance mass transfer model. The novelty of the new model lies in the improvement of the algorithm for the interfacial area density. In the conventional form of the energy balance mass-transfer model, the interfacial area density is treated as a constant or calculated by the empirical correlation. In the new model, the interfacial area density is real-time evaluated by the mean bubble diameter, the reciprocal of the interfacial curvature. The height function method is introduced to estimate the interfacial curvature. In this way, the fluctuation of the vapour–liquid interface can be expressed by the interfacial area density, which will be delivered to the new model to update the distribution of the interfacial mass-transfer rate. This numerical treatment is the key to the accurate capture of low-frequency pressure oscillation in oxygen jet condensation. The specific volumetric mass source term is described in the following form.
For the condensation process (T < Tsat):
S v = S l = k v α v T   n ^ h L ρ A i
For the evaporation process (T > Tsat):
S v = S l = k l α l T   n ^ h L ρ A i
where the interfacial unit normal vector   n ^ = α l / α l ; hL is the latent heat of condensation; the phase volume fraction term is added to Equation (1) to maintain the calculation stability. For the condensation process, the mass is transferred from the vapour phase to the liquid phase. The phase interface and liquid are both at saturated temperature with no heat flux. Only the heat flux between the interface and vapour is considered, so the thermal conductivity of vapour kv is used in Equation (1a) for heat flux calculation. Similarly, for the evaporation process, the thermal conductivity of liquid kl is included in Equation (1b).
Based on the volumetric mass source term, the energy source term is the product of the mass transfer rate and the latent heat of condensation.
For the condensation process (T < Tsat):
S h = k v α v T   n ^ ρ A i
For the evaporation process (T > Tsat):
S h = k l α l T   n ^ ρ A i
In Equations (1) and (2), the interfacial area density ρ A i is calculated by the algebraic spherical method. However, the mean bubble diameter d g is the reciprocal of the interfacial curvature κ with a strict physical basis. The interfacial curvature is estimated by the height function method f H F , described in [17,18]. This is the key to the whole novel mass-transfer model.
ρ A i = 6 d g ,   d g = 2 κ ,   κ = f H F ( α v )
The height function method has been widely used in the simulation of surface tension force based on the volume of fluid (VOF) or level set (LS) model. It is used to obtain a more accurate curvature value of the phase interface. Guo et al. [17,18] have proposed a modified both 2D and 3D height-function method to replace the default continuum surface force (CSF) model. The height function method is implemented into the commercial software ANSYS Fluent by the User Defined Function (UDF) and the detailed procedures can be referred to [17].

2.2. Governing Equations

The volume of fluid (VOF) method is used to capture the two-phase interface [2]. The governing equations of continuity, momentum, and energy are described as follows.
For the numerical simulation of pressure oscillation, the compressible vapour phase is recommended to be set for the primary phase. The continuity equation of mass conservation for the second phase, the liquid phase, is shown as:
t ( α l ρ l ) + ( α l ρ l v l ) = ( m ˙ v l m ˙ l v )
The term on the right hand m ˙ v l is the mass transfer rate from the vapour phase to the liquid phase, described in Section 2.1. The volume fraction of the primary phase is calculated in the following form:
α l + α v = 1
The momentum and energy equations are solved throughout the mixture phase level, shown in Equations (6) and (7) and the obtained velocity and temperature fields are shared among the vapour and liquid phase:
t ( ρ m v ) + ( ρ m v v ) = p + [ μ m ( v + v T ) ] + ρ m g + F v o l
t ( ρ m E ) + [ v ( ρ m E + p ) ] = k e f f T + S h
where the effective thermal conductivity k e f f is the sum of mean thermal conductivity k m and turbulent effect c p / μ Pr . The term F v o l in the momentum equation describes the interfacial surface tension and it is a form of external body force deduced from the surface force based on the continuum surface force (CSF) model [19]:
F v o l = σ 2 ρ m κ α ρ v + ρ l
where κ is the interfacial curvature, calculated by the height function method. The source term Sh is the heat flux, generated from the interfacial mass transfer process described in Section 2.1.
In the above equations, the physical properties with subscript m can be determined by the phase volume fraction in each cell of the domain, shown in Equation (9). The symbol ϕ represents the density, viscosity, and thermal conductivity:
ϕ m = α v ϕ v + α l ϕ l
The detached eddy simulation (DES) model is employed for the turbulent flow, which combines the best of both the large eddy simulation (LES) model and the SST k ω turbulence model. The SIMPLE algorithm is adopted to couple pressure and velocity.

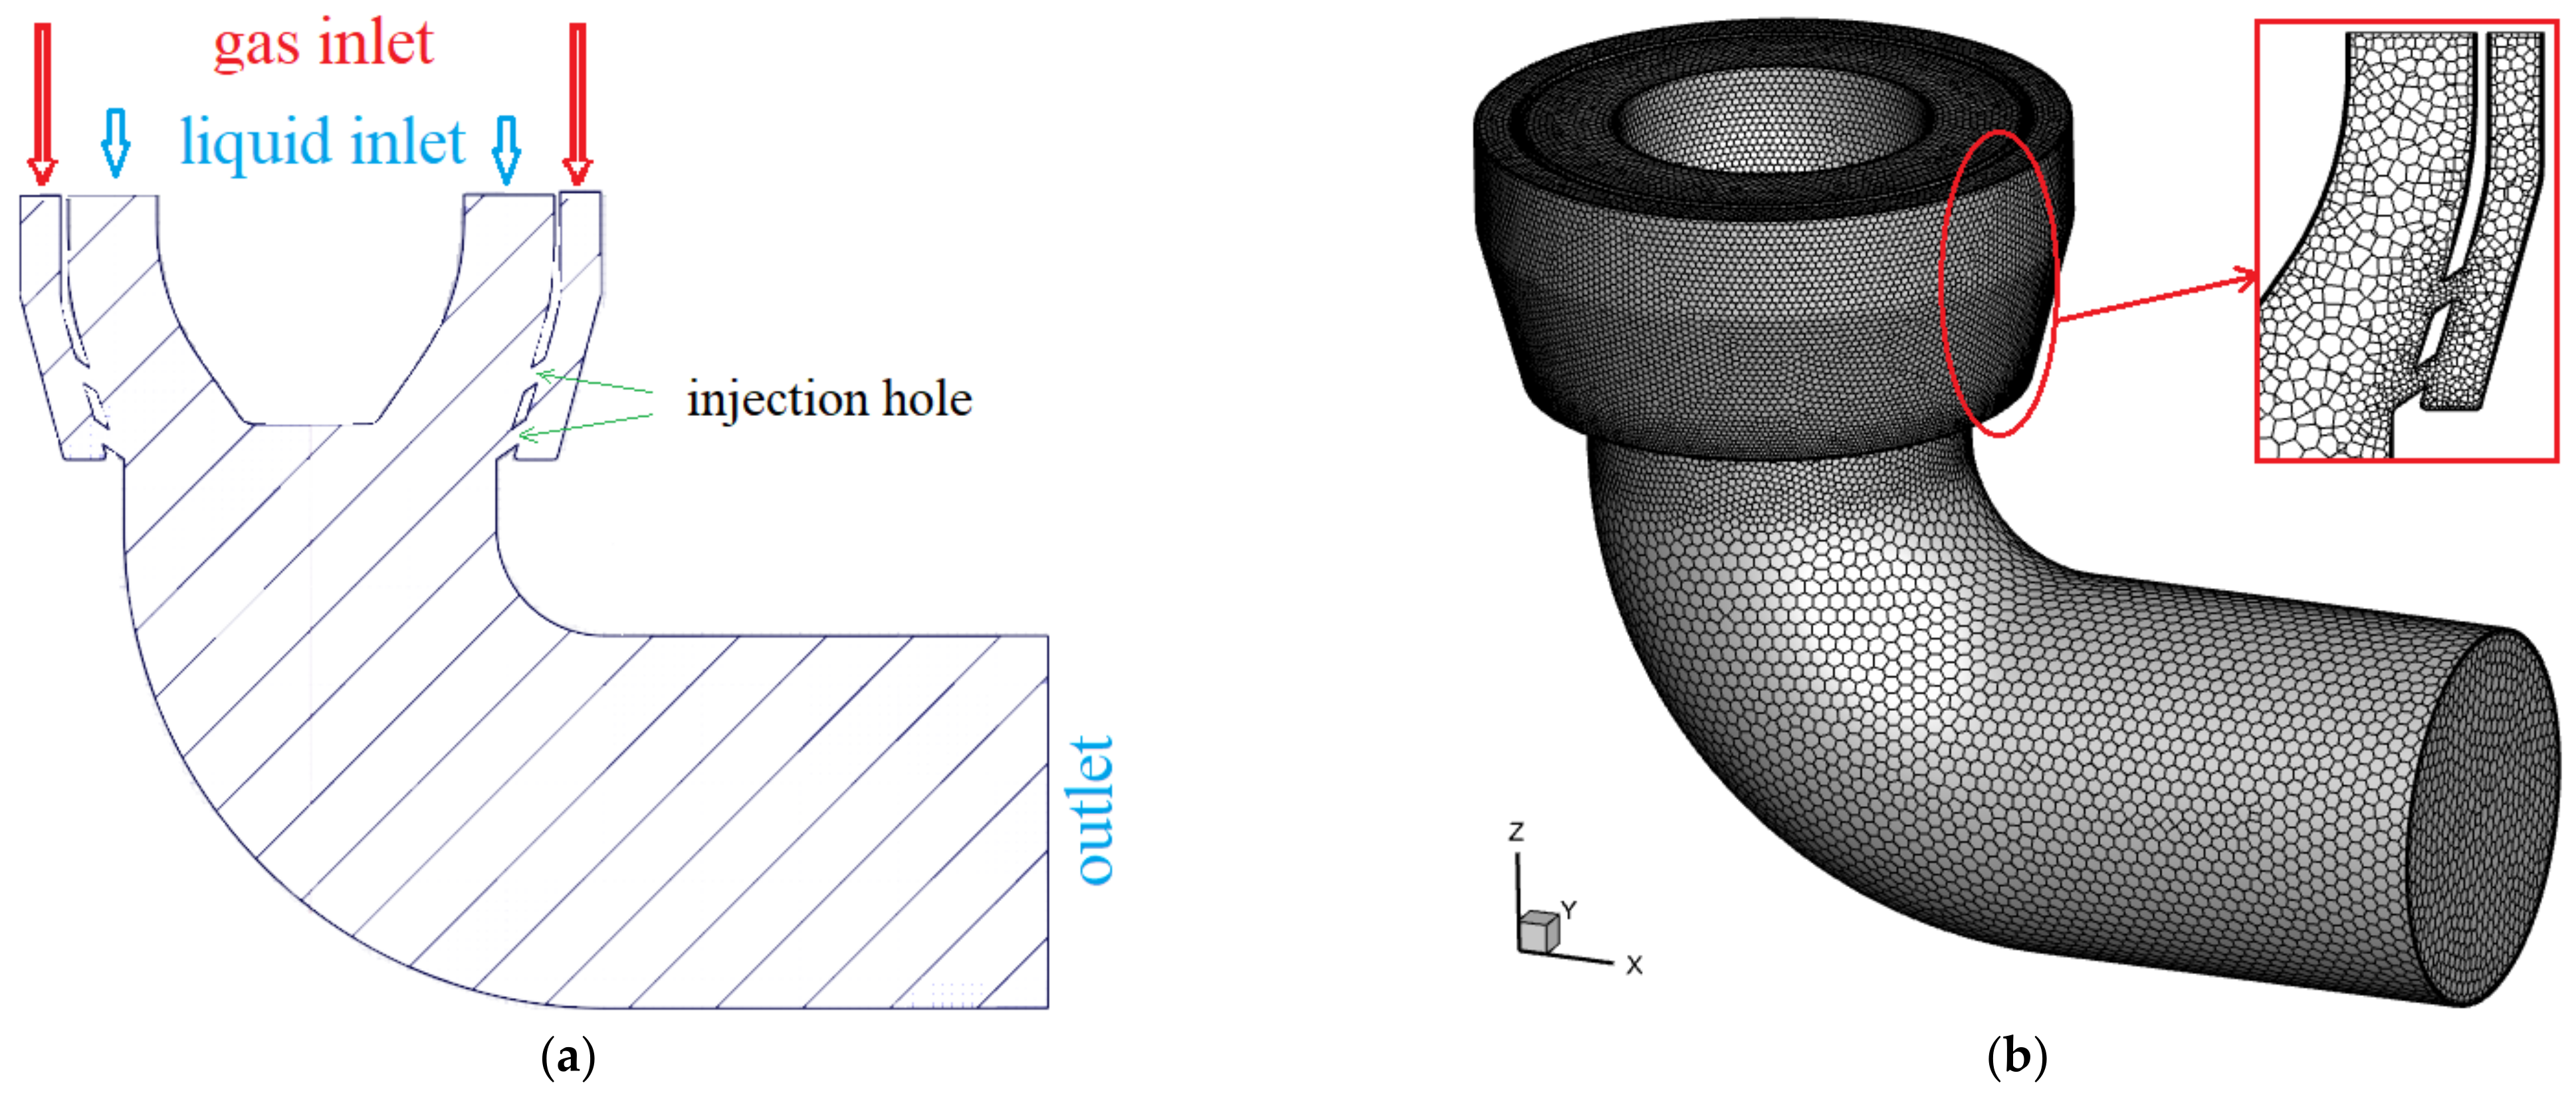
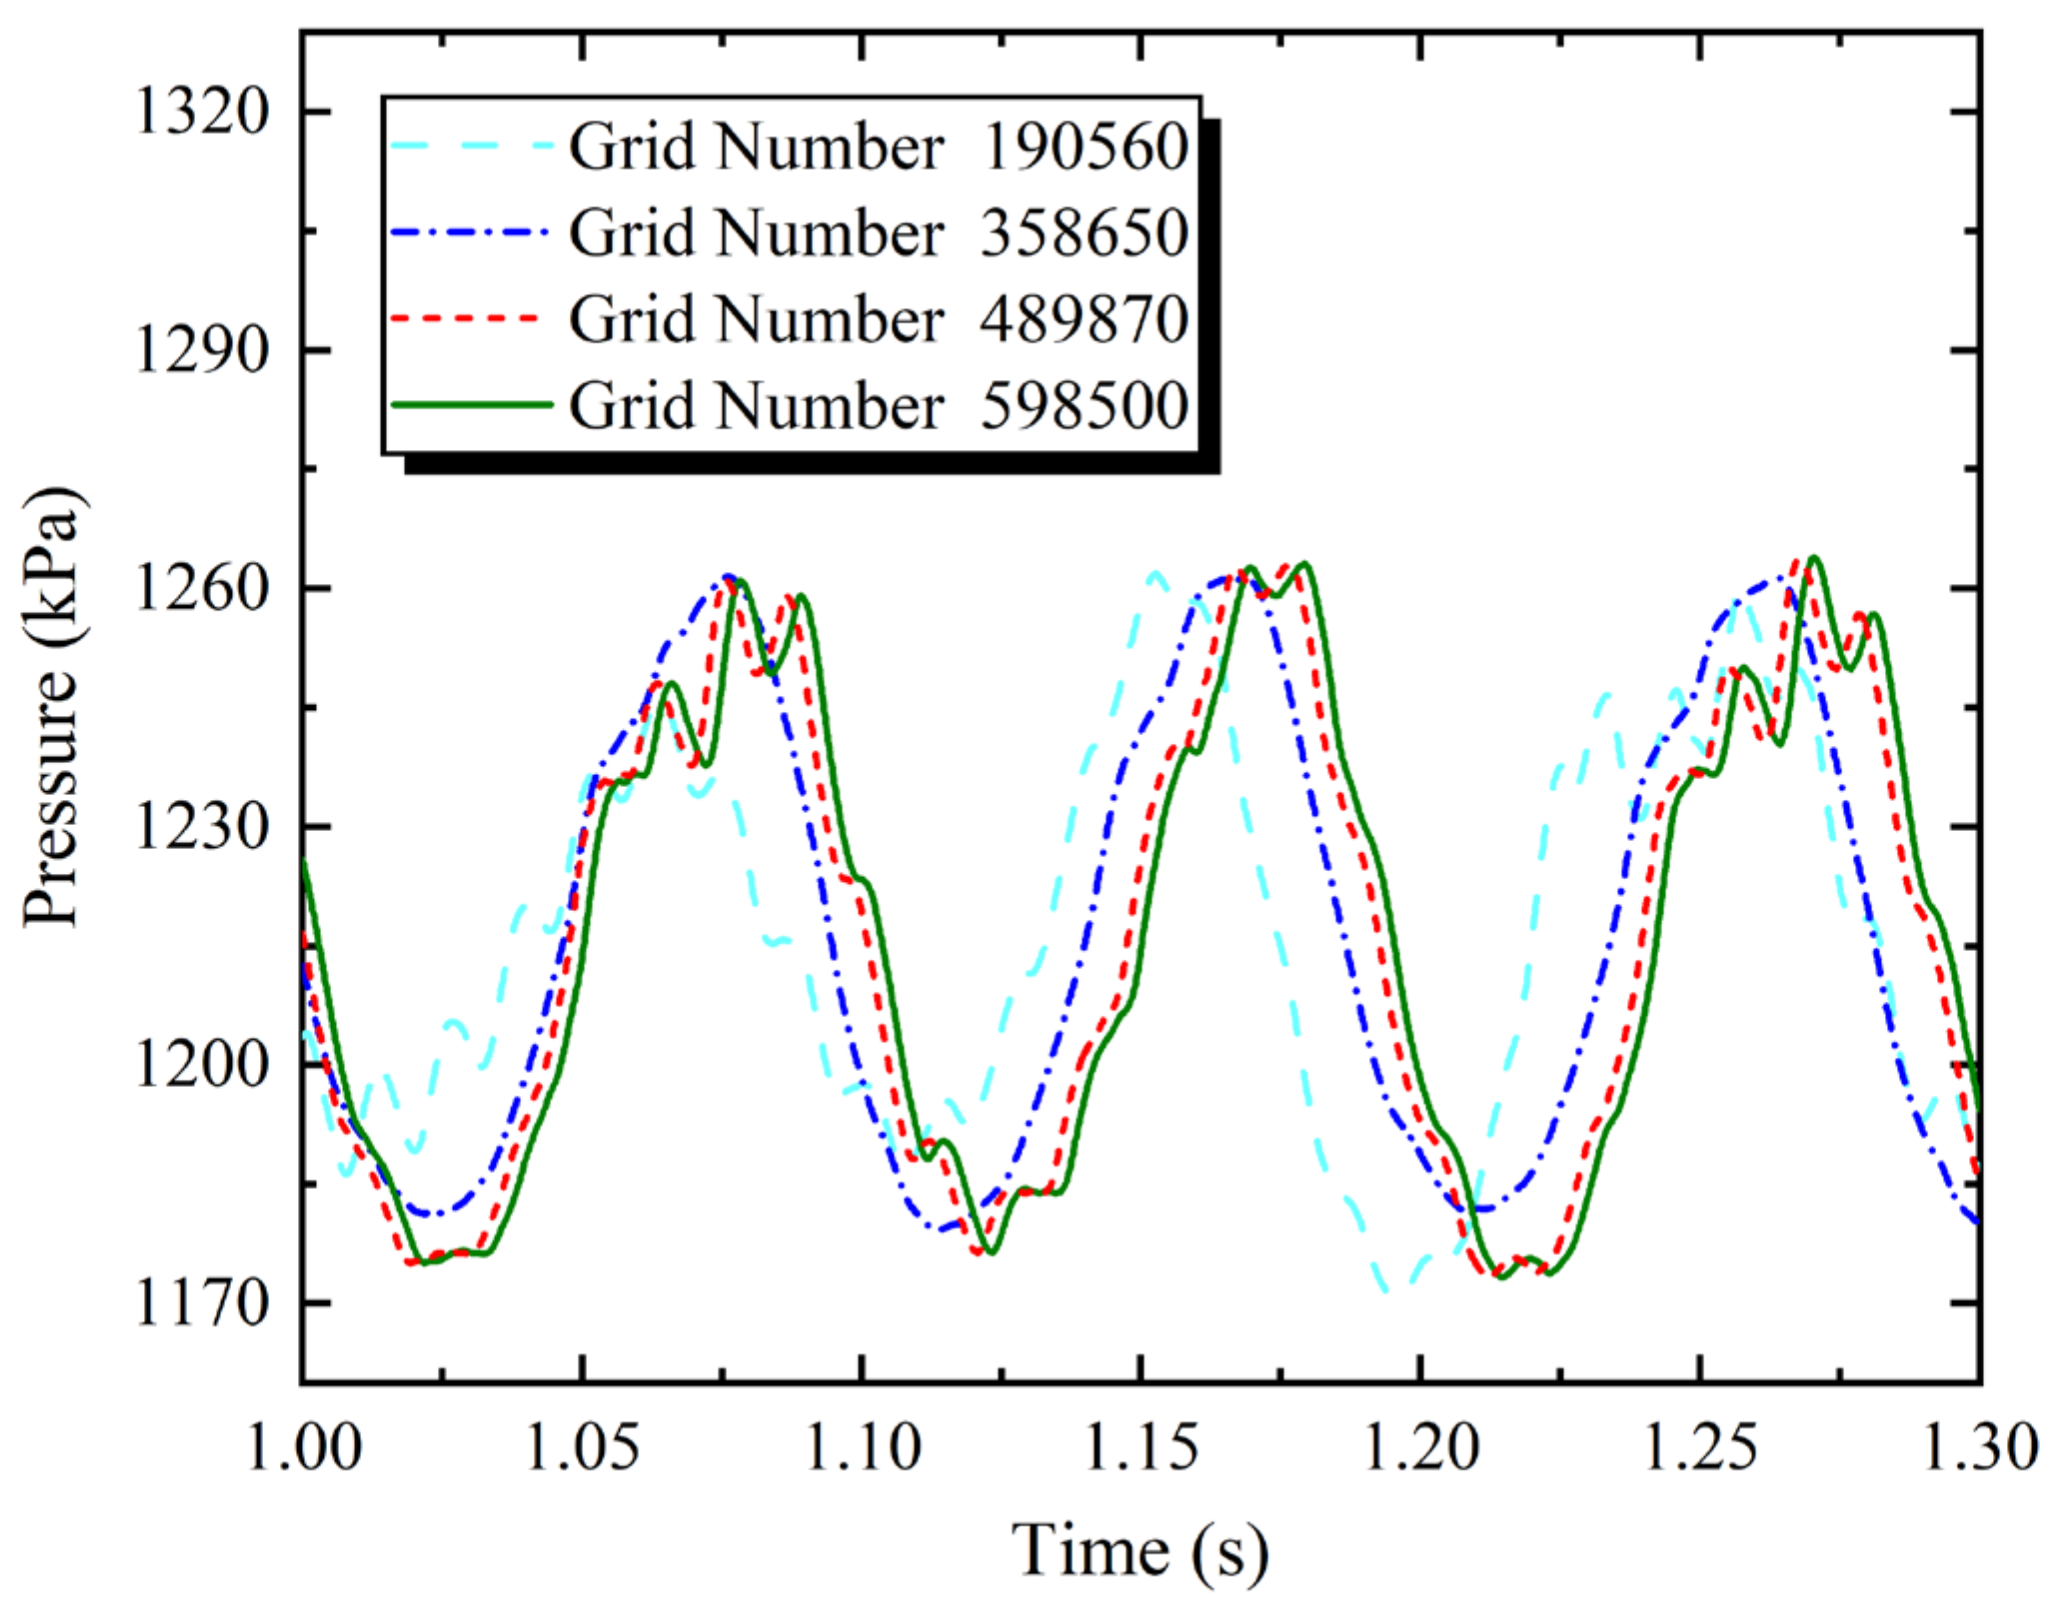
2.3. Physical Model and Grid

For the oxygen jet condensation process in the propulsion system of cryogenic liquid rockets, Figure 2a illustrates a specific structure of the oxygen-feeding pipe between two pumps. This pipe consists of an annular gas inlet, an annular liquid inlet, and a circular outlet, while the other boundaries are treated as walls. The mass flow inlet and pressure outlet are adopted in the simulation. The high-temperature oxygen vapour (GOX) is injected from the gas chamber into the main pipe through two rows of holes and completely condensed into liquid oxygen. Each row consists of 32 holes circumstantially aligned on the sidewall of the main pipe.
The calculation zone is discretised into unstructured grids. The corresponding grid system is constructed according to the size of the feeding pipe, as shown in Figure 2b. The polyhedral mesh is adopted and the local mesh is refined at the injection holes, where the intense phase change occurs, highlighted in red in the enlarged view of Figure 2b. The detailed operation conditions are listed in Table 1. The subcooling temperature of liquid oxygen is approximately 33 K. The physical properties of GOX and LOX are obtained from NIST PROP [20].
In addition, a grid independency study was conducted using four qualities of a grid system with grid numbers 190,560, 358,650, 489,570, and 598,500, respectively. Figure 3 shows the gauge pressure variation with time at the site of the injection hole for different grid numbers. It is proved that grid number 489,870 can be used for reliable and accurate results with lower computation cost. According to our previous study [2], a constant time step 5 × 10⁻⁵ s is used for transient simulation to guarantee the Courant number (CFL) no > 1.

3. Result and Discussion

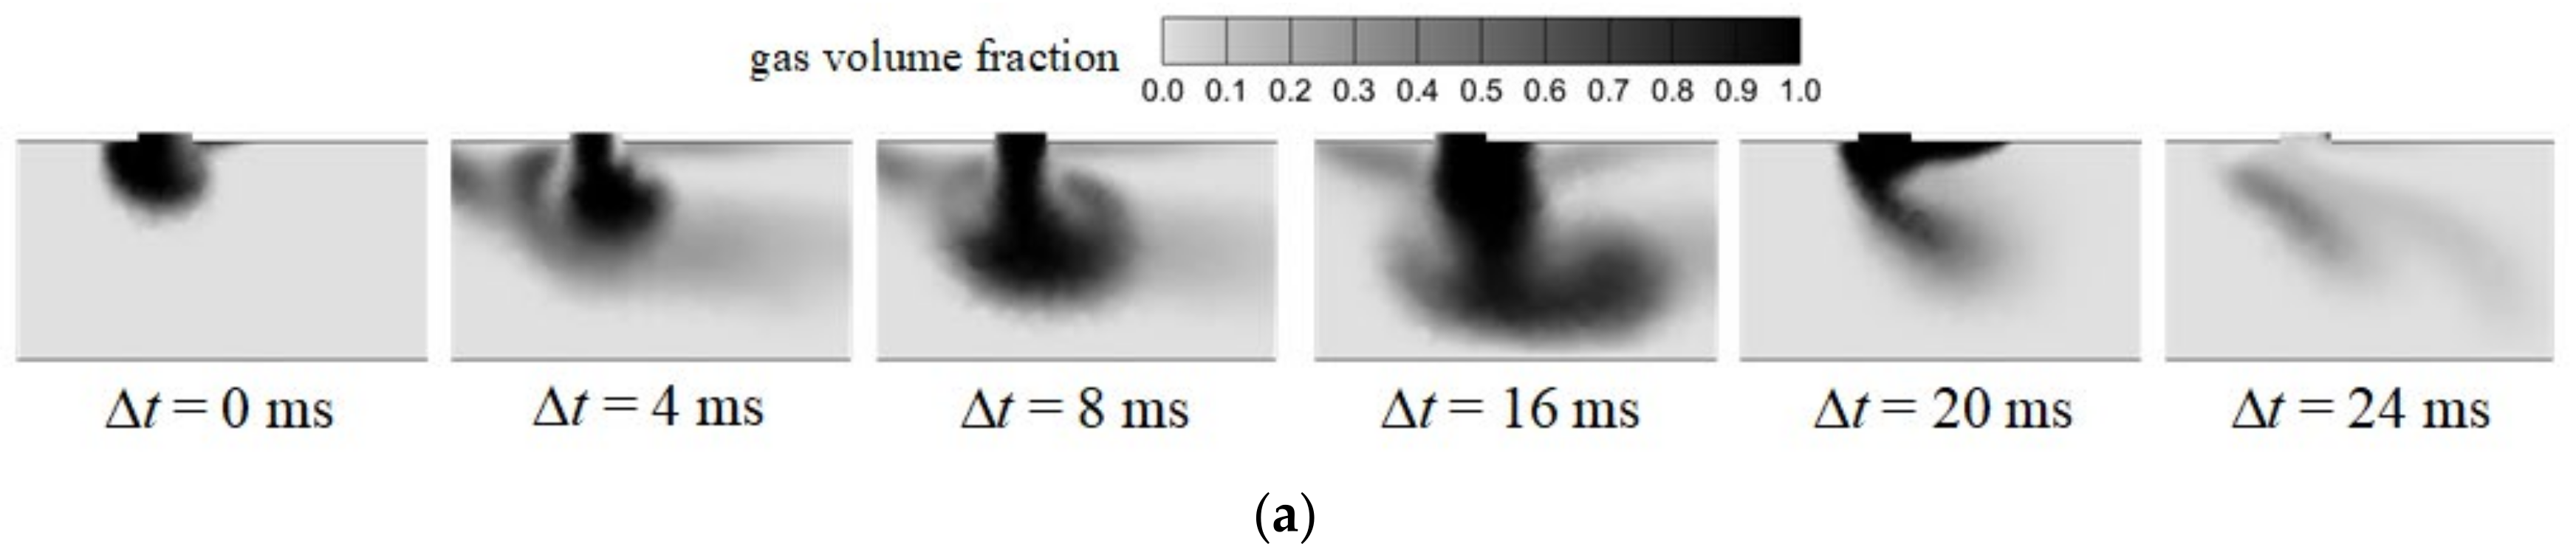
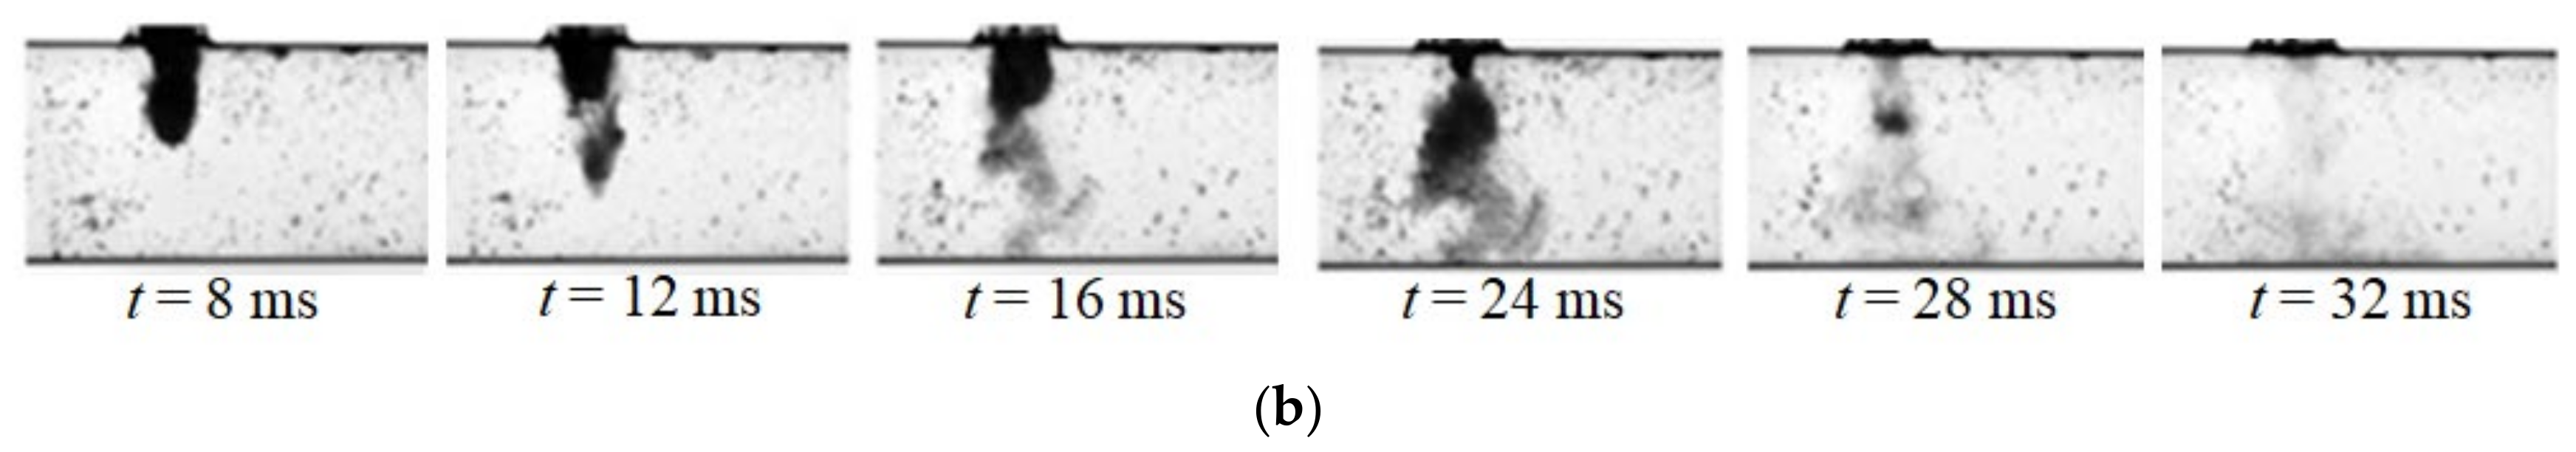
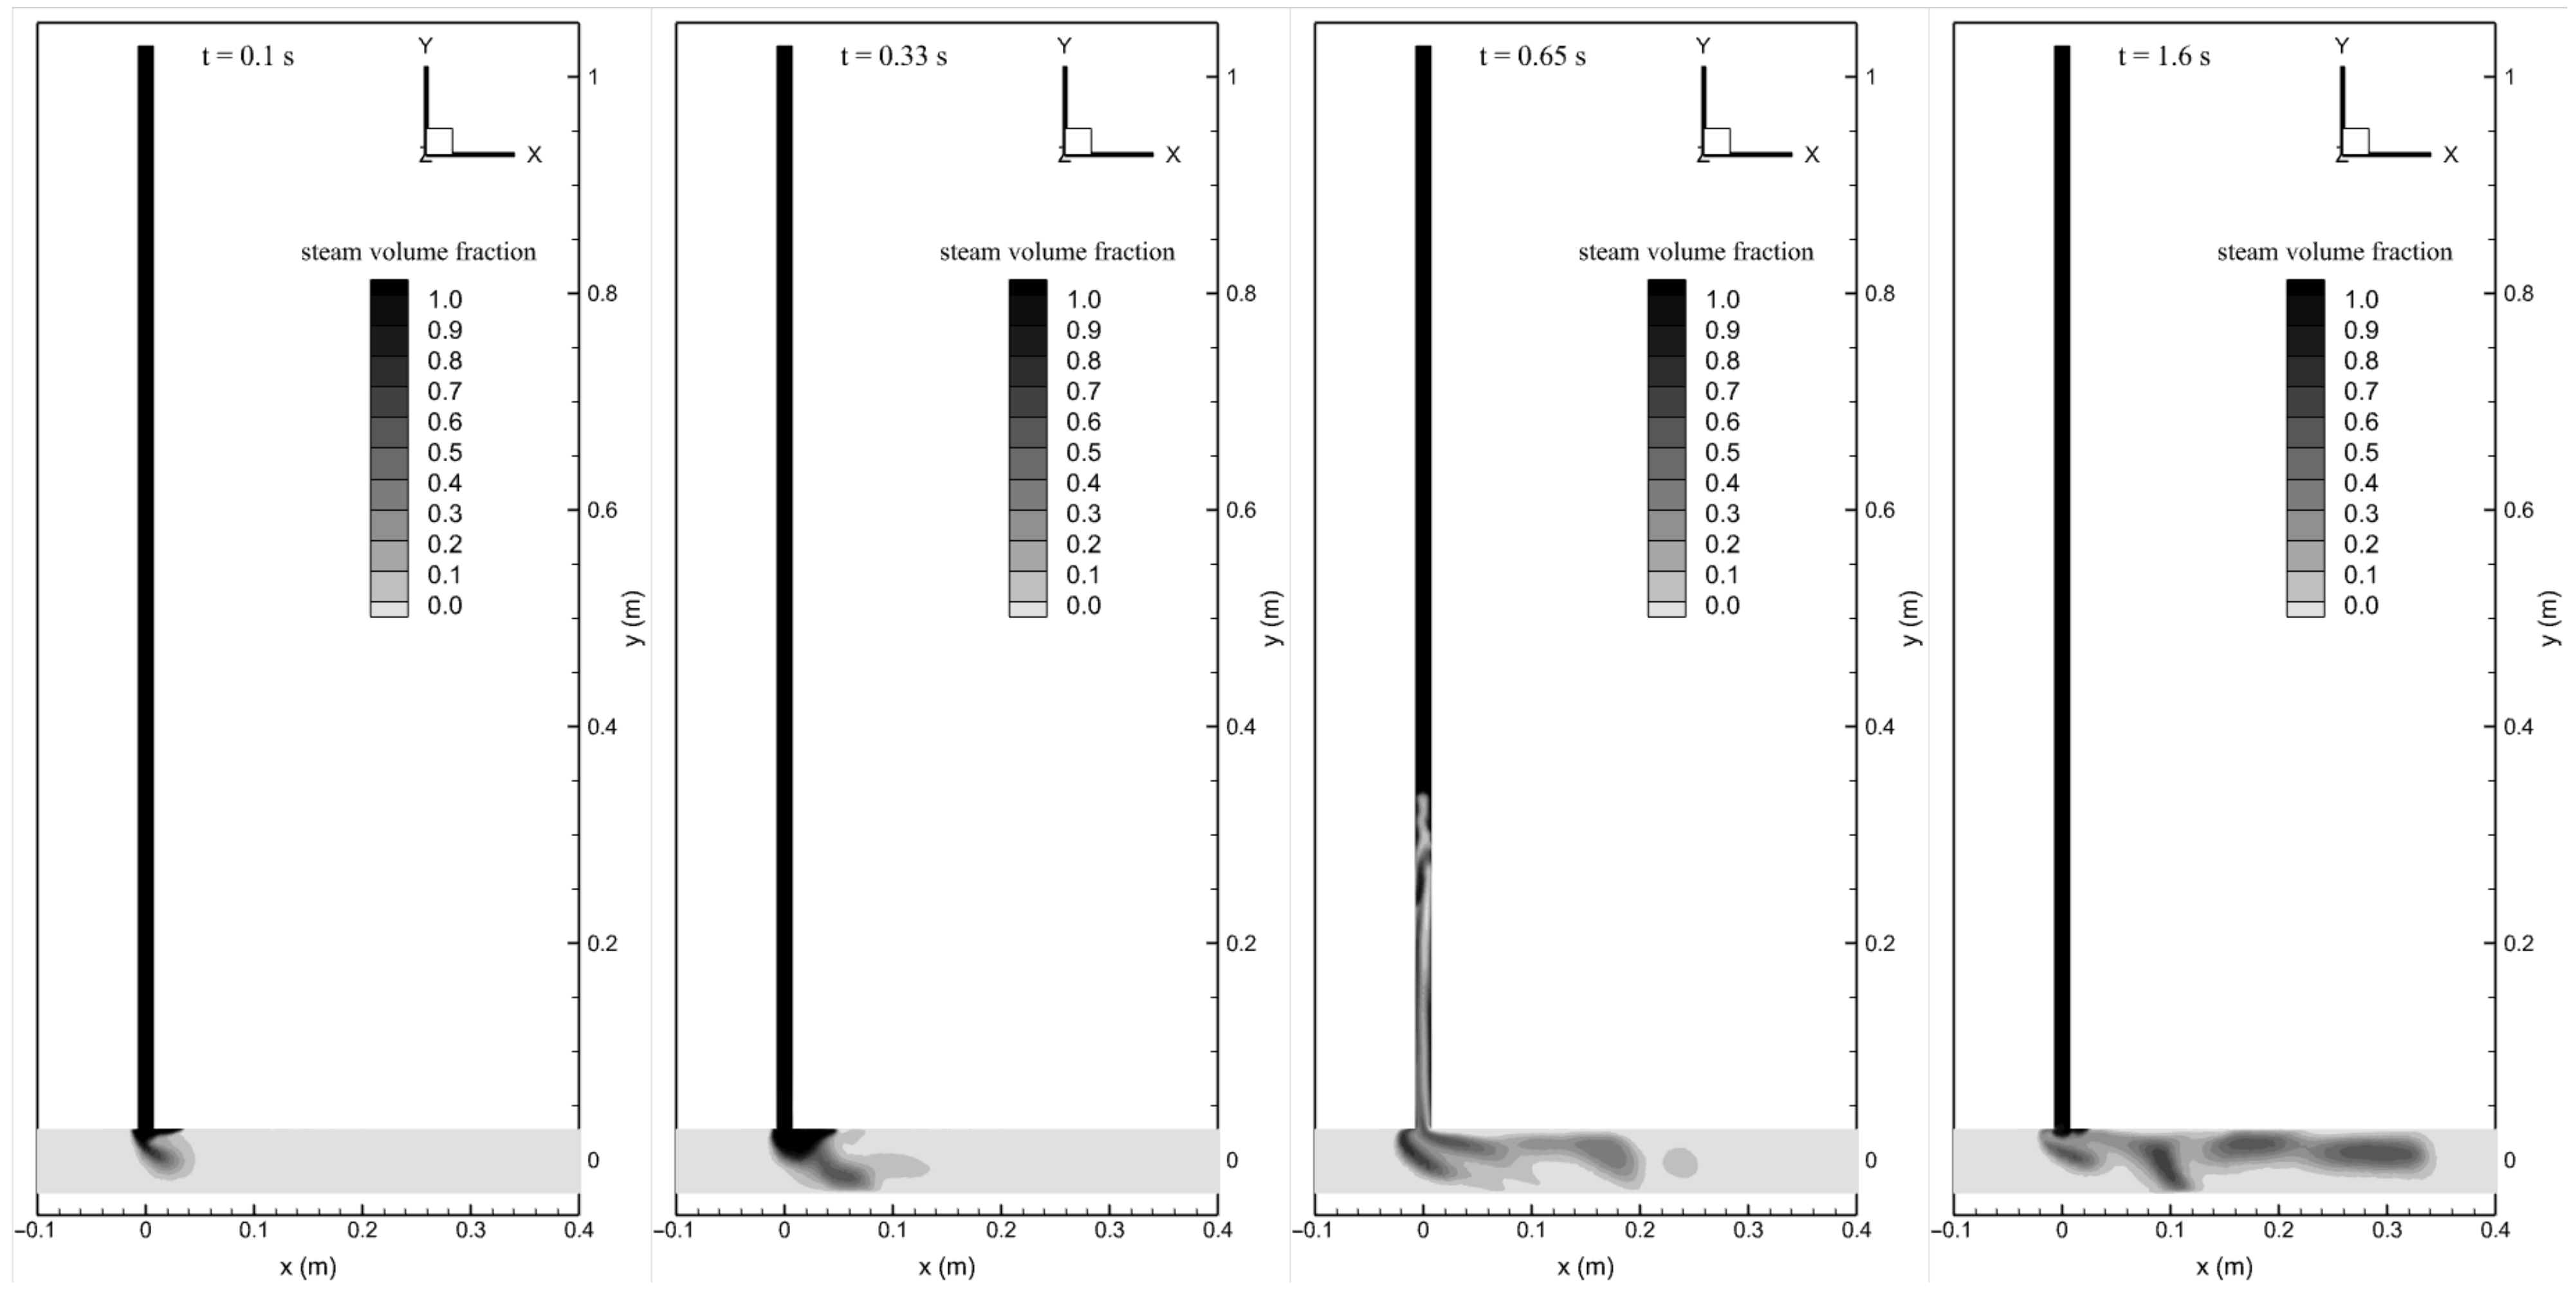
3.1. Validation for Steam Flow Condensation

In this section, Wang’s experimental data for the steam flow condensation are adopted to validate the proposed mass transfer model. The physical model of the experimental system can be seen in [21]. In Wang’s experiment, the subcooled water flows along the horizontal main pipe, while the saturated steam is injected from the vertical branch pipe. So, the direct contact condensation will occur at the T-junction of the two pipes. The detailed experimental conditions are listed in Table 2.
Besides, the water periodic suck-back phenomenon is captured by the experiment in [22] and the present numerical model, shown in Figure 4. At a particular moment, the subcooled water will be sucked up into the branch pipe due to steam condensation. When the overheated steam contacts the subcooled water, a low-pressure zone is formed at the T-junction due to the intense mass transfer. Then, the water will be sucked up into the vertical pipe, driven by the local pressure drop and capillary force.
In the case of B, Figure 5 shows the distribution of steam volume fraction at four particular moments in time (0.10 s, 0.33 s, 0.65 s, 1.60 s). At t = 0.65 s, a portion of subcooled water is sucked up into the steam branch pipe. The steam plume formed in the main pipe is unstable and swinging with time.
Figure 6 shows the history profile of gauge pressure fluctuation at the T-junction by experimental and numerical methods. From the comparison, it is found that several periodic pressure peaks are reaching about 300 kPa, which are consistent in both the experimental and numerical data. The waveform of pressure oscillation of numerical results achieves excellent agreement with that of the experimental data. By the spectral analysis, the first dominant frequency of the numerical results is 8.9 Hz, very close to the experimental data of 10 Hz. So, it is proved that the proposed new model is convincing for obtaining the pressure oscillation in the DCC process.

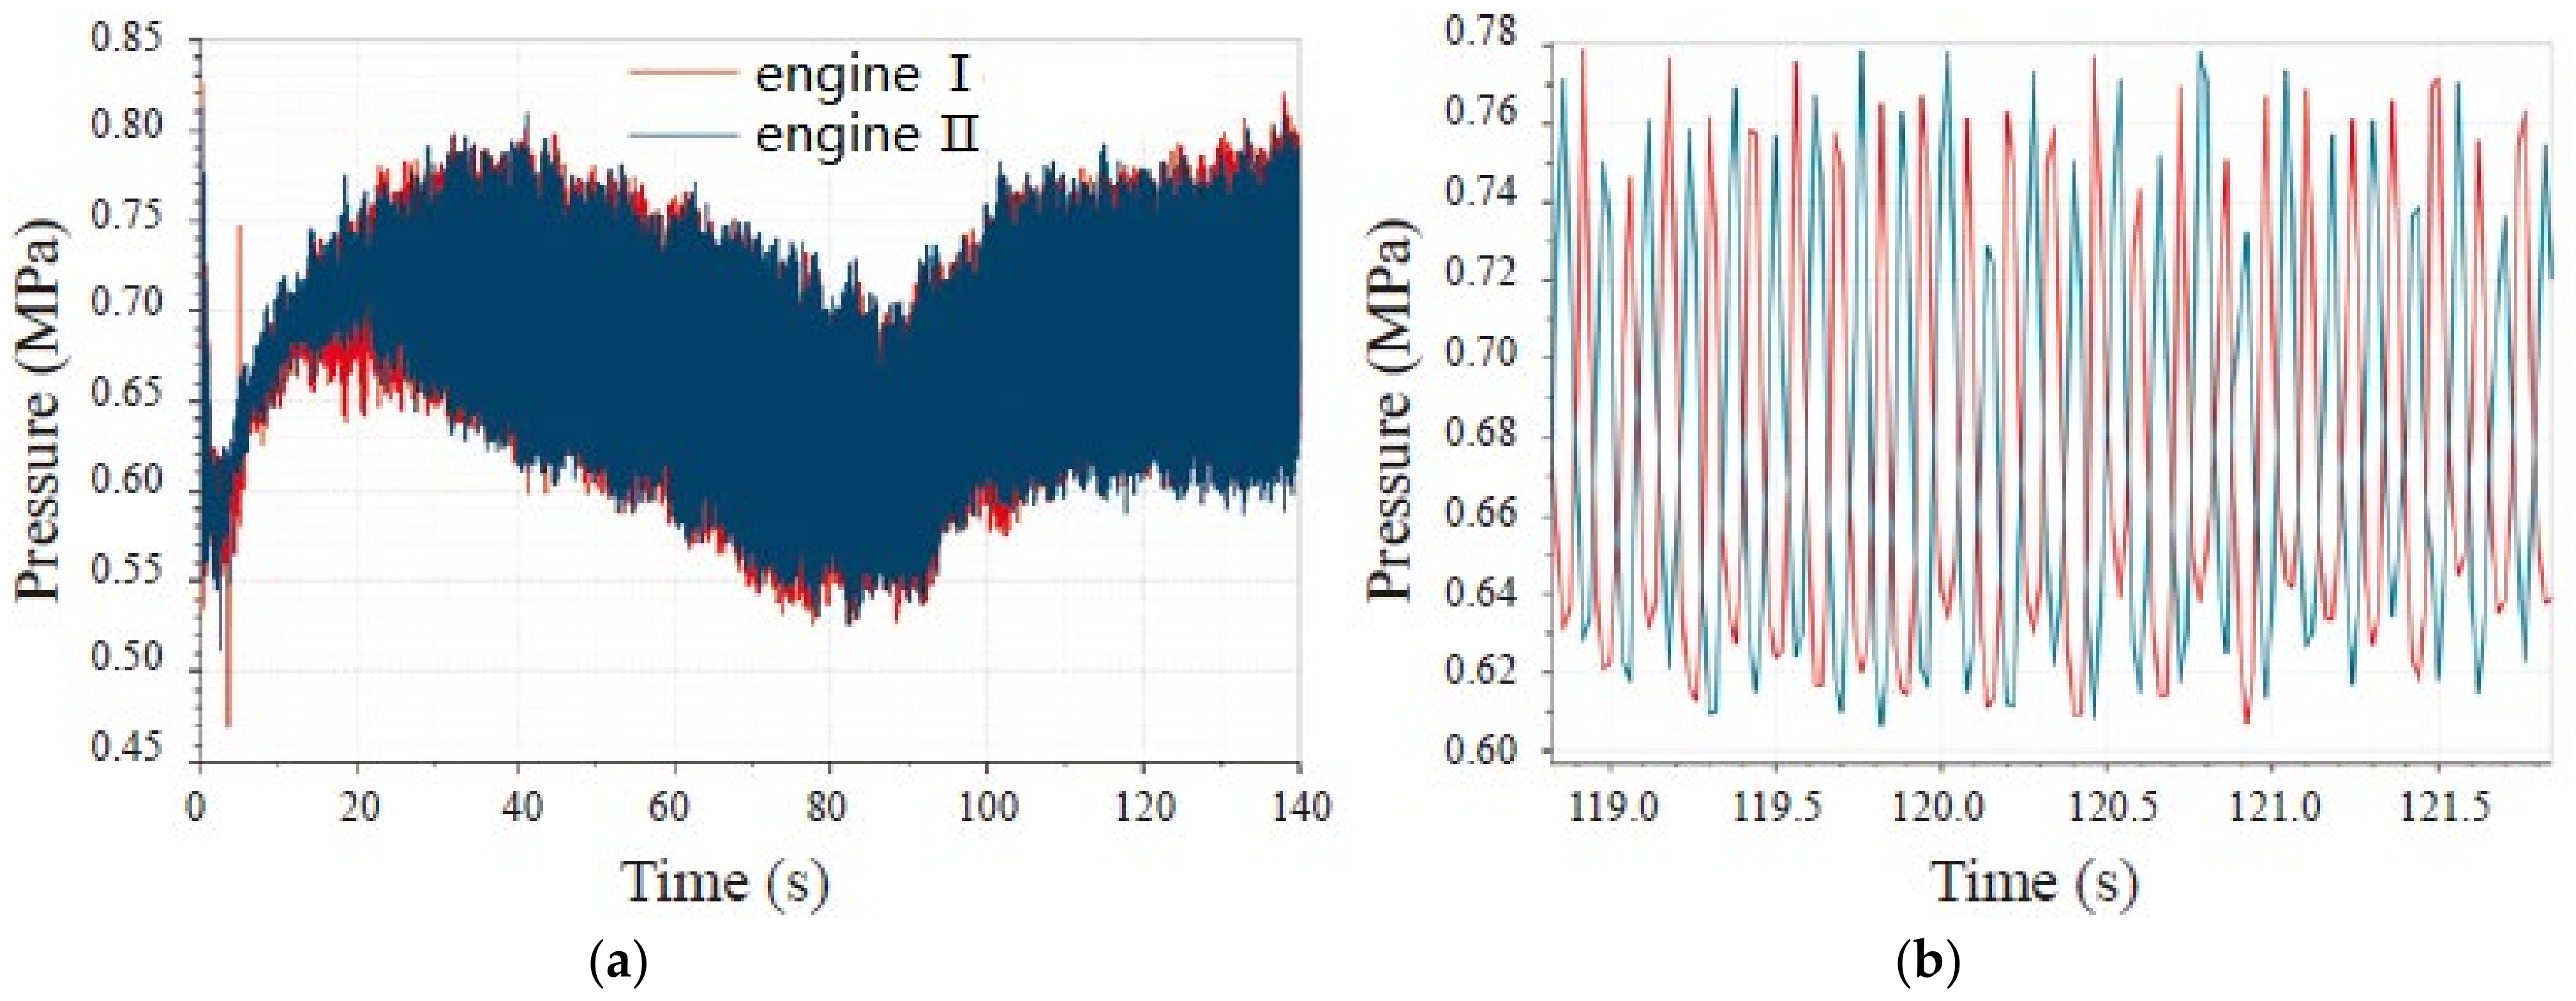
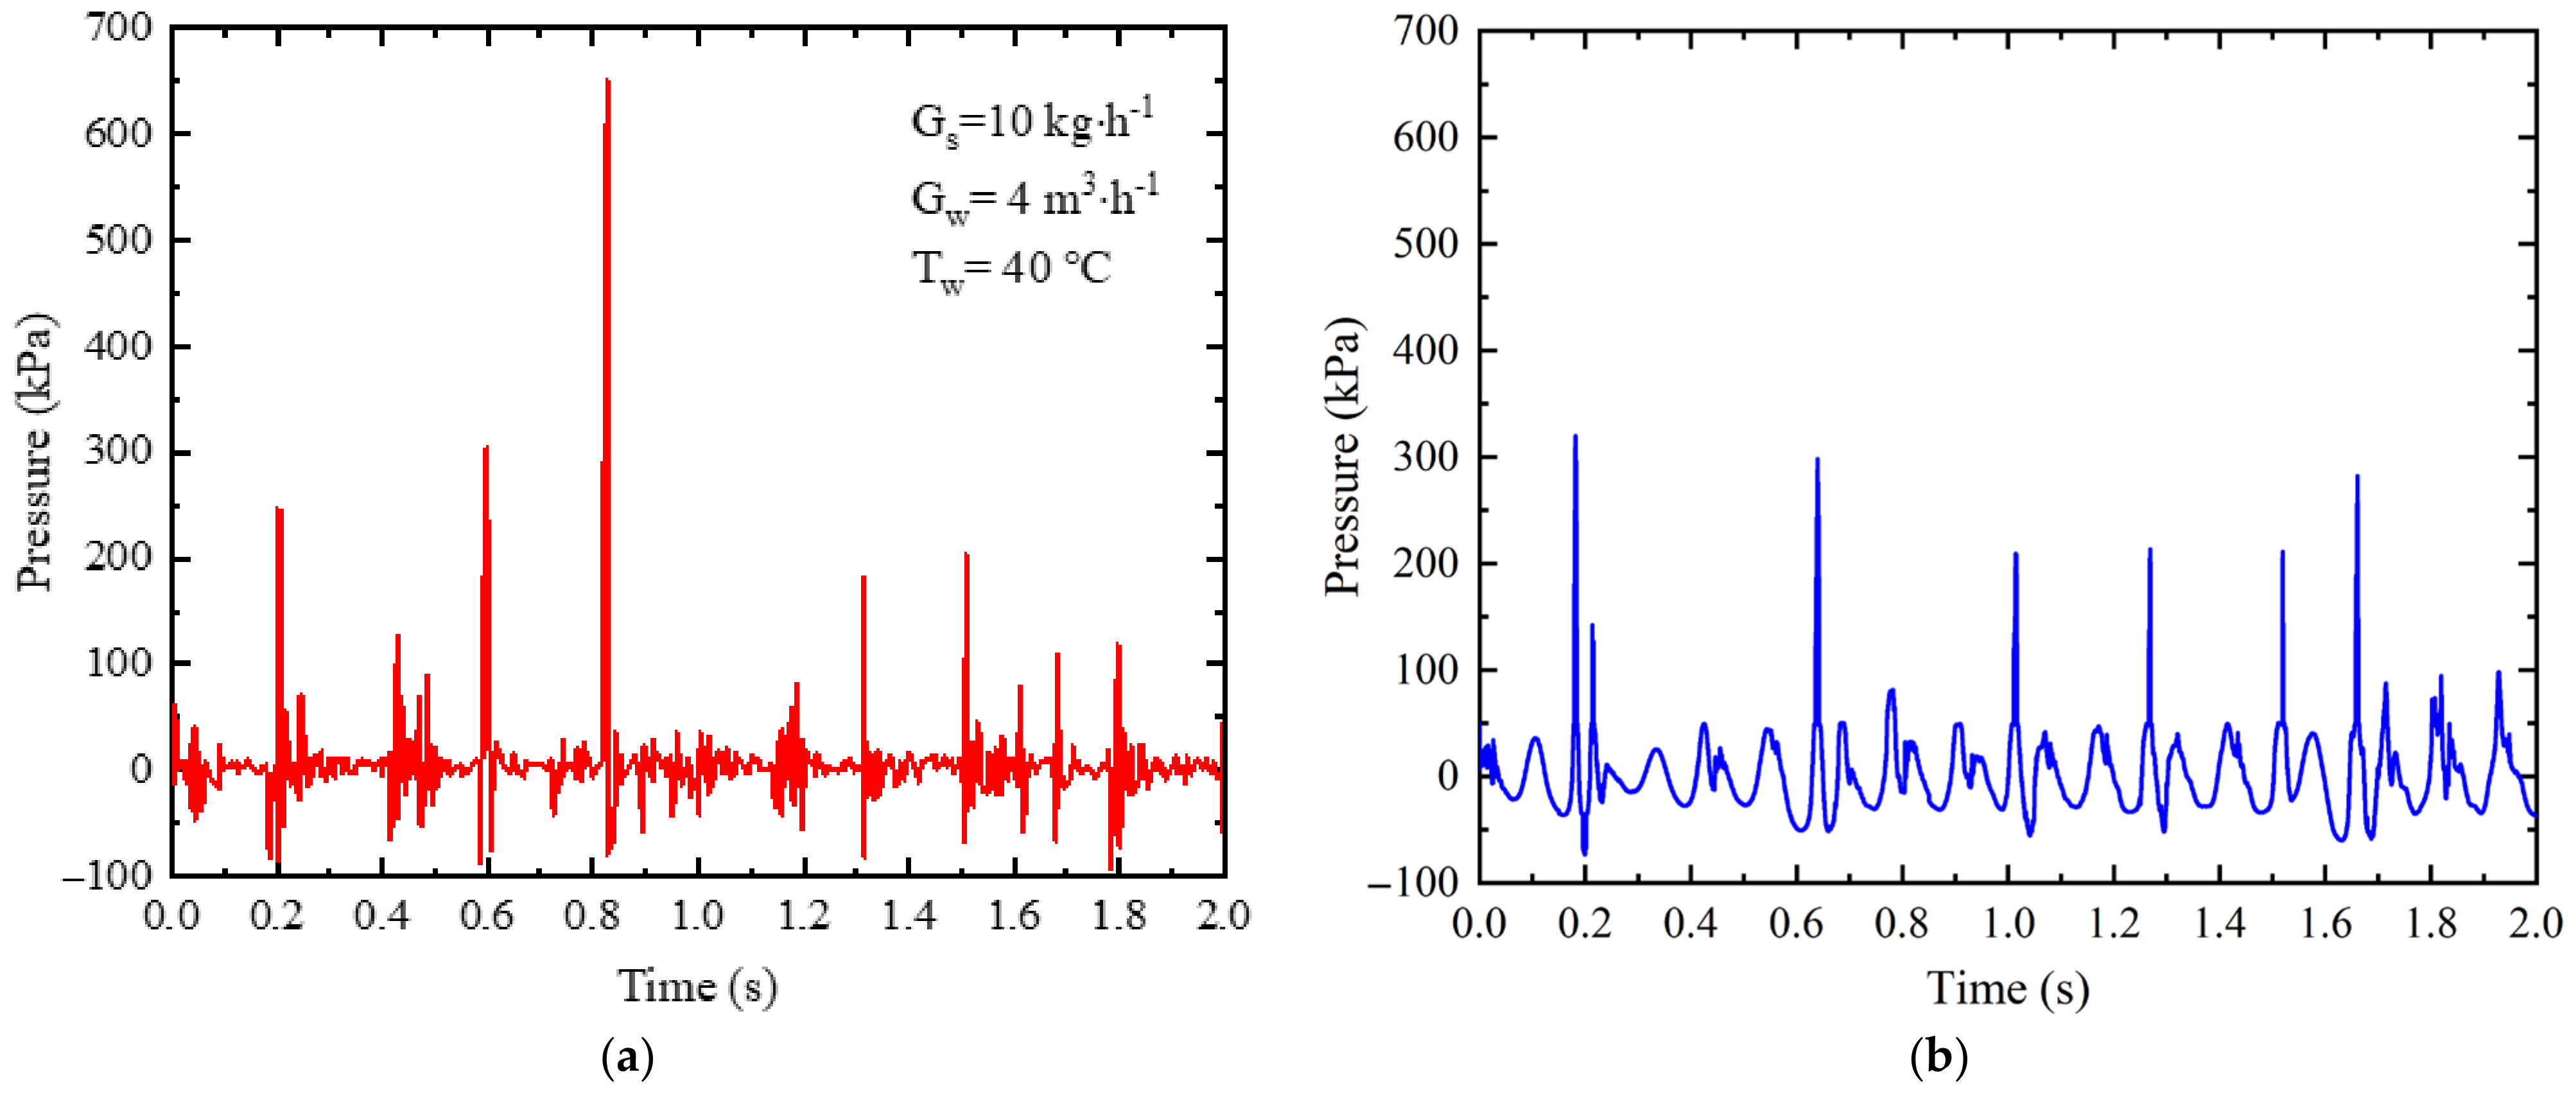
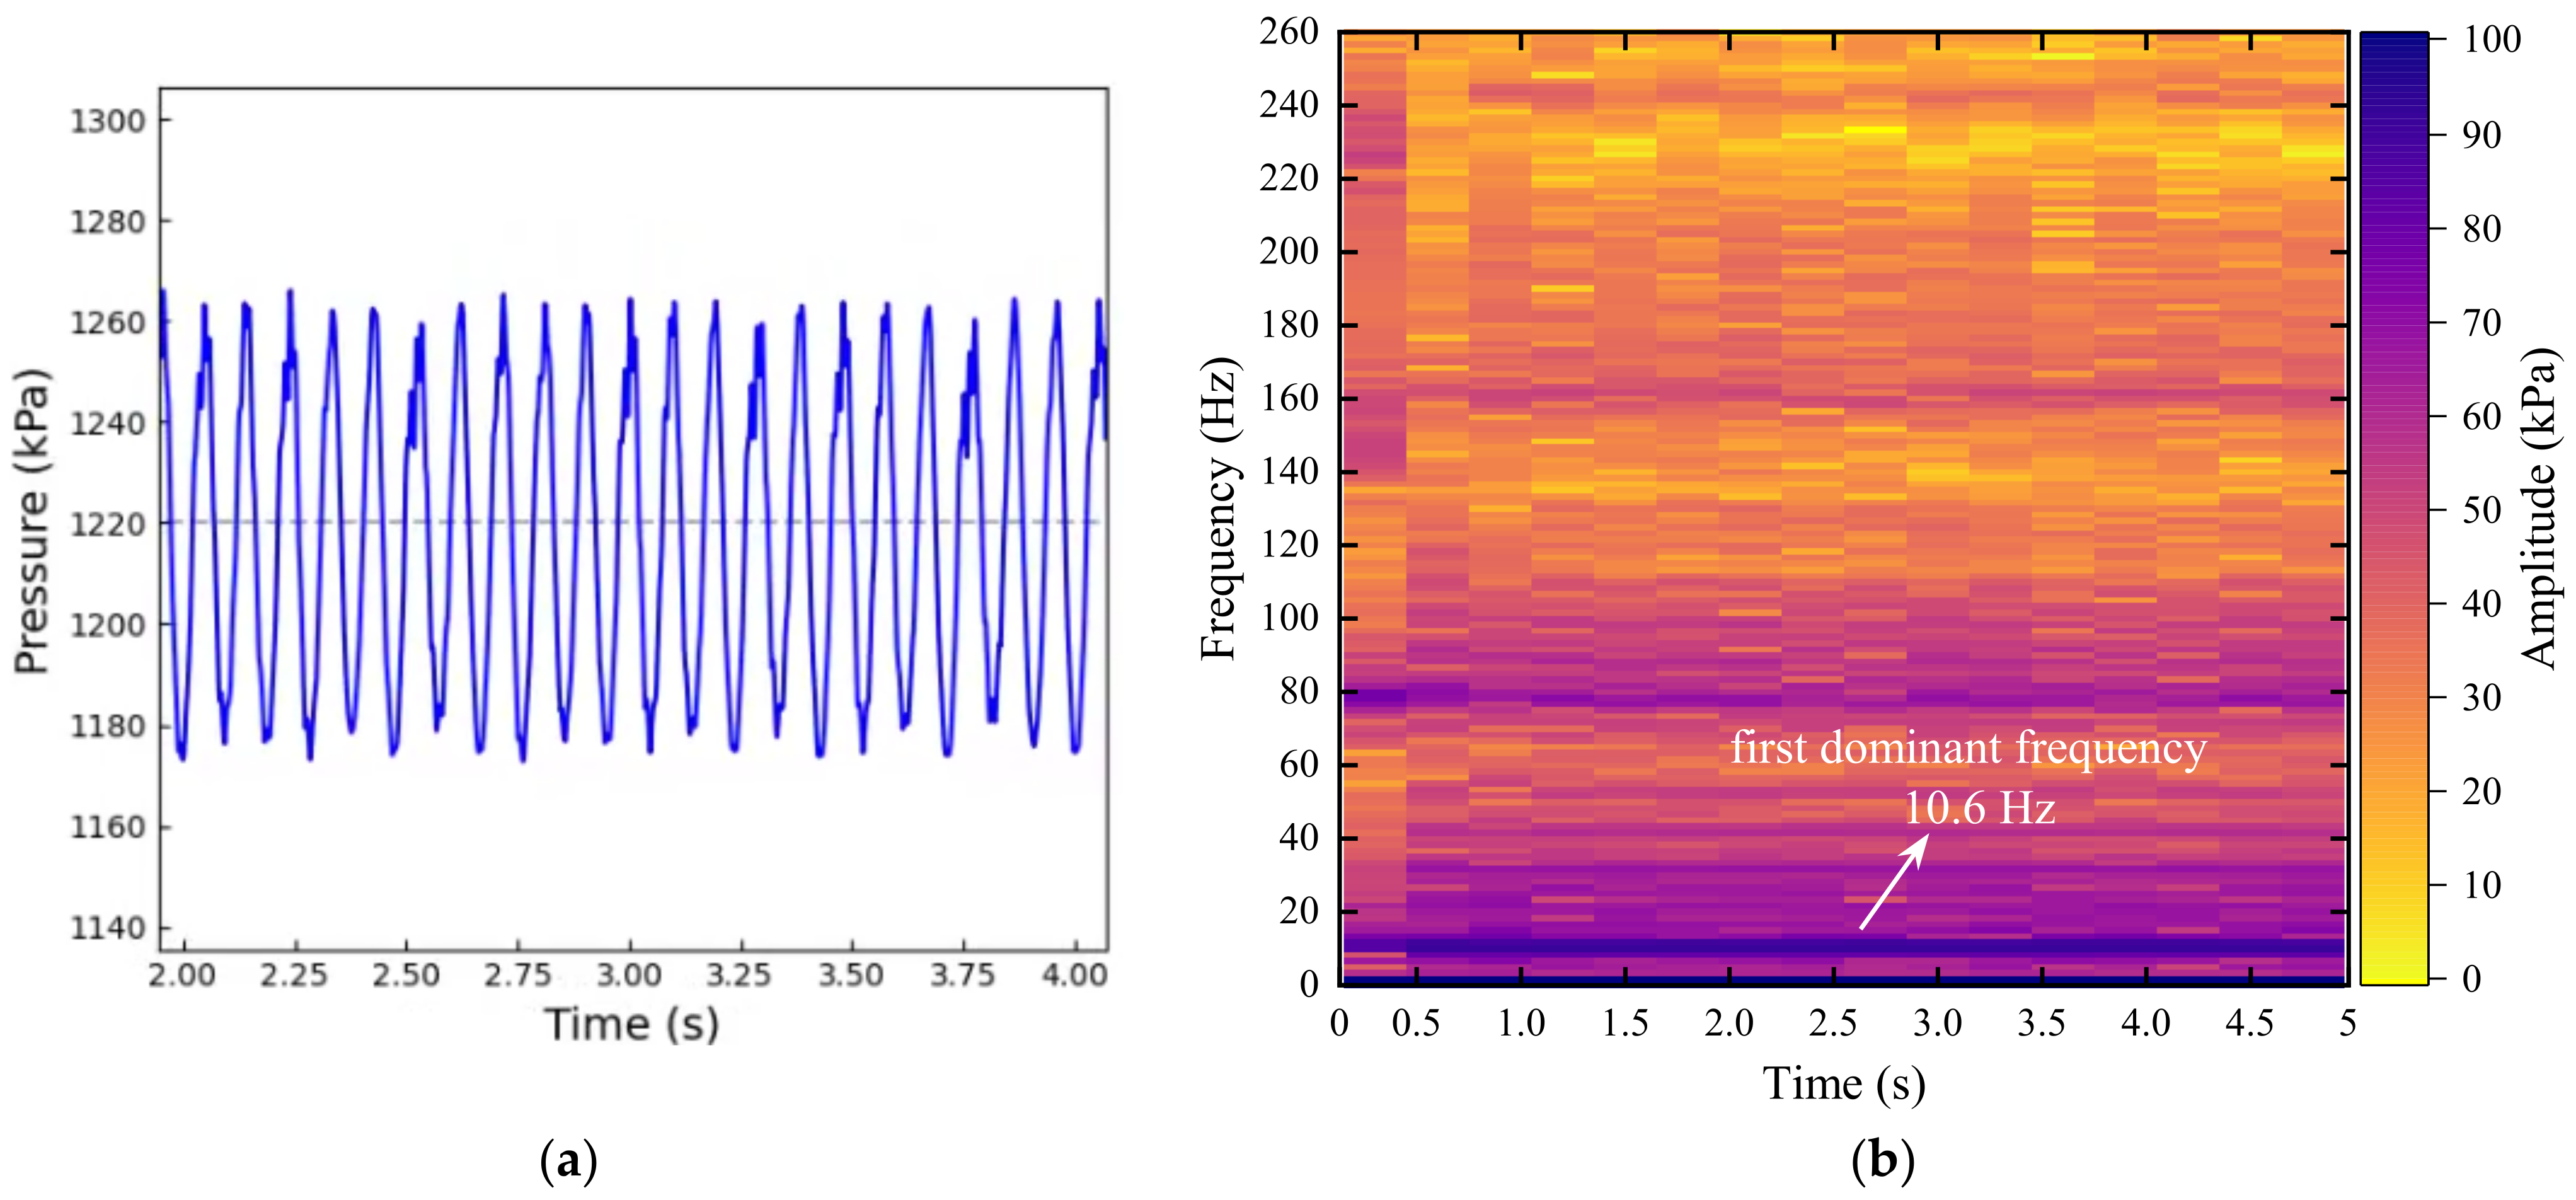
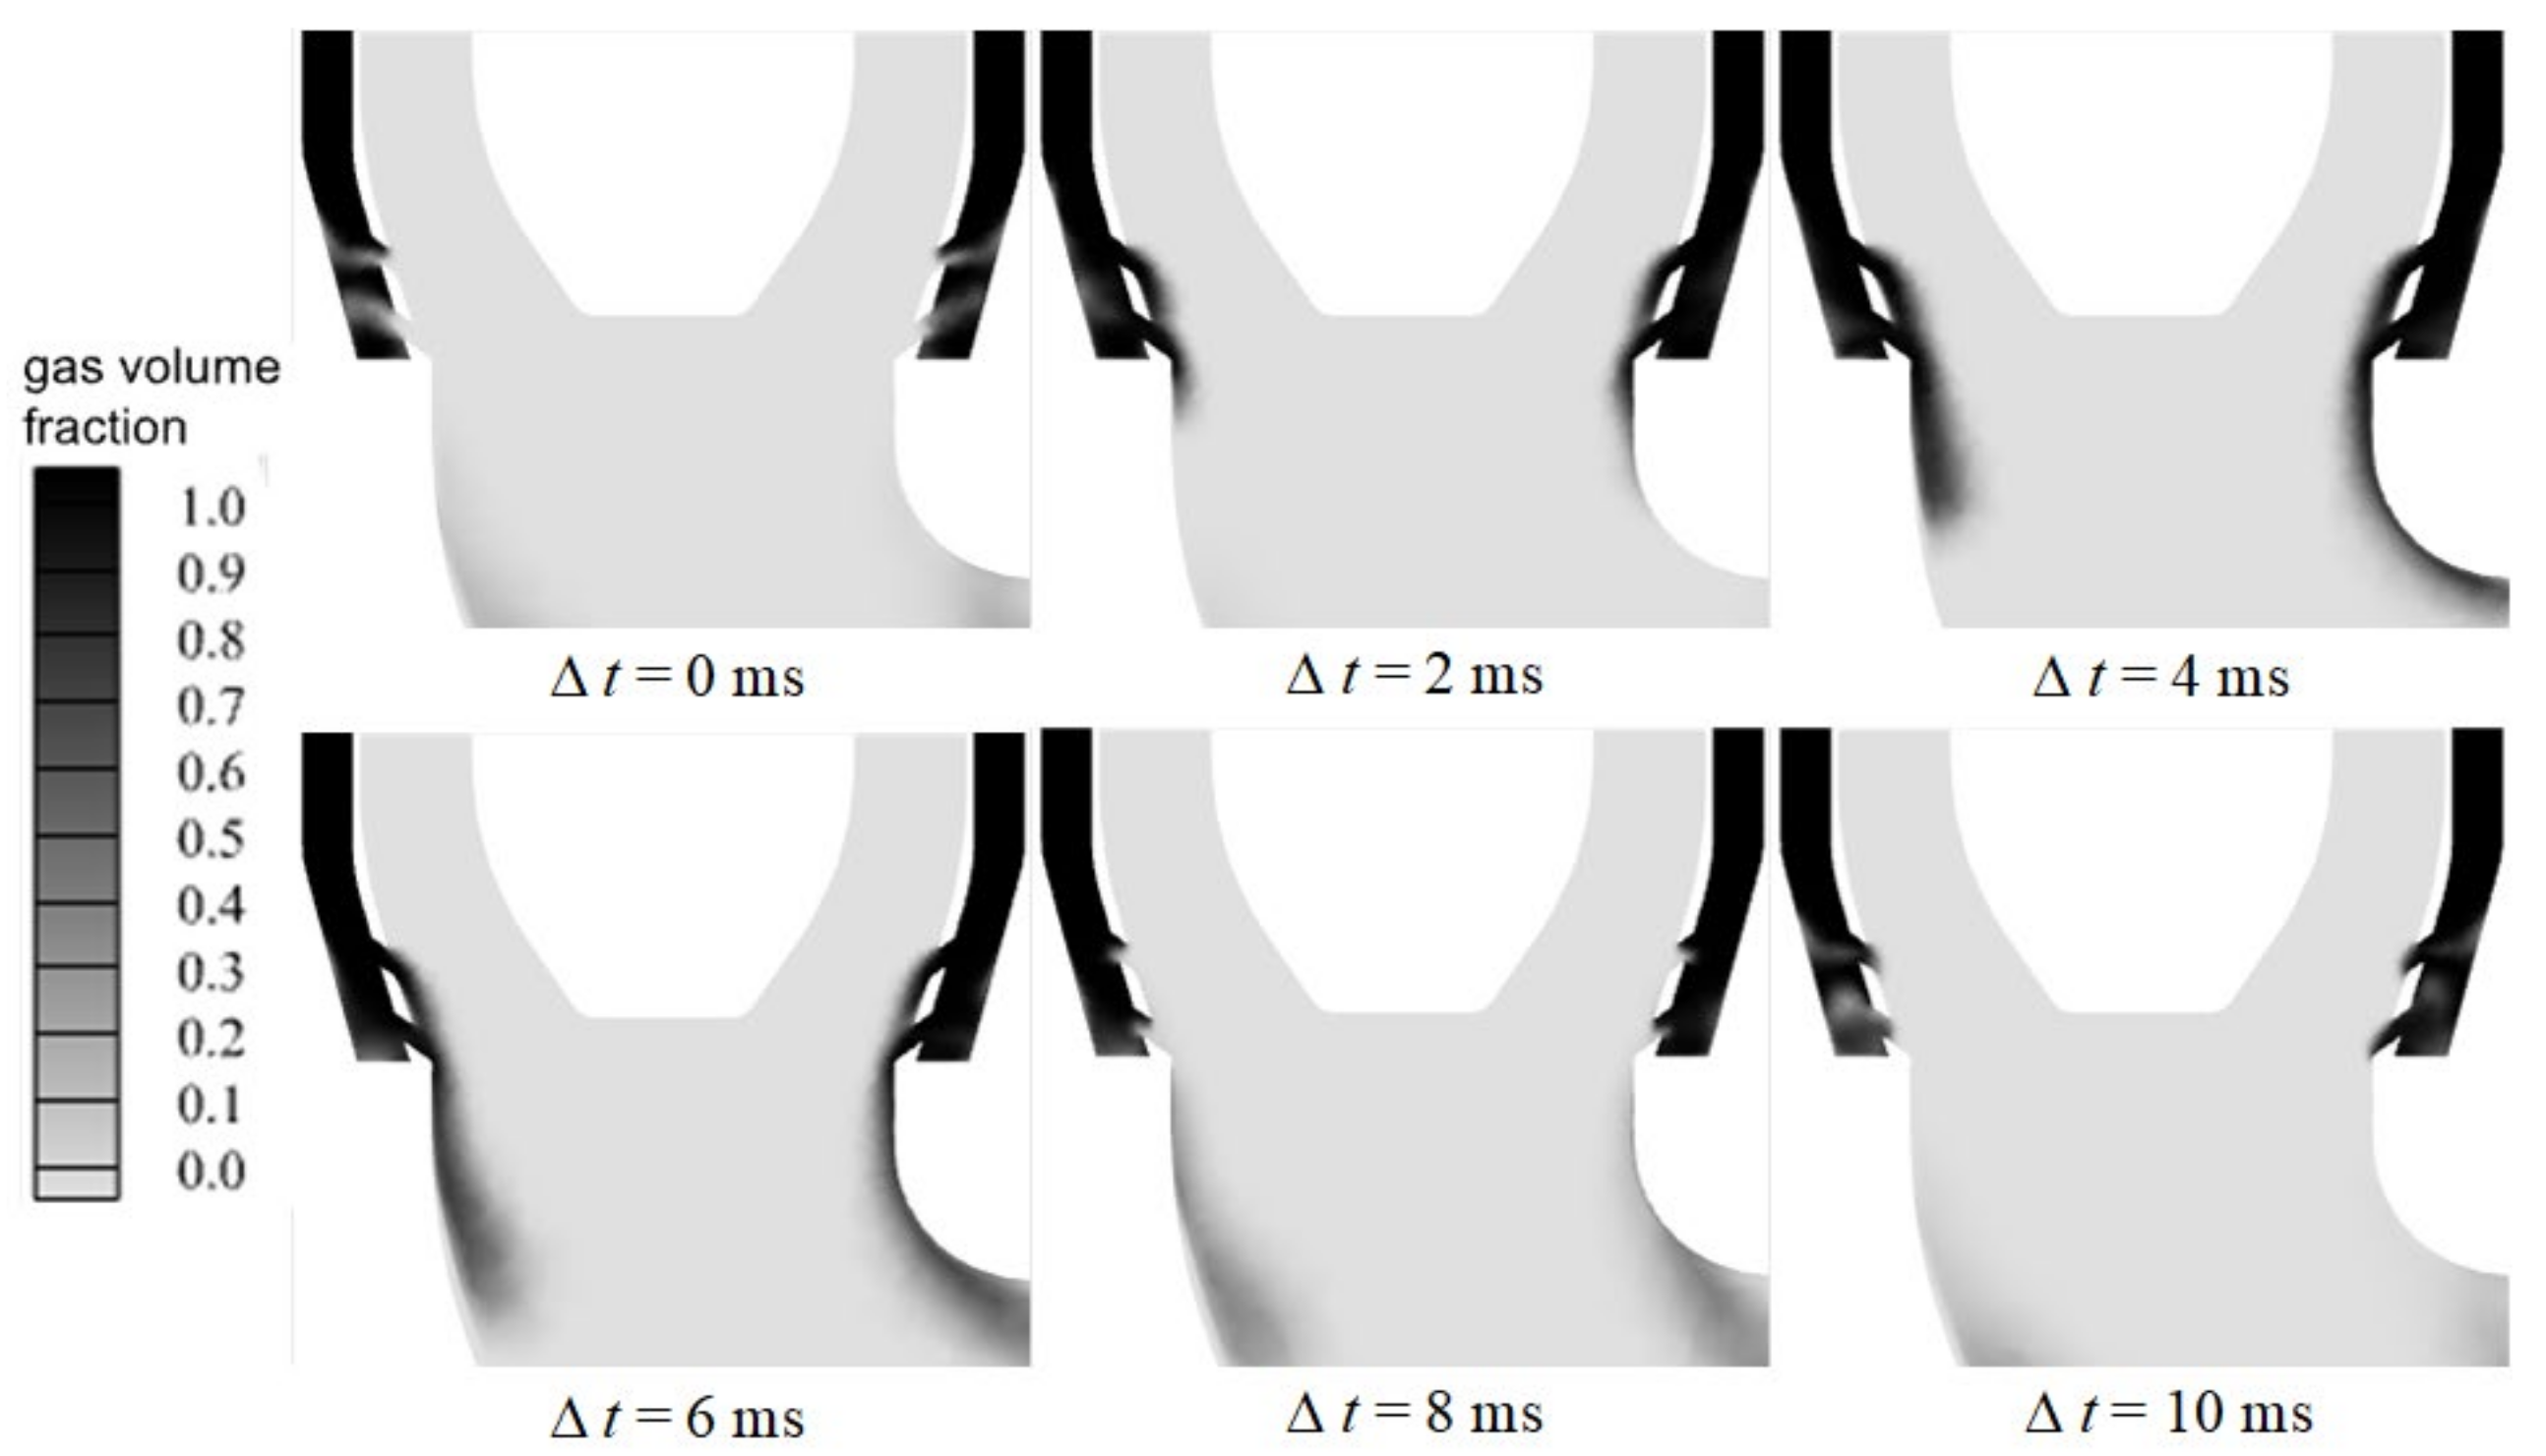
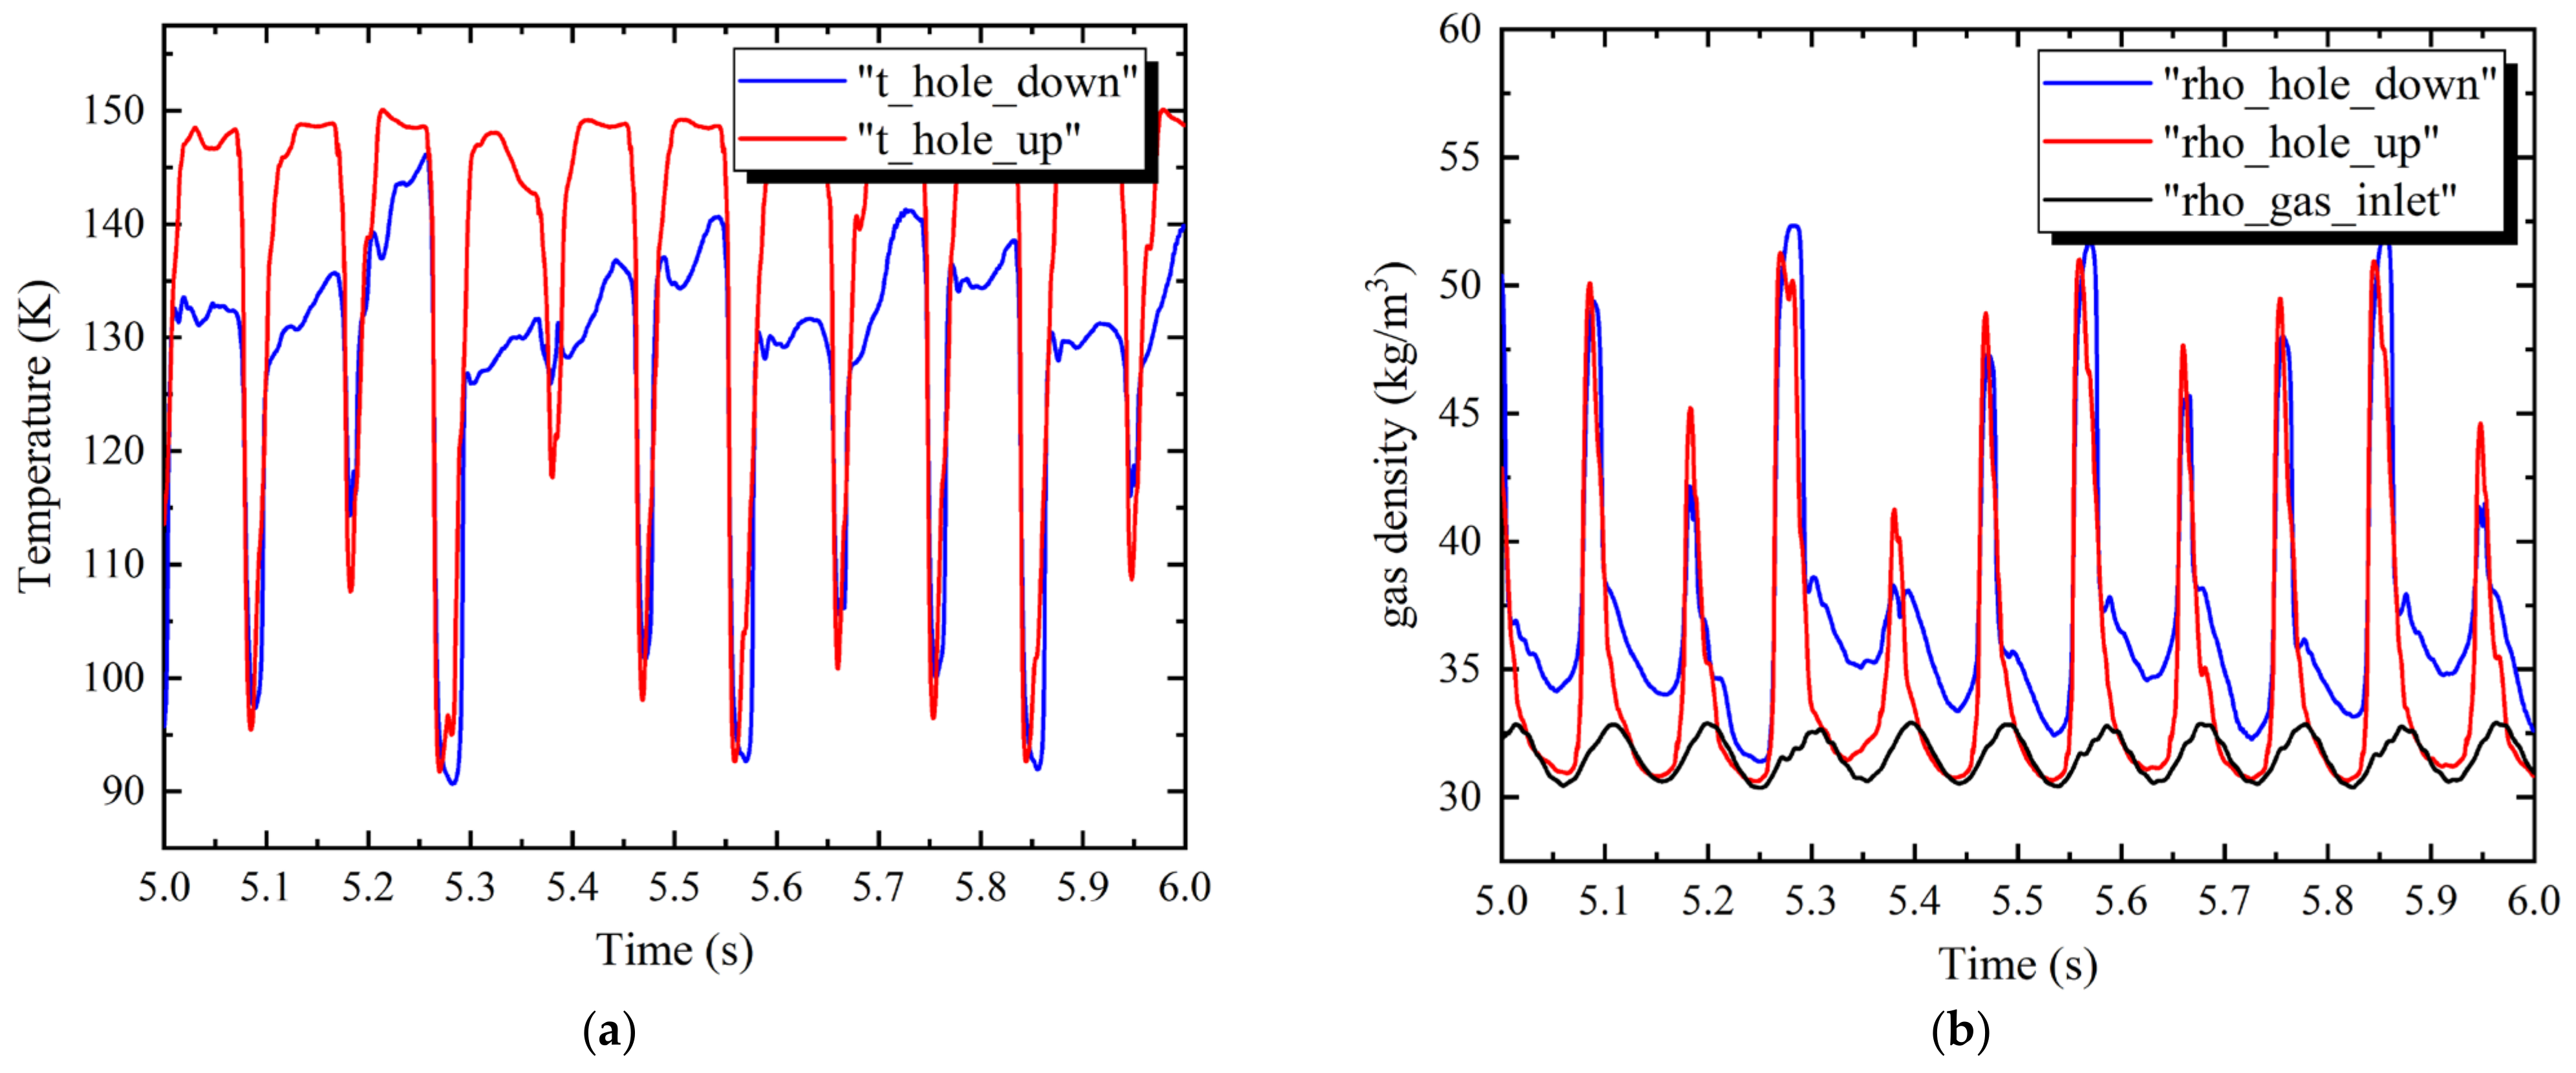
3.2. Low-Frequency Pressure Oscillation

The numerical results of the low-frequency pressure oscillation phenomenon can be obtained by the numerical method mentioned in Section 2. The specific calculation procedure and numerical parameters are omitted to avoid repetition, refer to Section 2 for details.
Owing to the two-phase flow condensation in the main pipe, the numerical results show strong flow instability. Figure 7a shows the pressure fluctuation with time at the site of the injection hole. The dotted line represents the background pressure (1.22 MPa) of the liquid oxygen feeding-pipe. After the short-time Fourier-transform, shown in Figure 7b, the first dominant frequency of pressure oscillation is 10.6 Hz.
To study the mechanism of low-frequency pressure oscillation, Figure 8 shows the shape history of the oxygen vapour plume varying with time. A length of stable vapour plume is formed from the injection hole along the wall of the main pipe. The oxygen vapour suck-back phenomenon is also found in the cryogenic DCC process. The fluctuation frequency of the oxygen plume is 10.6 Hz, the same as the first dominant frequency of pressure oscillation. Therefore, the low-frequency pressure oscillation, shown in Figure 7a, is mainly caused by the periodic condensation of the oxygen plume at the site of the injection hole.
Besides, Figure 9 illustrates the quantitative periodic oscillation characteristic of several parameters in the period of 5~6 s. In Figure 9a, when the overheated GOX flows into the main pipe, the injection holes are filled with oxygen vapour. So, the temperature at the injection hole is about 150 K, the same as the temperature of GOX. When the liquid oxygen suck-back phenomenon occurs, the injection holes are gradually filled with liquid oxygen. The temperature at the injection hole begins to decrease from 150 K to 90 K, the same as the temperature of LOX. In Figure 9b, each peak of the density variation curve represents the occurrence of the liquid oxygen suck-back phenomenon. When the injection holes are filled with liquid oxygen, the oxygen vapour in the branch gas pipe is compressed violently and its kinetic energy is converted to internal energy. The oxygen density can increase acutely up to about 55 kg·m−3. In this way, Figure 9b,d shows that the density and velocity at the injection holes have the opposite trend. Owing to the compressibility of oxygen, the velocity of oxygen at the gas inlet is unsteady, as shown in Figure 9c, although the oxygen mass flow rate is the constant of 1.5 kg·s−1. As shown in Figure 9e,f, the mass flow rate at the outlet and the total volume of oxygen also show a regular periodic variation characteristic with the same frequency.

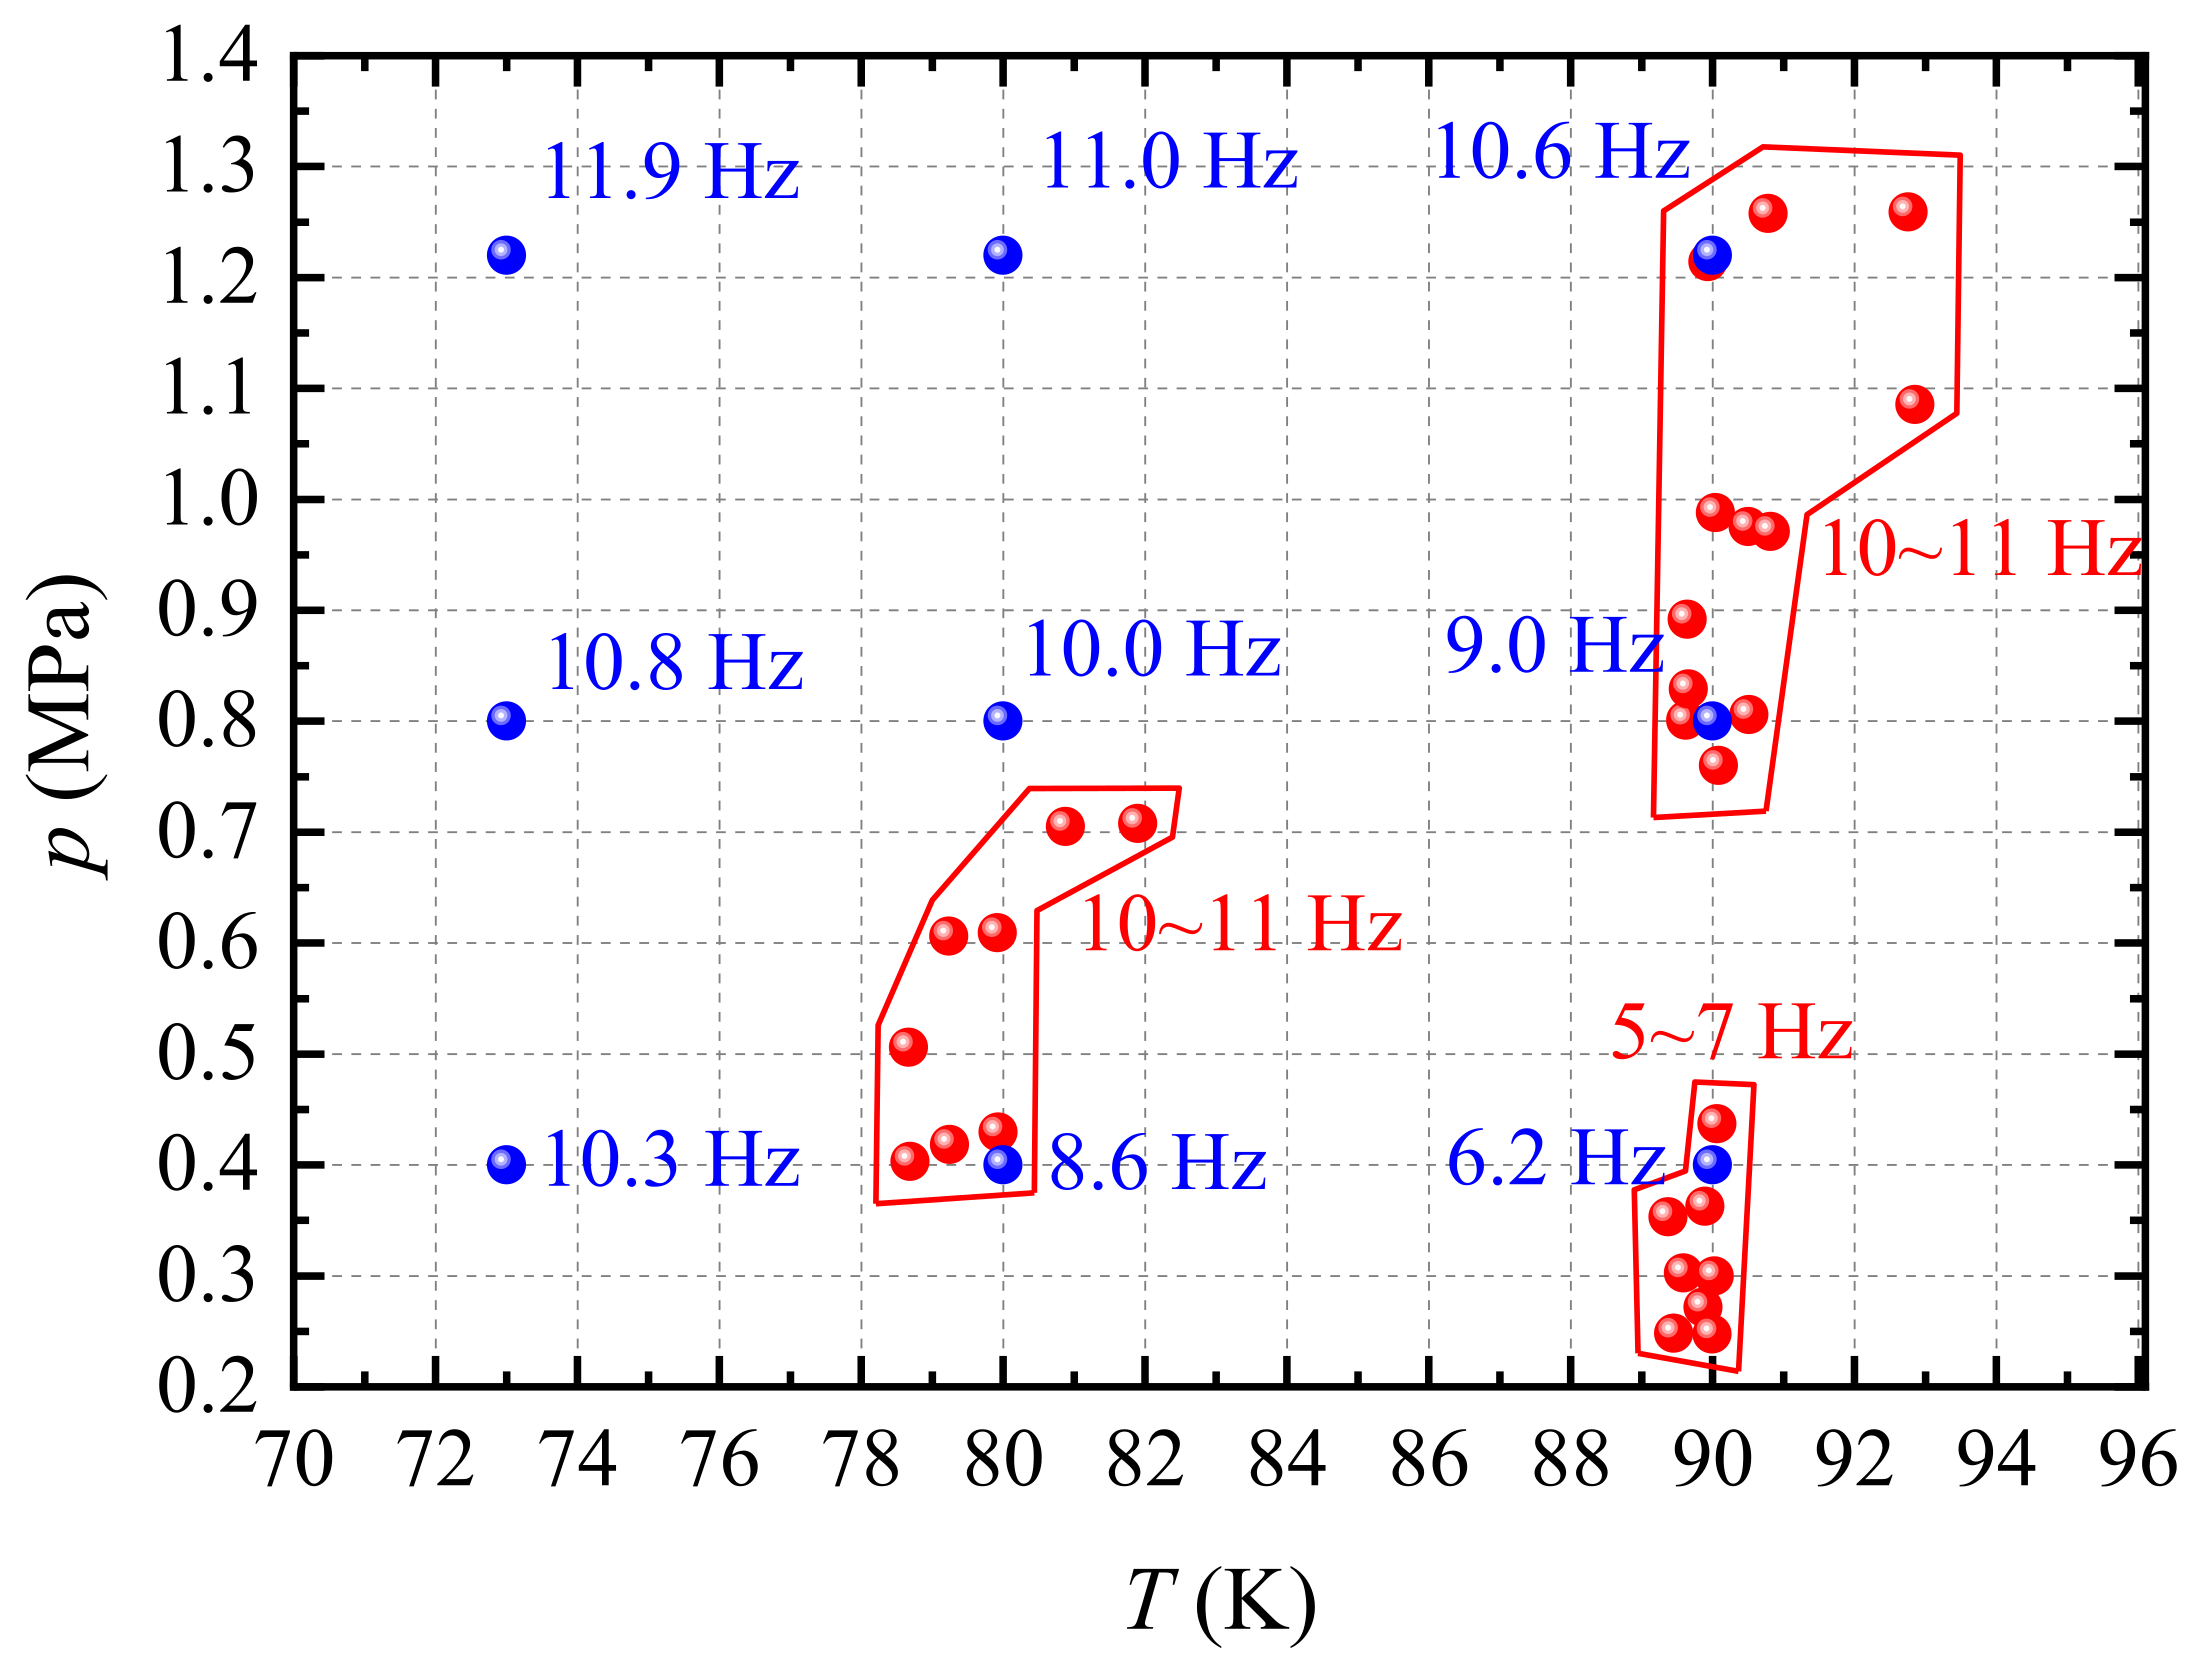
3.3. Effect of Oxygen Mass Flow Rate

Figure 10 shows the comparison of pressure oscillation frequency between the numerical results (blue) and the experimental data (red). The red zones represent three different operating conditions during the engine test run. The numerical results of frequency agree well with the experimental data for the cryogenic rocket test-run. The frequency of pressure oscillation rises with the increase in background pressure. Moreover, with the increase in liquid oxygen temperature, the frequency reduces monotonically. It also implies that the frequency of pressure oscillation rises with the increase in subcooling.
To investigate the effect of mass flow rate on the low-frequency pressure oscillation, several different mass flow rates of liquid oxygen and oxygen vapour are adopted for the numerical simulation. As shown in Figure 11, the frequency of pressure oscillation rises with the increase in both liquid oxygen and oxygen vapour mass-flow rate. It can be deduced that increasing the mass flow rate of liquid oxygen and oxygen vapour properly is a desirable approach to avoid the low-frequency pressure oscillation in the feeding pipe system of the cryogenic liquid rocket.

4. Conclusions

In a feeding pipe system of cryogenic liquid rockets, low-frequency pressure oscillation is a suspending problem on the oxygen jet condensation. In this paper, an oxygen jet condensation simulation was conducted by a novel mass transfer model. The new model combines the interfacial curvature and mass transfer rate. It is the key factor to determine the frequency of pressure oscillation. The new model is validated by a steam jet condensation simulation and the corresponding result is in very good agreement with the experimental data.
As for the mechanism of low-frequency pressure oscillation, it is caused by the periodic condensation mass-transfer rate of the continuous oxygen vapour plume, along with a periodic suck-back flow phenomenon in the injection hole of vapour oxygen. The excitation frequency of pressure oscillation is 10.6 Hz under certain working conditions, which is close to the natural frequency of the engine test run. In addition, the results indicate that both the oxygen and liquid oxygen mass flux promote the rise in the frequency of pressure oscillation. The frequency also rises with the increment of liquid oxygen subcooling. These conclusions provide theoretical instruction for the design and operation of the propulsion system of a cryogenic liquid rocket.

Author Contributions

Conceptualization, Y.L. and C.Z.; methodology, C.Z.; software, C.Z.; validation, C.Z., F.X. and L.W.; formal analysis, C.Z.; investigation, Y.M.; resources, C.Z.; data curation, C.Z.; writing—original draft preparation, C.Z.; writing—review and editing, Y.L.; visualization, C.Z.; supervision, Y.L.; project administration, Y.L.; funding acquisition, Y.L. All authors have read and agreed to the published version of the manuscript.

Funding

This research was funded by the Research Fund of State Key Laboratory of Technologies in Space Cryogenic Propellants (SKLTSCP202207).

Acknowledgments

The authors gratefully acknowledge the support from the Research Fund of State Key Laboratory of Technologies in Space Cryogenic Propellants (SKLTSCP202207). The numerical calculation is also supported by the high-performance computing platform of Xi’an Jiaotong University.

Conflicts of Interest

The authors declare no conflict of interest.

References

  1. Chen, E.; Zheng, M.; Fang, H.; Xue, L.; Ma, F. Numerical Study on the Low-Frequency Pressure Fluctuation Characteristics of Liquid Oxygen Delivery System Based on Acoustic Theory. Aerosp. China 2021, 22, 65–72. [Google Scholar]
  2. Mao, H.; Li, Y.; Zhu, K.; Xie, F.; Li, X.; Zhang, D. Numerical investigation on the direct contact condensation of oxygen jets in a cryogenic pipe. Cryogenics 2021, 119, 103364. [Google Scholar] [CrossRef]
  3. Yang, C.; Fang, J.; Cai, G.; Tang, Y. Research on influence of pressure wave on mixing and condensation of cryogenic gas-liquid two-phase flow in vertical pipe. J. Rocket. Propuls. 2020, 46, 9–14. [Google Scholar] [CrossRef]
  4. Zhang, M.; Li, B.; Xing, L. Study on frequency characteristics of oxygen feed system based on gas jet and condensation. Acta Aeronaut. Astronaut. Sin. 2020, 41, 142–151. [Google Scholar]
  5. Chen, J.; Cao, C.; Yang, Y.; Li, M.; Liu, Y. General technical review of Long March 5 liquid oxygen kerosene engine. J. Deep. Space Explor. 2021, 8, 354–361. [Google Scholar]
  6. Tanskanen, V.; Jordan, A.; Puustinen, M.; Kyrki-Rajamäki, R. CFD simulation and pattern recognition analysis of the chugging condensation regime. Ann. Nucl. Energy 2014, 66, 133–143. [Google Scholar] [CrossRef]
  7. Gibou, F.; Chen, L.; Nguyen, D.; Banerjee, S. A level set based sharp interface method for the multiphase incompressible Navier–Stokes equations with phase change. J. Comput. Phys. 2007, 222, 536–555. [Google Scholar] [CrossRef]
  8. Song, S.; Zhao, Q.; Chong, D.; Chen, W.; Yan, J. Numerical investigation on the heat transfer characteristics of unstable steam jet under different operating conditions. Int. J. Heat Mass Transf. 2021, 180, 121761. [Google Scholar] [CrossRef]
  9. Song, S.; Yue, X.; Zhao, Q.; Chong, D.; Chen, W.; Yan, J. Numerical study on mechanism of condensation oscillation of unstable steam jet. Chem. Eng. Sci. 2020, 211, 115303. [Google Scholar] [CrossRef]
  10. Xu, Q.; Zhu, Y.; Zhou, H.; She, Y.; Guo, L. Flow characteristic of steam jet condensed into a water pipe flow—A numerical study. Appl. Therm. Eng. 2022, 205, 118034. [Google Scholar] [CrossRef]
  11. Xu, Q.; Liu, C.; Liu, Q.; Zhu, Y.; Zhou, H.; Guo, L. Interfacial characteristics of steam jet condensation in subcooled water pipe flow—An experimental and numerical study. Chem. Eng. Sci. 2022, 251, 117457. [Google Scholar] [CrossRef]
  12. Li, S.; Wang, P.; Lu, T. Numerical simulation of direct contact condensation of subsonic steam injected in a water pool using VOF method and LES turbulence model. Prog. Nucl. Energy 2015, 78, 201–215. [Google Scholar] [CrossRef]
  13. Li, S.; Han, W.; Lu, T.; Feng, L.; Hou, N.; Li, T. Numerical study on oscillation characteristics of large chugging of direct condensation of steam in a Tee junction with flowing sub-cooled water. Prog. Nucl. Energy 2021, 135, 103720. [Google Scholar] [CrossRef]
  14. Zhu, K.; Li, Y.; Ma, Y.; Wang, J.; Wang, L.; Li, C. Investigation on interphase mixing and flow condensation process in a vertical channel. Exp. Therm. Fluid Sci. 2018, 98, 1–11. [Google Scholar] [CrossRef]
  15. Anglart, H.; Nylund, O. CFD application to prediction of void distribution in two-phase bubbly flows in rod bundles. Nucl. Eng. Des. 1996, 163, 81–98. [Google Scholar] [CrossRef]
  16. Li, S.; Wang, P.; Lu, T. CFD based approach for modeling steam–water direct contact condensation in subcooled water flow in a tee junction. Prog. Nucl. Energy 2015, 85, 729–746. [Google Scholar] [CrossRef]
  17. Guo, Z.; Fletcher, D.F.; Haynes, B.S. Implementation of a height function method to alleviate spurious currents in CFD modelling of annular flow in microchannels. Appl. Math. Model. 2015, 39, 4665–4686. [Google Scholar] [CrossRef]
  18. Guo, Z.; Haynes, B.S.; Fletcher, D.F. Simulation of microchannel flows using a 3D height function formulation for surface tension modelling. Int. Commun. Heat Mass Transf. 2017, 89, 122–133. [Google Scholar] [CrossRef]
  19. Brackbill, J.; Kothe, D.; Zemach, C. A continuum method for modeling surface tension. J. Comput. Phys. 1992, 100, 335–354. [Google Scholar] [CrossRef]
  20. Lemmon, E.W.; Huber, M.L.; McLinden, M.O. Reference Fluid Thermodynamic and Transport Properties; Tech. Report NIST Standard Reference Database 23, Version 9.1; National Institute of Standards and Technology: Gaithersburg, MD, USA, 2013. [Google Scholar]
  21. Wang, J.; Lu, T.; Deng, J.; Liu, Y.; Lu, Q.; Zhang, Z. Experimental investigation on pressure oscillation induced by steam lateral injection into water flow in a horizontal pipe. Int. J. Heat Mass Transf. 2020, 148, 119024. [Google Scholar] [CrossRef]
  22. Li, S.; Lu, T.; Wang, L.; Chen, H. Experiment study on steam-water direct contact condensation in water flow in a Tee junction. Appl. Therm. Eng. 2017, 120, 99–106. [Google Scholar] [CrossRef]
  23. Wang, J.; Lu, T.; Deng, J.; Zhang, Z.; Lu, Q. Investigation on Direct Contact Condensation of Steam with Non-Condensable Gas in a T-Junction. Nucl. Power Eng. 2020, 41, 114–120. [Google Scholar] [CrossRef]
Figure 1. The typical inlet pressure fluctuation curves during dual engines test run [1]. (a) Inlet pressure variation with time; (b) Local enlarged view.
Processes 10 02448 g001
Figure 2. The specific physical model of the condenser pipe and corresponding grid system. (a) Structure of condenser pipe; (b) numerical grid system.
Processes 10 02448 g002
Figure 3. The pressure variation with time with different grid numbers in the grid independency study.
Processes 10 02448 g003
Figure 4. The distribution of steam volume fraction during the condensation process in case A. (a) numerical results by the present model; (b) Wang’s experimental data [23].
Processes 10 02448 g004aProcesses 10 02448 g004b
Figure 5. The distribution of steam volume fraction during the condensation process in case B.
Processes 10 02448 g005
Figure 6. The history profile of pressure oscillation at the site of T-junction. (a) experimental data [21]; (b) numerical results by the present model.
Processes 10 02448 g006
Figure 7. The numerical results of the low-frequency pressure oscillation phenomenon. (a) pressure oscillation; (b) corresponding spectrum graph.
Processes 10 02448 g007
Figure 8. The distribution of gas volume fraction at six particular points at the time.
Processes 10 02448 g008
Figure 9. The periodic oscillation characteristic of several parameters. (a) temperature at injection hole; (b) density at injection hole; (c) gas inlet velocity; (d) gas velocity at injection hole; (e) mass flow rate at outlet; (f) total volume of oxygen vapour.
Processes 10 02448 g009aProcesses 10 02448 g009b
Figure 10. The numerical results (blue) and experimental data (red) of the frequency of different working conditions.
Processes 10 02448 g010
Figure 11. The effect of oxygen mass flow rate on the frequency.
Processes 10 02448 g011
Table 1. The detailed operation condition.
Parameter ItemValueUnit
Back pressure of pipe1.22MPa
GOX mass flow rate1.5kg·s−1
LOX mass flow rate90kg·s−1
GOX temperature150K
LOX temperature90K
Table 2. The detailed experimental conditions of Wang’s experiment.
Parameter ItemValueUnit
Diameter of the main pipe60mm
Length of the main pipe500mm
Diameter of branch pipe15mm
Length of branch pipe1000mm
Steam mass flow rate10kg·h−1
Water temperature40°C
Water volume flow rate2 (case A), 4 (case B)m3·h−1
Publisher’s Note: MDPI stays neutral with regard to jurisdictional claims in published maps and institutional affiliations.

