In this section, simulated results will be presented. The temperature field and flow field will be first introduced. Secondly, the influence of fin root thickness and fin tip thickness on Nu, Eu, PEC, ExP and ExT will be discussed. Then, the correlation formula of Nu and Eu will be fitted. Finally, the parameter optimization will be presented.
4.1. Temperature and Velocity Fields
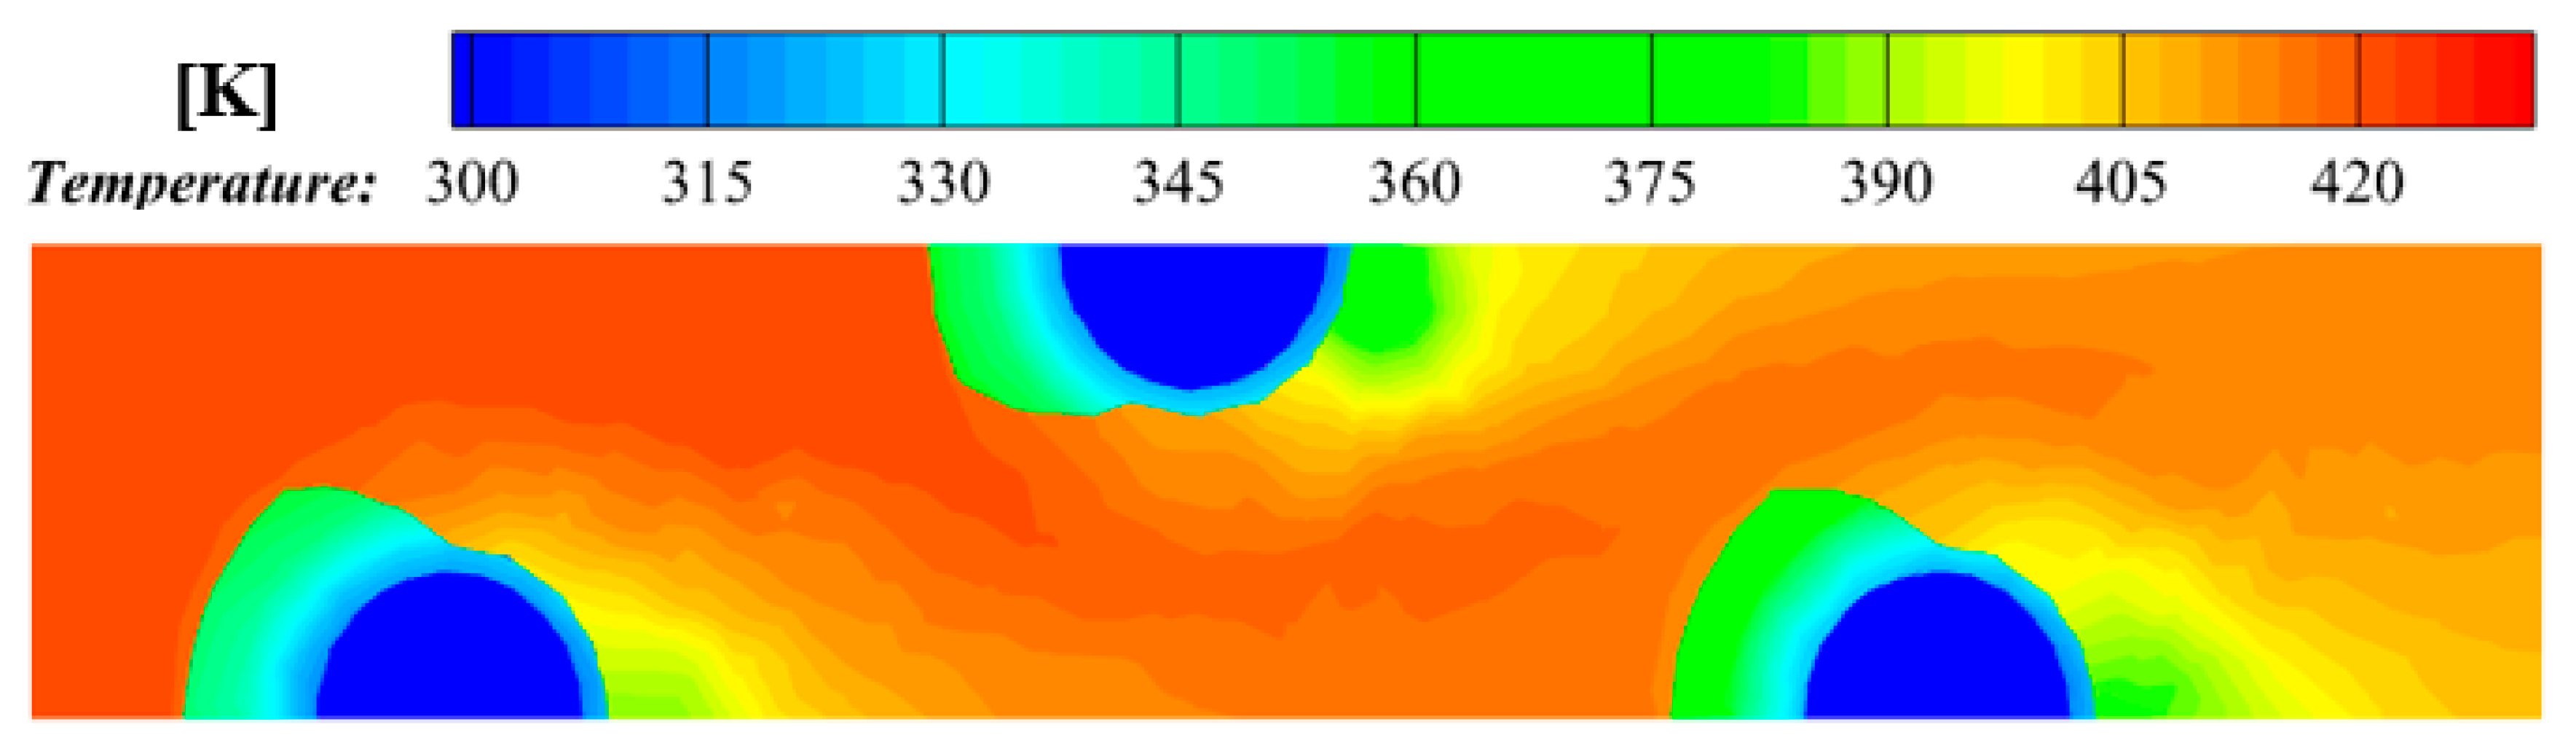
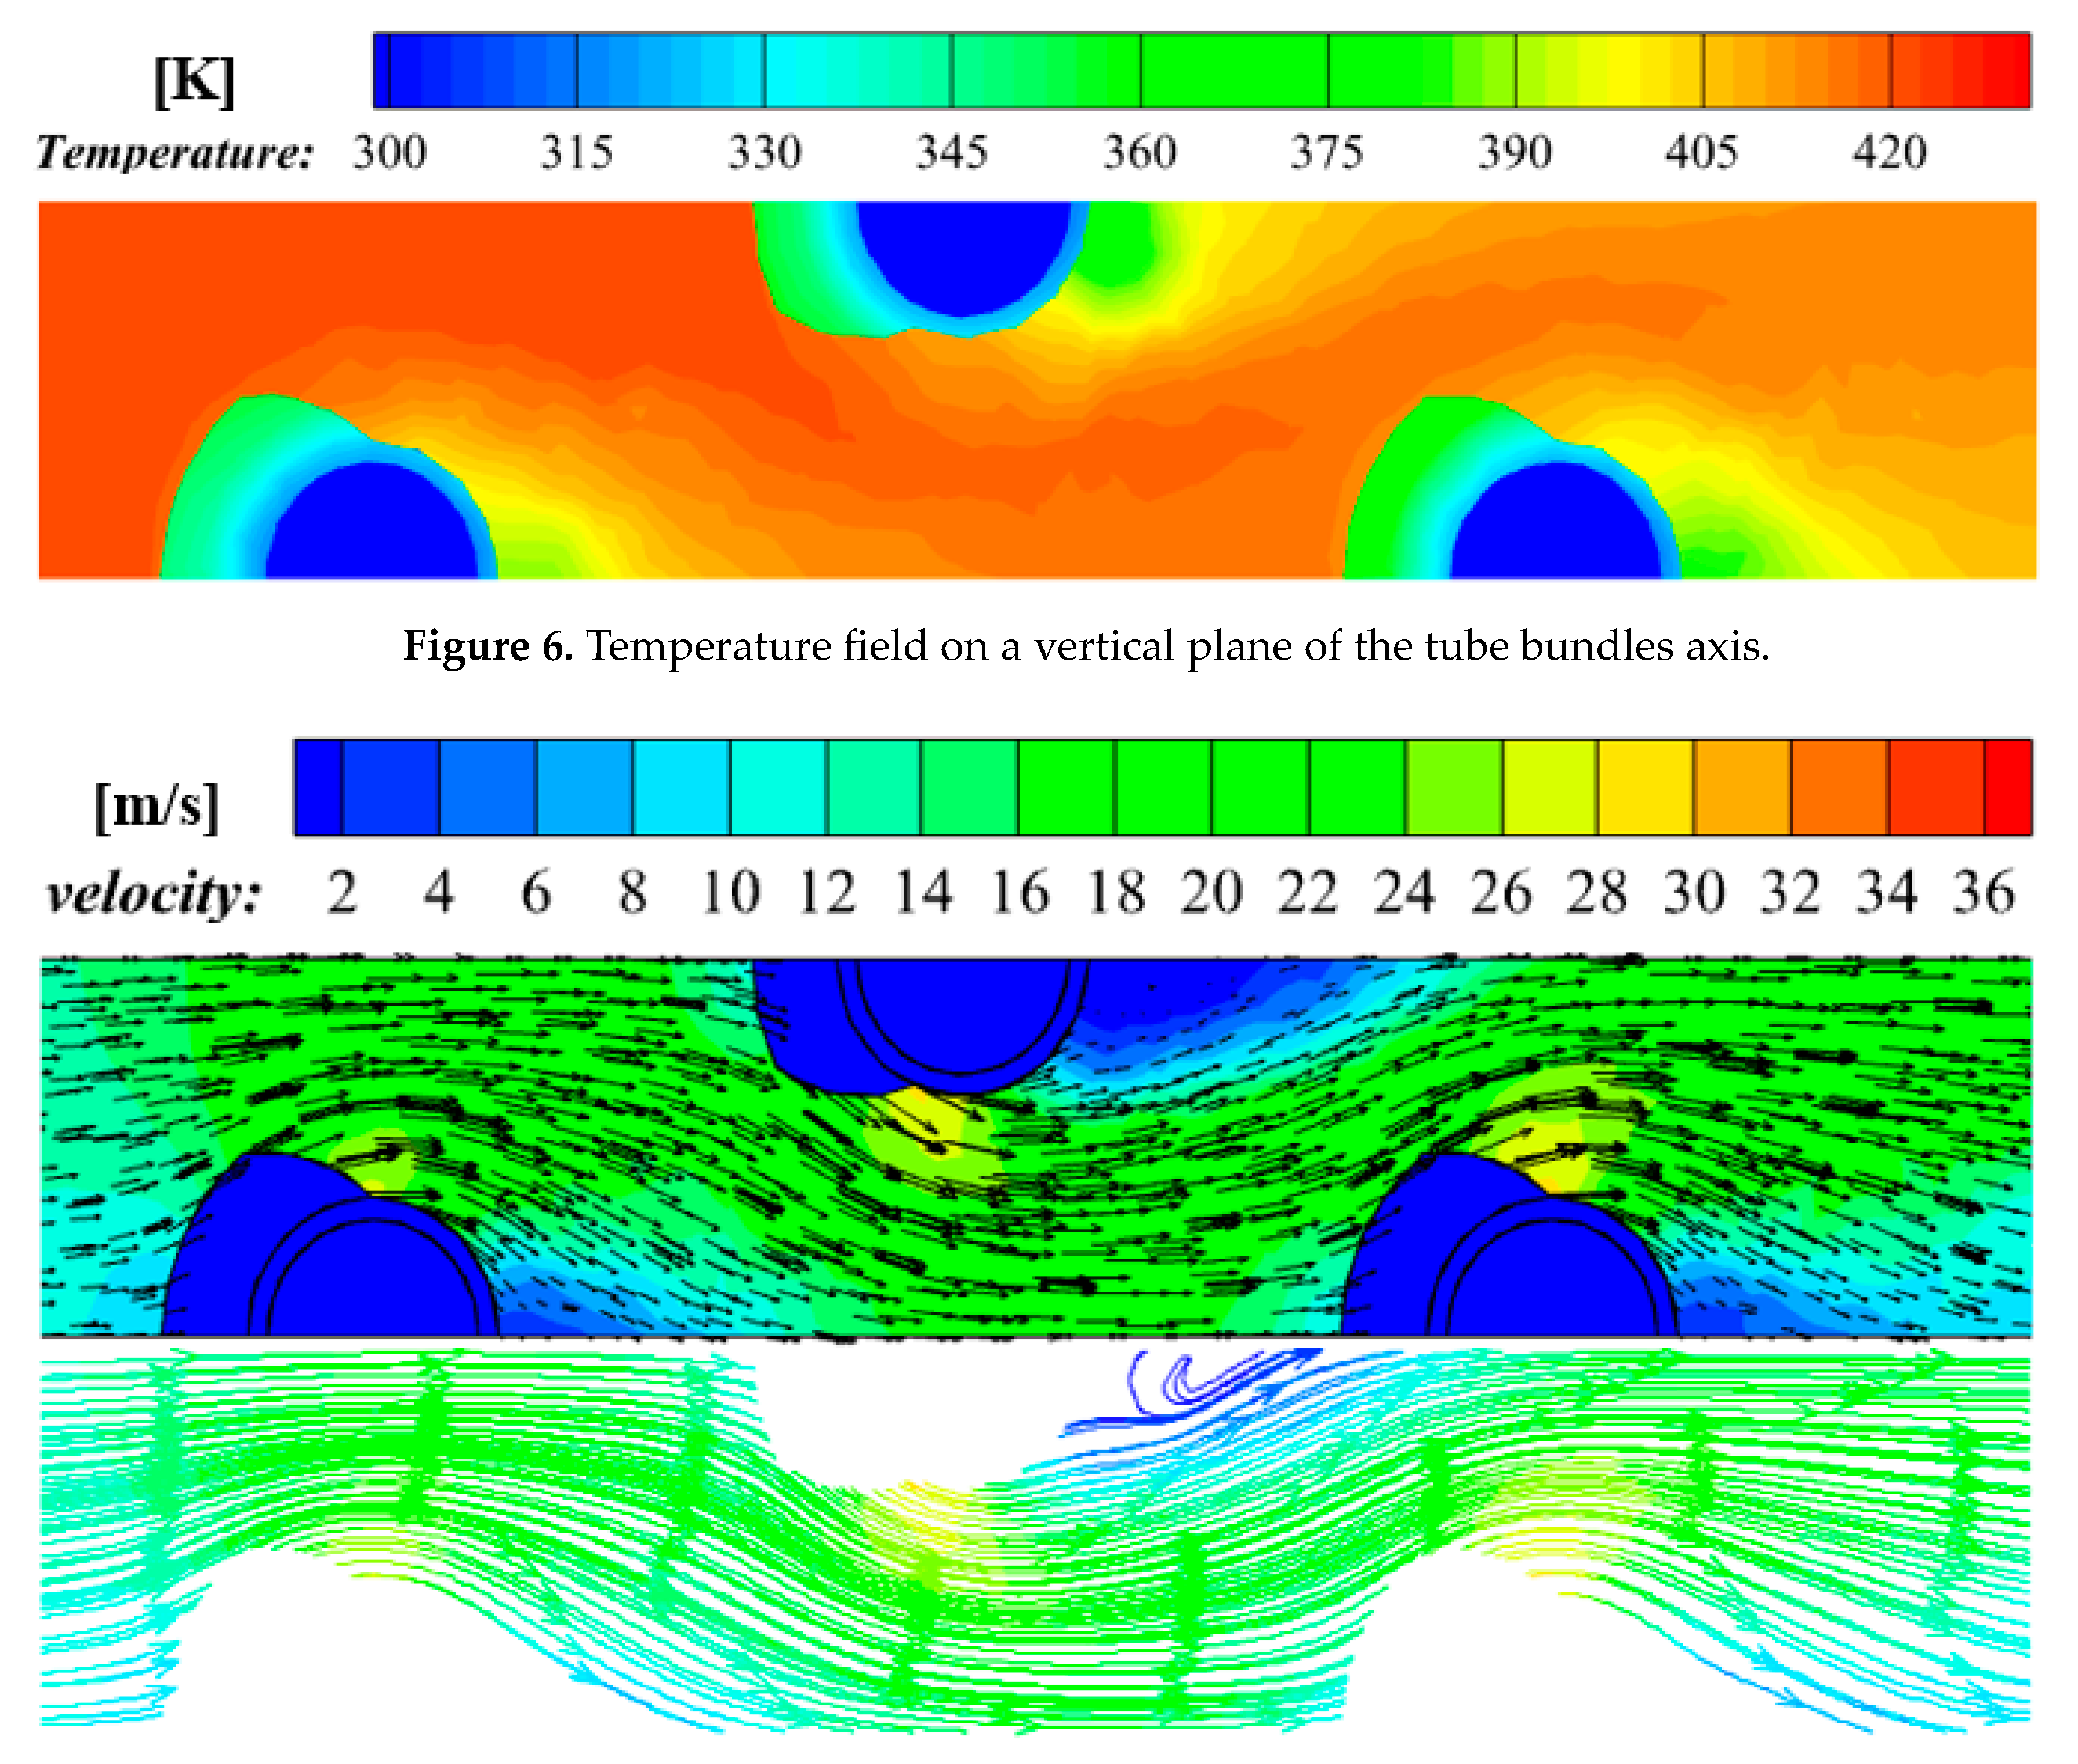
In order to clearly show the flow and heat transfer characteristics of the integral rolled spiral finned tube bundles, the temperature field, velocity field and streamline diagram on a vertical plane of the tube bundles axis are shown in
Figure 6 and
Figure 7.
From
Figure 6, it can be seen that when the gas scours the integral rolled spiral finned tube bundles, the temperature of gas decreases with the increase in the number of tube rows. Convective heat transfer occurs between the outer wall of the integral rolled spiral finned tube and the gas, and the temperature of the outer wall increases. Thermal conduction occurs between the outer wall and the inner wall of the integral rolled spiral finned tube bundles. It can be seen that the temperature of the tube bundle from the outer wall to the inner wall is gradually reduced. Convective heat transfer occurs between the water and the inner wall of the integral rolled spiral finned tube bundles, and the temperature of water gradually rises. After the gas contacts the tube wall, it will flow along the direction of the tube wall. At this time, the velocity of gas gradually increases until the gas is detached from the integral rolled spiral finned tube bundles. And then the gas after the detachment will flow into the mainstream. Due to the effect of gas detachment, there will be a low temperature zone behind the integral rolled spiral finned tube bundles. The formation of the low temperature zone is not conducive to the heat transfer of the tube bundles.
It can also be seen that when the gas scours through the integral rolled spiral finned tube bundles, the velocity of gas on the front of the windward side decreases. The gas flows along the tube wall, and the velocity of gas gradually increases until the gas is detached from the integral rolled spiral finned tube bundles, which will lead to a low-speed zone of gas at the leeward side of the tube bundles. The formation of the low-speed zone is not conducive to the heat transfer of the integral rolled spiral finned tube bundles. The detached gas will merge with other gases to continue to scour the integral rolled spiral finned tube bundles.
4.2. Effect of Fin Root Thickness and Fin Tip Thickness on Evaluation Indexes
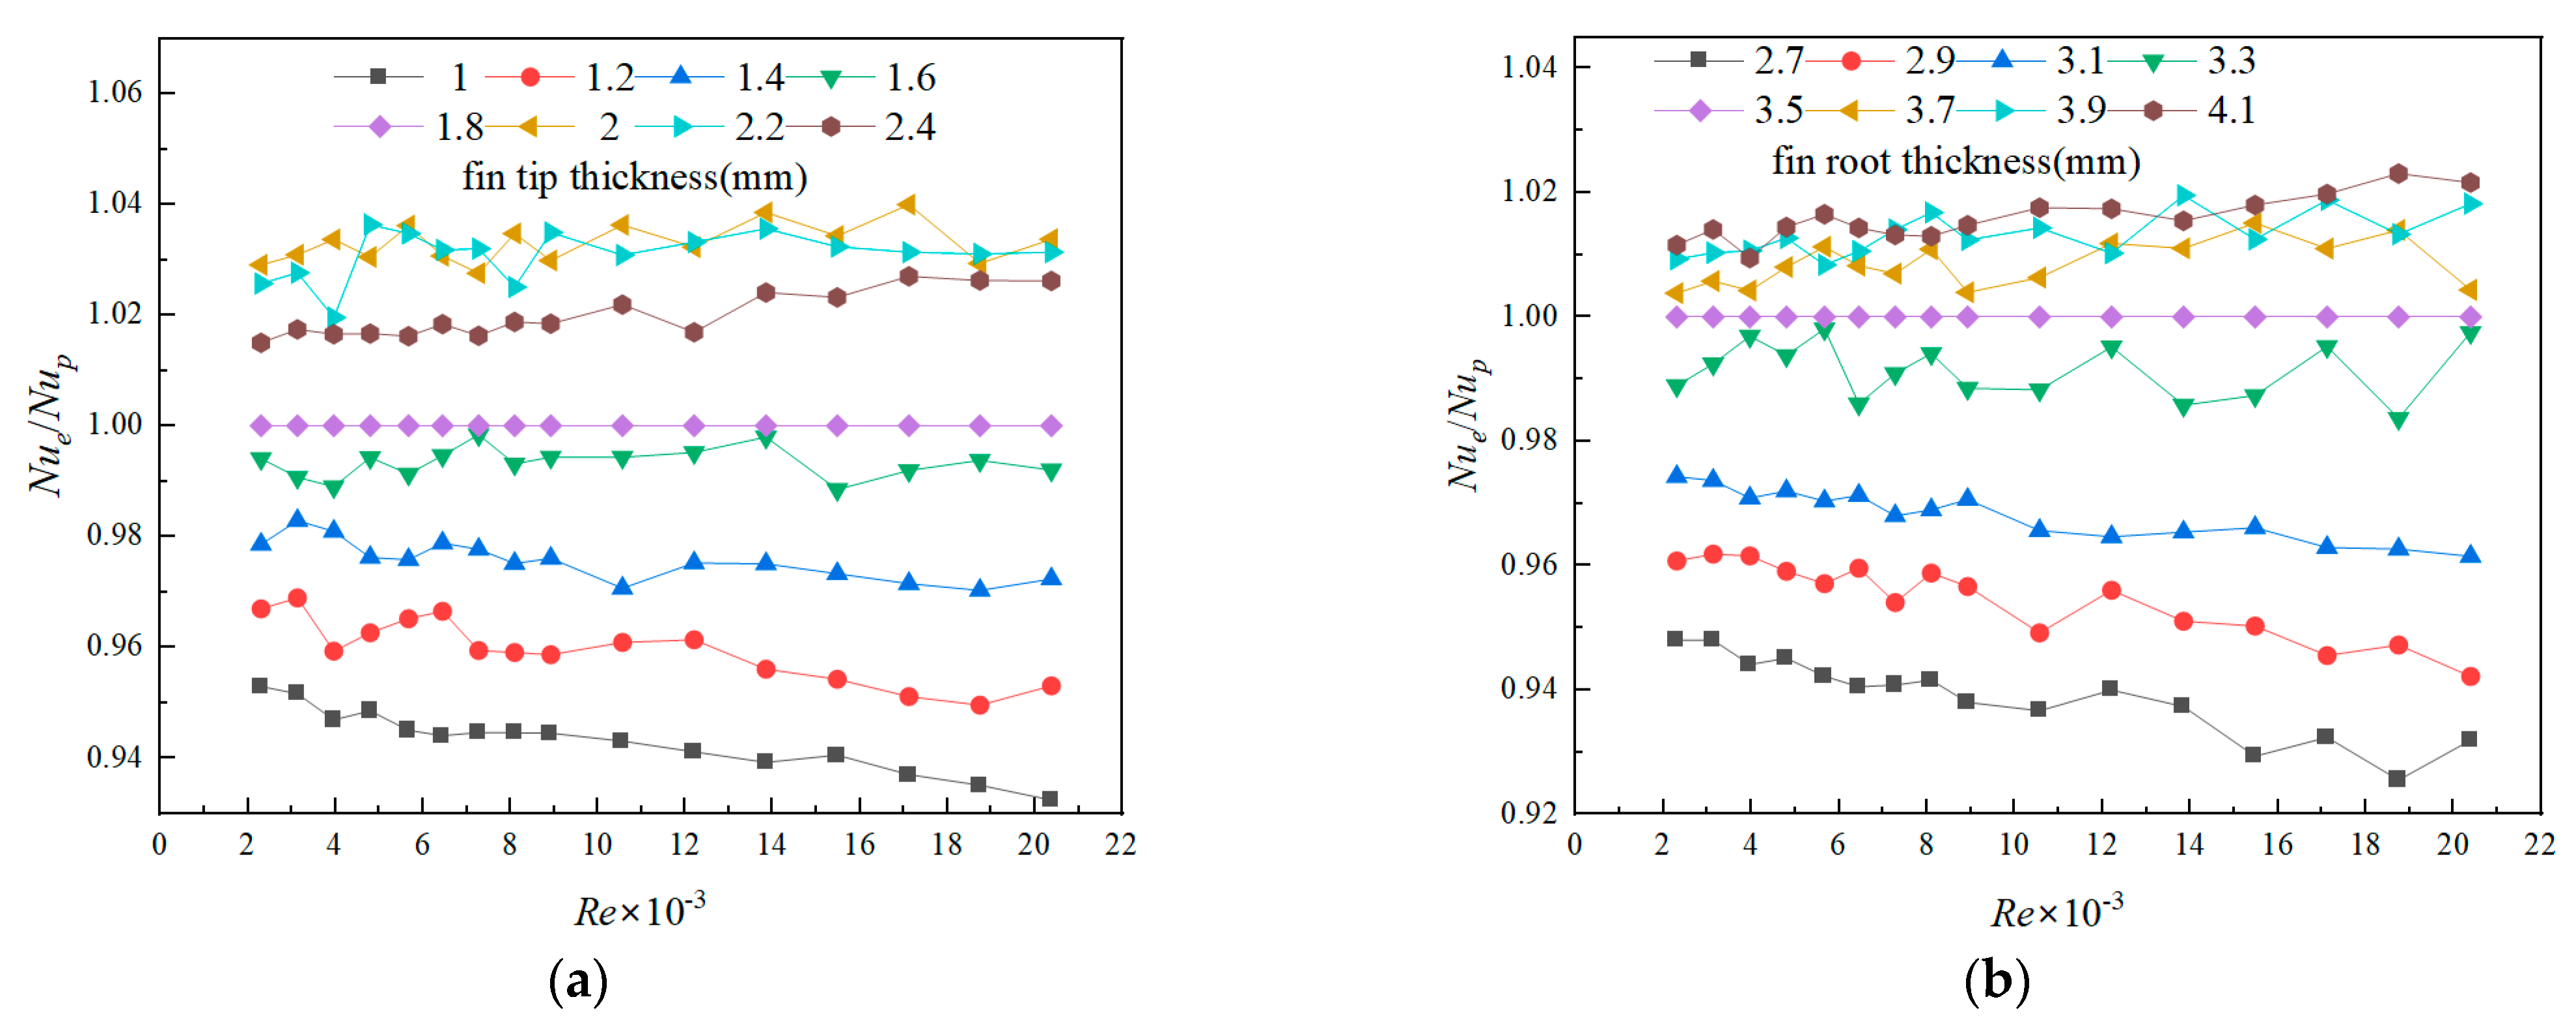
Figure 8 shows the influence of the fin tip thickness and the fin root thickness on the heat transfer characteristics of integral rolled spiral finned tube bundles. Compared with a fin tip thickness of 1.8 mm, when
Nue/Nup is greater than 1, it means that the heat transfer performance of the finned tube bundles with the adjusted parameters is better than that with the primeval parameters. The heat transfer capacity of the integral rolled spiral finned tube bundles shows a downward parabolic trend with the increase in fin tip thickness. When
δ1 = 2 mm,
Nue/Nup reaches the maximum value and
Nu is increased by an average of 3.29%. This is because the flow area of gas changes with the increase in fin tip thickness in the range of 1–2 mm. The primary and secondary turbulence near the wall of integral rolled spiral finned tube bundles is enhanced and the temperature is increased, which enhances the heat transfer of the finned tube bundles. When the fin tip thickness is greater than 2 mm, the flow area of gas is too narrow, which reduces the gas disturbance on the surface of the finned tube bundles.
The effect of fin root thickness on
Nu is shown in
Figure 8b. It can be found that the heat transfer performance of the integral rolled spiral finned tube bundles increases monotonously with the increase in the fin root thickness. When
δ2 = 4.1 mm, the
Nue/Nup reaches the maximum value, and
Nu is increased by an average of 1.59%. This is because as the fin root thickness increases, the flow area of gas near the wall becomes narrow, which enhances the disturbance of the gas near the surface of the finned tube bundles and the heat transfer performance.
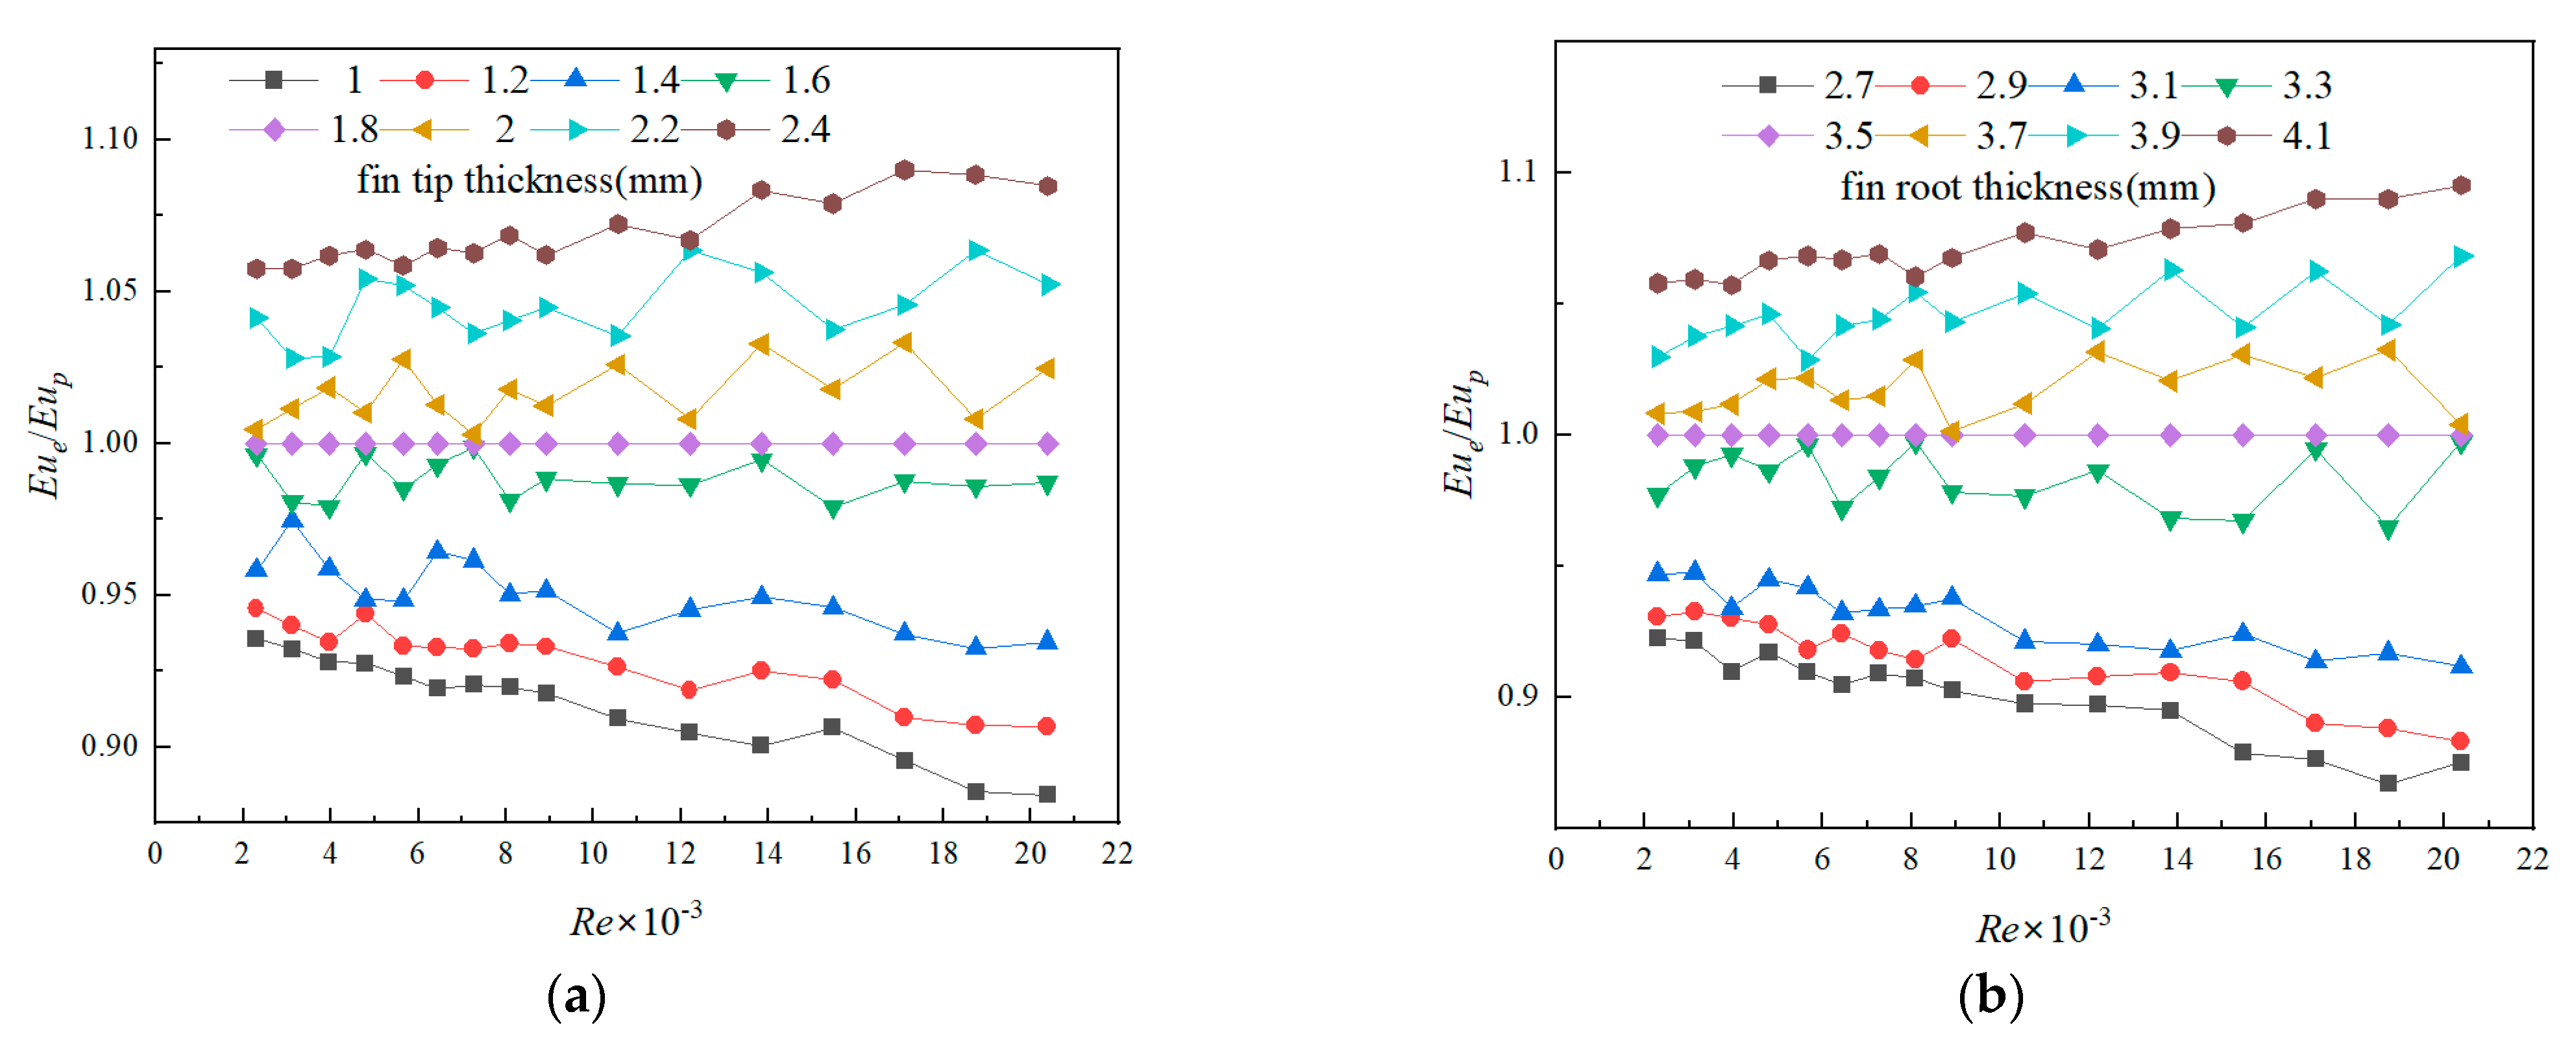
Figure 9a reveals the influence of the fin tip thickness on the flow resistance characteristics. The results show that the flow resistance increases with the increase in the fin tip thickness, showing a monotonically increasing trend. When
δ1 = 2.4 mm, the maximum value is obtained, and
Eu is increased by an average of 7.01%.
Figure 9b shows the influence of fin root thickness on the flow resistance characteristics. It can be seen from the figure that the flow resistance increases with the increase in fin root thickness, showing a monotonically increasing trend. The reason for these situations is that the increase in the fin tip thickness and fin root thickness reduces the flow area of the gas, which increases the gas velocity and the flow resistance of the gas.
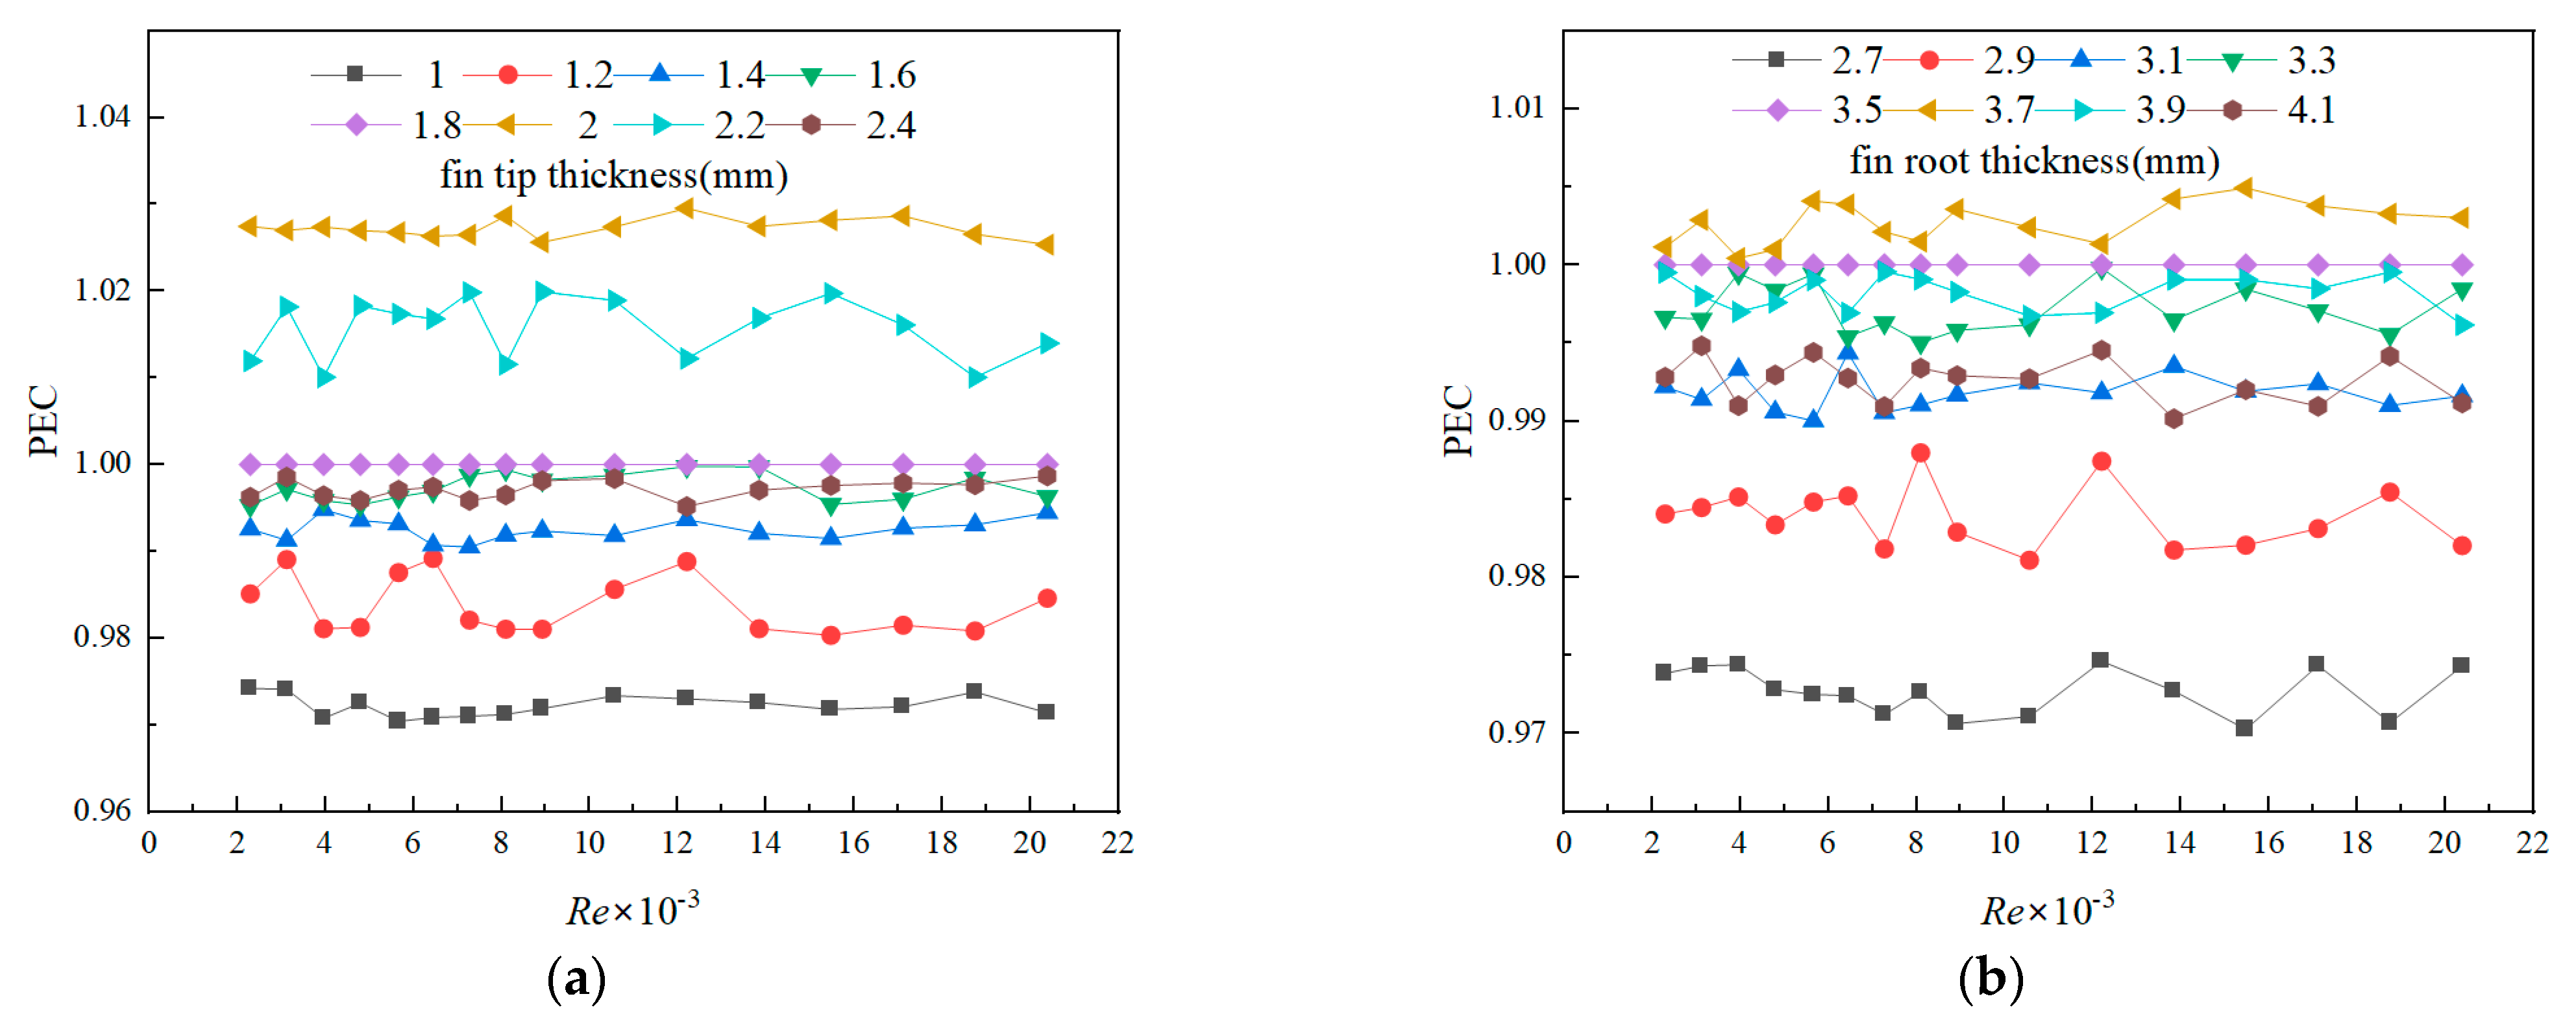
Figure 10 exhibits the effect of fin tip thickness and fin root thickness on PEC, respectively. As shown in
Figure 10a, the PEC displays a parabolic trend with the downward opening as fin tip thickness increases in the range of simulated results. The best comprehensive heat transfer performance can be obtained under the condition of a fin tip thickness of 2 mm, with
PEC being increased by an average of 2.72%. The influence of fin root thickness on PEC is shown in
Figure 10b. It can be found that the PEC shows a parabolic trend with the downward opening as fin root thickness increases in the range of simulated results. When the fin root thickness is 3.7 mm, the maximum value is obtained, with an average increase of 0.27%. This also shows that adjusting the fin root thickness has little effect on the comprehensive heat transfer performance of the integral rolled spiral finned tube bundles.
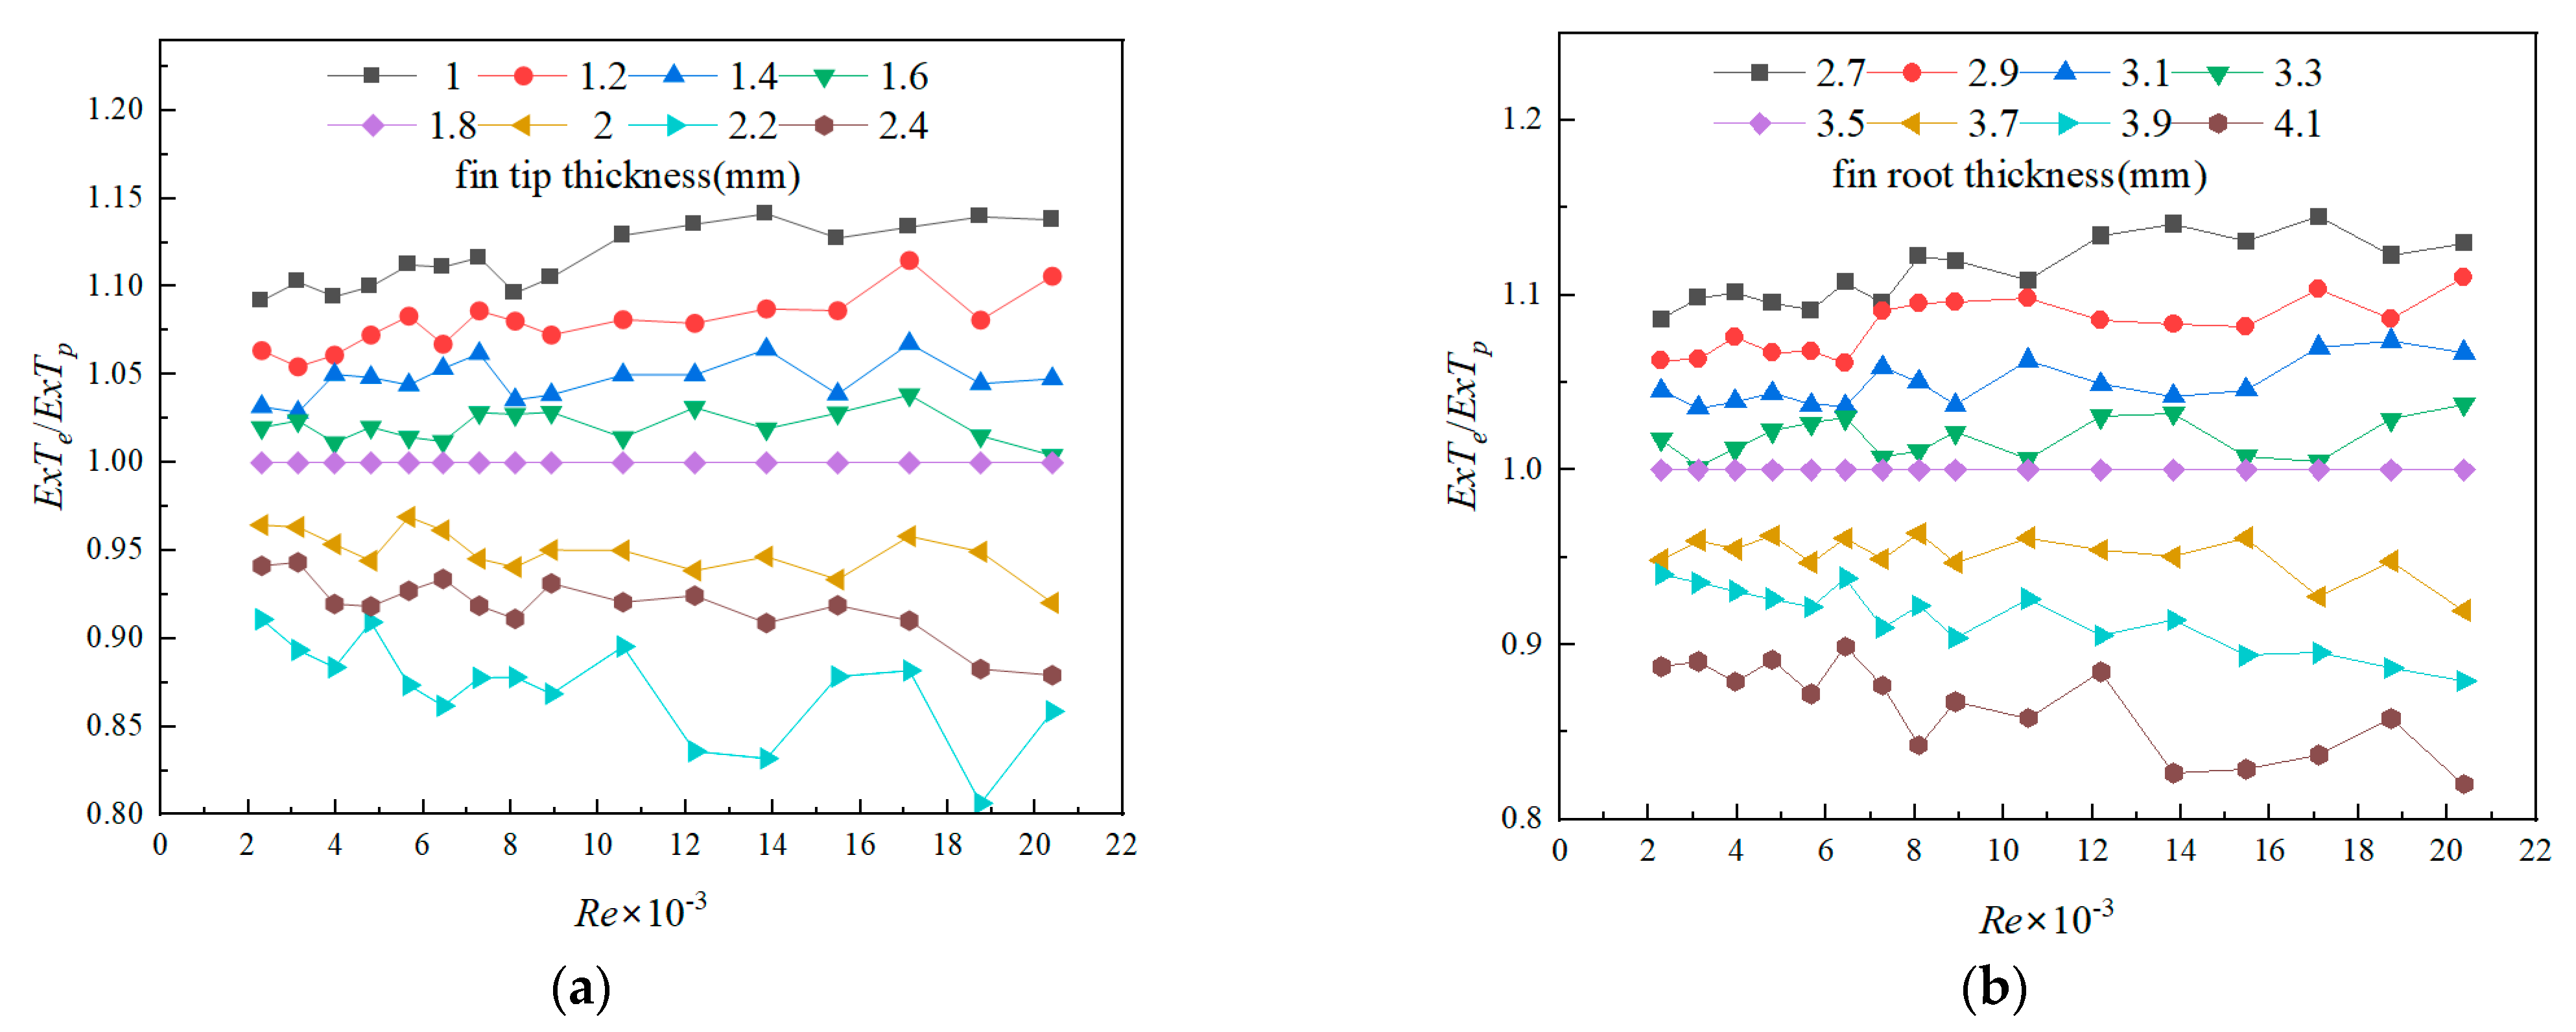
Figure 11a reveals the influence of fin tip thickness on heat transfer exergy destruction. In the range of simulated results, the influence of fin tip thickness on heat transfer exergy destruction shows a trend of decreasing first and then increasing. The minimum heat transfer exergy destruction can be obtained under the condition of a fin tip thickness of 2.2 mm, with the
ExT being decreased by an average of 12.83%. This regulation of results is consistent with that of
Nu. The larger the
Nu, the better the heat transfer performance, and the smaller the heat transfer exergy destruction.
The influence of fin root thickness on heat transfer exergy destruction is shown in
Figure 11b. In the range of simulated results, the effect of the fin root thickness on heat transfer exergy destruction shows a trend of decreasing first and then increasing. The minimum heat transfer exergy destruction can be obtained under the condition of a fin root thickness of 4.1 mm, with the
ExT being decreased by an average of 13.63%. The reason for this situation is that the increase in the fin root thickness increases the heat transfer area of the integral rolled spiral finned tube bundles and strengthens the disturbance of the gas, improving the heat transfer performance of the finned tube bundles.
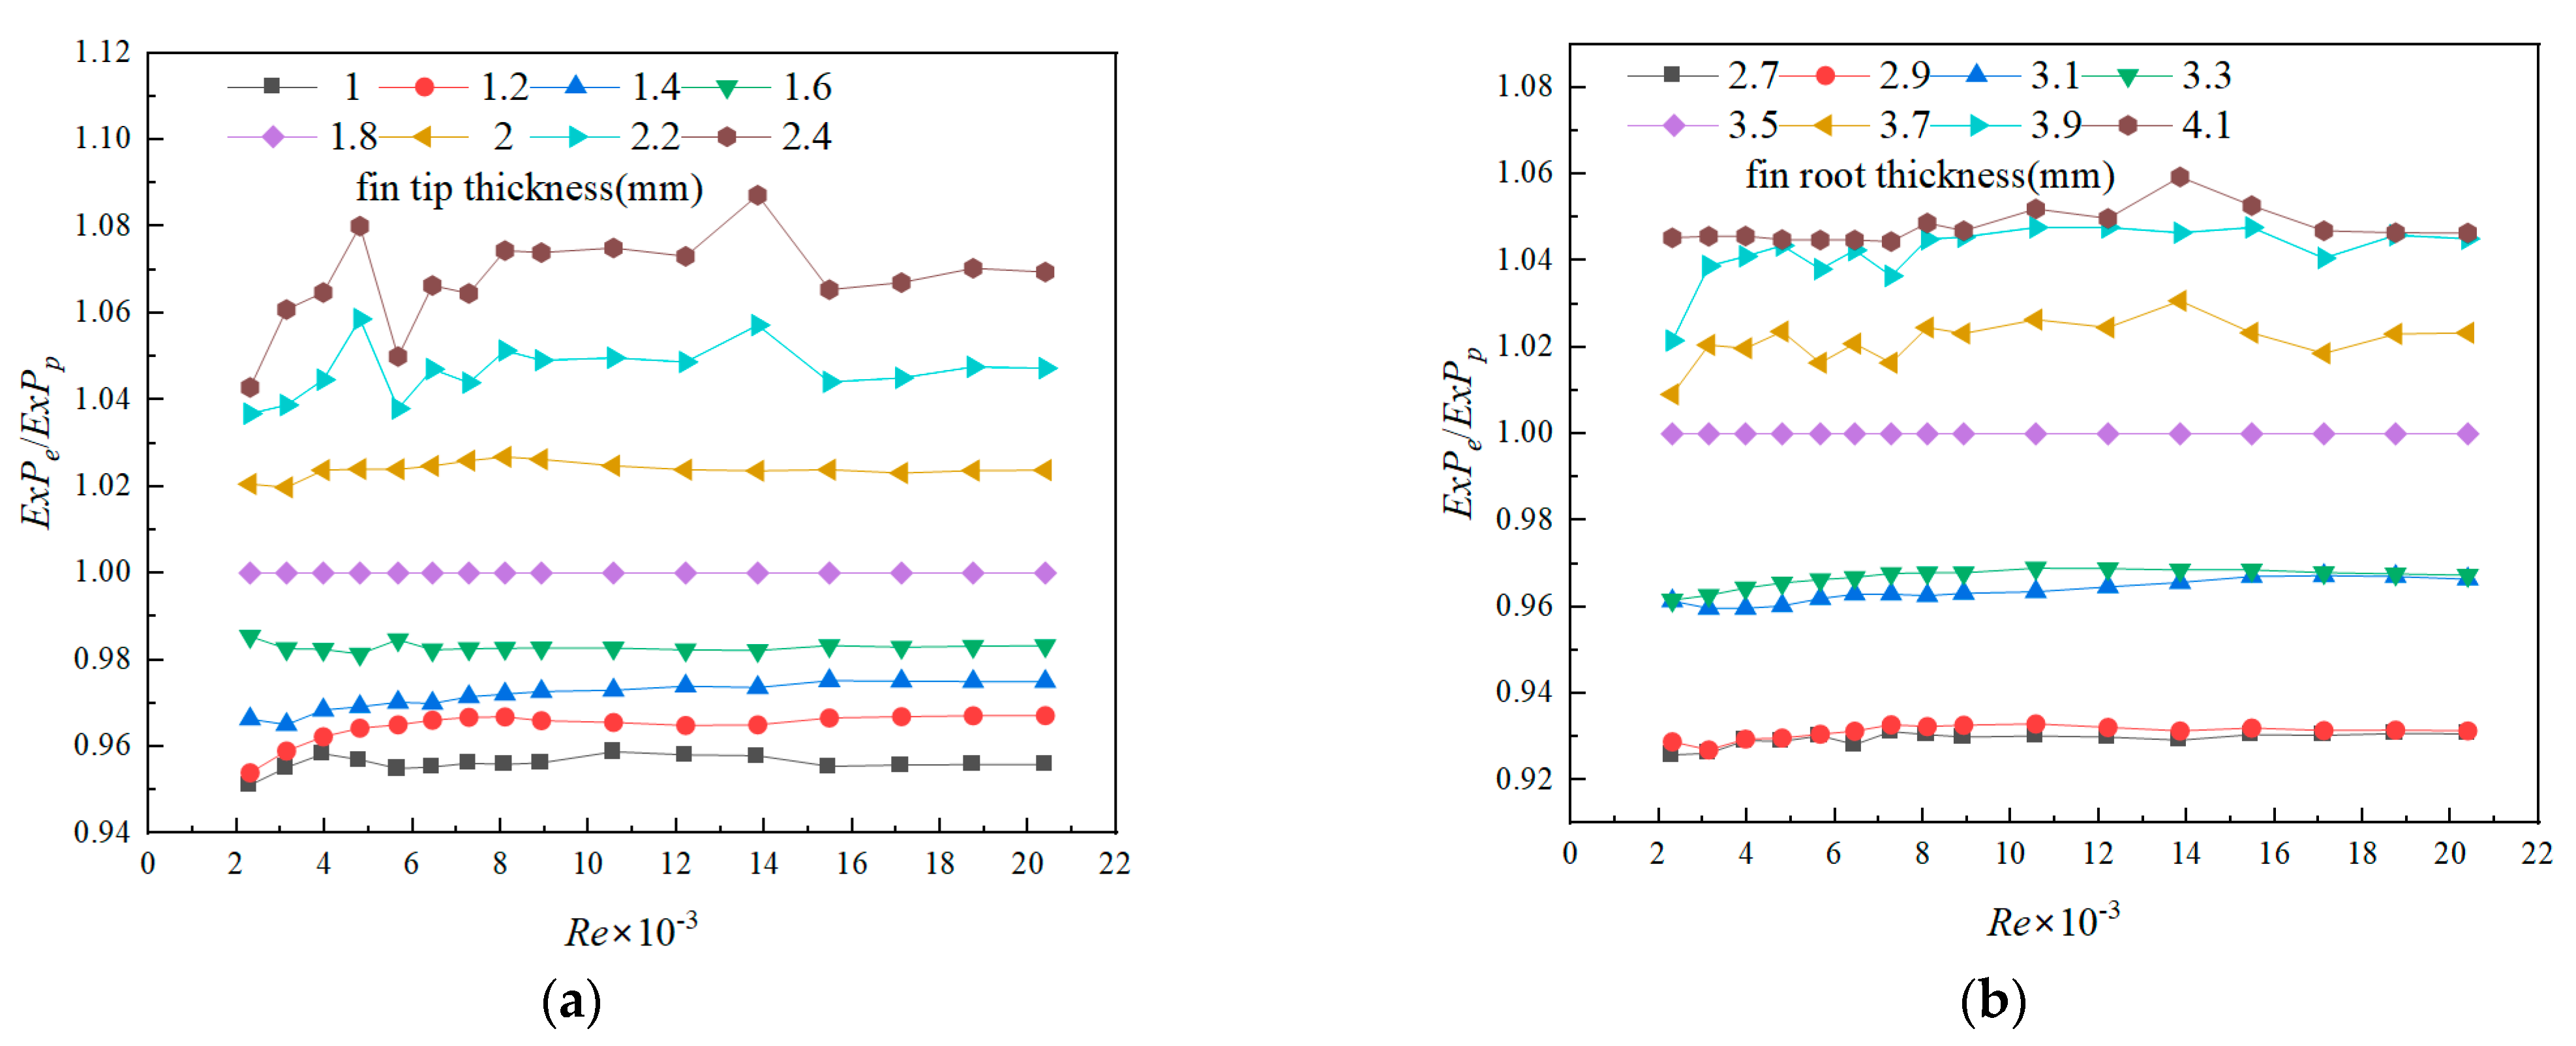
Figure 12a reveals the influence of fin tip thickness on flow exergy destruction. In the range of simulated results, the influence of fin tip thickness on flow exergy destruction shows a monotonically increasing trend. The minimum flow exergy destruction can be obtained under the condition of fin tip thickness of 1 mm, with the
ExP being decreased by an average of 4.39%. This regulation of results is consistent with that of
Eu. The larger the
Eu, the greater the flow resistance, the greater the flow exergy destruction.
The influence of fin root thickness on flow exergy destruction is shown in
Figure 12b. In the range of simulated results, the flow exergy destruction increases monotonically with the increase in the fin root thickness. The minimum flow exergy destruction can be obtained under the condition of fin root thickness of 2.7 mm, with the
ExP being decreased by an average of 7.05%. The reason for this situation is that the increase in fin root thickness reduces the flow area of gas and increases the flow resistance, thus increasing the flow exergy destruction.
4.4. Parameter Optimization
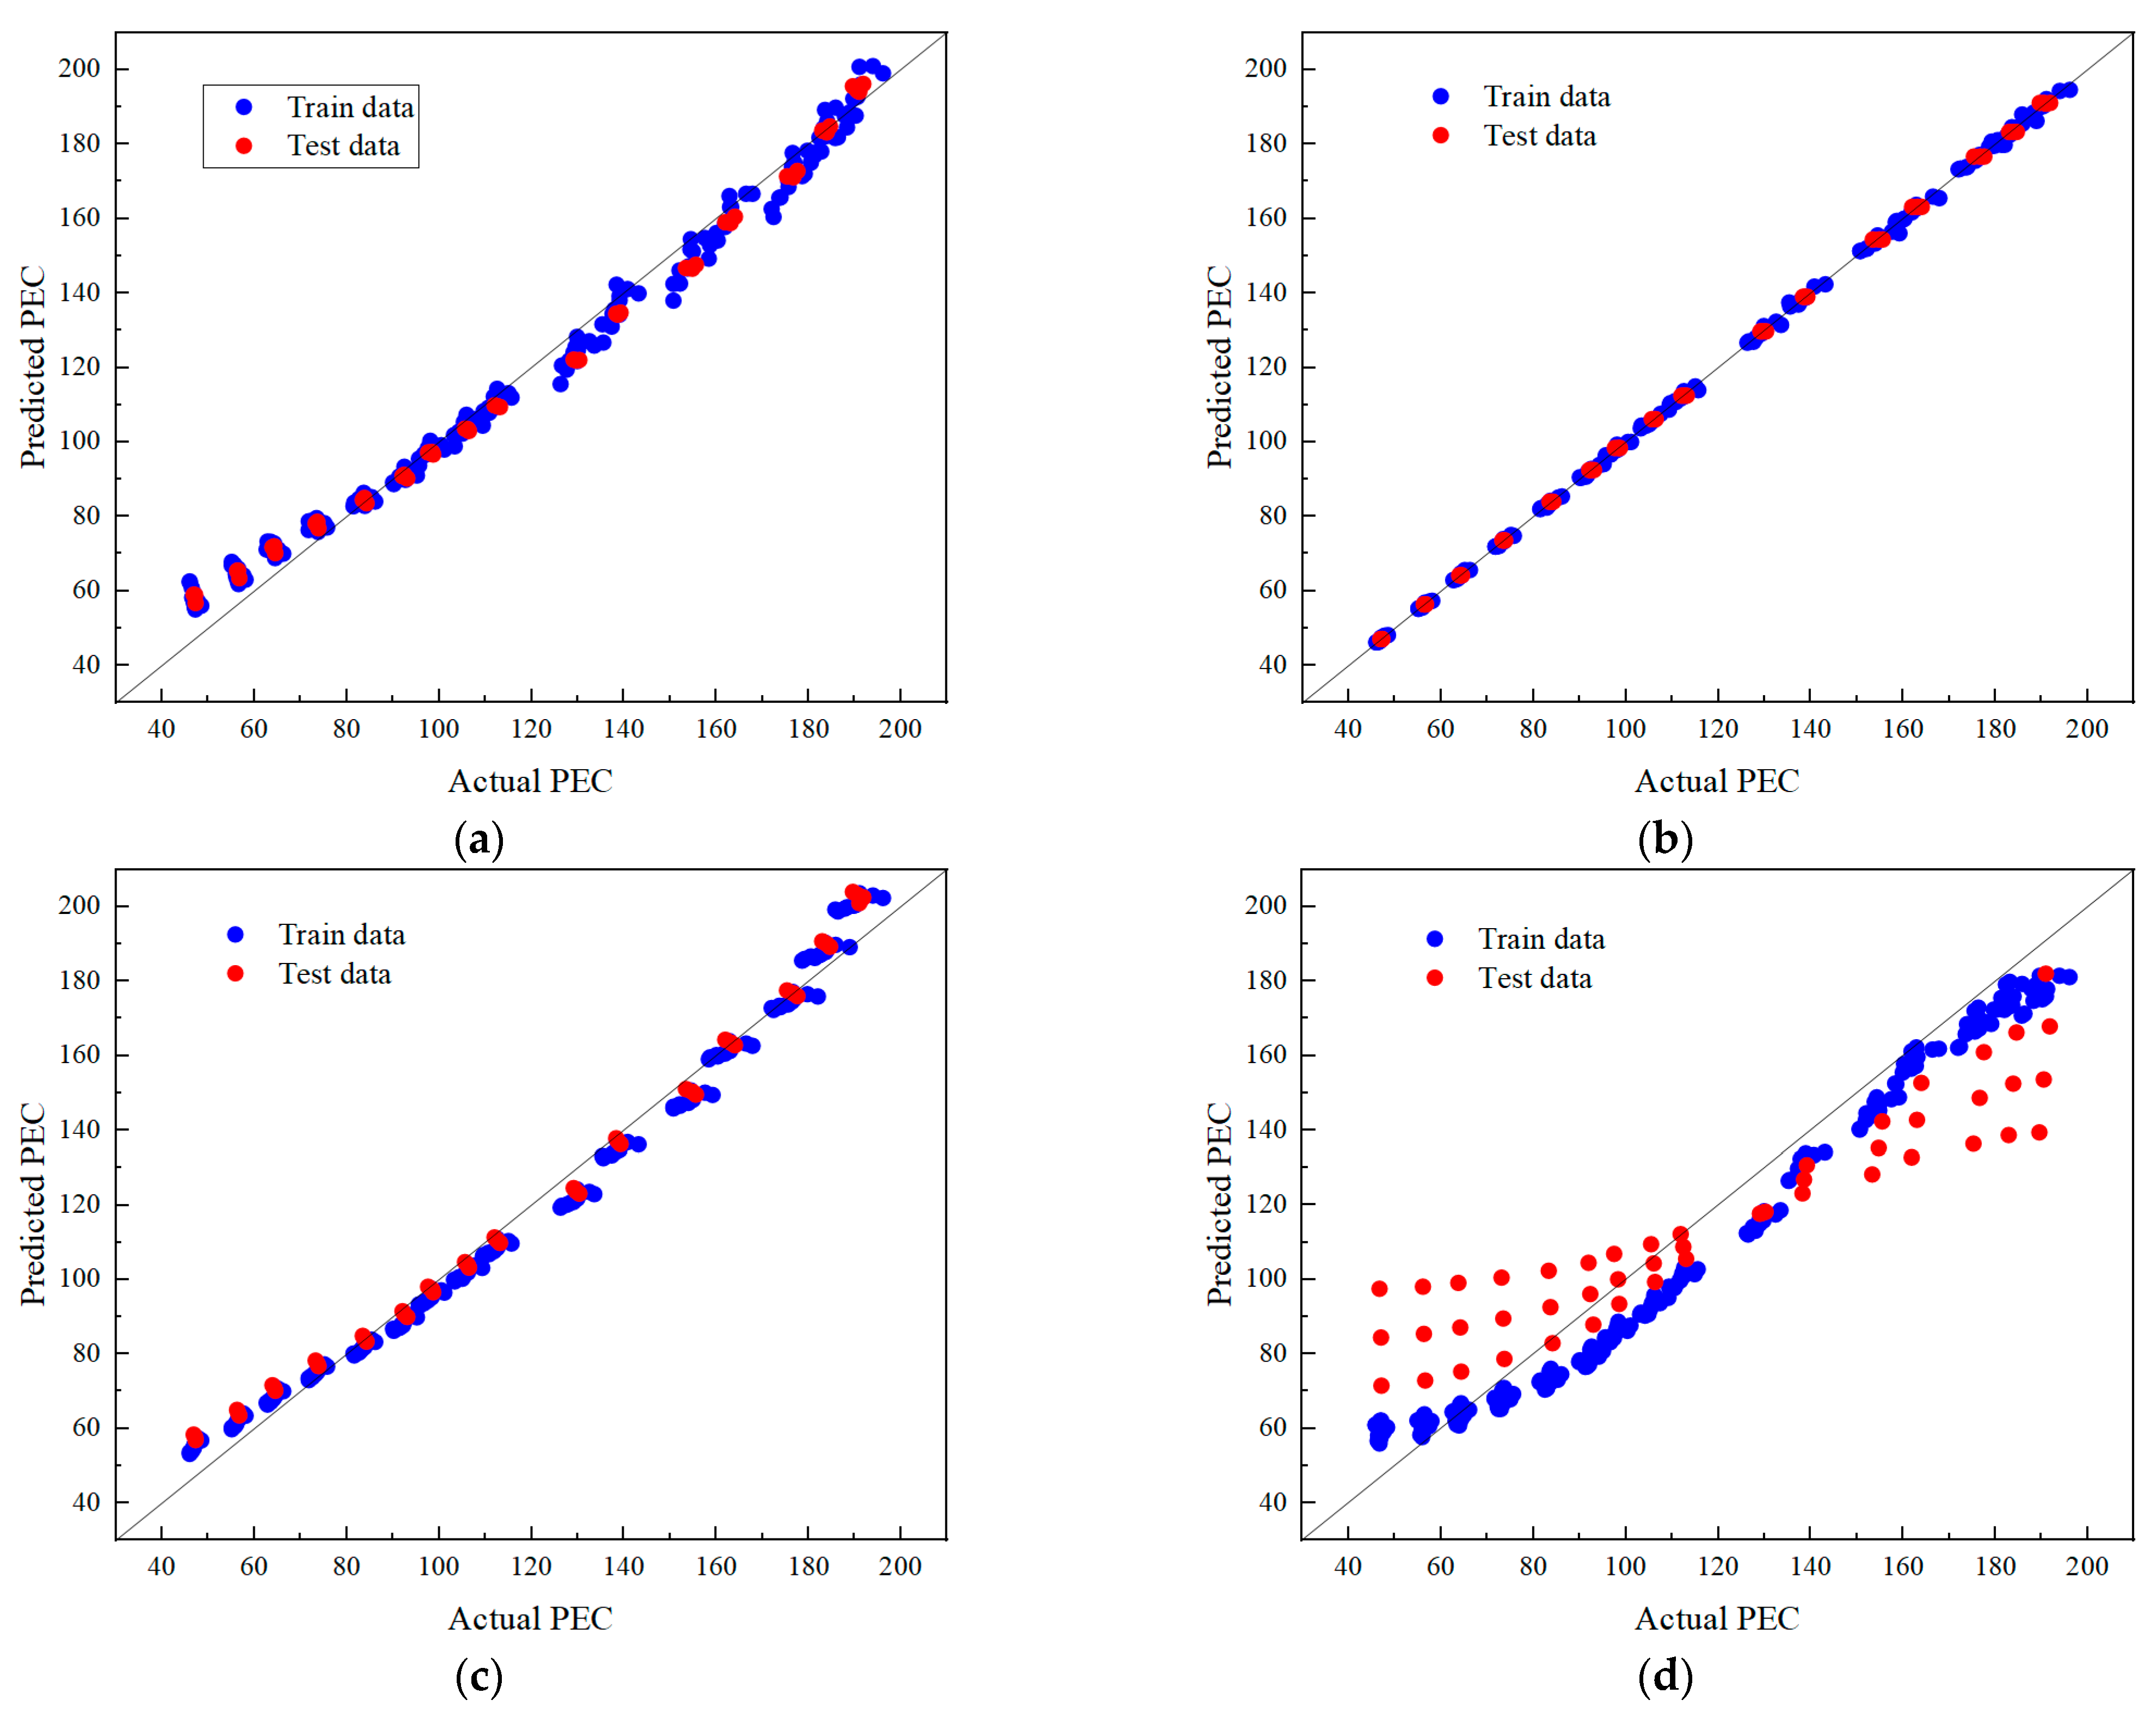
Figure 14 shows the comparison between the predicted and actual results of different models. The results of the running different algorithm are shown in
Table 5. It can be obviously observed that the
R2 of the SVR model is 0.95 on the training set and only 0.74 on the test set, which is a typical overfitting phenomenon. The LR model and ANN model have a good performance in learning the mapping relationship between data. The RFR model has the best prediction results on the training and test data sets. Considering prediction accuracy, running time and model stability, the RFR model is selected as the algorithm of the PEC prediction model.
Table 6 shows the comparison between the original and optimized parameters. The random function is used to randomly generate 10,000 conditions within the given feature range. These conditions are predicted by RFR model and traversed to obtain the optimal condition combination of PEC. The CFD method is used again to verify the predicted optimal combination results. Compared with the actual PEC (190.09), the deviation of the predicted PEC (194.58) is −0.77%. The results indicate that
Re has the greatest influence on PEC while fin tip thickness has the least influence on PEC. When
δ1 = 2 mm,
δ2 = 3.5 mm and
Re = 20,380, the PEC achieves a maximum value of 196.09. When
Re is the same, compared with the primal parameters, PEC is increased by 2.53%,
ExP is increased by 2.37%, and
ExT is decreased by 7.96%.


