Article

Investigation of the Vertical Propagation Pattern of the 3D Hydraulic Fracture under the Influence of Interlayer Heterogeneity

1
PetroChina Xinjiang Oilfield Development Company, Karamay 834000, China
2
China United Coalbed Methane Corporation Ltd., Beijing 100016, China
3
CNPC Western Drilling Engineering Co., Ltd., Karamay 834000, China
4
School of Geoscience and Technology, Southwest Petroleum University, Chengdu 610500, China
*
Author to whom correspondence should be addressed.
Processes 2022, 10(11), 2449; https://doi.org/10.3390/pr10112449
Submission received: 17 October 2022 / Revised: 15 November 2022 / Accepted: 16 November 2022 / Published: 18 November 2022

Abstract

:
The low permeability and thinly interbedded reservoirs have poor physical properties and strong interbedded heterogeneity, and it is difficult to control the hydraulic fracture (HF) height and width during hydraulic fracturing, which affects the effect of HF penetration and sand addition. In this work, a three-dimensional fluid–solid fully coupled HF propagation model is established to simulate the influence of interlayer heterogeneity on vertical HF height and HF width, and the relationship between HF length and HF width under different treatment parameters is further studied. The results show that, in thin interbedded strata, the high interlayer stress contrast, high tensile strength, and low Young’s modulus will inhibit the vertical propagation of HFs. The interlayer heterogeneity results in the vertical wavy distribution of HF width. Under the high interlayer stress contrast, Young’s modulus, and tensile strength, the HF width profile becomes narrow and the variation amplitude decreases. The HF length decreases and the HF width increases as the injection rate and fracturing fluid viscosity increase. This study is of great significance for clarifying the vertical propagation pattern in thinly interbedded reservoirs, optimizing the treatment parameters, and improving the effect of cross fracturing and proppant distribution.

1. Introduction

Jimsar shale oil reservoir in Xinjiang has high oil reserves and poor reservoir physical properties (porosity of 10%, permeability of 0.05 mD). Large-scale hydraulic fracturing is a necessary technology for the profitable development of this reservoir. However, the target reservoir presents the typical characteristics of thin vertical layers, with strong interbedded heterogeneity (Qi et al., 2022) [1]. It is difficult to predict and control the height and width of hydraulic fractures (HFs) during the process of hydraulic fracturing, which affects the processes of the through-layer fracturing and the sand-adding fracturing (Dan et al., 2015; Wang et al., 2021; Xie et al., 2022) [2,3,4]. Therefore, clarifying the vertical propagation pattern of HFs in thinly interbedded reservoirs is of great significance to improve the pertinence of fracturing construction and the fracturing effect.
Scholars at home and abroad have studied the pattern of HF propagation in layered strata based on physical model experiments and numerical simulations [5,6,7,8,9,10,11,12,13,14,15]. Mukhtar et al. (2022) [5] present a coupled multiphysics 3D generalized finite element method to simulate hydraulic fracture propagation. This method is validated against a hydraulic fracture experiment on PMMA. There are two types of factors affecting vertical HF propagation: formation factors and treatment parameters. The former include interlayer stress contrast, petrophysical property, and tensile strength, while the latter include pump injection rate and fracturing fluid viscosity (Tan et al., 2021; Sun et al., 2020; Tan et al., 2019) [6,7,8]. Miskinmins et al. (2003) [9] studied the influence of interlayer properties of sand and mud on vertical HF propagation and analyzed the influence of interlayer interface shear slip, rock mechanical properties difference, and pore elasticity on HF height propagation. Li et al. (2014) [10] studied the HF propagation pattern in layered strata based on the finite element method, and the results showed that the high stress, high strength, and low modulus significantly inhibited the vertical HF propagation, thus the HF height can be controlled. Sun et al. (2020) [7] established a multi-layer HF propagation model based on the cohesive element theory, and the variation in the angle of the relative vertical extension of the bedding plane and the tensile strength of the bedding plane on the vertical extension of the HF is analyzed. The simulation results show that reservoirs with low vertical stress differences and nearly horizontal bedding planes with low dip angles are found to be favorable for opening the bedding planes, and reservoirs with high vertical stress differences and bedding plane dip angles are favorable for the longitudinal expansion of HFs. Wang et al. (2021) [11] conducted triaxial fracturing simulation experiments on full-diameter shale cores with different horizons to study the vertical propagation patterns of HFs in different reservoirs and established a pseudo-three-dimensional HF propagation model of multi-layer shale oil reservoirs. The results show that the HF height of shale is smaller than that of sandstone owing to bedding limitations. When sandstone and shale are fractured at the same time, the HF extension height reaches the maximum after the two layers are connected. When the sandstone–shale interface is strong, increasing the pumping rate can increase the HF height. Fu et al. (2021) [12] studied the effect of permeability difference, in situ stress condition, and lithological interface on hydraulic propagation by building a 3D HF propagation numerical model. The results show that the ability of HF to cross the lithologic boundary decreases with the increase in the high permeability difference coefficient. In addition, when the stress difference between layers is small, the fracture penetration boundary has a higher probability to expand to the additional layer. Liu et al. (2022) [13] considered the Hancheng area, Ordos Basin, China, as an example to understand macrolithotype differences, established finite element numerical models of the cohesive zone, and evaluated the HF initiation and vertical propagation behavior of laminated coal reservoirs. Mukhtar et al. (2022) [14] present a comprehensive study on multiple hydraulic fracture propagation and their interactions under different treatment conditions. A systematical parametric study was carried out and the considered factors included fracture spacing, injection fluid viscosity, number of fracture clusters, and the stress conditions.
In conclusion, the present study has clarified the main controlling factors of HF height propagation in stratified strata and their influencing patterns. However, owing to the limitation of the sample scale, the boundary effect in stress loading cannot be eliminated in the model experiment, which leads to a certain gap between the HF height and the reality. In addition, the HF width in the model experiment is generally tens of microns, which cannot capture the vertical distribution of HF width. The existing numerical simulation work mainly studies the vertical propagation pattern of HFs in three-layer strata. However, the Jimsar shale oil reservoir in Xinjiang presents the characteristics of thin interbedding, while the reservoir and the interbedding appear alternately. The variation pattern of vertical HF height and width needs to be further studied. Based on the finite element method and cohesive zone method, a fluid–solid fully coupled three-dimensional HF propagation model is established for thin interlayer formation and the influence pattern of strong interlayer heterogeneity on vertical HF propagation is studied. The research in this paper has certain theoretical guiding significance for the formulation of the fracturing scheme of Jimsar shale oil.

2. Physical Process and Mathematical Models

Three-dimensional HF propagation involves multiple complex physical processes: tangential/normal flow of fluid in the HF, matrix seepage, rock stress/strain, fluid loss at the HF surface, and initiation and propagation at the HF tip. In addition, these processes affect each other and need to be solved in a coupled manner (Gonzalez-Chavez et al., 2015) [15].

2.1. Rock Deformation and Fluid Flow Equations

The matrix pore pressure is changed by fluid filtration in the HF, which affects the effective stress of the rock and then affects the deformation of the rock. Considering the coupling effect of fluid filtration, pore pressure change, and rock deformation, the governing equation of rock deformation and fluid is provided. Assuming the characteristics of homogeneity, isotropy, and linear elasticity of rock, the governing equation of rock deformation is as follows (Wang et al., 2018) [16]:
σ + f = 0 ε = ( u + ( u ) T ) / 2 σ = D ε
where σ is the stress tensor, Pa; D is the stiffness matrix, Pa; f is the force vector per unit volume, N/m3; ε is the strain tensor, dimensionless; and u is the displacement vector, m.
Assuming that the fluid is incompressible, the governing equation of tangential flow in the HF is based on Poiseuille’s cubic law:
q f = w 3 12 μ p f
where qf is the tangential flow rate of fluid in HF, m3/s; w is HF width, m; μ is fluid viscosity, Pa·s; and pf is fluid pressure in the HF, Pa.
The continuity equation of the fluid flow in the HF is as follows:
q f w t + q b + q t = 0
where qb and qt are the normal fluid filtration velocity (m/s) of the upper and lower surfaces of the HF, respectively.
The normal filtration equation of the HF surface is as follows:
q t = c t ( p i p t ) q b = c b ( p i p b )
where c t and c b are the leak-off coefficient into the top and bottom HF surfaces, respectively; p i , p t , and p b are the pore pressures within the HF, top HF surface, and bottom HF surface, respectively; and q t and q b are the normal flow rates into the top and bottom HF surfaces, respectively.

2.2. Hydraulic Fracture (HF) Tip Initiation and Propagation Equation

Based on the theory of linear elastic fracture mechanics, there exist stress singularities at the HF tip, and the calculation is huge. Mukhtar et al. (2020) [17] combined the generalized finite element method with mesh adaptivity for the robust and computationally efficient simulation of HF propagation. To eliminate singularity calculation of the HF tip, a cohesive zone model was used to characterize HF initiation and propagation, and there exists a process zone at the HF tip. In this region, there is a bilinear relationship between the interface force and the interface distance (T–S criterion). Before the interface distance reaches the initial damage distance, the interface force and interface distance meet the linear elastic relationship. When the interface distance reaches the initial damage distance, the interface stiffness degrades gradually. When the interface distance reaches the complete damage distance, the interface gravity is 0 and a new HF element is generated. In addition, the cohesive zone model can accurately simulate the tangential flow in Equation (2) and normal fluid loss in Equation (4), which gradually becomes an effective method to simulate HF propagation.
The secondary stress criterion is used to control the initiation of HF elements; when the sum of the squares of the ratio of the actual stress in three directions to the critical stress in the corresponding direction is equal to 1, the initial damage of HF elements occurs (Wang et al., 2021) [18]:
t n t n 0 2 + t s 1 t s 1 0 2 + t s 2 t s 2 0 2 = 1
where t n , t s 1 , and t s 2 are the real nominal stress in the normal, first, and second shear nominal directions, respectively; t n 0 , t s 1 0 , and t s 2 0 are the peak nominal stress purely in the normal, first, and second shear directions, respectively.   is the Macaulay bracket.
After initial damage, the interface stress of the HF element can be calculated by the following equation:
σ n = ( 1 D ) σ ¯ n , σ ¯ n 0 σ ¯ n
σ s = ( 1 D ) σ ¯ s σ t = ( 1 D ) σ ¯ t
where σn, σs, and σ ¯ t are the stresses calculated in the normal direction and two tangential directions according to the elastic criterion of the undamaged front. D is a dimensionless damage factor, whose value lies between 0 and 1. The material is not damaged when D = 0 and completely damaged when D = 1.
The expression of damage factor D is as follows:
D = δ m f ( δ m max δ m 0 ) δ m max ( δ m f δ m 0 )
where δ m 0 , δ m f , and δ m max are the effective displacement at the stage of HF initiation, complete HF formation, and the maximum value during the loading history, respectively.
The energy criterion is used to characterize the condition of complete damage of the HF element. Gc represents HF energy, which is equal to the area enclosed by the triangle, kN/m. The expression of the energy criterion is as follows:
G c = G n c + ( G s c G n c ) G S G T η
where G n c and G s c are Mode I and Mode II critical HF energies, respectively, kN/m. GS = Gs + Gt, GT = Gn + GS. Gn and Gs are the HF tensile (Mode I) and shear (Mode II) energy components, respectively. η is the material parameter.

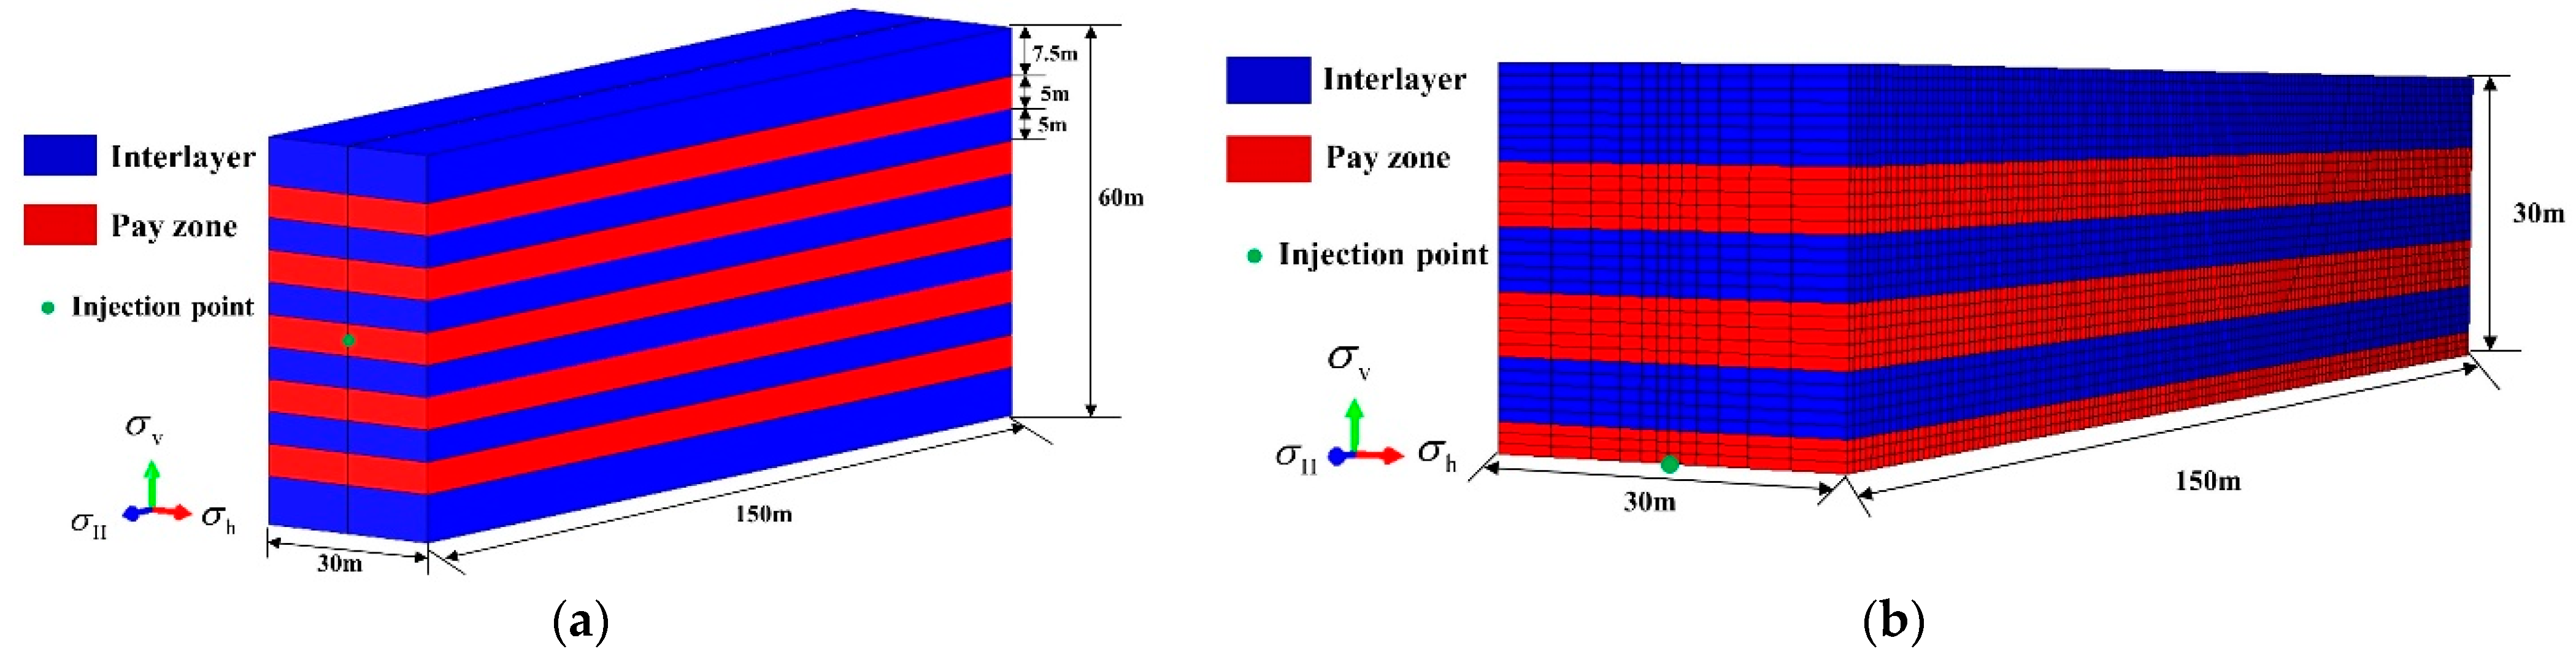
3. Model Establishment and Input Parameters

In the Jimsar shale oil reservoir, multistage fracturing is commonly used in horizontal wells. This paper focuses on a perforation cluster within one stage and focuses on vertical HF propagation in layered formations. Based on the finite element method and cohesive zone model, a three-dimensional (3D) fluid–solid coupling model is established in Abaqus (a commercial software) to study the vertical propagation pattern of 3D HFs under the influence of interlayer heterogeneity. As shown in Figure 1a, the length × width × height of the model is 150 m × 30 m × 60 m, and there are five simulated pay zones (red zone) and six simulated interlayers (blue zone). The thickness of the single pay zone and interlayer in the middle reservoir is 5 m and the interlayer thickness at both ends is 7.5 m. The in situ stresses are perpendicular to each other and the injection point is located in the middle of the model. Considering the symmetry of the model, the upper half of the 1/2 model is used for the calculation to shorten the calculation time (Figure 1b). The 3D eight-node displacement and pore pressure element (C3D8P) was used for the matrix rock, and the 3D 12-node displacement and pore pressure cohesive element (COH3D8P) was used for the HF propagation path. In this way, the nodes of the matrix element and the side nodes of the cohesive elements have both displacement and pore pressure degrees of freedom, while the middle nodes of the cohesive element only have the pore pressure degrees of freedom. The mesh around the HF element is refined to improve the calculation accuracy. Considering multi-cluster fracturing within one stage, the injection rate of a single HF was 4 m3/min and the injection time was 30 min. The displacement degrees of freedom of the model boundary were fixed and the constant pore pressure boundary was set. Table 1 shows the basic input parameters of the model. Figure 2 presents the fracture profile at different times during HF propagation.

4. Results and Analysis

The research results show that the properties of the interlayer interface affect the vertical HF propagation pattern; when the strength of the interlayer interface is weak, interface slip or HF propagates along the interface during fracturing, and T-shaped or fishbone HFs are generated longitudinally (Du et al., 2022) [19]. Laboratory rock mechanical parameters tests show that the mechanical strength of the interface is high, thus the fracturing fluid cannot penetrate into the interface between layers in the Jimsar shale oil reservoir. To focus on the effect of interlayer heterogeneity on HF vertical propagation, this paper assumes that the cementation between the pay zone and the interlayer is intact. The variation rule of 3D HF height and width under the condition of a thin interlayer is quantitatively studied with different in situ stress, elastic modulus, and tensile strength values of the interlayers.

4.1. Interlayer Stress Contrast

Based on the parameters in Table 1, the minimum horizontal principal stress of the pay zone was set as 20 MPa and kept unchanged, the minimum horizontal principal stress of the interlayer (23 MPa, 27 MPa, 31 MPa) was set successively, and other parameters were kept consistent. The variation law of HF height and width was studied under the interlayer stress contrasts of 3 MPa, 7 MPa, and 11 MPa, respectively. As shown in Figure 3 (injection time of 30 min), the vertical distribution profile of HF width is drawn with the HF center as the coordinate origin. The ordinate represents the half-HF height and the abscissa represents the HF width. It can be seen that, as the stress contrast between layers increases, the HF height decreases. When the stress contrast between layers is 3 MPa, 7 MPa, and 11 MPa, the corresponding HF heights are 25.80 m, 14.18 m, and 10.80 m, respectively, which decrease by 58.14%. The reason is that, the higher the stress in the interlayer, the more difficult the vertical HF propagation, and the higher the net pressure in the HF. For the same volume of injected fluid, the HF tends to propagate along the HF length in the pay zone owing to the strong containment of the interlayers. In addition, compared with the interlayer stress contrast of 3 MPa and 7 MPa, the difference in HF height is 45.04%. Compared with the stress contrast of 7 MPa and 11 MPa, the difference in HF height is 23.84%. Therefore, with the increase in stress contrast between layers, the decrease in HF height becomes slower. The reason is that, the higher the stress contrast between layers, the higher the energy consumed when the HF propagates vertically through the interlayer and the easier it is to stop the HF in the interlayer, and the smaller the HF height, the smaller the gap.
As far as HF width is concerned, owing to the alternating occurrence of the pay zone and the interlayer (the dashed line represents the interface between the pay zone and the interlayer), the horizontal minimum principal stress contrast between the zones constantly changes the HF width and the longitudinal distribution of HF width is wavy (Figure 3). The smaller the horizontal minimum principal stress, the smaller the resistance and the larger the central HF width. In addition, the HF width in the pay zone where the HF center is located is less affected by the interlayer stress. The width of the HF center corresponding to the interlayer stress contrast of 3 MPa, 7 MPa, and 11 MPa is 12.7 mm, 13.8 mm, and 12.1 mm, respectively.

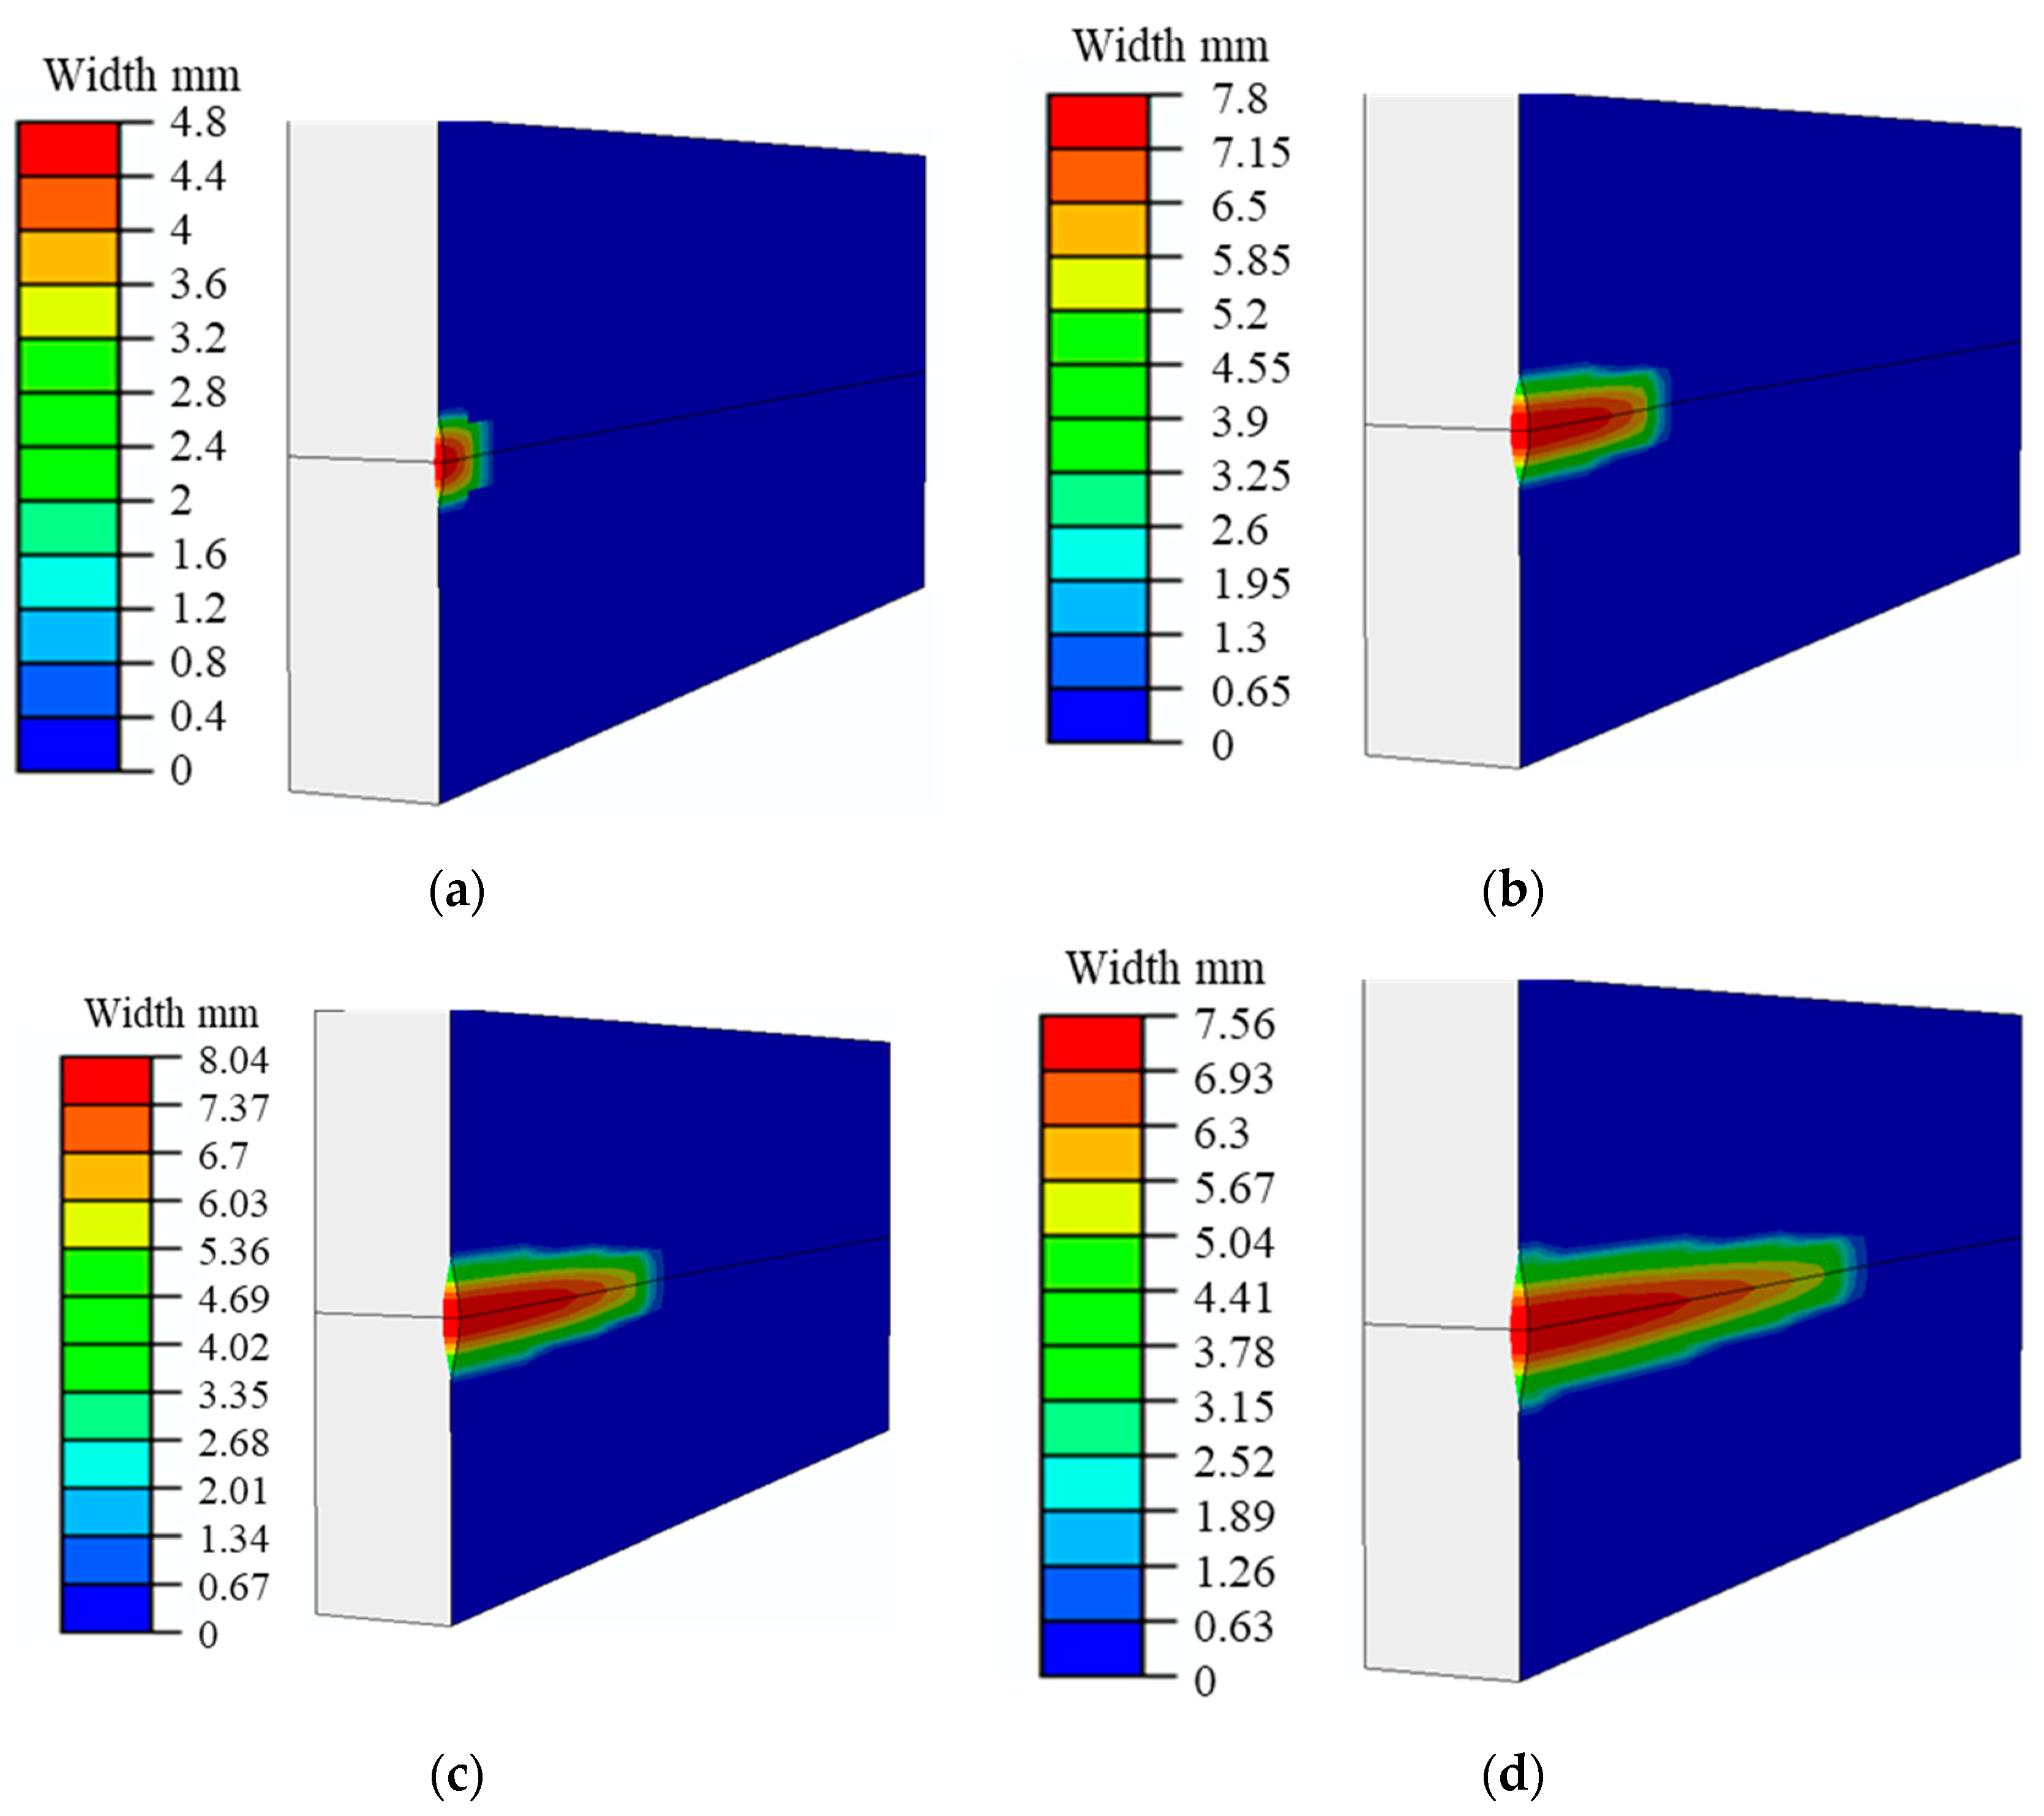
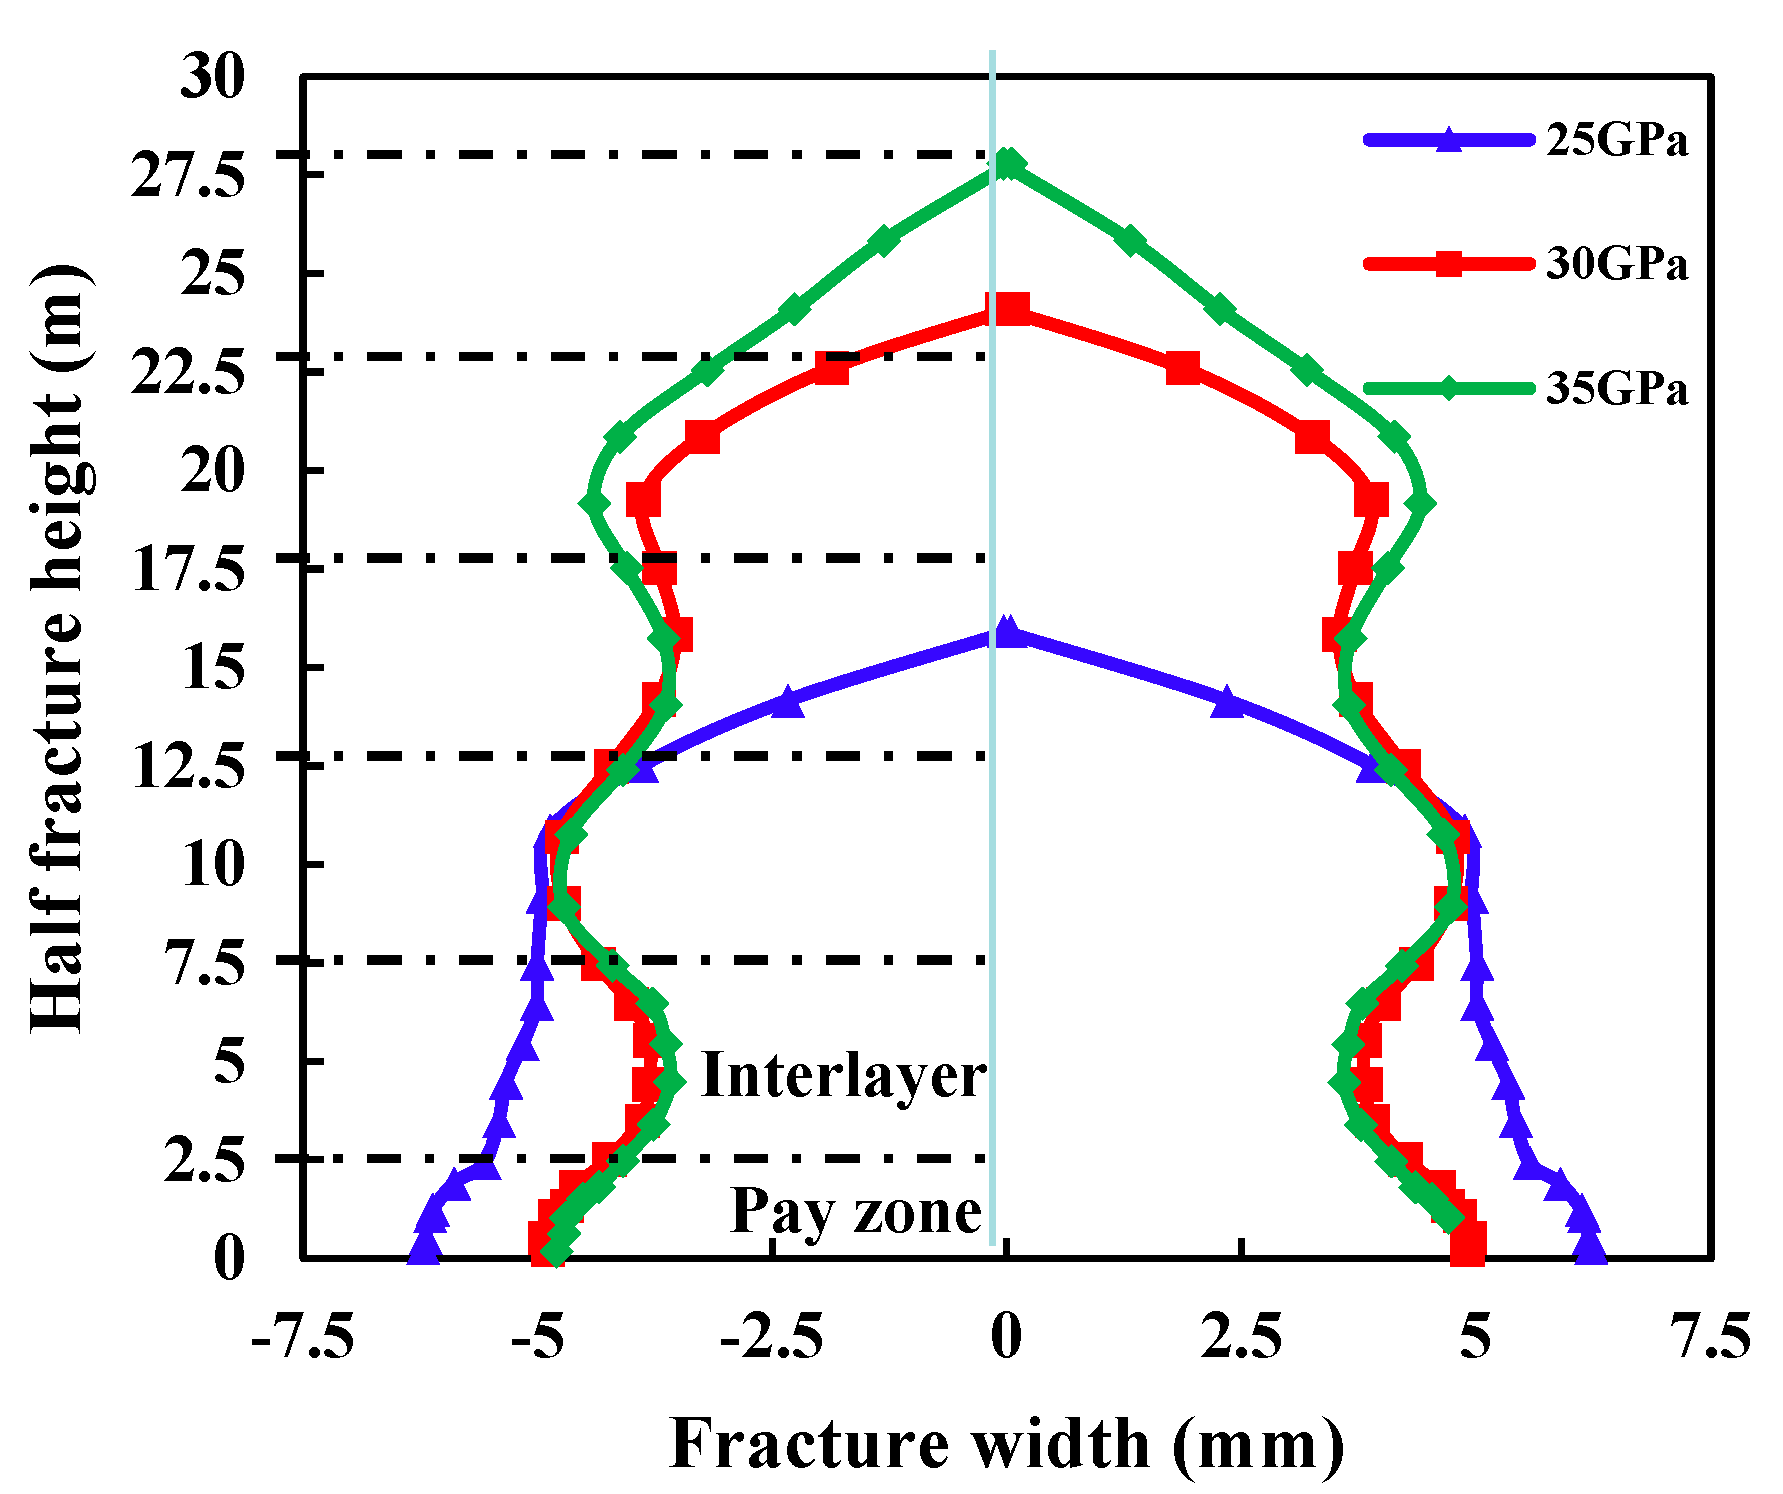
4.2. Young’s Modulus

Young’s modulus of the reservoir rock reflects the deformation resistance of the rock and then affects the HF height and width. Young’s modulus of the pay zone was kept unchanged at 20 GPa, and Young’s modulus of the interlayer was set to be 25 GPa, 30 GPa, and 35 GPa, respectively. Other parameters were kept consistent. The variation law of the HF height and width of the HF was studied under Young’s modulus differences of 5 MPa, 10 GPa, and 15 GPa. As shown in Figure 4 (injection time of 30 min), the HF heights corresponding to Young’s modulus of 25 GPa, 30 GPa, and 35 GPa are 15.92 m, 24.11 m, and 27.80 m, respectively, with an increase of 42.73%. The higher the Young’s modulus of the interlayer, the stronger the vertical propagation ability and the higher the HF height. The reason is that, in the interlayer with a high Young’s modulus, the rock deformation is small, the HF width is small, the net pressure in the HF is high, and the vertical propagation ability of the HF is strong. In addition, compared with 30 GPa and 25 GPa, the gap in height was 33.97%. The gap between Young’s modulus of 30 GPa and 35 GPa was 13.27%. Therefore, with the increase in Young’s modulus of the interlayer, the increase in the HF height becomes slower.
In terms of HF width, the Young’s modulus of the pay zone is small and the Young’s modulus of the interlayer is large. Therefore, the width gap of the pay zone is large, the width gap of the interlayer is small, and the longitudinal distribution of the width gap is wavy. In addition, with the decrease in the Young’s modulus of the interlayer, the ability of the rock to resist deformation is weakened, and the HF width at the HF center increases significantly. When the Young’s modulus of the interlayer is 25 GPa, 30 GPa, and 35 GPa, the corresponding central HF width is 12.5 mm, 9.8 mm, and 9.58 mm, respectively. Therefore, with the increase in the Young’s modulus of the interlayer, the variation range of the HF width profile decreases.

4.3. Rock Tensile Strength

Rock tensile strength reflects the ability of the rock to resist tensile failure. The higher the tensile strength, the more difficult the HF initiation and propagation, which significantly affects the vertical HF propagation pattern. The tensile strength of the pay zone was kept unchanged at 3 MPa and the tensile strength of the interlayer was set as 6 MPa, 12 MPa, and 18 Mpa, respectively. Other parameters were kept consistent. The variation law of vertical HF height and width of HFs was studied under the difference of the tensile strength between the layers of 3 MPa, 9 MPa, and 15 MPa. As shown in Figure 5 (injection time of 30 min), the HF heights corresponding to the tensile strength of interlayer of 6 MPa, 12 MPa, and 18 MPa are 24.12 m, 15.73 m, and 12.41 m, respectively. The HF height of the first case decreases by 48.55% compared with the last case. The reason is that, the higher the tensile strength of the interlayer, the more difficult it is for the HF to cross the interlayer, so it tends to propagate along the HF length. In addition, compared with the interlayer tensile strength of 6 MPa and 12 MPa, the difference in HF height is 34.78%. Compared with the interlayer tensile strength of 12 MPa and 18 MPa, the difference in HF height is 21.11%, indicating that the change range of HF height decreases with the increase in interlayer rock tensile strength.
As far as HF width is concerned, the difference in tensile strength between the pay zone and interlayer results in wavy distribution of HF width in the vertical direction. The higher the tensile strength of the interlayer, the more difficult it is to penetrate the interlayer, the smaller the HF width in the interlayer, and the smaller the width gap at the HF center. The reason is that the main reservoir factors affecting HF width are in situ stress and Young’s modulus, and the tensile strength of the interlayer will not affect the width of the HF in the pay zone. The tensile strength determines the HF initiation pressure; after the generation of a new HF element, the HF net pressure remains a constant value, thus the HF width has a neglectable difference.

4.4. Treatment Parameters

This paper focuses on the influence of interlayer heterogeneity on HF vertical propagation. In addition to the two-dimensional extension of HF height and width, there is also the extension of HF length. Because of the influence of reservoir factors and engineering factors, HF height, width, and length affect each other. In the fracturing process, the larger the HF width, the lower the difficulty of sand addition. The longer the HF length, the larger the contact area between the wellbore and the reservoir and the higher the single well productivity. The viscosity and injection rate of fracturing fluid are the key parameters that can be controlled artificially in the field fracturing process. This section focuses on the influence of fluid injection rate and fluid viscosity on the length and width of HF.
Based on the numerical model in Figure 1 and the basic parameters in Table 1, the injection rate is set as 3, 4, 5, 6, and 7 m3/min, respectively, and the injection time is adjusted to ensure that the total volume of fluid is consistent. Figure 6 shows the relationship between HF length and width in the intermediate pay zone under different injection rates. It can be seen that, with the increase in the injection rate, the HF length decreases and the HF width increases. The reason is that a higher injection rate produces a higher net pressure in the HF and the HF width is proportional to the net pressure in the HF, thus increasing the width of the HF, and taking into account the volume conservation (the total liquid pumping volume is the same), thus reducing the length of the HF.
Based on the numerical model in Figure 7 and the basic parameters in Table 1, the value range of fracturing fluid viscosity is 1–300 mPa·s, and the relationship curve between the HF length and HF width under different fracturing fluid viscosity is studied. As shown in Figure 7, with the increase in fracturing fluid viscosity, the HF length decreases and the HF width increases slowly. The reason is that, with the increase in fracturing fluid viscosity, the fluid flow resistance in the HF increases, the fluid loss rate decreases, and the net pressure in the HF increases, thus the HF width increases with the HF net pressure. According to the volume conservation, the HF length decreases significantly.
Therefore, for the Jimsar thin interbedded reservoir, 3D HF morphology characteristics can be effectively controlled by controlling the fluid injection rate and fracturing fluid viscosity. Under certain reservoir conditions, pumping excessive viscosity liquid limits the HF length; pumping too low viscosity liquid tends to produce narrow HFs, which is not conducive to sand addition. Therefore, it is necessary to consider all factors to achieve efficient fracturing in thinly interbedded formations.

5. Conclusions

Based on the cohesive zone model and finite element method, this work established a 3D fluid–solid coupling HF propagation model and investigated HF vertical propagation patterns under the influence of interlayer heterogeneity. Moreover, this work presented the methods to control HF vertical propagation by adjusting the injection rate and fracturing fluid viscosity. The main conclusions are as follows:
  • The larger the stress contrast between the pay zone and interlayer, the smaller the HF height. The stress contrast between layers increases from 3 MPa to 11 MPa, and the HF height decreases by 58.14%. The larger the stress contrast, the narrower the HF width profile and the smaller the variation range of the HF width profile.
  • The higher the Young’s modulus of the interlayer, the higher the HF height of the interlayer. The Young’s modulus of interlayer increases from 25 GPa to 35 GPa, and the HF height increases by 42.73%. The larger the Young’s modulus of the interlayer, the narrower the HF width profile and the smaller the variation range of the HF width profile.
  • The higher the interlayer tensile strength, the smaller the HF height. The interlayer tensile strength increases from 6 MPa to 18 MPa, and the HF height decreases by 48.55%. The larger the interlayer tensile strength, the narrower the HF width profile and the smaller the variation range of the HF width profile. The HF width in the middle pay zone is nearly the same.
  • In a thin interbedded reservoir, the HF width profile is wavy in the longitudinal direction. The influence of the HF width profile on proppant longitudinal placement should be considered in the process of sand-adding fracturing to improve the stimulation effect.
  • The larger the fluid injection rate and fracturing fluid viscosity, the smaller the HF length and the larger the HF width. When designing the fracturing construction, the sand-adding effect and reservoir contact area should be taken into account to determine the best fluid injection rate and fracturing fluid viscosity.

Author Contributions

Methodology, Y.L.; software, B.Z.; formal analysis, L.W.; investigation, S.L.; data curation, L.L.; writing—review and editing, B.W.; supervision, J.H.; project administration, J.H.; funding acquisition, J.H. All authors have read and agreed to the published version of the manuscript.

Funding

This research was funded by the Science and Technology Cooperation Project of the CNPC-SWPU Innovation Alliance (2020CX020000).

Data Availability Statement

Data available on request from the corresponding author if necessary.

Conflicts of Interest

The authors declare no conflict of interest.

References

  1. Qi, H.; Su, J.; Hu, X.; Ma, A.; Dong, Y.; Li, A. Study on Well Logging Technology for the Comprehensive Evaluation of the “Seven Properties” of Shale Oil Reservoirs—An Example of Shale Oil in the Lucaogou Formation in the Jimsar Sag, Junggar Basin. Front. Earth Sci. 2022, 9, 827380. [Google Scholar] [CrossRef]
  2. Dan, X.U.; Ruilin, H.U.; Wei, G.A.O.; Jiaguo, X. Effects of laminated structure on hydraulic fracture propagation in shale. Pet. Explor. Dev. 2015, 42, 573–579. [Google Scholar] [CrossRef]
  3. Wang, L.; Sheng, Z.; Zhao, Z.; Song, D.; Wang, L.; Wang, G. Large-Section and Multi-Cluster Fracturing Technology for Horizontal Wells in the Jimsar Shale Oil Reservoir. Pet. Drill. Tech. 2021, 49, 106–111. [Google Scholar] [CrossRef]
  4. Jianyong, X.; Xinjiang, C.; Wenbo, L.; Jingsheng, Z.; Xiaohu, W.; Yanjie, C.; Jinfeng, Z. Exploration and practice of benefit development of shale oil in Jimsar Sag, Junggar Basin. China Pet. Explor. 2022, 27, 99–110. [Google Scholar] [CrossRef]
  5. Mukhtar, F.M.; Duarte, C.A. Coupled multiphysics 3-D generalized finite element method simulations of hydraulic fracture propagation experiments. Eng. Fract. Mech. 2022, 108874. [Google Scholar] [CrossRef]
  6. Tan, P.; Jin, Y.; Pang, H. Hydraulic fracture vertical propagation behavior in transversely isotropic layered shale formation with transition zone using XFEM-based CZM method. Eng. Fract. Mech. 2021, 248, 107707. [Google Scholar] [CrossRef]
  7. Sun, C.; Zheng, H.; Liu, W.D.; Lu, W. Numerical simulation analysis of vertical propagation of hydraulic fracture in bedding plane. Eng. Fract. Mech. 2020, 232, 107056. [Google Scholar] [CrossRef]
  8. Tan, P.; Jin, Y.; Yuan, L.; Xiong, Z.Y.; Hou, B.; Chen, M.; Wan, L.M. Understanding hydraulic fracture propagation behavior in tight sandstone–coal interbedded formations: An experimental investigation. Pet. Sci. 2019, 16, 148–160. [Google Scholar] [CrossRef] [Green Version]
  9. Miskimins, J.L.; Barree, R.D. Modeling of hydraulic fracture height containment in laminated sand and shale sequences. In SPE Production and Operations Symposium; OnePetro: Oklahoma City, OK, USA, 2003. [Google Scholar]
  10. Yang, L.; Jingen, D.; Baohua, Y.; Liu, W.; Chen, J. Effects of Reservoir Rock/Barrier and Interfacial Properties on Hydraulic Fracture Height Containment. Pet. Drill. Tech. 2014, 42, 80–86. [Google Scholar]
  11. Wang, Y.; Hou, B.; Wang, D.; Jia, Z. Features of fracture height propagation in cross-layer fracturing of shale oil reservoirs. Pet. Explor. Dev. 2021, 48, 402–410. [Google Scholar] [CrossRef]
  12. Fu, S.; Hou, B.; Xia, Y.; Chen, M.; Wang, S.; Tan, P. Hydraulic fracture height growth law for deep coal measures shale reservoir. Fault Block Oil Gas Field 2021, 28, 555–560. [Google Scholar]
  13. Liu, Y.; Tang, D.; Xu, H.; Zhao, T.; Hou, W. Effect of interlayer mechanical properties on initiation and propagation of hydraulic fracturing in laminated coal reservoirs. J. Pet. Sci. Eng. 2022, 208, 109381. [Google Scholar] [CrossRef]
  14. Mukhtar, F.M.; Shauer, N.; Duarte, C.A. Propagation mechanisms and parametric influence in multiple interacting hydraulic fractures: A 3-DG/XFEM hydro-mechanical modeling. Int. J. Numer. Anal. Methods Geomech. 2022, 46, 2033–2059. [Google Scholar] [CrossRef]
  15. Gonzalez-Chavez, M.; Dahi Taleghani, A.; Olson, J.E. A Cohesive Model for Modeling Hydraulic Fractures in Naturally Fractured Formations. In Proceedings of the Spe Hydraulic Fracturing Technology Conference, The Woodlands, TX, USA, 3–5 February 2015. [Google Scholar]
  16. Wang, B.; Zhou, F.; Wang, D.; Liang, T.; Yuan, L.; Hu, J. Numerical simulation on near-wellbore temporary plugging and diverting during refracturing using XFEM-Based CZM. J. Nat. Gas Sci. Eng. 2018, 55, 368–381. [Google Scholar] [CrossRef]
  17. Mukhtar, F.M.; Alves, P.D.; Duarte, C.A. Validation of a 3-D adaptive stable generalized/eXtended finite element method for mixed-mode brittle fracture propagation. Int. J. Fract. 2020, 225, 129–152. [Google Scholar] [CrossRef]
  18. Wang, B.; Liu, X.; Hu, J. Numerical simulation method of in-fracture temporary plugging and diversion fracturing. Bull. Pet. Sci. 2021, 6, 10. [Google Scholar]
  19. Du, J.; Chen, X.; Liu, P.; Zhao, L.; Chen, Z.; Yang, J.; Miao, W. Numerical Modeling of Fracture Height Propagation in Multilayer Formations Considering the Plastic Zone and Induced Stress. ACS Omega 2022, 7, 17868–17880. [Google Scholar] [CrossRef] [PubMed]
Figure 1. Model establishment: (a) geometry model; (b) finite element model.
Processes 10 02449 g001
Figure 2. Fracture profile at different times during HF propagation (PFOPEN denotes the HF width, m). (a) 1 min; (b) 8 min; (c) 16 min; (d) 24 min.
Processes 10 02449 g002
Figure 3. HF morphology under different interlayer stress contrast.
Processes 10 02449 g003
Figure 4. HF morphology under different Young’s modulus of the interlayer.
Processes 10 02449 g004
Figure 5. HF morphology under different tensile strengths of the interlayer.
Processes 10 02449 g005
Figure 6. HF length and aperture curves under various flow rates after injecting for 30 min.
Processes 10 02449 g006
Figure 7. HF length and aperture curves under various fracturing fluid viscosity after injecting for 30 min.
Processes 10 02449 g007
Table 1. The base input parameters for the model.
ItemParameterPay ZoneInterlayer
Rock parameterYoung’s modulus (GPa)2025
Possion ratio0.250.2
Filtration coefficient (m/s)3 × 10−41.2 × 10−5
Cohesive element propertyTensile strength/(MPa)36
Energy release rate (N/m)12,00016,000
Leak off coefficient (m3/(Pa·s))10−1310−14
In situ stressThe effective minimum horizontal principal stress (MPa)2023
The effective maximum horizontal principal stress (MPa)2831
The effective vertical principal stress (MPa)3838
Fluid propertyFluid viscosity (mPa·s)100100
Injection rate (m3/min)44
Initial conditionPore pressure (MPa)3735
Porosity ratio 0.120.1
Publisher’s Note: MDPI stays neutral with regard to jurisdictional claims in published maps and institutional affiliations.

