
Facile Preparation and Characterization of Silica Nanoparticles from South Africa Fly Ash Using a Sol–Gel Hydrothermal Method

Abstract
:1. Introduction
2. Experiment
2.1. Material and Methods
2.2. Silica Extraction
2.3. Characterizations
2.4. Application of Extracted SNPs in the Removal of Cd2+ from Aqueous Solution
3. Results and Discussions
3.1. XRF Analysis
3.2. XRD Analysis
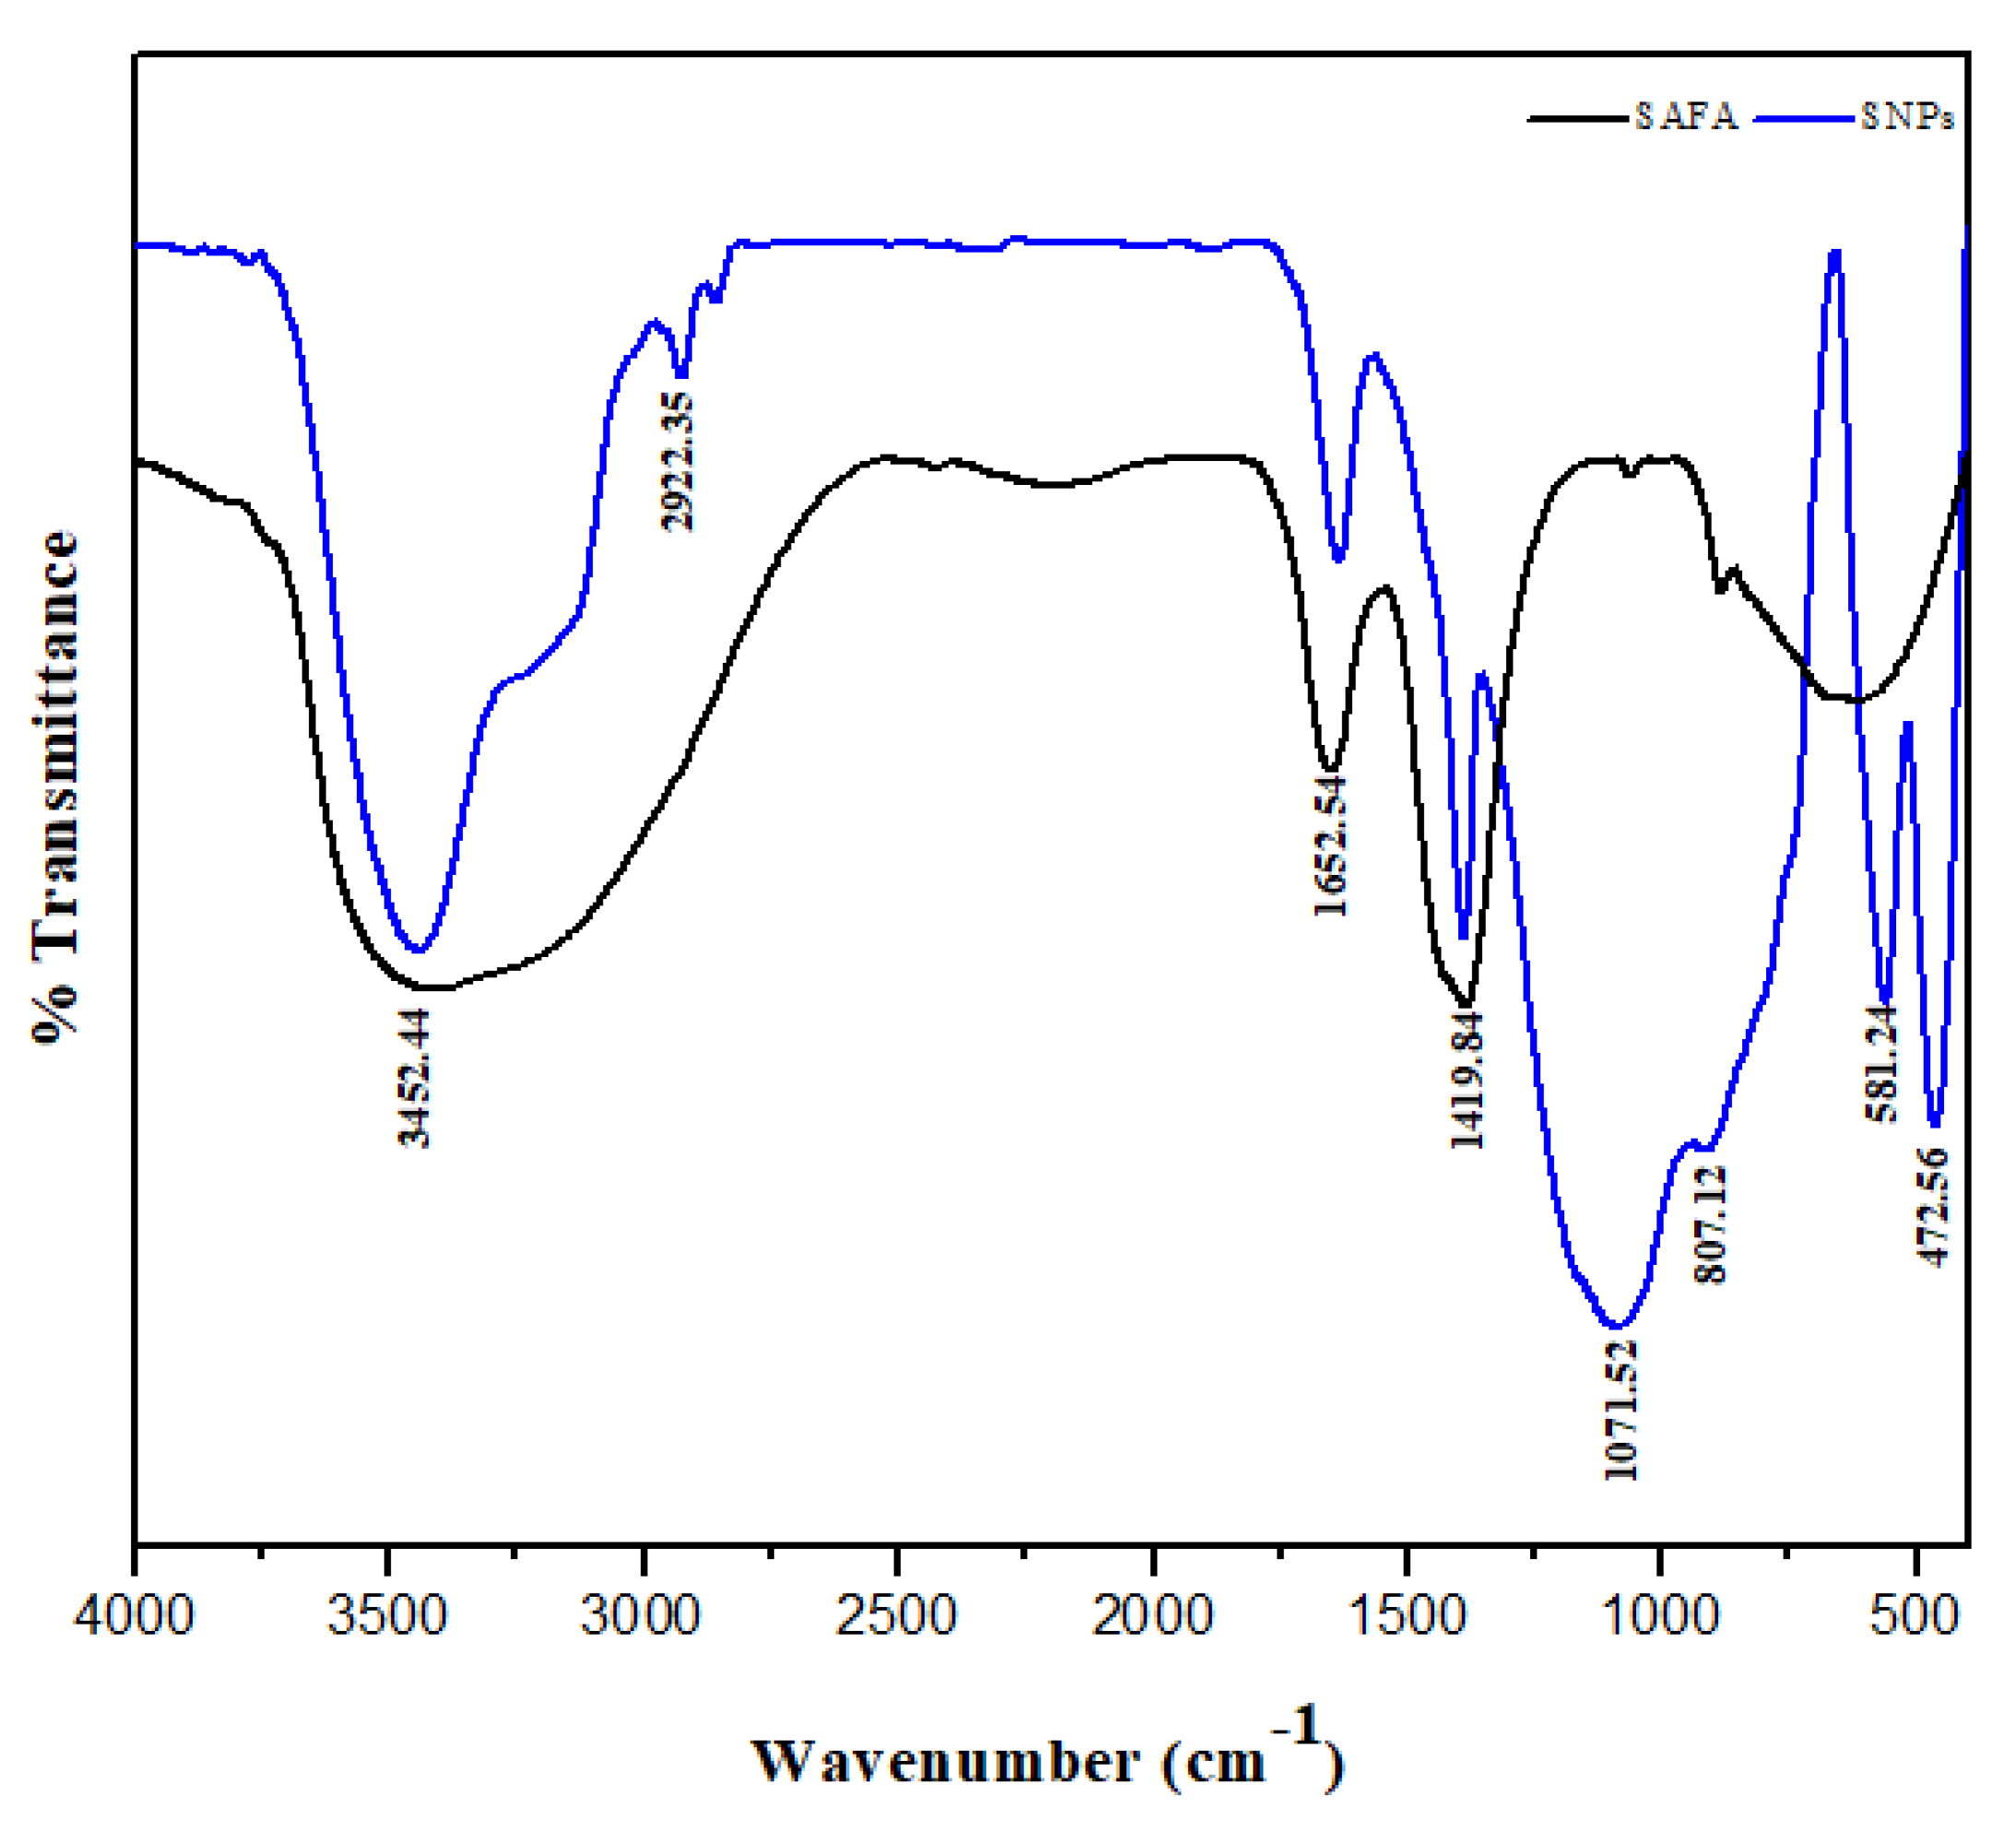
3.3. FTIR Analysis
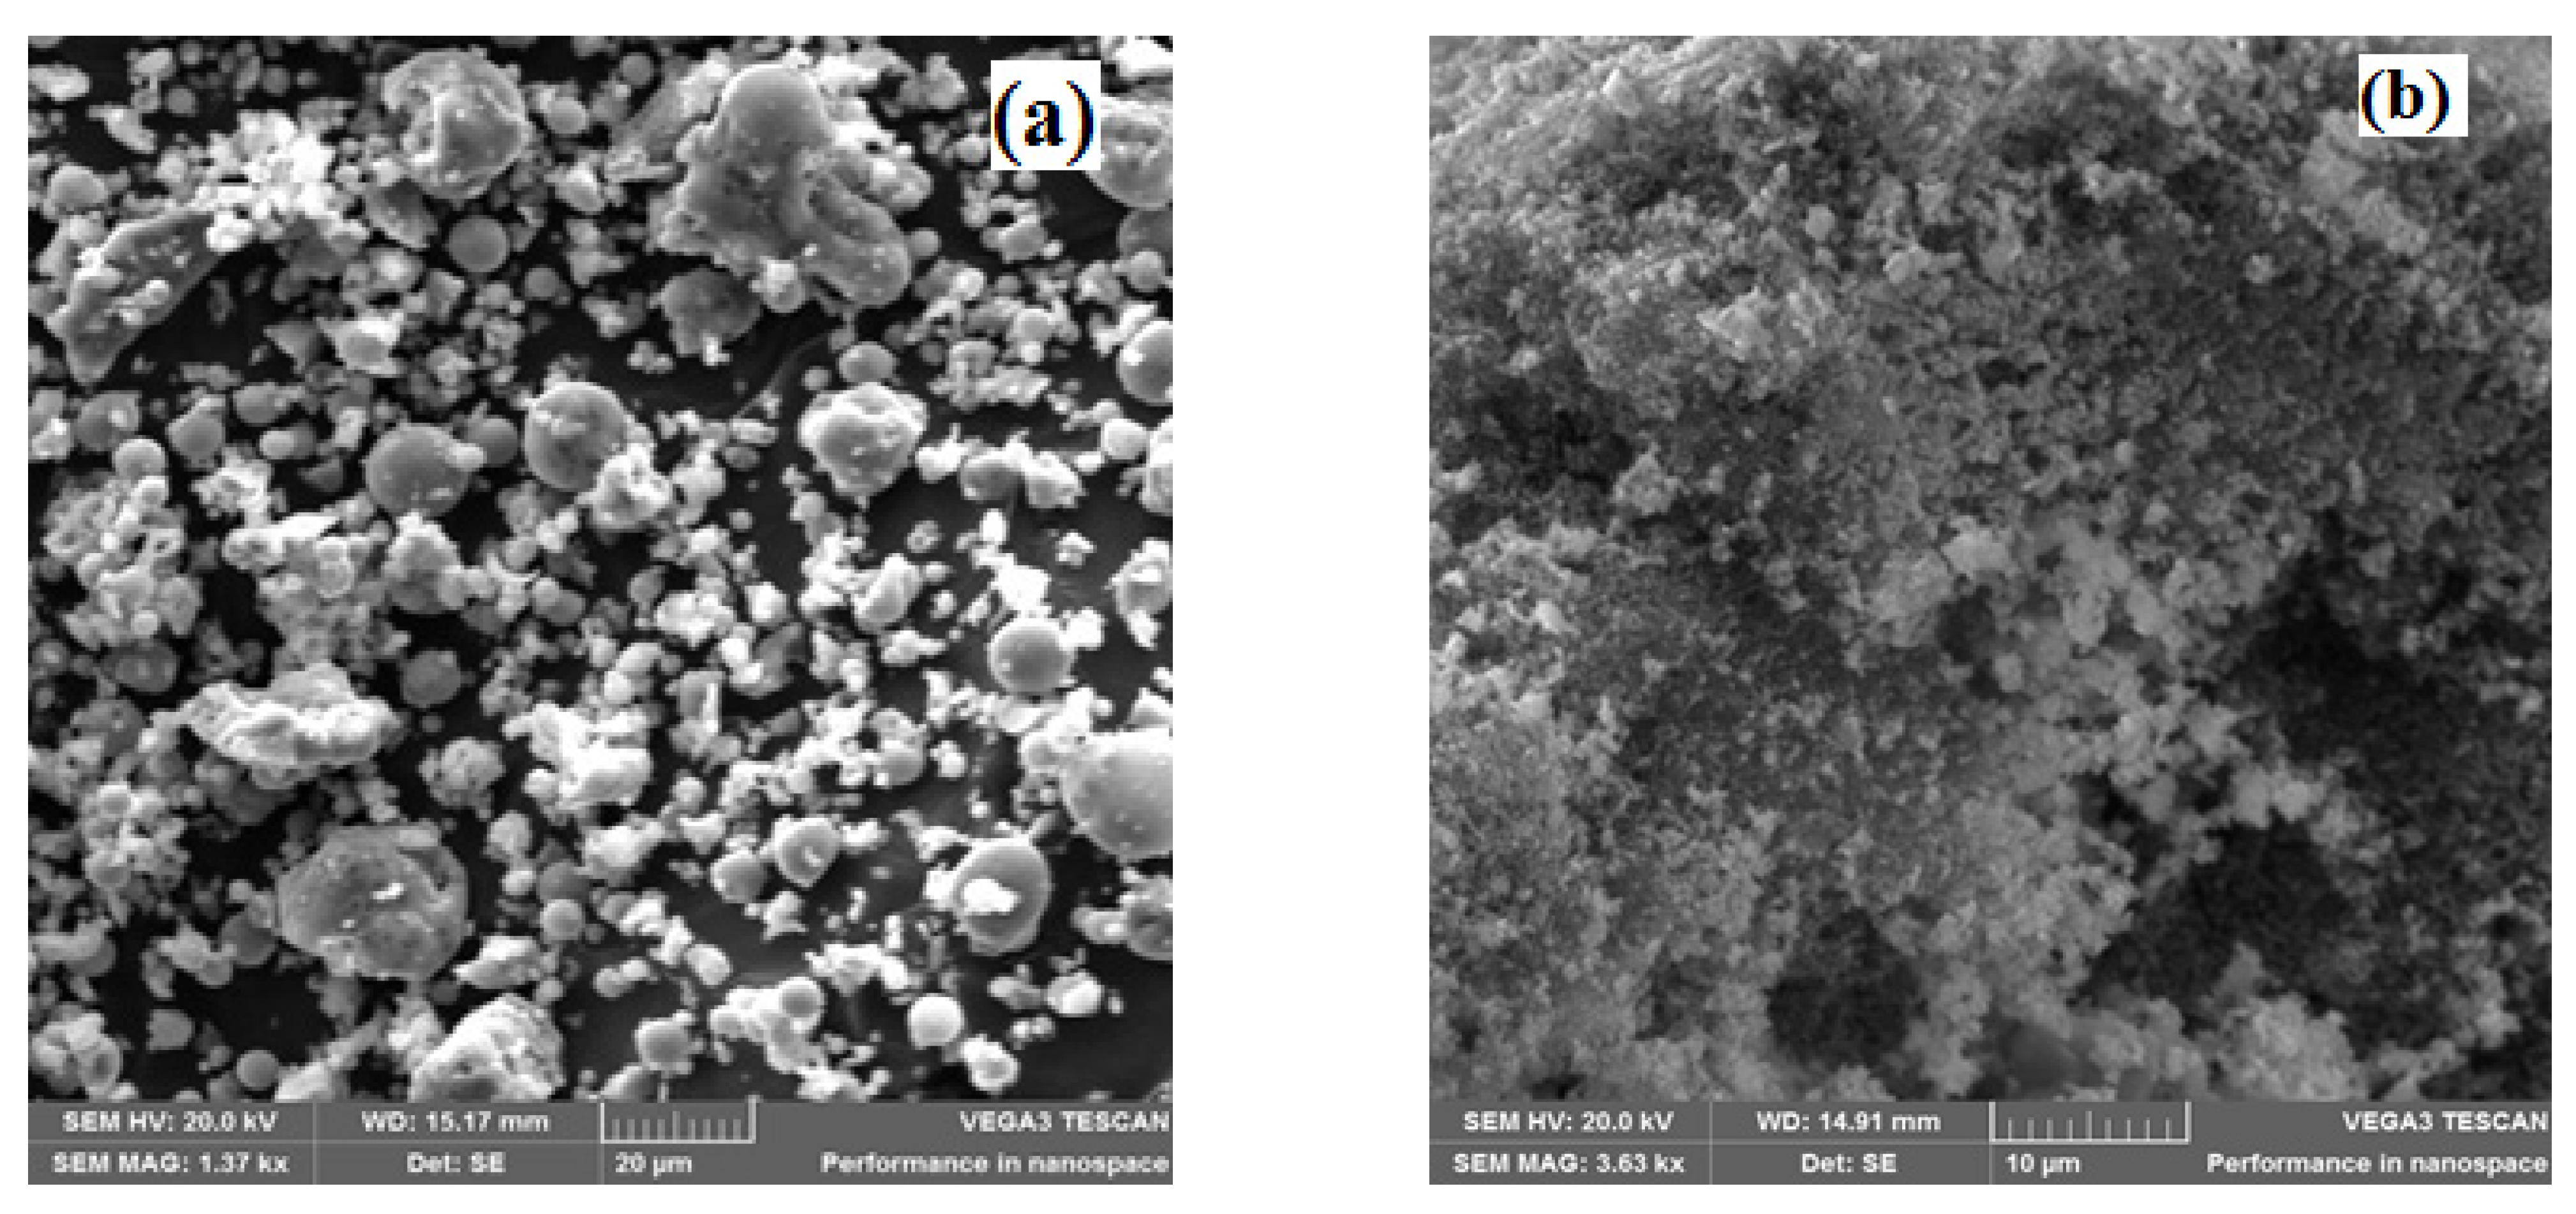
3.4. SEM/TEM Analysis
3.5. Bandgap
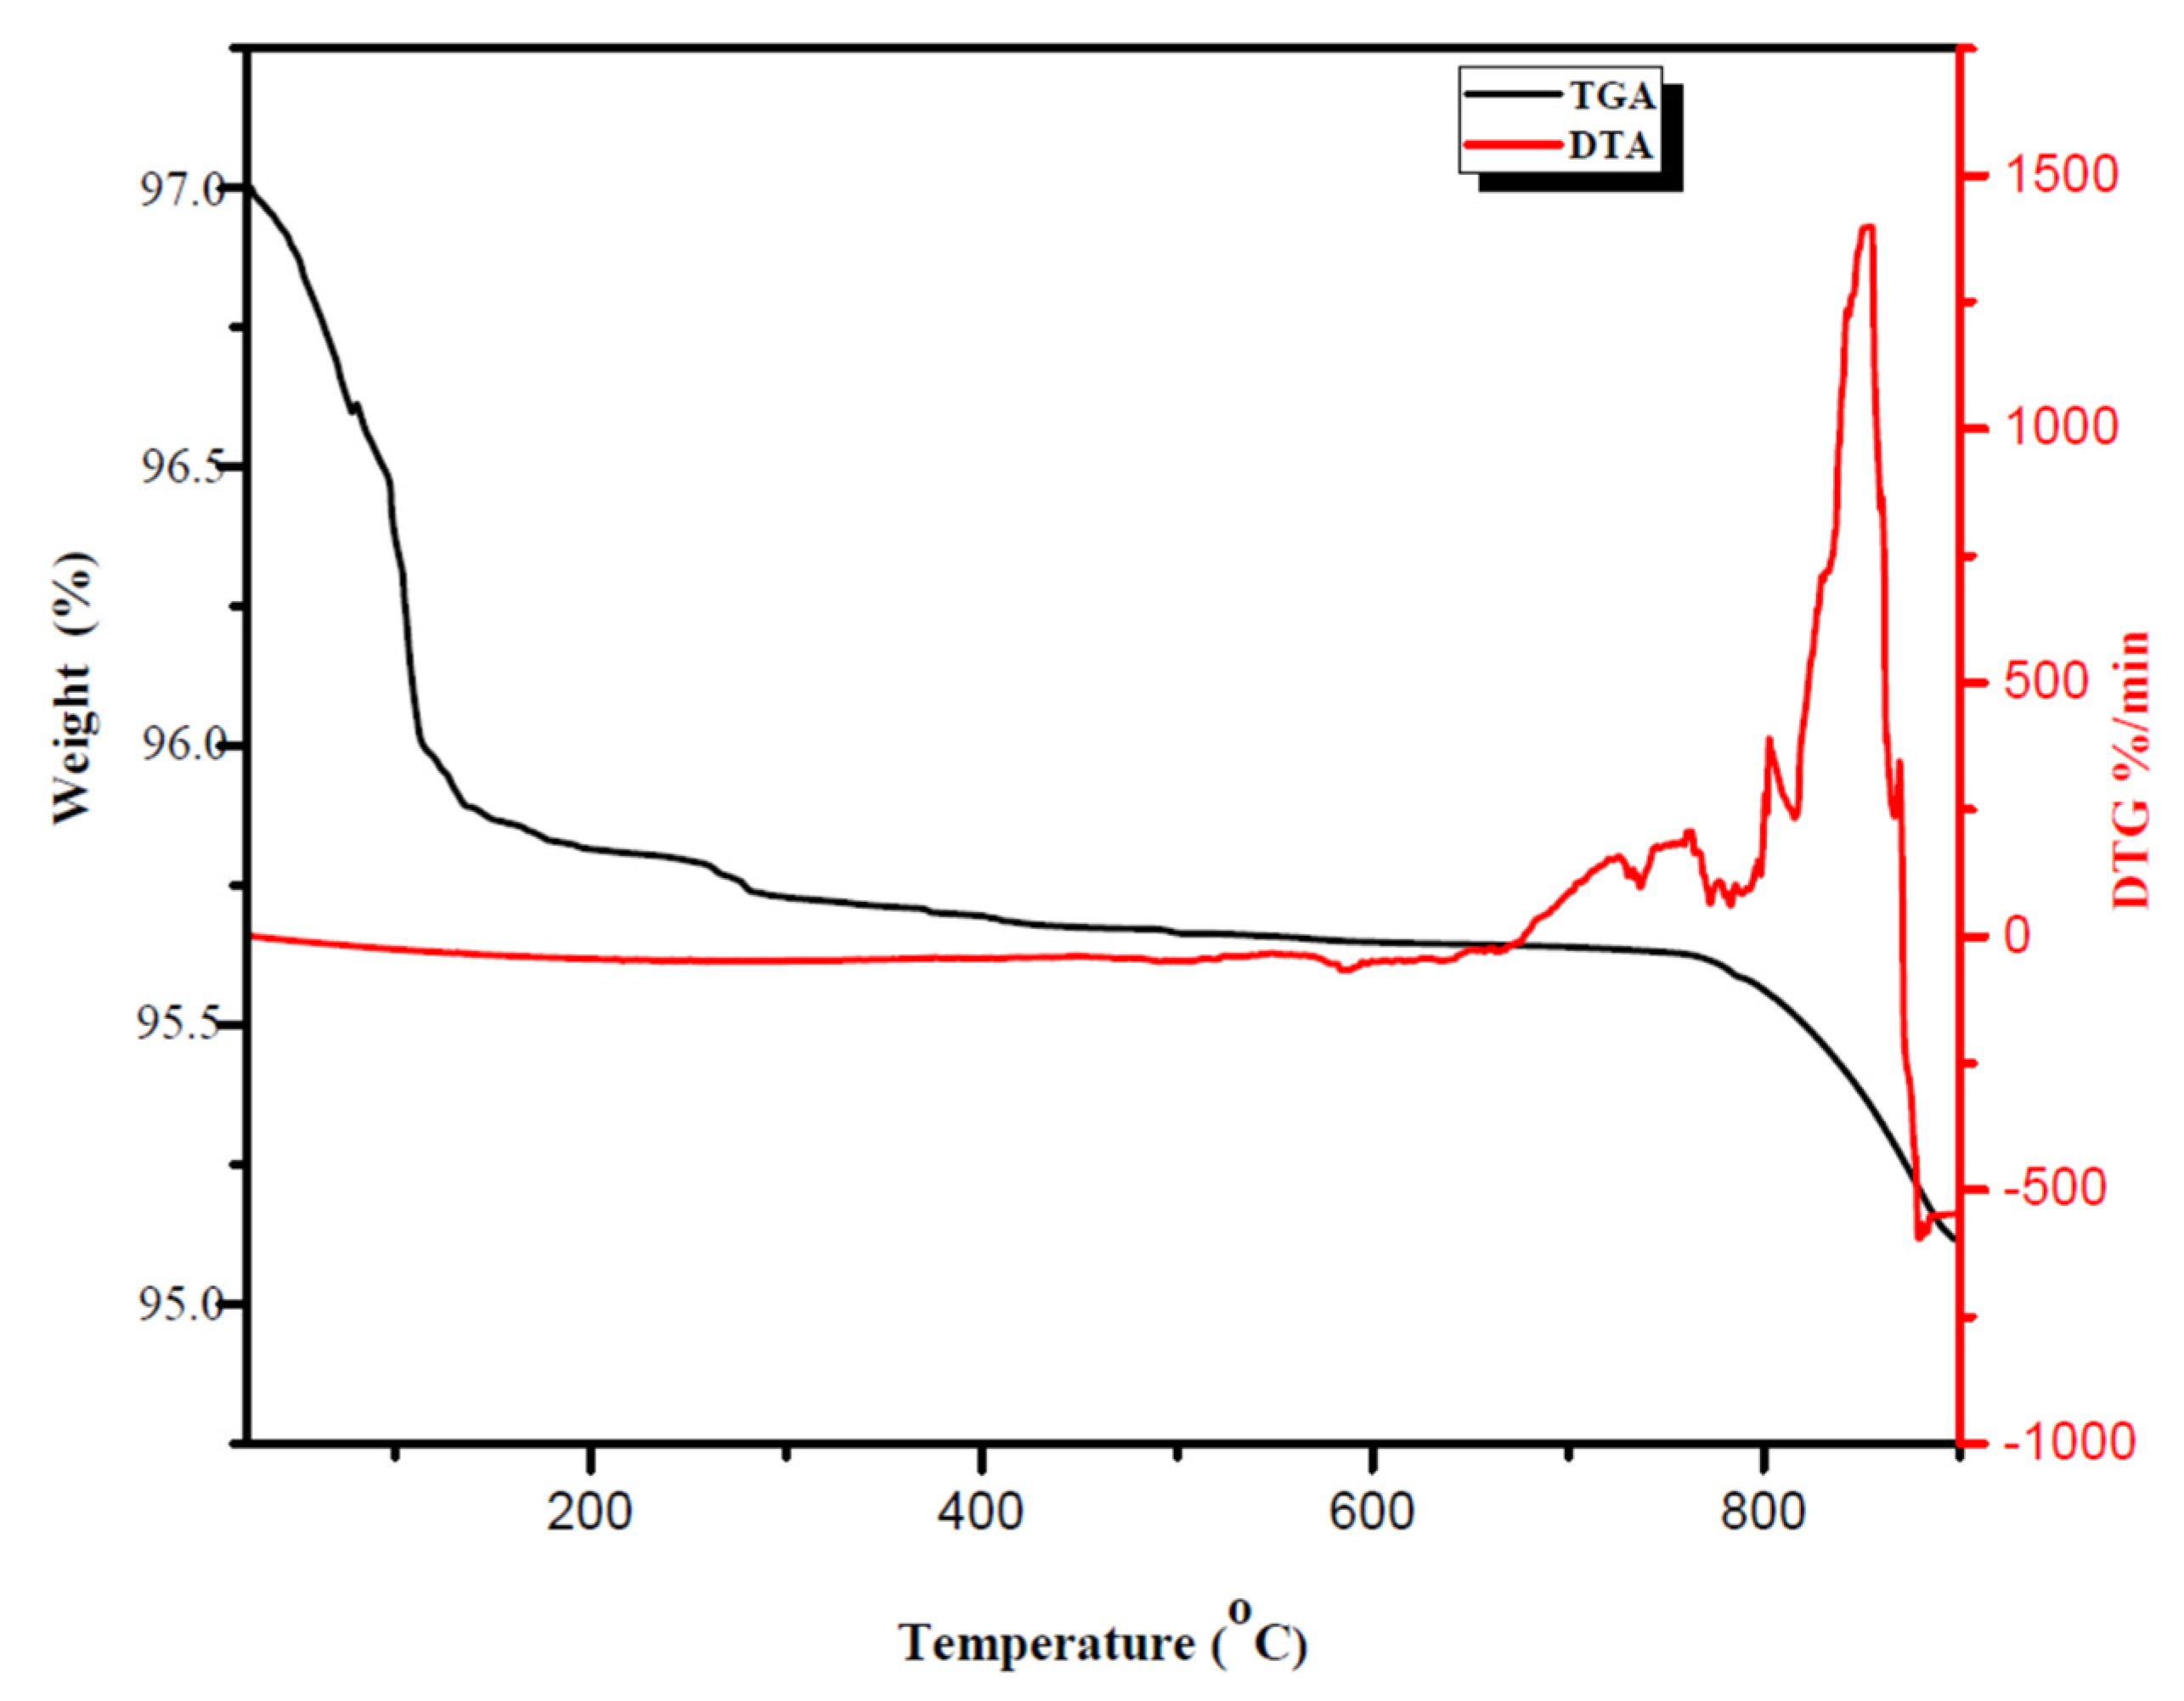
3.5.1. Thermal Analysis (TGA-DTA)
3.5.2. BET Surface Area (SBET) Analysis
3.5.3. Cd2+ Removal from Aqueous Solution Utilizing Prepared SNPs
4. Conclusions
Author Contributions
Funding
Data Availability Statement
Conflicts of Interest
References
- British Petroleum. BP Energy Outlook: 2018 Edition. 2018. Available online: https://www.bp.com/content/dam/bp/en/corporate/pdf/energy-economics/energy-outlook/bp-energy-outlook-2018.pdf (accessed on 12 August 2018).
- Kutchko, B.G.; Kim, A.G. Fly ash characterization by SEM-EDS. Fuel 2006, 85, 2537–2544. [Google Scholar] [CrossRef]
- Ismail, K.N.; Hussin, K.; Idris, M.S. Physical, chemical & mineralogical properties of fly ash. J. Nucl. Relat. Technol. 2007, 4, 47–51. [Google Scholar]
- Liu, C.L.; Zheng, S.L.; Ma, S.H.; Luo, Y.; Ding, J.; Wang, X.H.; Zhang, Y. A novel process to enrich alumina and prepare silica nanoparticles from high-alumina fly ash. Fuel Process. Technol. 2018, 173, 40–47. [Google Scholar] [CrossRef]
- American Society for Testing and Materials. ASTM C618, Annual Book of ASTM Standard; ASTM International: West Conshohocken, PA, USA, 2004. [Google Scholar]
- Naik, S.P.; Sokolov, I. Room temperature synthesis of nanoporous silica spheres and their formation mechanism. Solid State Commun. 2007, 144, 437–440. [Google Scholar] [CrossRef]
- Venkateswara Rao, A.; Hegde, N.D.; Hirashima, H. Absorption and desorption of organic liquids in elastic superhydrophobic silica aerogels. J. Colloid Interface Sci. 2007, 305, 124–132. [Google Scholar] [CrossRef]
- Yang, M.; Wang, G.; Yang, Z. Synthesis of hollow spheres with mesoporous silica nanoparticles shell. Mater. Chem. Phys. 2008, 111, 5–8. [Google Scholar] [CrossRef]
- Zaky, R.R.; Hessien, M.M.; El-Midany, A.A.; Khedr, M.H.; Abdel-Aal, E.A.; El-Barawy, K.A. Preparation of silica nanoparticles from semi-burned rice straw ash. Powder Technol. 2008, 185, 31–35. [Google Scholar] [CrossRef]
- Jesionowski, T. Synthesis and characterization of spherical silica precipitated via emulsion route. J. Mater. Process. Technol. 2008, 203, 121–128. [Google Scholar] [CrossRef]
- Bernardos, A.; Kourimská, L. Applications of mesoporous silica materials in food—A review. Czech J. Food Sci. 2013, 31, 99–107. [Google Scholar] [CrossRef] [Green Version]
- Aphane, M.E.; Doucet, F.J.; Kruger, R.A.; Petrik, L.; van der Merwe, E.M. Preparation of Sodium Silicate Solutions and Silica Nanoparticles from South African Coal Fly Ash. Waste Biomass Valor. 2020, 11, 4403–4417. [Google Scholar] [CrossRef]
- Bagwe, R.P.; Hilliard, L.R.; Tan, W. Surface modification of silica nanoparticles to reduce aggregation and nonspecific binding. Langmuir 2006, 22, 4357–4362. [Google Scholar] [CrossRef]
- Liu, S.; Han, M.-Y. Silica-coated metal nanoparticles. Chemistry 2010, 5, 36. [Google Scholar] [CrossRef]
- Jal, P.K.; Sudarshan, M.; Saha, A.; Sabita, P.; Mishra, B.K. Synthesis and characterization of nano-silica prepared by precipitation method. Colloid. Surf. 2004, 240, 173–178. [Google Scholar] [CrossRef]
- Imoisili, P.E.; Jen, T.C.; Safaei, B. Microwave-assisted sol–gel synthesis of TiO2-mixed metal oxide nanocatalyst for degradation of organic pollutant. Nanotechnol. Rev. 2021, 10, 1–11. [Google Scholar] [CrossRef]
- Imoisili, P.E.; Ukoba, K.O.; Jen, T.C. Synthesis and characterization of amorphous mesoporous silica from palm kernel shell ash. Bol. Soc. Esp. Cerám. Vidr. 2020, 59, 159–164. [Google Scholar] [CrossRef]
- Ntobeng, M.K.; Imoisili, P.E.; Jen, T.C. Synthesis and photocatalytic performance of Ag-TiVOX nanocomposite. J. King Saud Uni–Sci. 2020, 32, 3103–3110. [Google Scholar] [CrossRef]
- Channoy, C.; Maneewan, S.; Punlek, C.; Chirarattananon, S. Preparation and characterization of silica gel from bagasseash. Adv. Mater. Res. 2018, 1145, 44–48. [Google Scholar]
- Rovani, S.; Santos, J.J.; Corio, P.; Fungaro, D.A. Highly pure silica nanoparticles with high adsorption capacity obtained from sugarcane waste ash. ACS Omega 2018, 3, 2618–2627. [Google Scholar] [CrossRef]
- Sapawe, N.; Osman, N.S.; Zakaria, M.Z.; Fikry, S.A.S.S.M.; Aris, M.A.M. Synthesis of green silica from agricultural waste bysol–gel method. Mater. Today Proc. 2018, 5, 21861–21866. [Google Scholar] [CrossRef]
- Fardhyanti, D.S.; Putri, R.D.A.; Fianti, O.; Simalango, A.F.; Akhir, A.E. Synthesis of silica powder from sugar cane bagasseash and its application as adsorbent inadsorptive-distillation of ethanol–water solution. MATECWeb Conf. 2018, 237, 02002. [Google Scholar]
- Costa, J.A.S.; Paranhos, C.M. Systematic evaluation of amorphous silica production from rice husk ashes. J. Clean. Prod. 2018, 192, 688–697. [Google Scholar] [CrossRef]
- Chandrasekhar, S.A.T.H.Y.; Satyanarayana, K.G.; Pramada, P.N.; Raghavan, P.; Gupta, T.N. Review processing, properties and applications of reactive silica from rice husk—An overview. J. Mater. Sci. 2003, 38, 3159–3168. [Google Scholar] [CrossRef]
- Athinarayanan, J.; Periasamy, V.S.; Alhazmi, M.; Alatiah, K.A.; Alshatwi, A.A. Synthesis of biogenic silica nanoparticles from rice husks for biomedical applications. Ceram. Int. 2015, 41, 275–281. [Google Scholar] [CrossRef]
- Liu, Y.; Guo, Y.; Zhu, Y.; An, D.; Gao, W.; Wang, Z.; Ma, Y.; Wang, Z. A sustainable route for the preparation of activated carbon and silica from rice husk ash. J. Hazard. Mater. 2011, 186, 1314–1319. [Google Scholar] [CrossRef]
- Lu, P.; Hsieh, Y.L. Highly pure amorphous silica nano-disks from rice straw. Powder Technol. 2012, 225, 149–155. [Google Scholar] [CrossRef]
- Kaya, G.G.; Yilmaz, E.; Deveci, H. Sustainable nanocomposites of epoxy and silica xerogel synthesized from corn stalk ash: Enhanced thermal and acoustic insulation performance. Compos. Part B Eng. 2018, 150, 1–6. [Google Scholar] [CrossRef]
- Salakhum, S.; Yutthalekha, T.; Chareonpanich, M.; Limtrakul, J.; Wattanakit, C. Synthesis of hierarchical faujasite nanosheetsfrom corn cob ash-derived nanosilica as efficient catalystsfor hydrogenation of lignin-derived alkylphenols. Microporous Mesoporous Mater. 2018, 258, 141–150. [Google Scholar] [CrossRef]
- Velmurugan, P.; Shim, J.; Lee, K.J.; Cho, M.; Lim, S.S.; Seo, S.K.; Cho, K.M.; Bang, K.S.; Oh, B.T. Extraction, characterization, and catalytic potential of amorphous silica from corn cobs by sol–gel method. J. Ind. Eng. Chem. 2015, 29, 298–303. [Google Scholar] [CrossRef]
- Okoronkwo, E.A.; Imoisili, P.E.; Olusunle, S.O.O. Extraction and characterization of amorphous silica from corn cob ash by sol–gel method. Chem. Mater. Res. 2013, 3, 68–72. [Google Scholar]
- Okoronkwo, E.A.; Imoisili, P.E.; Olubayode, S.A.; Olusunle, S.O.O. Development of silica nanoparticle from corn cob ash. Adv. Nanopart. 2016, 5, 135–139. [Google Scholar] [CrossRef] [Green Version]
- Affandi, S.; Setyawan, H.; Winardi, S.; Purwanto, A.; Balgis, R. A facile method for production of high-purity silica xerogels from bagasse ash. Adv. Powder Technol. 2009, 20, 468–472. [Google Scholar] [CrossRef]
- Zulfiqar, U.; Subhani, T.; Husain, S.W. Synthesis and characterization of silica nanoparticles from clay. J. Asian Ceram. Soc. 2016, 4, 91–96. [Google Scholar] [CrossRef]
- Kaliannan, D.; Palaninaicker, S.; Palanivel, V.; Mahadeo, M.A.; Ravindra, B.N.; Jae-Jin, S. A novel approach to preparation ofnano-adsorbent from agricultural wastes (Saccharum officinarum leaves) and its environmental application. Environ. Sci. Pollut. Res. 2018, 26, 5305–5314. [Google Scholar] [CrossRef]
- Terzioğlu, P.; Yücel, S.; Kuş, Ç. Review on a novel biosilica source for production of advanced silica-based materials: Wheat husk. Asia-Pac. J. Chem. Eng. 2018, 14, e2262. [Google Scholar] [CrossRef]
- Marag, R.K.; Giri, P.A. Experimental investigation of temperature and reaction time for preparation of silica fromwheat husk. Int. J. Eng. Technol. Sci. Res. 2018, 5, 60–65. [Google Scholar]
- Qi, G.; Lei, X.; Li, L.; Sun, Y.; Yuan, C.; Wang, B.; Yin, L.; Xu, H.; Wang, Y. Coal fly ash-derived mesoporous calcium-silicate material (MCSM) for the efficient removal of Cd (II), Cr (III), Ni (II) and Pb (II) from acidic solutions. Procedia Environ. Sci. 2016, 31, 567–576. [Google Scholar] [CrossRef] [Green Version]
- Li, G.; Wang, B.; Sun, Q.; Xu, W.; Han, Y. Adsorption of lead ion on amino-functionalized fly-440 ash-based SBA-15 mesoporous molecular sieves prepared via two-step hydrothermal method. Microporous Mesoporous Mater. 2017, 252, 105–115. [Google Scholar] [CrossRef]
- Wang, B.; Zhou, Y.; Li, L.; Xu, H.; Sun, Y.; Wang, Y. Novel synthesis of cyano-functionalized 443 mesoporous silica nanospheres (MSN) from coal fly ash for removal of toxic metals from wastewater. J. Hazard. Mater. 2018, 345, 76–86. [Google Scholar] [CrossRef]
- Asl, S.M.H.; Javadian, H.; Khavarpour, M.; Belviso, C.; Taghavi, M.; Maghsudi, M. Porous 446 adsorbents derived from coal fly ash as cost-effective and environmentally-friendly sources of aluminosilicate for sequestration of aqueous and gaseous pollutants: A review. J. Clean. Prod. 2019, 208, 1131–1147. [Google Scholar] [CrossRef]
- Majchrzak-Kuceba, I.; Nowak, W. Characterization of MCM-41 mesoporous materials derived from polish fly ashes. Int. J. Miner. Process. 2011, 101, 100–111. [Google Scholar] [CrossRef]
- Hua, M.; Zhang, S.; Pan, B.; Zhang, W.; Lv, L.; Zhang, Q. Heavy metal removal from water/wastewater by nano-sized metal oxides: A review. J. Hazard. Mater. 2012, 211, 317–331. [Google Scholar] [CrossRef]
- Fu, F.; Wang, Q. Removal of heavy metal ions from wastewaters: A review. J. Environ. Manag. 2011, 92, 407–418. [Google Scholar] [CrossRef]
- Immamuglu, M.; Tekir, O. Removal of copper (II) and lead (II) ions from aqueous solutions by adsorption on activated carbon from a new precursor hazelnut husks. Desalination 2008, 228, 108–113. [Google Scholar] [CrossRef]
- Kadirvelu, K.; Goe, J.; Rajagopal, C. Sorption of lead, mercury and cadmium ions in multi- component system using carbon aerogel as adsorbent. J. Hazard. Mater. 2008, 153, 502–507. [Google Scholar] [CrossRef]
- Chingombe, P.; Saha, B.; Wakeman, R. Surface modification and characterization of a coal-based activated carbon. Carbon 2005, 43, 3132–3143. [Google Scholar] [CrossRef]
- Walker, A.; Wheelock, T.D. Separation of Carbon from Fly Ash Using Froth Flotation. Coal Prep. 2006, 26, 235–250. [Google Scholar] [CrossRef]
- Huffman, G.P.; Huggins, F.E.; Dunmyre, G.R. Investigation of the high-temperature behavior of coal fly ash in reducing and oxidizing atmospheres. Fuel 1991, 60, 585–597. [Google Scholar] [CrossRef]
- Catauro, M.; Tranquillo, E.; Risoluti, R.; Vecchio Ciprioti, S. Sol-Gel Synthesis, Spectroscopic and Thermal Behavior Study of SiO2/PEG Composites Containing Different Amount of Chlorogenic Acid. Polymers 2018, 10, 682. [Google Scholar] [CrossRef] [Green Version]
- Catauro, M.; D’Angelo, A.; Fiorentino, M.; Gullifa, G.; Risoluti, R.; Vecchio Ciprioti, S. Thermal behavior, morphology and antibacterial properties study of silica/quercetin nanocomposite materials prepared by sol–gel route. J. Therm. Anal. Calorim. 2022, 147, 5337–5350. [Google Scholar] [CrossRef]
- Zhu, G.R.; Tan, W.; Sun, J.M.; Gong, Y.B.; Zhang, S.; Zhang, Z.J.; Liu, L.Y. Effects and mechanism research of the desilication pre-treatment for high-aluminum fly ash. Energy Fuel 2013, 27, 6948–6954. [Google Scholar] [CrossRef]
- Gutzov, S.; Danchova, N.; Karakashev, S.; Khristov, M.; Ivanova, J.; Ulbikas, J. Preparation and thermal properties of chemically prepared nanoporous silica aerogels. J. Sol-Gel Sci. Technol. 2014, 70, 511–516. [Google Scholar] [CrossRef]
- Maj, S. Energy gap and density in SiO2 polymorphs. Phys. Chem. Miner. 1988, 15, 271–273. [Google Scholar] [CrossRef]
- Khedkar, M.V.; Somvanshi, S.B.; Humbe, A.V.; Jadhav, K.M. Surface Modified Sodium Silicate Based Superhydrophobic Silica Aerogels Prepared via Ambient Pressure Drying Process. J. Non-Cryst. Solids 2019, 511, 140–146. [Google Scholar] [CrossRef]
- Sharafudeen, R.; Al-Hashim, J.M.; Al-Harbi, M.O.; Al-Ajwad, A.I.; Al-Waheed, A.A. Preparation and characterization of precipitated silica using sodium silicate prepared from Saudi Arabian desert sand. Silicon 2017, 9, 917–922. [Google Scholar] [CrossRef]
- Yan, Z.; Fu, L.; Yang, H.; Ouyang, J. Amino-functionalized hierarchical porous SiO2-AlOOH composite nanosheets with enhanced adsorption performance. J. Hazard. Mater. 2018, 344, 1090–1100. [Google Scholar] [CrossRef]
- Tang, H.; Chang, S.; Wu, K.; Tang, G.; Fu, Y.; Liu, Q.; Yang, X. Band gap and morphology engineering of TiO2 by silica and fluorine co-doping for efficient ultraviolet and visible photocatalysis. RSC Adv. 2016, 6, 63117–63130. [Google Scholar] [CrossRef]
- Imoisili, P.E.; Ukoba, K.O.; Jen, T.C. Green technology extraction and characterisation of silica nanoparticles from palm kernel shell ash via sol–gel. J. Mater. Res. Technol. 2020, 9, 307–313. [Google Scholar] [CrossRef]
- Zhang, H.; Zhao, X.; Ding, X.; Lei, H.; Chen, X.; An, D.; Li, Y.; Wang, Z. Preparation and characterization of nano-structured silica from rice husk. Bioresour. Technol. 2010, 101, 1263–1267. [Google Scholar] [CrossRef]
- Mourhly, A.; Jhilal, F.; El Hamidi, A.; Halim, M.; Arsalane, S. Highly efficient production of mesoporous nano-silica from unconventional resource: Process optimization using a central composite design. Microchem. J. 2019, 145, 139–145. [Google Scholar] [CrossRef]
- Imoisili, P.E.; Jen, T.-C. Microwave-assisted sol–gel template-free synthesis and characterization of silica nanoparticles obtained from South African coal fly ash. Nanotechnol. Rev. 2022, 11, 3042–3052. [Google Scholar] [CrossRef]
- Gao, G.M.; Zou, H.F.; Gan, S.C.; Liu, Z.J.; An, B.C.; Xu, J.J.; Li, G.H. Preparation and properties of silica nanoparticles from oil shale ash. Powder Technol. 2009, 191, 47–51. [Google Scholar] [CrossRef]


| Composition | Concentration Wt. (%) | |
|---|---|---|
| SAFA | SNP | |
| Al2O3 | 31.66 | 0.15 |
| BaO | 0.19 | 0.00 |
| CaO | 5.33 | 0.02 |
| Cr2O3 | 0.06 | 0.00 |
| Fe2O3 | 4.10 | 0.05 |
| K2O | 0.84 | 0.03 |
| MgO | 1.54 | 0.00 |
| Na2O | 0.20 | 0.01 |
| P2O5 | 0.66 | 0.00 |
| SiO2 | 52.03 | 98.76 |
| SO3 | 0.35 | 0.00 |
| TiO2 | 1.72 | 0.00 |
| LOI | 1.33 | 0.98 |
| Total | 100.00 | 100.00 |
Publisher’s Note: MDPI stays neutral with regard to jurisdictional claims in published maps and institutional affiliations. |
© 2022 by the authors. Licensee MDPI, Basel, Switzerland. This article is an open access article distributed under the terms and conditions of the Creative Commons Attribution (CC BY) license (https://creativecommons.org/licenses/by/4.0/).
Share and Cite
Imoisili, P.E.; Nwanna, E.C.; Jen, T.-C. Facile Preparation and Characterization of Silica Nanoparticles from South Africa Fly Ash Using a Sol–Gel Hydrothermal Method. Processes 2022, 10, 2440. https://doi.org/10.3390/pr10112440
Imoisili PE, Nwanna EC, Jen T-C. Facile Preparation and Characterization of Silica Nanoparticles from South Africa Fly Ash Using a Sol–Gel Hydrothermal Method. Processes. 2022; 10(11):2440. https://doi.org/10.3390/pr10112440
Chicago/Turabian StyleImoisili, Patrick Ehi, Emeka Charles Nwanna, and Tien-Chien Jen. 2022. "Facile Preparation and Characterization of Silica Nanoparticles from South Africa Fly Ash Using a Sol–Gel Hydrothermal Method" Processes 10, no. 11: 2440. https://doi.org/10.3390/pr10112440