Article

COD Reduction of Aeration Effluent by Utilizing Optimum Quantities of UV/H2O2/O3 in a Small-Scale Reactor

1
Department of Chemical Engineering, Isfahan University of Technology, Isfahan 8415683111, Iran
2
Petroleum Systems Engineering Department, Faculty of Engineering and Applied Science, University of Regina, Regina, SK S4S 0A2, Canada
*
Author to whom correspondence should be addressed.
Processes 2022, 10(11), 2441; https://doi.org/10.3390/pr10112441
Submission received: 16 October 2022 / Revised: 7 November 2022 / Accepted: 15 November 2022 / Published: 18 November 2022
(This article belongs to the Topic Advanced Oxidation Process: Applications and Prospects)

Abstract

:
Extensive research has been carried out to figure out safe means of disposing various industrial effluents. Industrial wastewaters from the aeration industry such as heavy metals and oily substances contain a high degree of contamination. The advanced oxidation process is one of the most effective and rapid methods of removing contaminations, which can lead to a high chemical oxygen demand (COD). The aim of the present study is to reduce the COD of an aeration effluent with the initial COD of 13,004 mg/L. About 20 sets of experimental tests were conducted to identify the contribution of H2O2, O3, and UV to the treatment process. The influence of the quantities of additives and the dose of the UV irradiance were, too, among the subjects of the study. These factors were altered throughout the experiments and their mutual effects were measured. To design the experiments, Minitab software 16 was utilized. The experimental conditions were set at the standard values of 25 °C and 1 bar to minimize any uncertainty. Based on the results, a correlation was derived, which was capable of expressing the effects of the input parameters (AOPs parameters) on the response (the COD level). Finally, the optimization process was conducted to find the quantities of H2O2, O3, and UV irradiance required to decrease the CODs of the effluent to their lowest possible. Based on the findings, when the doses of H2O2, O3, and UV to the treatment process were 40 mg/L, 8 mg/L and 86 mWs/cm2, respectively, the COD percent change was 51.5%.

1. Introduction

Water is used in many industrial operations [1]. Industrial wastewater streams containing harmful organic and inorganic substances are generated from various industries such as aeration, metal-working, and metallurgy. Several aeration industries exist in places that are regarded as most hazardous locations due to the discharge of large volumes of wastewater with high levels of hardness, total dissolved solids, total suspended solids, chemical oxygen demand (COD), biological oxygen demand, and pH. The sources of high COD include reactive peroxometal complexes and greasy substances. Substances with high COD levels not only are harmful for the environment, but also can accumulate in human body through the natural food chain [2]. When their concentration surpasses the determined standards, serious health problems will arise among the people [3]. Hence, it is needless to emphasize that wastewater from aeration industries must be treated prior to the disposal of the waste. Often, physical means are not efficient enough in ridding of these extra substances. To remove them, one can rely on the advanced oxidation process (AOPs) [4]. AOPs contribute to the cleaning process by generating such highly reactive radical species as OH• [5,6]. To put it in the same context, AOPs involve the production of OH• through Injecting H2O2, ozone, and oxidants in combination via ultraviolet (UV) irradiance. To perform the operation more proficiently, researchers have suggested combining the three methods above [7] resulting in the release of HO•, which is mainly responsible for the degradation of organic compounds.
As OH• is reactive electrophiles, it is counted as a highly effective compound in eliminating organic chemicals [8]. It none-selectively reacts rapidly with almost all electron-rich organic compounds. As a result, OH• causes the breakdown of the organic compound and diminishes the pollutants concentrations [9]. It grasps a hydrogen atom from the organic compound (R−H) in wastewaters, and then leads to the production of an organic radical (•R). Following that, the organic radical is motivated to chemically react with other compounds to be neutralized [10,11,12]. This procedure is concisely shown in the equation below:
R H + HO   H 2 O + R
Due to some complex reactions, OH• and O2• are generated when ozone is added to wastewater. These radical compounds cause the oxidation of organic species. By introducing a small volume of H2O2, the rate of OH• production could be enhanced through the following stoichiometry [13].
2 O 3 + H 2 O 2   2 HO + 3 O 2
The performance of the ozone can also be boosted when the wastewater is exposed to the UV irradiance [14]. The application of UV in treatment is wide, and a comparative study among selected AOPs integrated with UV was done by some researchers [15,16,17]. The UV irradiance interferes in the process by generating H2O2 as an intermediate; following that, OH• is composed. The reactions involved are written as follows:
O 3 + H 2 O + h ν     O 2 + H 2 O 2 2 O 3 + H 2 O 2   2 HO + 3 O 2
Equation (3) shows the photolysis of ozone and the production of hydrogen peroxide, which eventually leads to the generation of the HO• radical [18].
H2O2 may also be introduced into the wastewater system as a single oxidant or one of the included oxidants [18]. The appropriate concentration of H2O2 is crucial during the degradation of pollutants. If an unexpected quantity of H2O2 is added to the wastewater, it can react with other contaminants to produce oxidizable materials, which is not the desired goal for the process. While easy to perform and beneficial to apply, the combination of H2O2 and UV is also used for decreasing the pollutant volume. Karci et al. [19] reported the polyethoxy chain of the surfactant is more susceptible to degradation in the H2O2 and UV treatment process. Antonopoulou [20] found the application of UV and H2O2 proved influential in reducing the odorous aldehyde concentrations.
Although this method of AOP is less costly and easier to carry out, it suffers some drawbacks. One of its main issues lies within its inability to absorb the UV light when large quantities of H2O2 are present in the wastewaters. This causes the loss of most of the light input [18]. Such an undesirable phenomenon can be hindered when the pH values of the wastewaters are decreased by altering the ratio of peroxide to ozone. AOPs have an oxidation potential of 2.33 V, approximately, and hence, compared to conventional oxidants such as KMnO4, show faster oxidation reaction rates [21,22]. Ozone, with its ability to react with organic compounds including polyphenols, is known as a strong oxidizer [8]. The combination of ozone, UV irradiance, and H2O2 has been suggested as an effective method for the treatment of wastewater with polyphenol content in documents such as those used by manufactures working with metal materials [23]. Therefore, several researchers have tried to determine the optimized parameters in terms of the concentrations of H2O2, O3, and the dose of UV when lowering the level of COD in effluents [10,19,20]. It should be mentioned that the response surface methodology (RSM) is a common way for optimization in an analytical chemistry application such as water treatment [24,25,26]. RSM was successfully applied in some experimental works as its responses are influenced by AOP variables, and optimization of the levels of these variables can be obtained through the fit of a polynomial equation to the experimental data.
The idea of applying UV, H2O2, and O3 to decrease the COD level seems reasonable, but is it efficient? What is the interaction of the mentioned parameters when the three AOP parameters are combined for a wastewater treatment? Do they cancel each other’s effects or strengthen treatment capabilities? In the present study, 20 experimental tests were designed to observe and detect the effects of H2O2, O3, and UV altogether on the treatment of aeration factory’s produced effluents. The main objective was to find the most efficient process with the lowest energy consumption for eliminating organic compounds and lowering the level of COD. Therefore, the experimental conditions were designed with the help of the RSM method, which was introduced to the Minitab software 16. After conducting the tests, the optimized point at which the definitive treatment could be conducted was determined.

2. Materials and Methods

The materials, apparatus and measuring methods used in the experiments are briefly introduced as below.

2.1. The Apparatus

  • COD Reactor (Box 389, Loveland, Hach Co., CO, USA)
  • Spectrophotometer (Jenway 6305, UV/Vis. Spectrophotometer, UK)
  • Centrifuge (Werk NT.BaujharEkin, Universal 320 R, Hettich, Germany)
  • Lab oven
  • Furnace (Aria-Electric, EMTC model, Iran)
  • Ph meter (pH 162, Iran)
  • Laboratory scales with measurement accuracy of 0.00001 g (Kyoto Co., Electronic balance, AEL-40SM, Japan)
  • Ozone generator (ARDA Ozone- ONE)
  • UV bulb (33 W, AQUA SAFE, Taiwan)
  • RO Pump (TY-2800- 24 VDC)

2.2. The Input Materials/Chemicals

  • Potassium Dichromate (Zigma), 99% (W/W)
  • Concentrated sulfuric acid (Merck), 98% (W/W)
  • Mercury sulfate (Zigma), 98% (W/W)
  • Silver sulfate (Zigma), >99% (W/W)
  • Potassium Hydrogen Phthalate (Merck), >99% (W/W)
  • Hydrogen peroxide (Merck), >30% (W/W)

2.3. The Studied Wastewater

Several wastewater samples were taken from an aeration factory. The COD of the wastewater samples was measured at 13,004 mgO2/L. Due to the high value of COD in the effluent from the aeration industry, the wastewater taken was regarded as appropriate for the purpose of the present study. They were maintained at a temperature of 4 °C to prevent any changes in the wastewater’s COD.
Due to its high COD level, wastewaters are not allowed to be released into the environment without any pretreatment actions. Therefore, advanced treatment methods were employed in the study to reduce the value of the COD to a standard level of 250 mg/L [27] before disposing the wastewater.

2.4. Measurement Methods

In order to evaluate the performance of the advanced oxidation process, it is essential for the key factors of the process to be measured. To this end, the most important property, the quantity of organic substances in the wastewater, should be measured. There are various techniques for measuring the quantity of organic substances such as: (i) the chemical oxygen demand, and (ii) the total volatile solid. To determine the quantity of the wastewater’s COD, a method similar to the D-5220 closed reflux, known as the colorimetric method, was employed [27].

2.5. Construction of the Base Line

Among the available treatment approaches, those combined methods, which include UV, O3, and H2O2, were employed as the basis of the present work. To find the best combination, in terms of UV dose and the amount of O3 as well as H2O2, several tests were conducted. The chosen ranges were picked up as per the literature [28,29,30,31,32,33].
A sample of the untreated wastewater was poured into a 2000-mL Erlenmeyer flask. This Erlenmeyer flask was the storage of the system, and the untreated water started to be pumped out through a container with a volume capacity of 1500 mL to be exposed to a high level of UV irradiance. The UV irradiance was emitted from a 33 W bulb with a length of 80 cm. The flow rate of the fluid was kept at 200 mL/min and some baffles were put on the way of the flowing water in the container to generate turbulency in the flowing fluid. The level of the water in the container was kept lower than 0.5 cm in order to increase the surface area of the exposed water to the UV irradiance. At the same time, based on the plan mentioned in Table 1, sufficient quantities of H2O2 and O3 were added to the fluid. The container output was led to a tee. A branch of the tee was used to collect the treated water at the end of the process. The other branch was used to recycle back the fluid to the storage to increase the efficiency of the process. The COD of the treated product was measured after 40 min of the disinfection operation. In total, 20 tests were conducted when using various combinations of UV/H2O2/O3. With the aim of minimizing the inaccuracies in the measurement results, and to ensure the repeatability of the tests, all of the tests were performed three times, and then the average values of the three tests were regarded as the final figures. Figure 1 and Figure 2 represent a simple schematic of the treatment system used during the process.

Experimental Conditions

In the present work, the concentration of H2O2 and O3, as well as the dose of UV were studied under five levels tabulated in Table 1. To adapt the tests and designs with harmony, X domain was set between −2 and +2 in Minitab. Therefore, according to the table, each of the values in the AOP process calls a number between −2 and +2. Following the definition of the parameters’ ranges, 15 tests with different values of parameters were randomly selected and conducted. Together with the test conditions, they were recommended by the Minitab software and are listed in Table 2. Accordingly, the last five tests (from case 16 to case 20) have (0, 0, 0) values. Please note that these sets of tests were designed to determine the level of errors.

3. Results and Discussion

Experiments were carried out by applying UV irradiance and adding H2O2 and O3 compounds at the natural pH of the effluents taken from the aeration field. This enabled the identification of the power of AOPs at different conditions of removing the COD amounts. Figure 3 shows a wastewater sample before and after disinfection. The mentioned process almost removed the bad smell, dark color, COD amount, and other heavy metal effects on the water. Table 3 highlights the ability of each set of tests in removing the COD from the studied wastewater.
The treatment cost of each individual test was evaluated based on the electrical energy per-order ( E E O ) according to the following equation
E E O = W U V + W H 2 O 2 + W O 3   V × log ( C O D i C O D f )
where E E O stands for the electrical energy consumption per order (kWh/m3), WUV is the electrical energy consumption of the UV lamp (kWh), WH2O2 shows the equivalent electrical energy of the applied H2O2 (kWh), WO3 represents the equivalent electrical energy of the applied O3 (kWh), V presents the volume of the sample (m3), and CODi and CODf are the initial and final concentration of the sample, respectively. The ozone conversion to equivalent electrical energy unit was done by assuming that the used ozone generator produced 50 mgO3 per hour, and that the energy consumption of the equipment is 20 kWh. The electrical energy conversion for the applied peroxide is based on the cost of peroxide, 0.01 $/g, and the charge of electrical energy 0.14 $/h.
The COD reduction percent and the electrical energy consumption for the 20 tests done are shown in Figure 4. As seen in the figure, the best and the worst test numbers for the water treatment without paying attention to their energy consumption are tests 9 and 12, respectively. On the other hand, tests 8 and 1 are the most and the least energy-consuming processes in this work, respectively. The figure does not show a pattern to understand where the optimum point for the purpose of treatment and energy saving is. Therefore, these data were given to Minitab for more analysis.

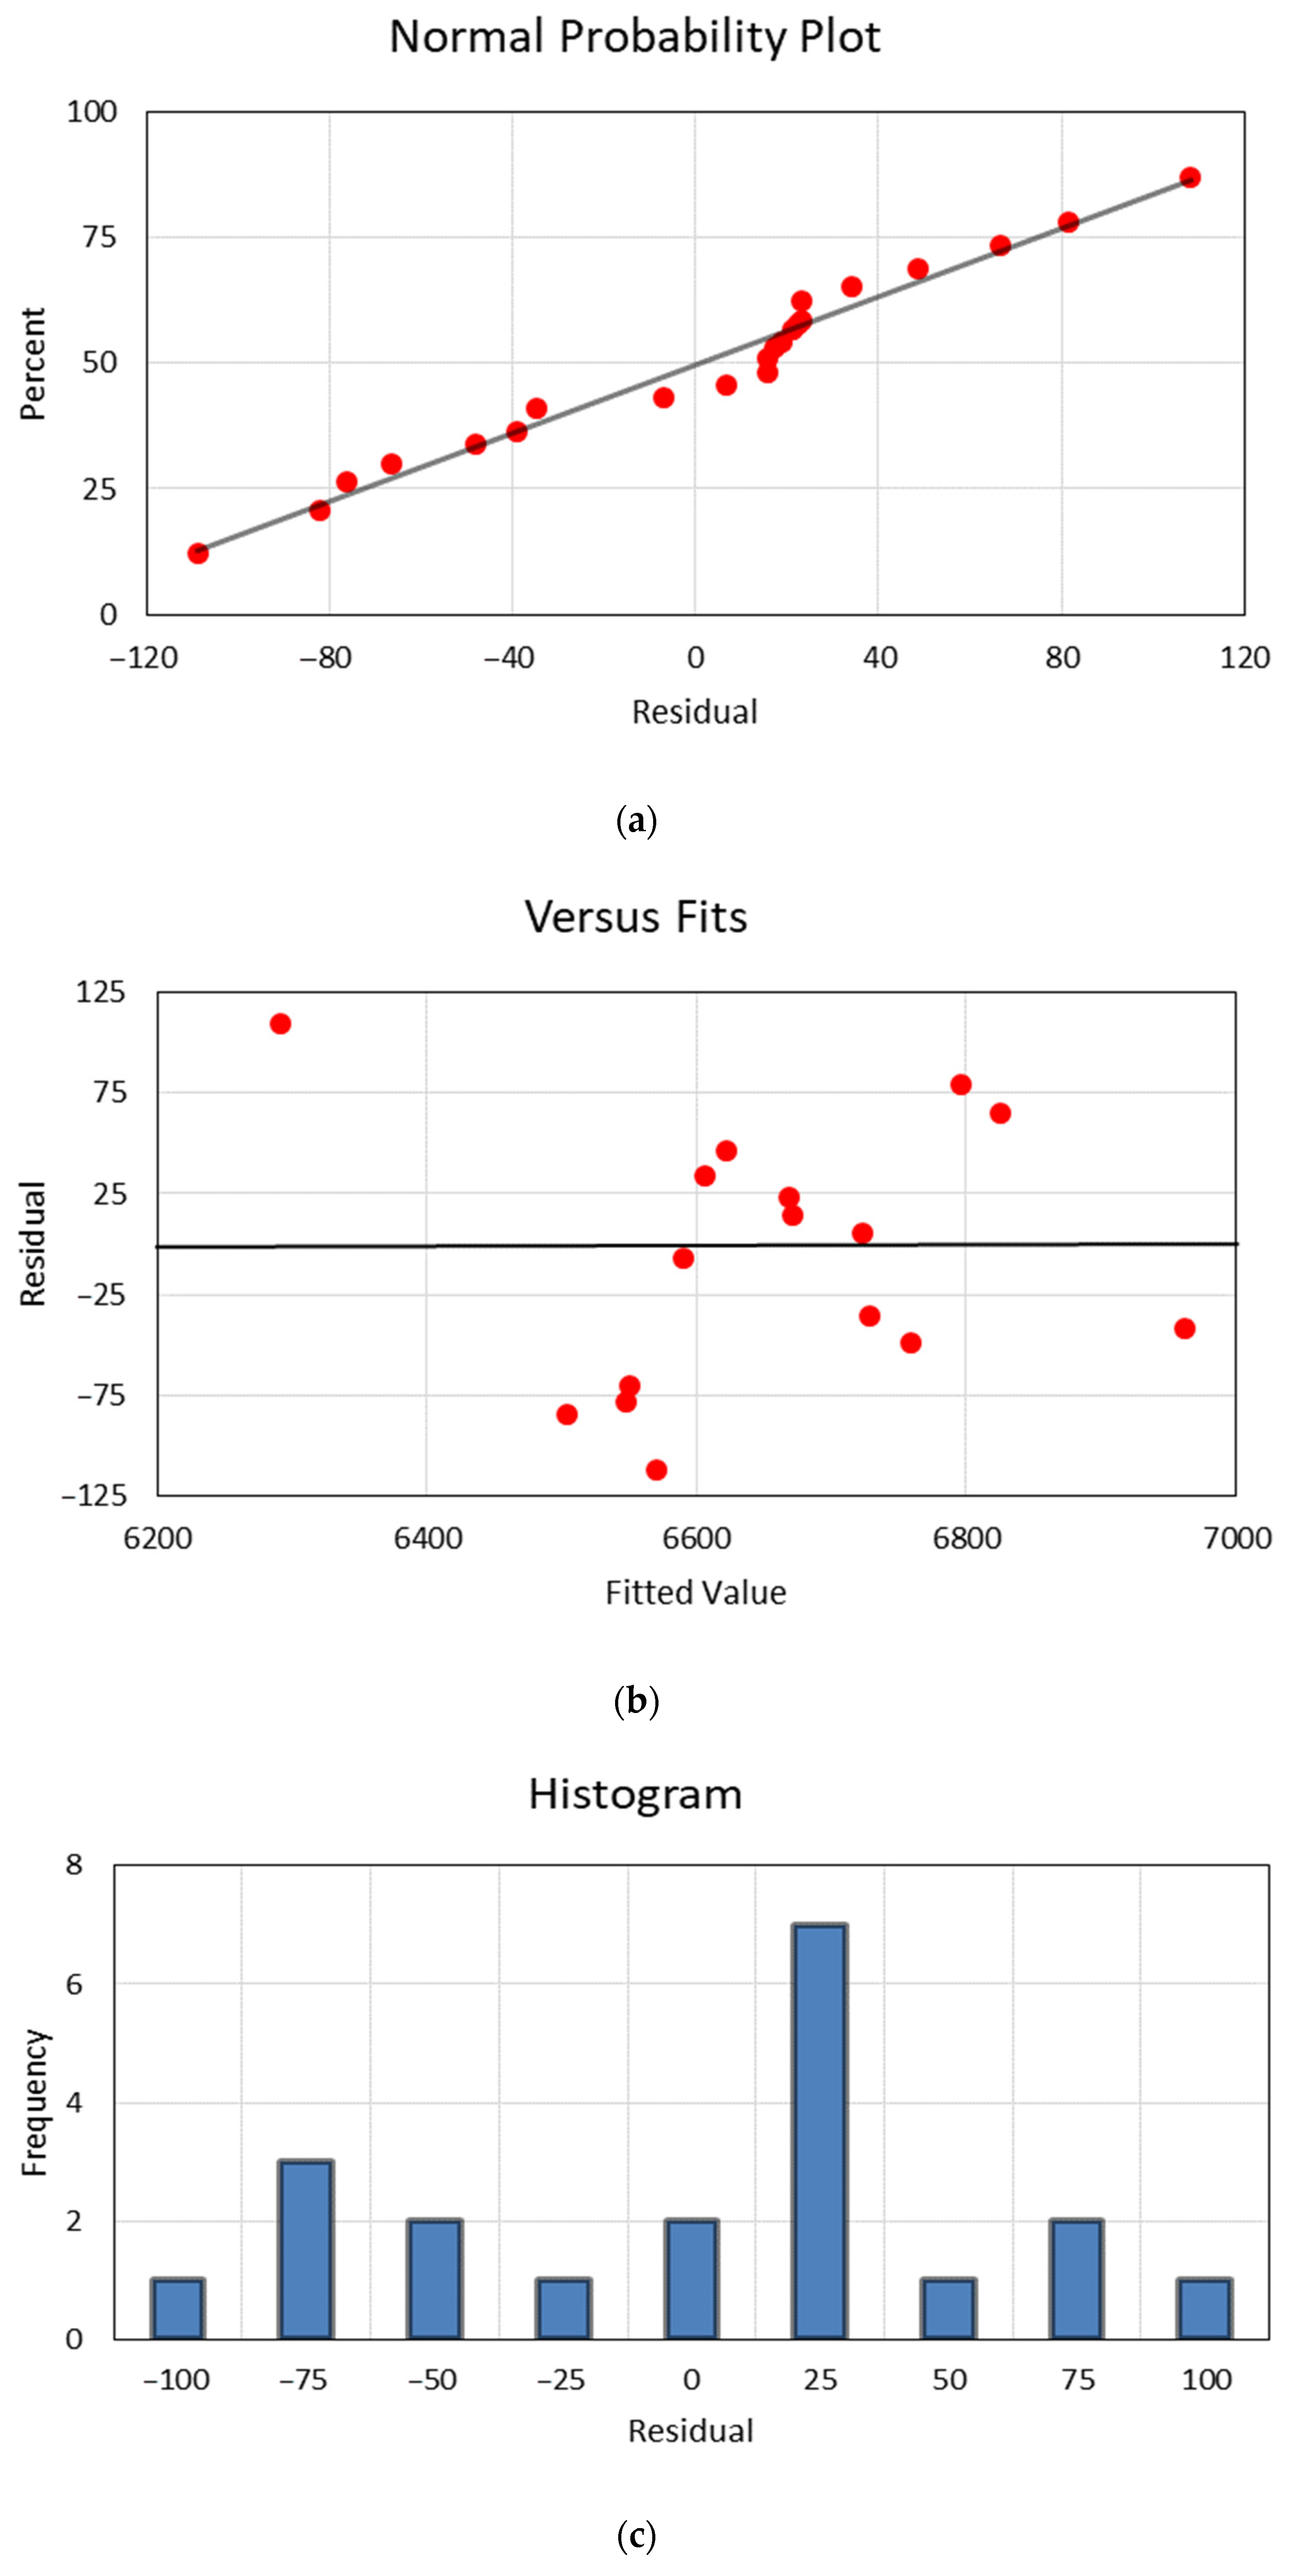
3.1. Residual Diagrams

In order to reassure all the model assumptions for the present model have been met, the residual plots should be validated. There are essentially four residual plots in Minitab that guide the users to clarify if they follow a normal distribution or the confidence intervals and p-values can be accurate. The residual diagrams for this experiment (COD reduction) are shown in Figure 5. The first plot is the normal probability plot of the residuals, which represents the residuals versus their expected values. The plot verifies the assumption that the residuals are normally distributed if it approximately follows a straight line without any abnormality. As it can be observed from Figure 5a, data are in their normal condition and are close to the cross line.
The residuals versus fits graph indicates the fitted values on the horizontal axis and the residuals on the vertical axis. The question regarding the residual variance whether being constant or not can be addressed by residuals versus fits graph shown in Figure 5b. Considering the points on the graph, one could recognize the residual variance is reasonable and constant in the present study. Not only are the data points scattered around the horizontal zero line, but they also do not seem to follow a unique pattern.
The distribution of the residuals for all observations can be seen in a histogram plot. Theoretically, when the curvature of the histogram chart is close to bell-shaped, it represents the normal distribution of the data in the design of experiments (DOE) media. Figure 5c shows the histogram bar chart of the work. As it can be observed, although the chart does not resemble a perfect bell-shaped histogram, it is within a reasonable range to conclude the correctness of the residual data.
The residuals versus order plot displays the residuals in the order that the data were collected. The residuals versus order plot is used to confirm the assumption that the residuals are independent from one another. There are no trends or patterns in independent residuals when shown in time order. The patterns in the data may suggest that residuals close to one another are likely connected and hence, not independent. Ideally, the residuals on the plot should be distributed around the zero line randomly. Figure 5d shows data points in the order do not follow a logical pattern. On the other hand, Figure 5d confirms that the residuals are independent from one another.

3.2. Developed Correlation

The analysis of the results for chemical oxygen demand was conducted by the Minitab software 16. Table 4 shows the analysis of variance (ANOVA) results displayed in the session window of Minitab. The p-value is a measure of how likely the sample results are, assuming the null hypothesis is true. Its value is somewhere between 0 and 1. The p-value shows the power of each parameter participating in the input-response parameters. In the present study, if the p-value of an input parameter, all of which are tabulated in Table 4, is greater than 0.001, that parameter is regarded as weak and without a significant influence on the results. Indeed, if the p-value is 0.05 or more, its corresponding parameter is regarded as insignificant, which can lead to ignoring its influence on the response’s value. Based on this analogy, the following correlation, which relates the AOPs parameters to the COD value, was obtained.
Y = 6663 64.87 X 1 128.87 X 2 55.87 X 3 + 56 X 1 X 2 + 38.5 X 2 X 3
Equation (5) was obtained with an adjusted R-squared value of 0.83 and a coefficient of determination of 0.72, which states that the above equation can generate fairly accurate values that match the experimental data.

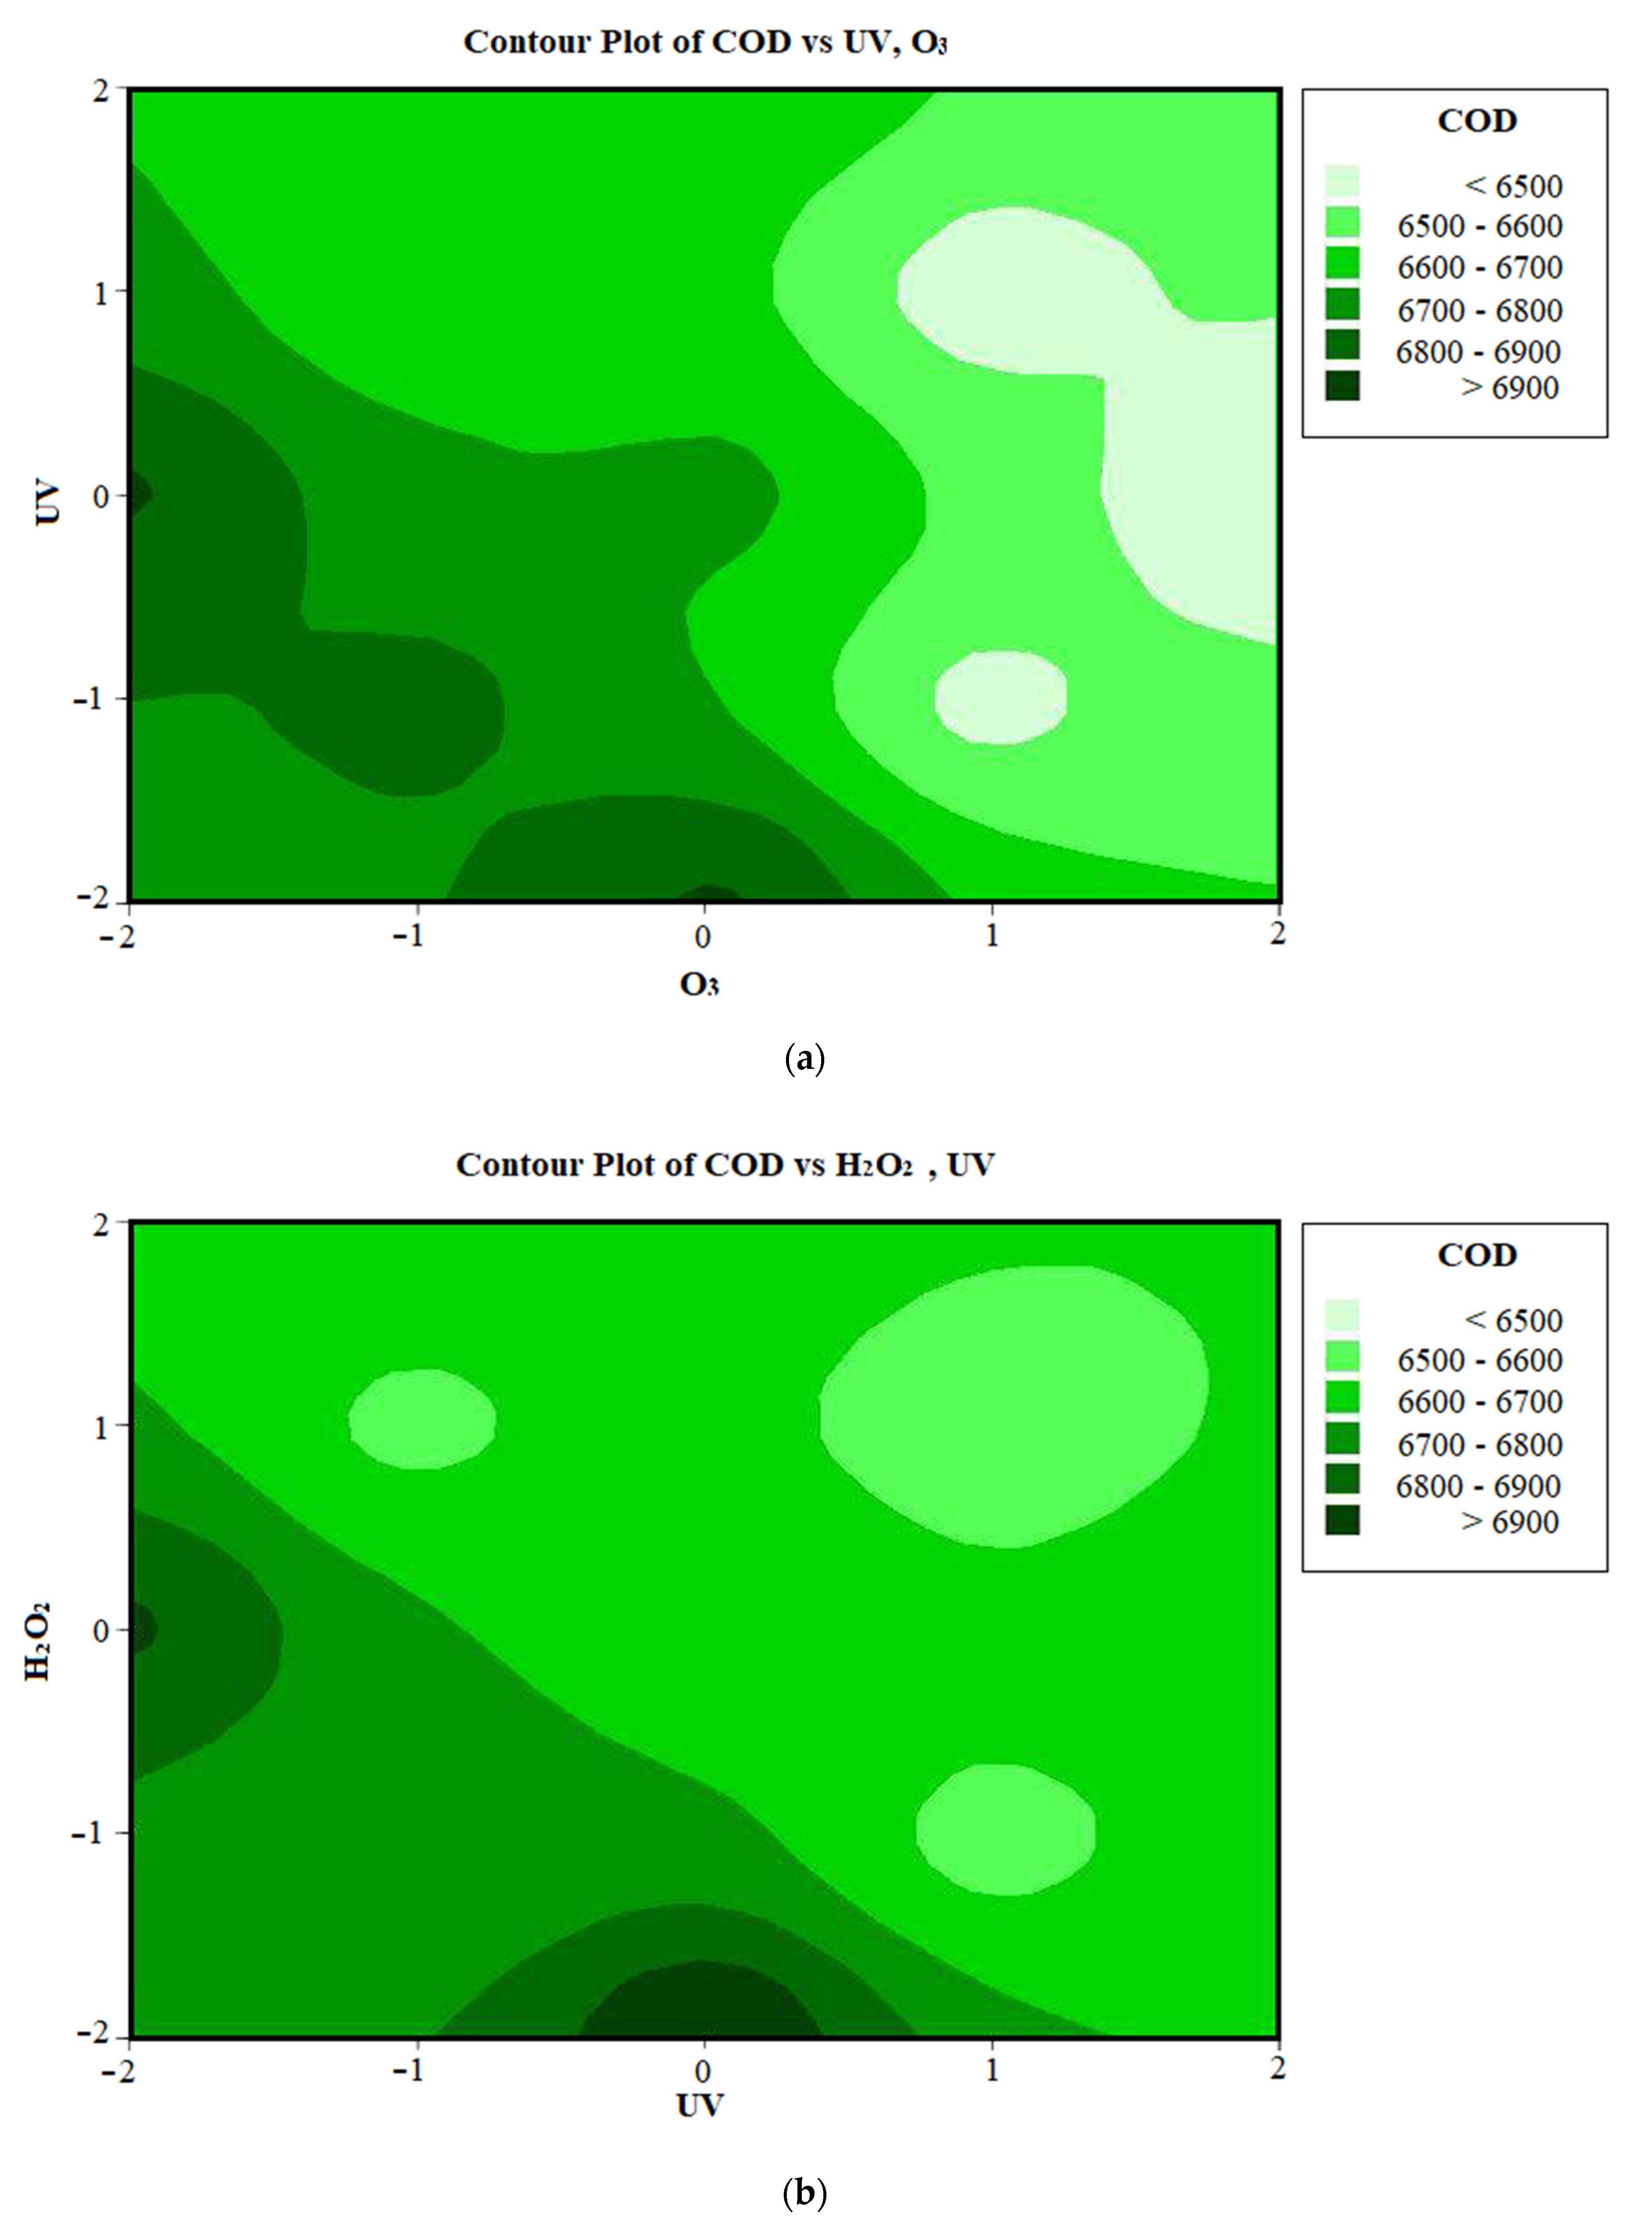
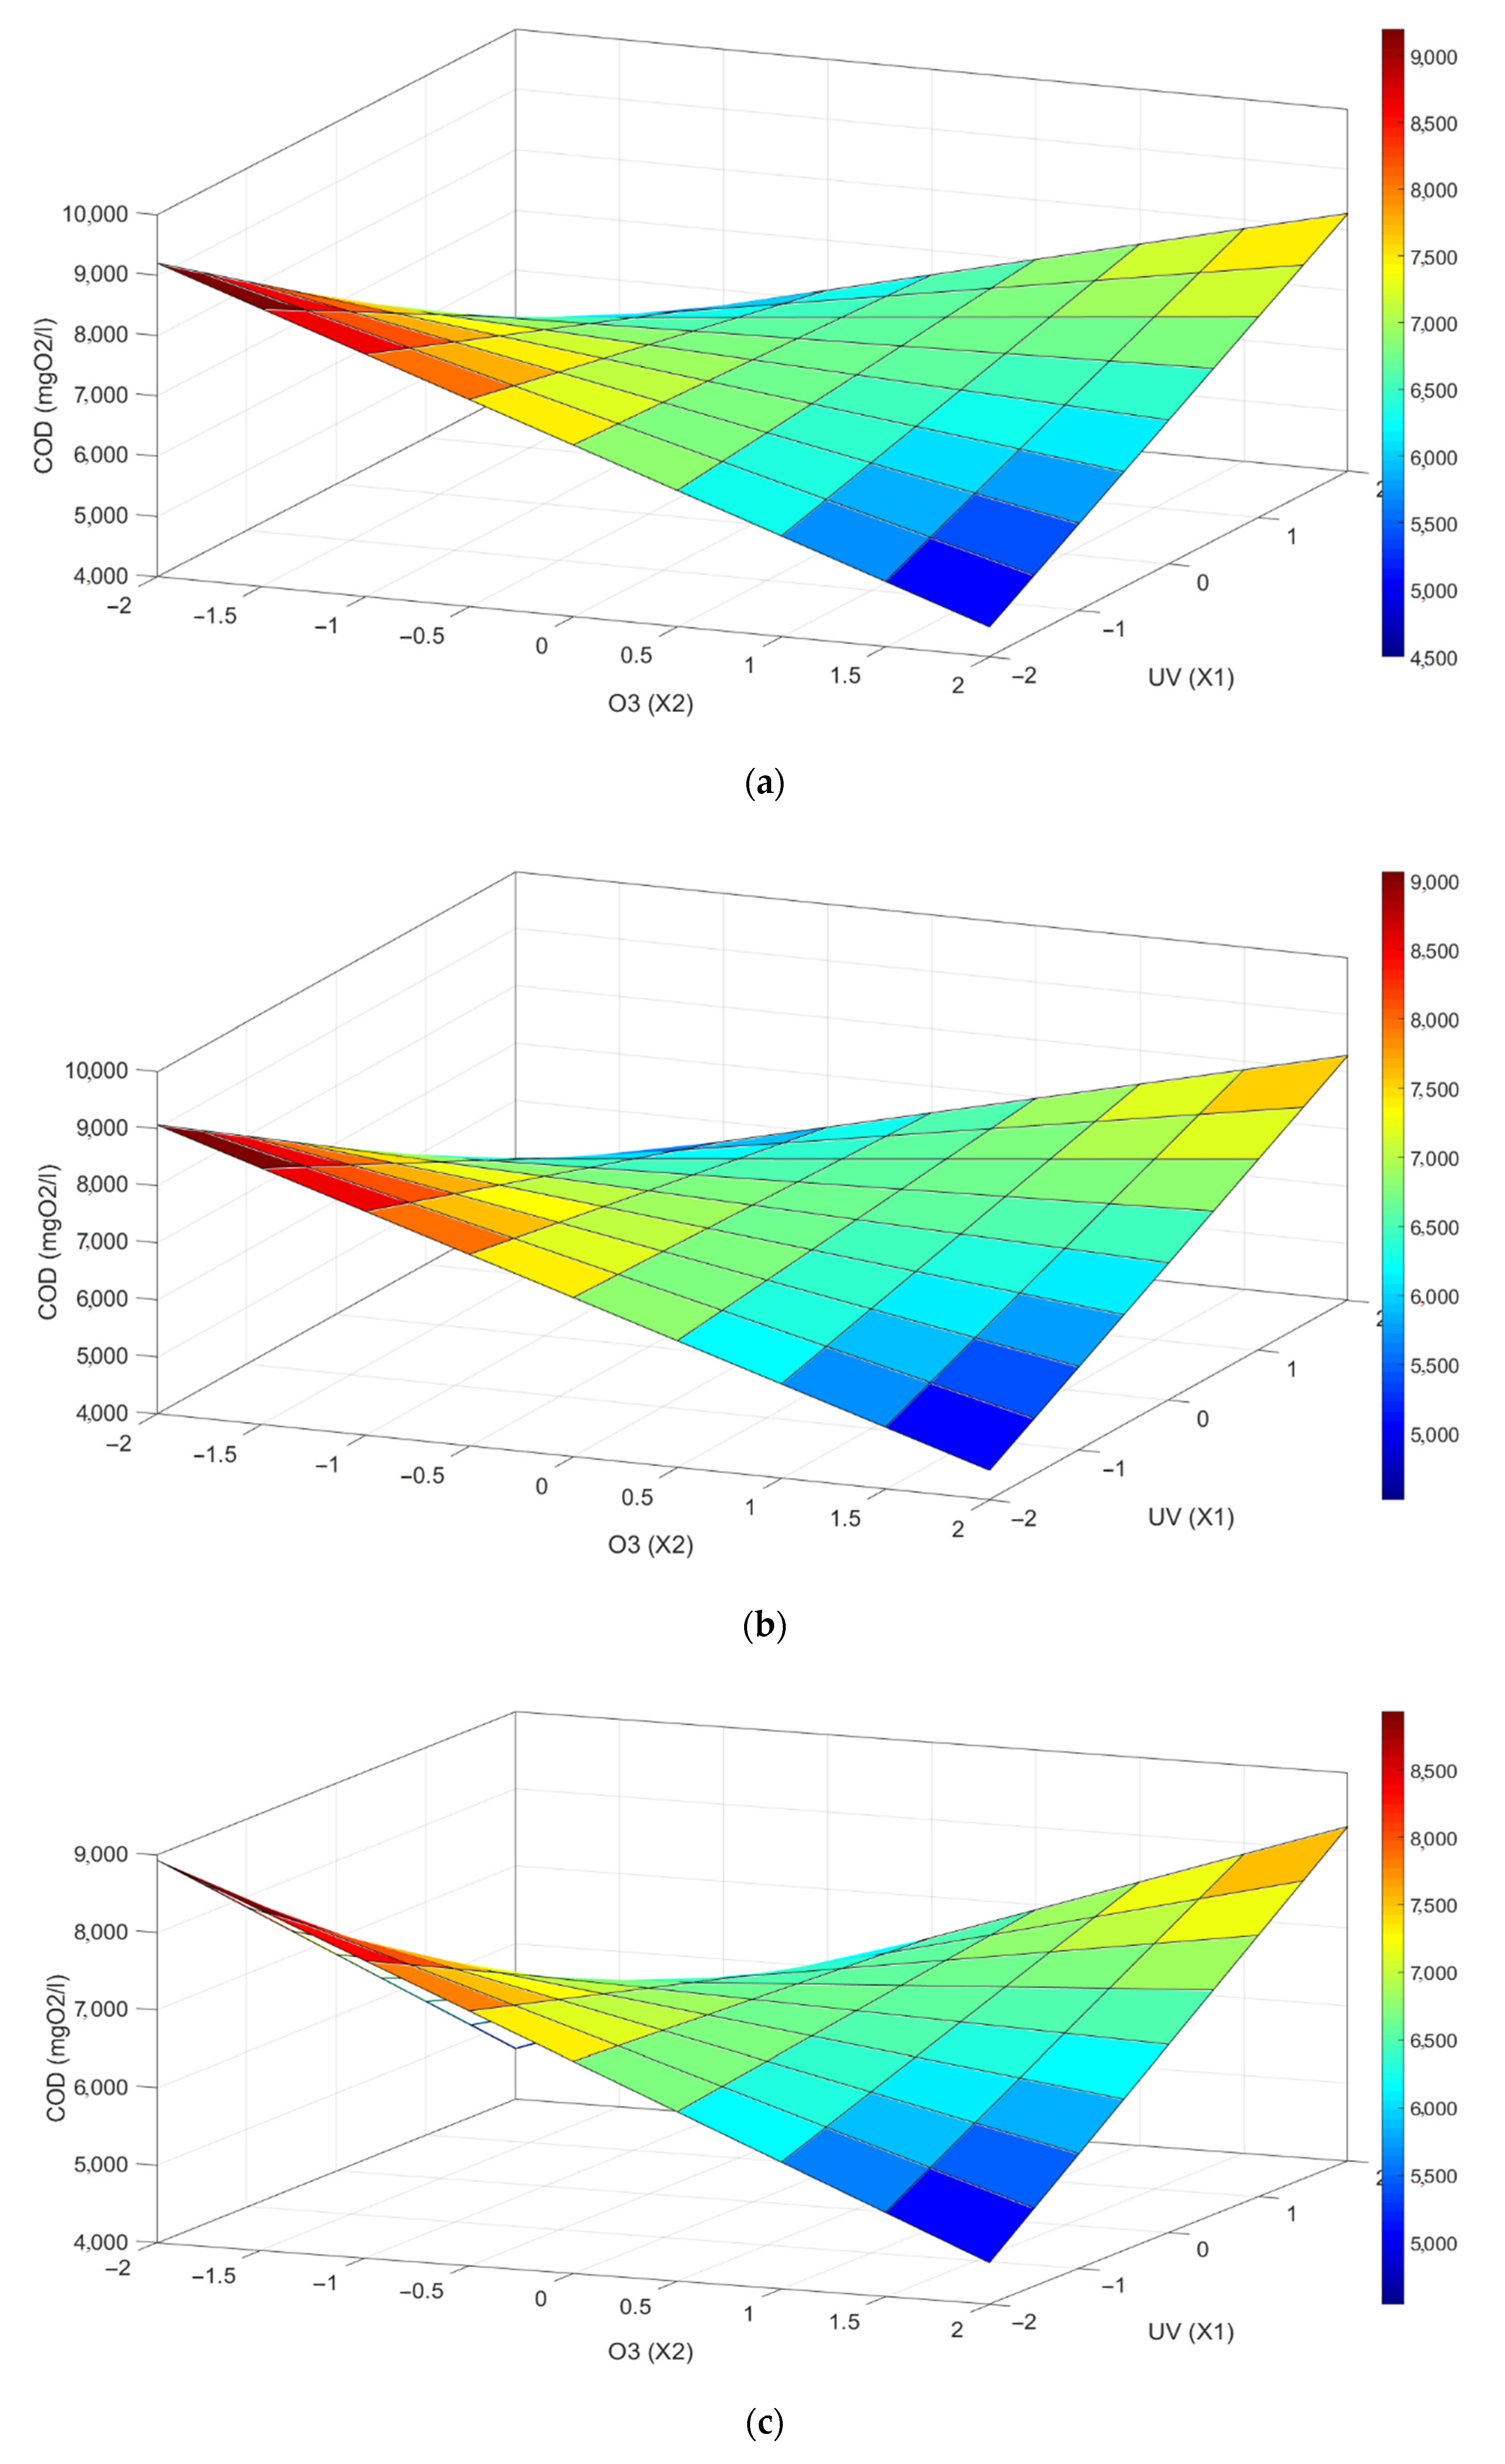
3.3. Analyses of the Response’s Surface Plots

It is worth noting that the synergy of independent parameters over a response can be studied through contour or 3D plots. To do so, one variable has to be maintained constant while letting the other two vary within their defined ranges in a system of three variables. The figures generated from this method show not only the effects of two independent parameters simultaneously, but also the patterns of the response.
Figure 6a shows the combined effect of UV and O3 on the level of COD when H2O2 was held at 0 (the coded value). From there, one may indicate that the lowest COD is obtained through applying the maximum quantity of O3 along with the emission of medium UV dose. Due to relative obscurity of the effluent as well as its high concentration of heavy metal, the UV irradiance does not work properly. As a result, O3 and UV do not have an effective synergy to lower the level of COD when the effluent sample possesses low transparency and high heavy metal content.
Assuming a constant value of 0 (the coded value) for O3, both of UV and H2O2 have been modified to observe their effects on the level of COD. The results are summarized in Figure 6b. While Figure 6a does not show a recognizable symmetry and pattern for the response, Figure 6b demonstrates a linear change in the value of COD (as the studied response). In other words, the higher the amounts of UV and H2O2 used, the lower the COD levels generated. Obviously, symmetry exists throughout the plot. Although the overall COD reduction comes from using UV, and H2O2 is lower than that when UV and O3 simultaneously are employed, the COD reduction with UV and H2O2 is done recognizably well, which shows the strong positive synergy between UV and H2O2.
The advantages and disadvantages of utilizing H2O2 can be perceived by observing Figure 6c. In spite of the fact that the use of O3 itself improves the level of purification and also reduces the level of COD, H2O2 is effective if only the optimized volume of H2O2 is added to the effluent. Higher volumes of H2O2 decrease its removal power since a competition between carbonate and bicarbonate in the mixture comes into the scene, which in turn prevents AOPs from generating more HO• radicals. Furthermore, similar to Figure 6a, Figure 6c does not indicate a predictable response pattern. The interaction of H2O2 and O3 changes with varying the concentration of injected O3, and hence, an optimization procedure needs to be conducted to figure the appropriate volume of H2O2 required to reduce the COD level.

3.4. Optimization Conditions

The optimized amount of AOPs can be obtained by Minitab’s response optimizer. In fact, by employing Equation (5), Minitab can introduce the best AOP’s combination according to which the wastewater from the aeration industry can be cleaned more effectively. The optimization outcomes and the after-treatment COD level are presented in Table 5. The optimized value for UV emission is 86 mWs/cm2, which can be counted as a medium UV emission. The used wastewater was too dark and obscure, and therefore, UV was not effective enough to remove the pollution compared with O3 and H2O2 when high chemical additives were added to the wastewater. In addition, the level of optimized O3 should be higher than H2O2 level to decrease competition between bicarbonate and carbonate ions in the fluid. Thus, while 8 mg/L O3 as the highest applied amount is the optimum point for the COD reduction, 40 mg/L H2O2 as a medium value is recommended by Minitab.
Figure 7 shows three 3D plots of the response graphs of applying O3 and UV at three levels of H2O2. Based on the output depicted in Figure 7, it can be concluded that the efficiency of COD removal will be optimum when the O3 and H2O2 quantities are around 2, and −1, respectively, while the UV irradiance varies between −1.5 and −2. By converting the mentioned coded numbers using Table 2 to real values, the optimum values mentioned in Table 5 are found. This verifies the optimum AOP values in Table 5.

4. Conclusions

A total of 20 sets of experimental tests were conducted in order to study the performance of AOPs, including H2O2, O3, and UV, when disinfecting the effluent released from an aeration industry. The experimental tests were planned by the Minitab software. The mutual effects of the additives over the water treatment process were examined through analyzing the contour plots. It was observed that the use of H2O2 and O3 together can remarkably enhance the cleaning process. However, when the quantity of H2O2 exceeded what is known as the optimized amount, it unexpectedly lost the potential to reduce the level of COD in the wastewater. It was shown that at constant levels of O3 and UV, doubling the amount of H2O2 from 45 to 95 mg/L only decreased the wastewater COD insignificantly from 50.1% to 50.2% while the energy consumption was increased from 33.5 to 44.4 kWh/m3. Similar to the case of H2O2, the UV irradiance yielded the same results when it was employed in the treatment process together with a high level of O3. Unlikely, H2O2 or UV irradiance alone linearly decreased the level of COD in the effluent when a low concentration of O3 was used. The results showed that by increasing the dose of UV emission from 40 to 400 mWs/cm2, the COD level was decreased from 46.3% to 48.9% when the chemical additives were low or medium. However, this positive effect could not be extended when the additive levels are high. According to their effects on the process, a polynomial correlation was derived through which the response (COD value) could be found by simply substituting the variables’ quantities in the correlation. Following that, to obtain the optimized quantities of H2O2, O3, and UV altogether, the optimization task was completed with the help of Minitab’s response optimizer. A UV emission of 86 mWs/cm2, O3 dose of 8 mg/L, and H2O2 dose of 40 mg/L were the optimum values reported by Minitab. It was found that by using the optimized AOP values, the COD reduction reached the highest value of 51.5% with the lowest energy consumption.

Author Contributions

Conceptualization, M.R.; methodology, M.R., M.S. and F.T.; software, M.R.; validation, M.R. and M.S.; formal analysis, M.R. and M.S.; investigation, M.R.; writing—original draft preparation, A.R. and M.S.; writing—review and editing, A.R. and M.S.; supervision, F.T. All authors have read and agreed to the published version of the manuscript.

Funding

This research received no external funding.

Institutional Review Board Statement

Not applicable.

Informed Consent Statement

Not applicable.

Data Availability Statement

The data used to support the findings of this study are available from the corresponding author upon request.

Conflicts of Interest

The authors declare no conflict of interest.

References

  1. Saffari, P.R.; Salarian, H.; Lohrasbi, A.; Salehi, G.; Manesh, M.H.K. Optimization of a Thermal Cracking Reactor Using Genetic Algorithm and Water Cycle Algorithm. ACS Omega 2022, 7, 12493–12508. [Google Scholar] [CrossRef]
  2. Rafiee, M.; Salehi, E.; Sharifi, K.; Mohammadi, A.H.; Rohani, A.; Sabeti, M. Enhancement of biogas production efficiency using appropriate low-temperature pretreatments of municipal treatment plants' excess sludge. Environ. Prog. Sustain. Energy 2019, 38, e13072. [Google Scholar] [CrossRef]
  3. Halder, J.N.; Islam, M.N. Water pollution and its impact on the human health. J. Environ. Hum. 2015, 2, 36–46. [Google Scholar] [CrossRef]
  4. Ameta, S.C.; Ameta, R. Advanced Oxidation Processes for Wastewater Treatment: Emerging Green Chemical Technology; Academic Press: Cambridge, MA, USA, 2018. [Google Scholar]
  5. Ganiyu, S.O.; Van Hullebusch, E.D.; Cretin, M.; Esposito, G.; Oturan, M.A. Coupling of membrane filtration and advanced oxidation processes for removal of pharmaceutical residues: A critical review. Sep. Purif. Technol. 2015, 156, 891–914. [Google Scholar] [CrossRef]
  6. Muruganandham, M.; Swaminathan, M. Advanced oxidative decolourisation of Reactive Yellow 14 azo dye by UV/TiO2, UV/H2O2, UV/H2O2/Fe2+ processes—A comparative study. Sep. Purif. Technol. 2006, 48, 297–303. [Google Scholar] [CrossRef]
  7. Gorito, A.M.; Pesqueira, J.F.; Moreira, N.F.; Ribeiro, A.R.; Pereira, M.F.R.; Nunes, O.C.; Almeida, C.M.R.; Silva, A.M. Ozone-based water treatment (O3, O3/UV, O3/H2O2) for removal of organic micropollutants, bacteria inactivation and regrowth prevention. J. Environ. Chem. Eng. 2021, 9, 105315. [Google Scholar] [CrossRef]
  8. Issaka, E.; Amu-Darko, J.N.-O.; Yakubu, S.; Fapohunda, F.O.; Ali, N.; Bilal, M. Advanced catalytic ozonation for degradation of pharmaceutical pollutants―A review. Chemosphere 2022, 289, 133208. [Google Scholar] [CrossRef]
  9. Mohajerani, M.; Mehrvar, M.; Ein-Mozaffari, F. An overview of the integration of advanced oxidation technologies and other processes for water and wastewater treatment. Int. J. Eng. 2009, 3, 120–146. [Google Scholar]
  10. Bokare, A.D.; Choi, W. Review of iron-free Fenton-like systems for activating H2O2 in advanced oxidation processes. J. Hazard. Mater. 2014, 275, 121–135. [Google Scholar] [CrossRef]
  11. Yao, H. Application of advanced oxidation processes for treatment of air from livestock buildings and industrial facilities. Tech. Rep. Biol. Chem. Eng. 2013, 2, 1–36. [Google Scholar]
  12. Yao, H.; Feilberg, A. Application of Advanced Oxidation Processes for Treatment of Air from Livestock Facilities. In Proceedings of the International Conference on Agricultural Engineering, Aarhus, Denmark, 26 June 2016. [Google Scholar]
  13. Andreozzi, R.; Caprio, V.; Insola, A.; Marotta, R. Advanced oxidation processes (AOP) for water purification and recovery. Catal. Today 1999, 53, 51–59. [Google Scholar] [CrossRef]
  14. Cuerda-Correa, E.M.; Alexandre-Franco, M.F.; Fernández-González, C. Advanced oxidation processes for the removal of antibiotics from water. An overview. Water 2019, 12, 102. [Google Scholar] [CrossRef] [Green Version]
  15. Buthiyappan, A.; Aziz, A.R.A.; Daud, W.M.A.W. Degradation performance and cost implication of UV-integrated advanced oxidation processes for wastewater treatments. Rev. Chem. Eng. 2015, 31, 263–302. [Google Scholar] [CrossRef]
  16. Madihi-Bidgoli, S.; Asadnezhad, S.; Yaghoot-Nezhad, A.; Hassani, A. Azurobine degradation using Fe2O3@multi-walled carbon nanotube activated peroxymonosulfate (PMS) under UVA-LED irradiation: Performance, mechanism and environmental application. J. Environ. Chem. Eng. 2021, 9, 106660. [Google Scholar] [CrossRef]
  17. Hassani, A.; Eghbali, P.; Mahdipour, F.; Wacławek, S.; Lin, K.-Y.A.; Ghanbari, F. Insights into the synergistic role of photocatalytic activation of peroxymonosulfate by UVA-LED irradiation over CoFe2O4-rGO nanocomposite towards effective Bisphenol A degradation: Performance, mineralization, and activation mechanism. Chem. Eng. J. 2023, 453, 139556. [Google Scholar] [CrossRef]
  18. Kommineni, S.; Zoeckler, J.; Stocking, P.; Liang, A.; Flores, R.; Rodriguez, T.; Brown, R.; Brown, A. Advanced Oxidation Processed; Center for Groundwater Restoration and Protection, National Water Research Institute; Academia: San Francisco, CA, USA, 2000. [Google Scholar]
  19. Karci, A.; Arslan-Alaton, I.; Bekbolet, M.; Ozhan, G.; Alpertunga, B. H2O2/UV-C and Photo-Fenton treatment of a nonylphenol polyethoxylate in synthetic freshwater: Follow-up of degradation products, acute toxicity and genotoxicity. Chem. Eng. J. 2014, 241, 43–51. [Google Scholar] [CrossRef]
  20. Antonopoulou, M.; Evgenidou, E.; Lambropoulou, D.; Konstantinou, I. A review on advanced oxidation processes for the removal of taste and odor compounds from aqueous media. Water Res. 2014, 53, 215–234. [Google Scholar] [CrossRef]
  21. Gogate, P.R.; Pandit, A.B. A review of imperative technologies for wastewater treatment I: Oxidation technologies at ambient conditions. Adv. Environ. Res. 2004, 8, 501–551. [Google Scholar] [CrossRef]
  22. Gogate, P.R.; Pandit, A.B. A review of imperative technologies for wastewater treatment II: Hybrid methods. Adv. Environ. Res. 2004, 8, 553–597. [Google Scholar] [CrossRef]
  23. Oller, I.; Malato, S.; Sánchez-Pérez, J. Combination of advanced oxidation processes and biological treatments for wastewater decontamination—A review. Sci. Total Environ. 2011, 409, 4141–4166. [Google Scholar] [CrossRef]
  24. Bezerra, M.A.; Santelli, R.E.; Oliveira, E.P.; Villar, L.S.; Escaleira, L.A. Response surface methodology (RSM) as a tool for optimization in analytical chemistry. Talanta 2008, 76, 965–977. [Google Scholar] [CrossRef] [PubMed]
  25. Rekhate, C.V.; Srivastava, J.K. Effectiveness of O3/Fe2+/H2O2 process for detoxification of heavy metals in municipal wastewater by using RSM. Chem. Eng. Process. Process Intensif. 2021, 165, 108442. [Google Scholar] [CrossRef]
  26. Masouleh, S.Y.; Mozaffarian, M.; Dabir, B.; Ramezani, S.F. COD and ammonia removal from landfill leachate by UV/PMS/Fe2+ process: ANN/RSM modeling and optimization. Process Saf. Environ. Prot. 2022, 159, 716–726. [Google Scholar] [CrossRef]
  27. Rice, E.W.; Baird, R.B.; Eaton, A.D.; Clesceri, L.S. Standard Methods for the Examination of Water and Wastewater; American Public Health Association: Washington, DC, USA, 2012; Volume 10. [Google Scholar]
  28. Da Silva, G.H.R.; Daniel, L.A.; Contrera, R.C.; Bruning, H. Anaerobic effluent disinfected with ozone/hydrogen peroxide efluente anaeróbio desinfetado com ozônio/peróxido de hidrogênio. Cienc. Y Eng. Sci. Eng. J. 2012, 21, 1–7. [Google Scholar]
  29. Farooq, S.; Engelbrecht, R.S.; Chian, E.S. Influence of temperature and UV light on disinfection with ozone. Water Res. 1977, 11, 737–741. [Google Scholar] [CrossRef]
  30. Hassen, A.; Mahrouk, M.; Ouzari, H.; Cherif, M.; Boudabous, A.; Damelincourt, J.J. UV disinfection of treated wastewater in a large-scale pilot plant and inactivation of selected bacteria in a laboratory UV device. Bioresour. Technol. 2000, 74, 141–150. [Google Scholar] [CrossRef]
  31. Hébert, N.; Gagné, F.; Cejka, P.; Bouchard, B.; Hausler, R.; Cyr, D.; Blaise, C.; Fournier, M. Effects of ozone, ultraviolet and peracetic acid disinfection of a primary-treated municipal effluent on the immune system of rainbow trout (Oncorhynchus mykiss). Comp. Biochem. Physiol. Part C Toxicol. Pharmacol. 2008, 148, 122–127. [Google Scholar] [CrossRef]
  32. Macauley, J.J.; Qiang, Z.; Adams, C.D.; Surampalli, R.; Mormile, M.R. Disinfection of swine wastewater using chlorine, ultraviolet light and ozone. Water Res. 2006, 40, 2017–2026. [Google Scholar] [CrossRef]
  33. Rosal, R.; Rodríguez, A.; Perdigón-Melón, J.A.; Petre, A.; García-Calvo, E. Oxidation of dissolved organic matter in the effluent of a sewage treatment plant using ozone combined with hydrogen peroxide (O3/H2O2). Chem. Eng. J. 2009, 149, 311–318. [Google Scholar] [CrossRef]
Figure 1. The disinfecting system at the experimental scale.
Processes 10 02441 g001
Figure 2. The schematic view of the disinfecting system.
Processes 10 02441 g002
Figure 3. The appearance of the aeration wastewater before and after the treatment.
Processes 10 02441 g003
Figure 4. Comparison of COD percent change with electrical energy order over the 20 tests mentioned in Table 3.
Processes 10 02441 g004
Figure 5. The residual diagrams related to the final COD after the water treatment process. (a) Normal probability plot. (b) Versus Fits plot. (c) Histogram plot (d) Versus order plot.
Processes 10 02441 g005aProcesses 10 02441 g005b
Figure 6. The contour plots showing the reduction of COD in the effluent after the AOP treatment, when (a) O3 and UV change (b) H2O2 and UV change (c) H2O2 and O3 change.
Processes 10 02441 g006aProcesses 10 02441 g006b
Figure 7. 3D plots of response surface graphs for the combined effect of H2O2, O3, and UV on COD removal. (a) H2O2 (X3) = −1, (b) H2O2 (X3) = 0, and (c) H2O2 (X3) = 1.
Processes 10 02441 g007
Table 1. The real values associated with each coded value in Minitab software 16.
The Coded ValueThe Dose of UV (mWs/cm2)The Concentration of O3 (mg/L)The Concentration of H2O2 (mg/L)
+24008120
+13106.595
0220570
−11303.545
−240220
Δ ζ 901.525
Table 2. The tests plan recommended by Minitab 16.
The Test NumberThe Parameters’ Coded Values
X1X2X3
1−1−1−1
21−1−1
3−11−1
411−1
5−1−11
61−11
7−111
8111
9−200
10200
110−20
12020
1300−2
14002
15000
16000
17000
18000
19000
20000
Table 3. Results of the 20 sets of tests.
The Parameters’ Real Values
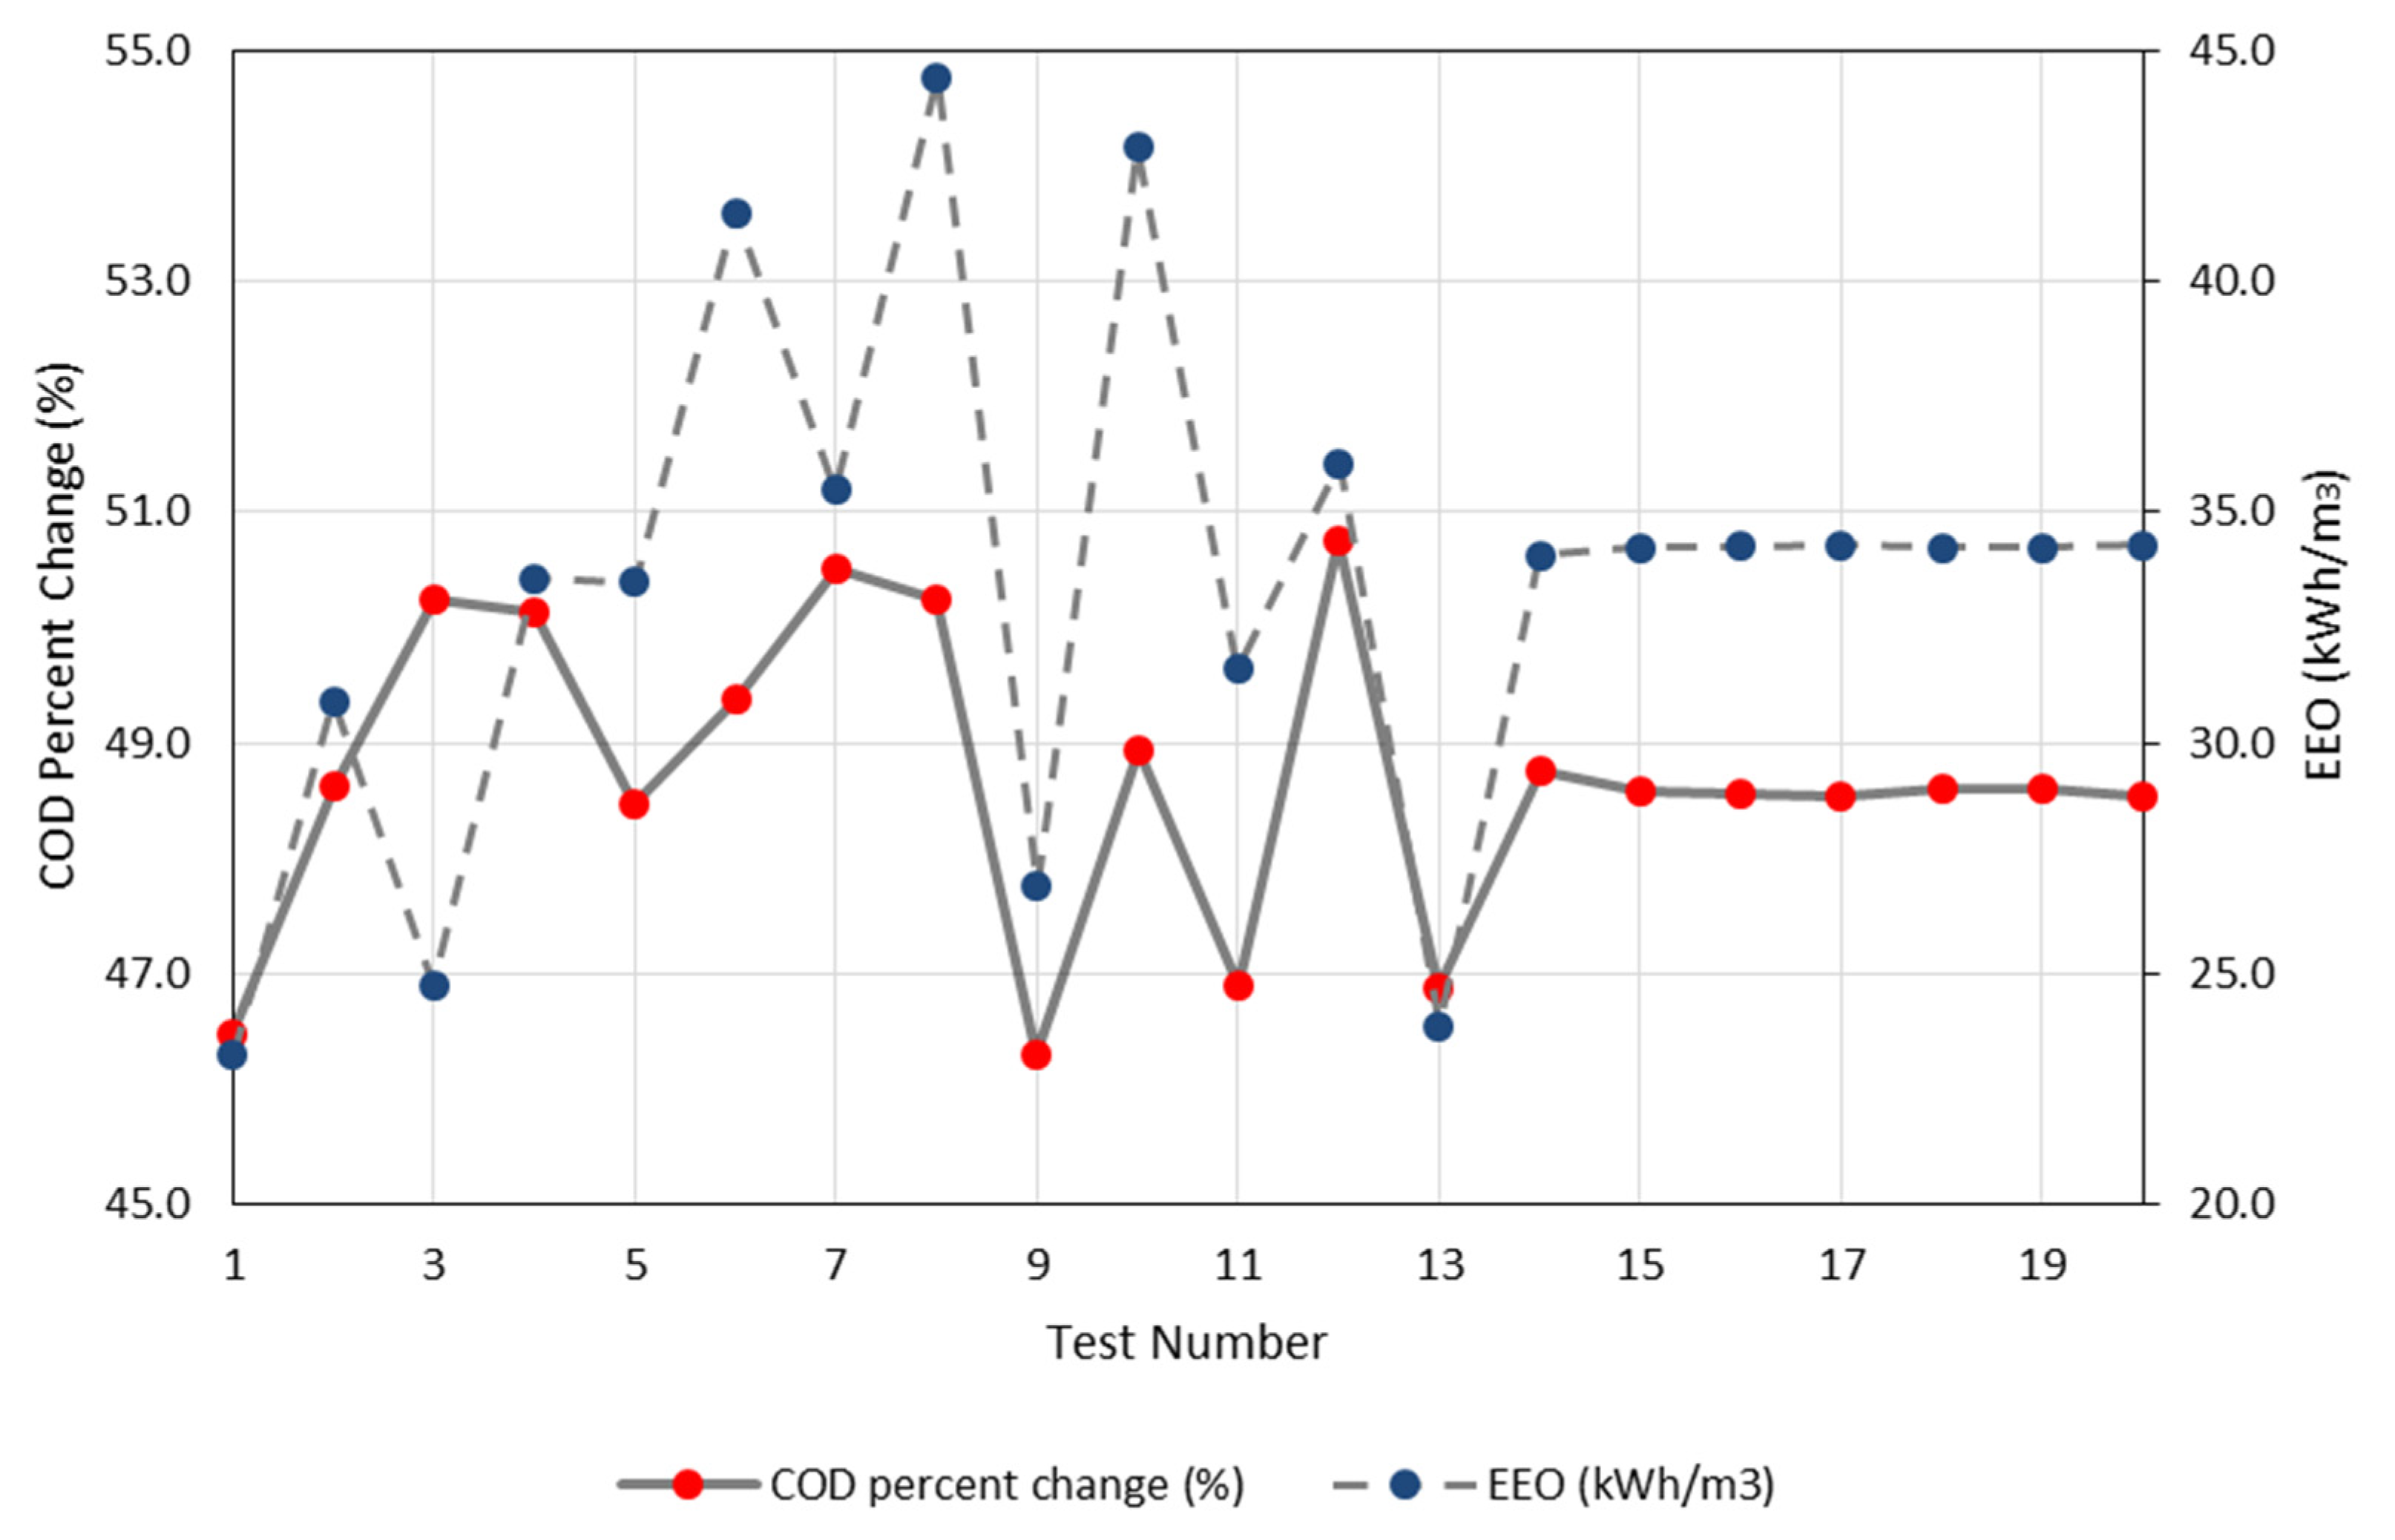
The Test NumberThe Dose of UV (mWs/cm2)The Concentration of O3 (mg/L)The Concentration of H2O2 (mg/L)COD after Treatment (mgO2/L)COD Percent Change (%)Energy Consumption (kWh/m3)
11303.545696046.523.2
23103.545668048.630.9
31306.545647050.224.8
43106.545648550.133.5
51303.595670048.533.5
63103.595658249.441.5
71306.595643550.535.5
83106.595647050.244.4
940570698546.326.9
10400570664048.942.9
11220270690546.931.6
12220870640550.736.1
13220520690846.923.9
14220570666548.734.1
15220570668748.634.2
16220570669048.634.3
17220570669248.534.3
18220570668548.634.2
19220570668548.634.2
20220570669248.534.3
Table 4. Second order regression coefficients for the input factors and response.
VariablesRegression Coefficientst-Valuep-Value
y-intercept6663172.8120.000
X3 = H2O2 (mg/L)−64.87−2.6840.023
X2 = O3 (mg/L)−128.87−5.3320.000
X1 = UV (mWs/cm2)−55.87−2.3120.043
X3 × X318.470.9580.361
X2 × X2−20.91−1.0850.304
X1 × X111.970.6210.549
X2 × X3560.6380.032
X1 × X322.750.6660.521
X2 × X138.51.1260.028
R2 = 0.83ADD = 0.00R2(ADJ) = 0.83
Table 5. The optimized values defined for AOP.
UV (mWs/cm2)O3 (mg/L)H2O2 (mg/L)COD (mgO2/L) after TreatmentCOD Percent Change (%)Energy Consumption (kWh/m3)
86840631351.522.7
Publisher’s Note: MDPI stays neutral with regard to jurisdictional claims in published maps and institutional affiliations.

