
A Modified Multiparameter Linear Programming Method for Efficient Power System Reliability Assessment
Abstract
:1. Introduction
2. System State Generation Method Considering Transmission Line Importance
2.1. Transmission Line Status Importance Index
- (1)
- Traditional importance index of transmission lines
- (2)
- Importance index of transmission lines considering the fault probability
2.2. Calculation of Transmission Line Status Importance Index
2.3. Generating Critical Transmission Line State Set
3. System State Analysis Method Based on MPLP
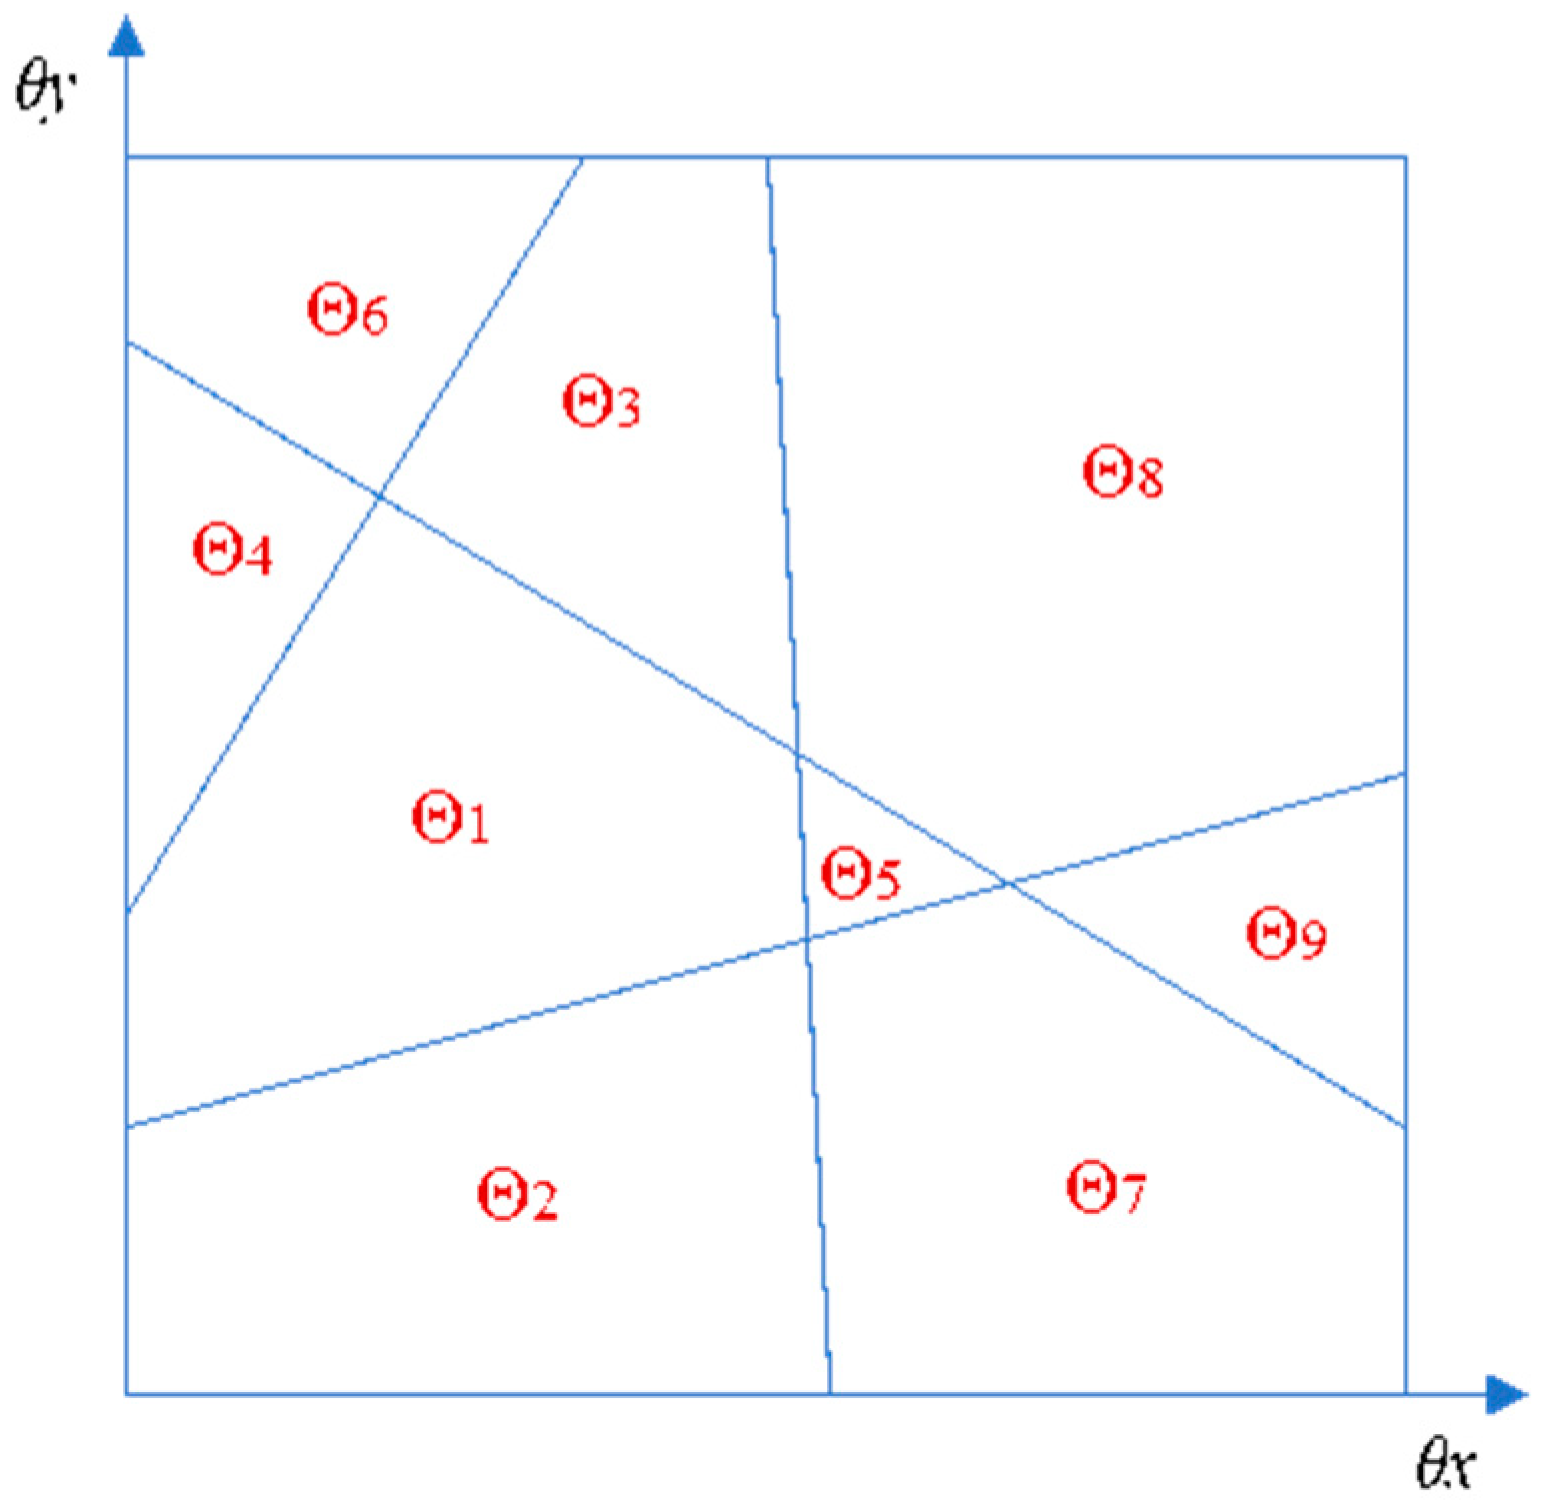
3.1. Basic Principles of Multiparameter Linear Programming
3.2. OPF Model Reconstruction Based on Modified MPLP
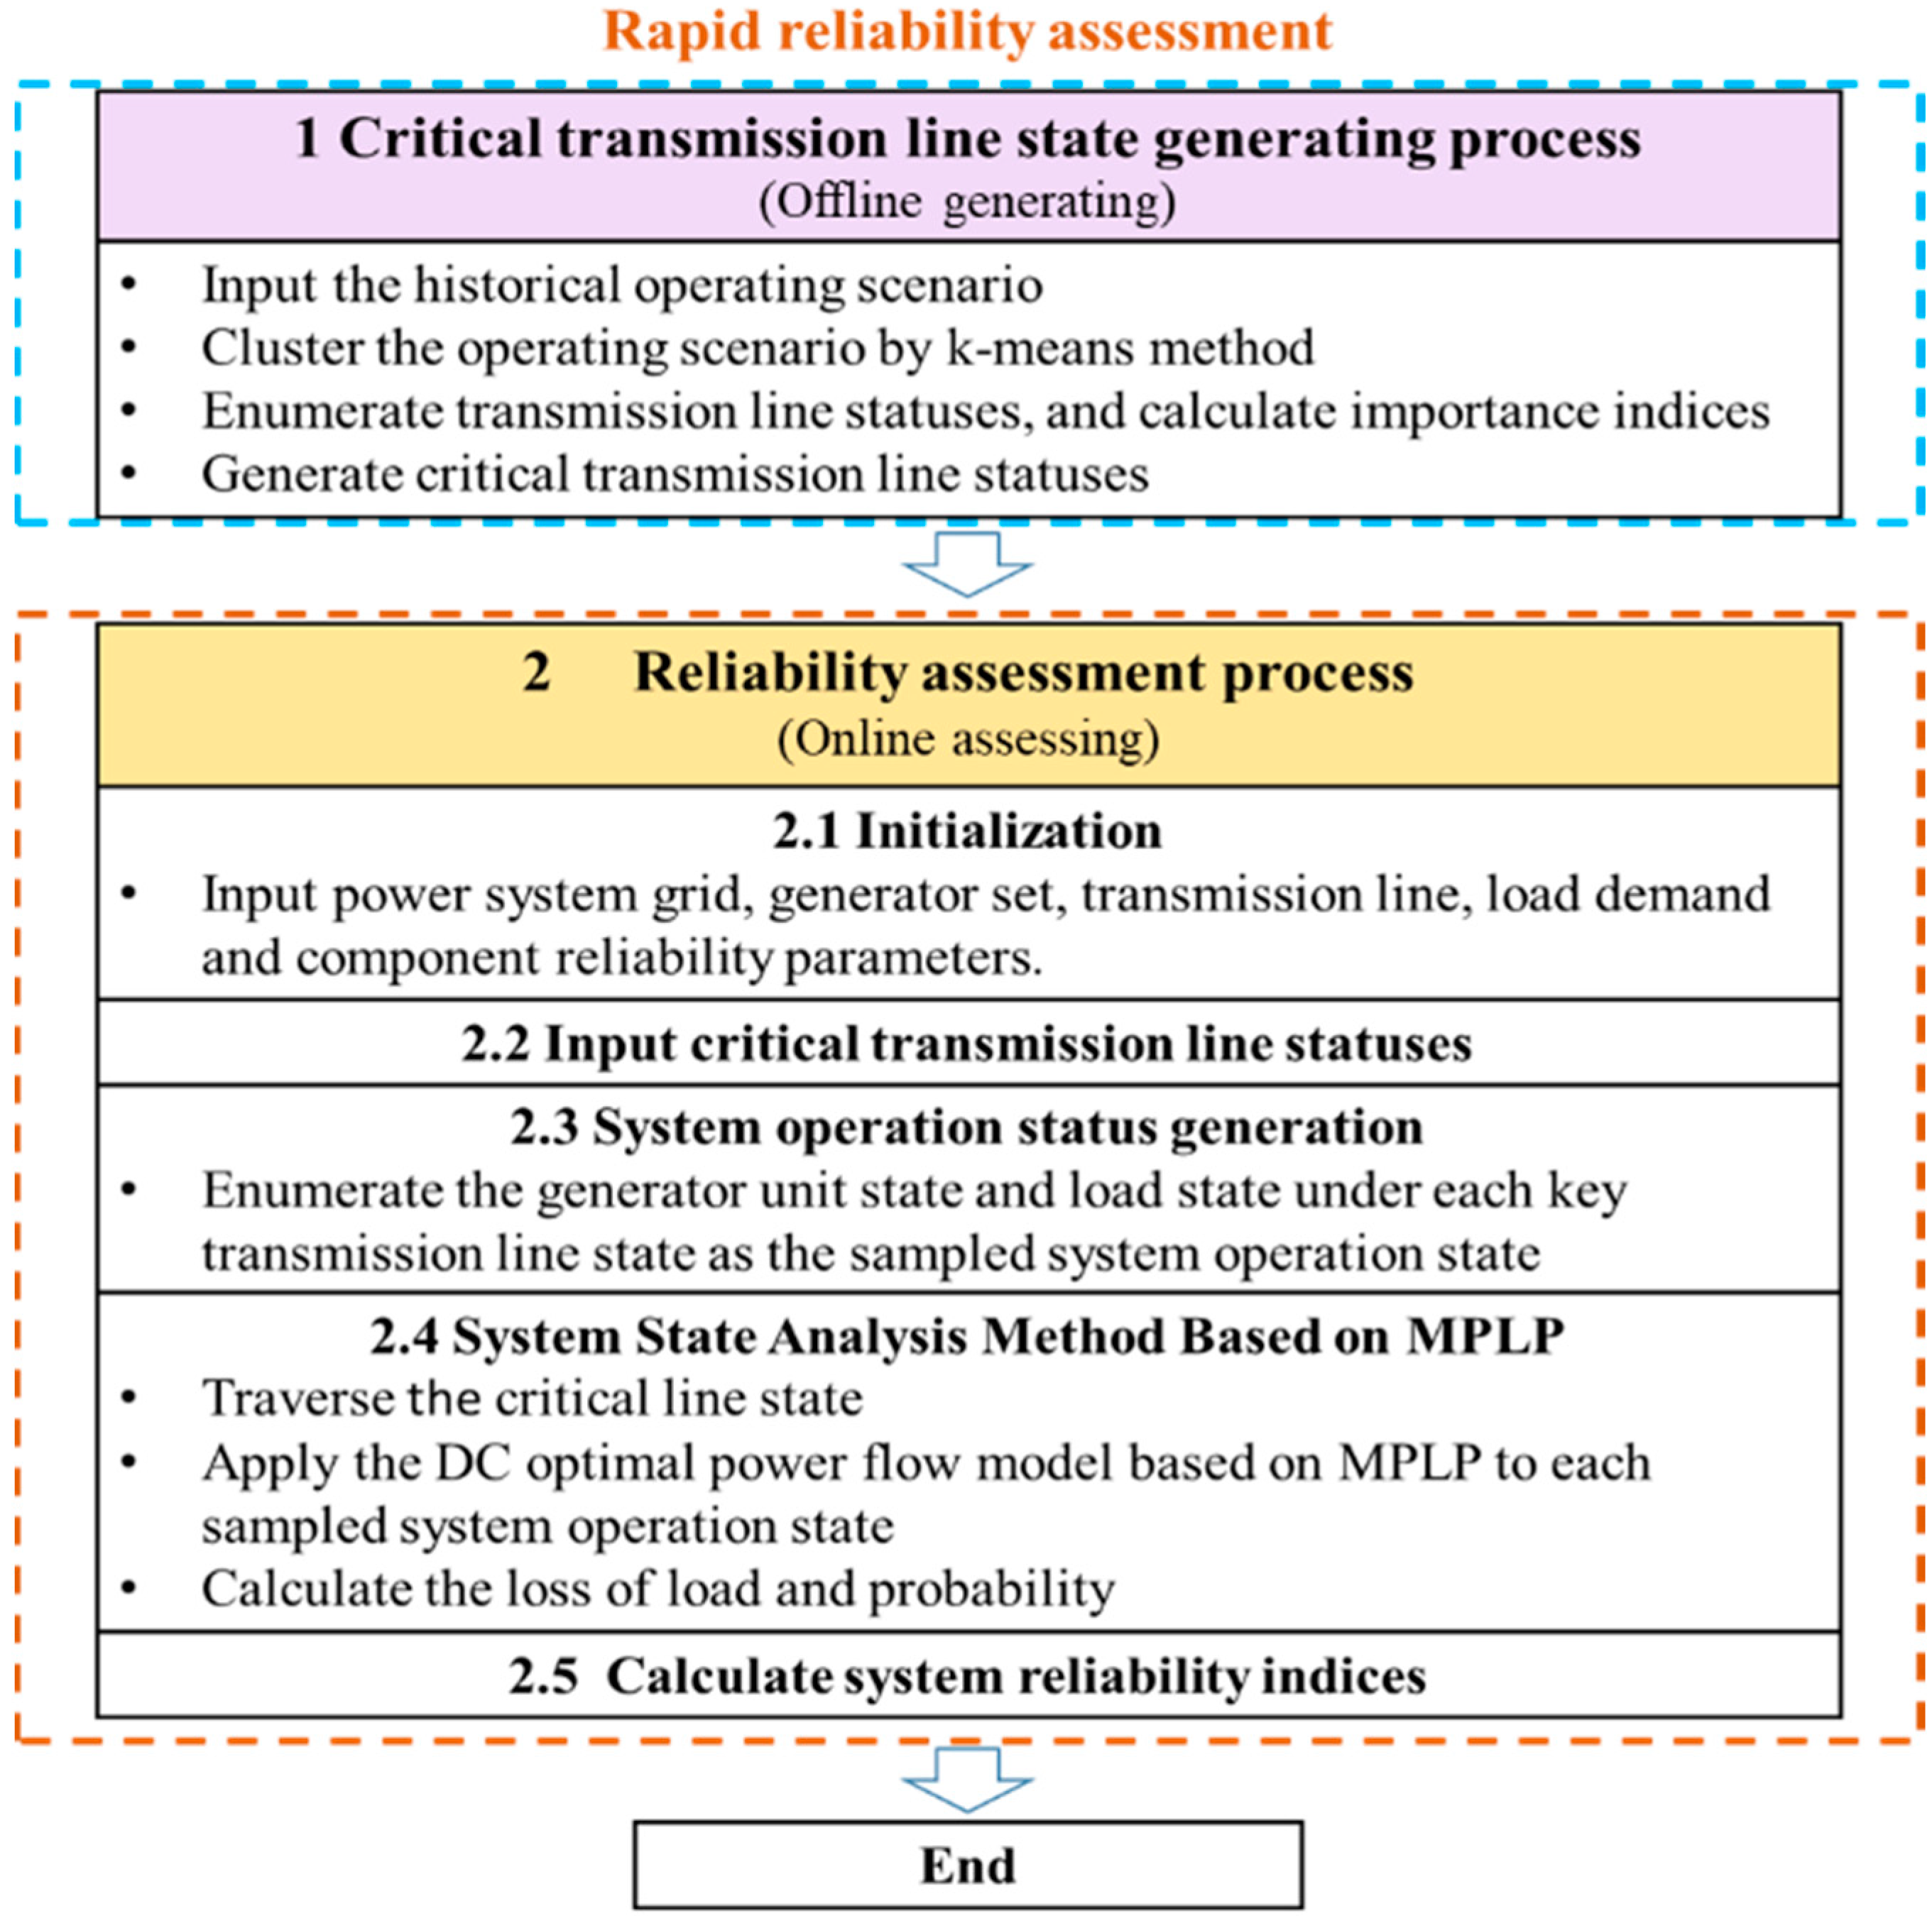
4. Efficient Reliability Assessment Method
5. Case Study
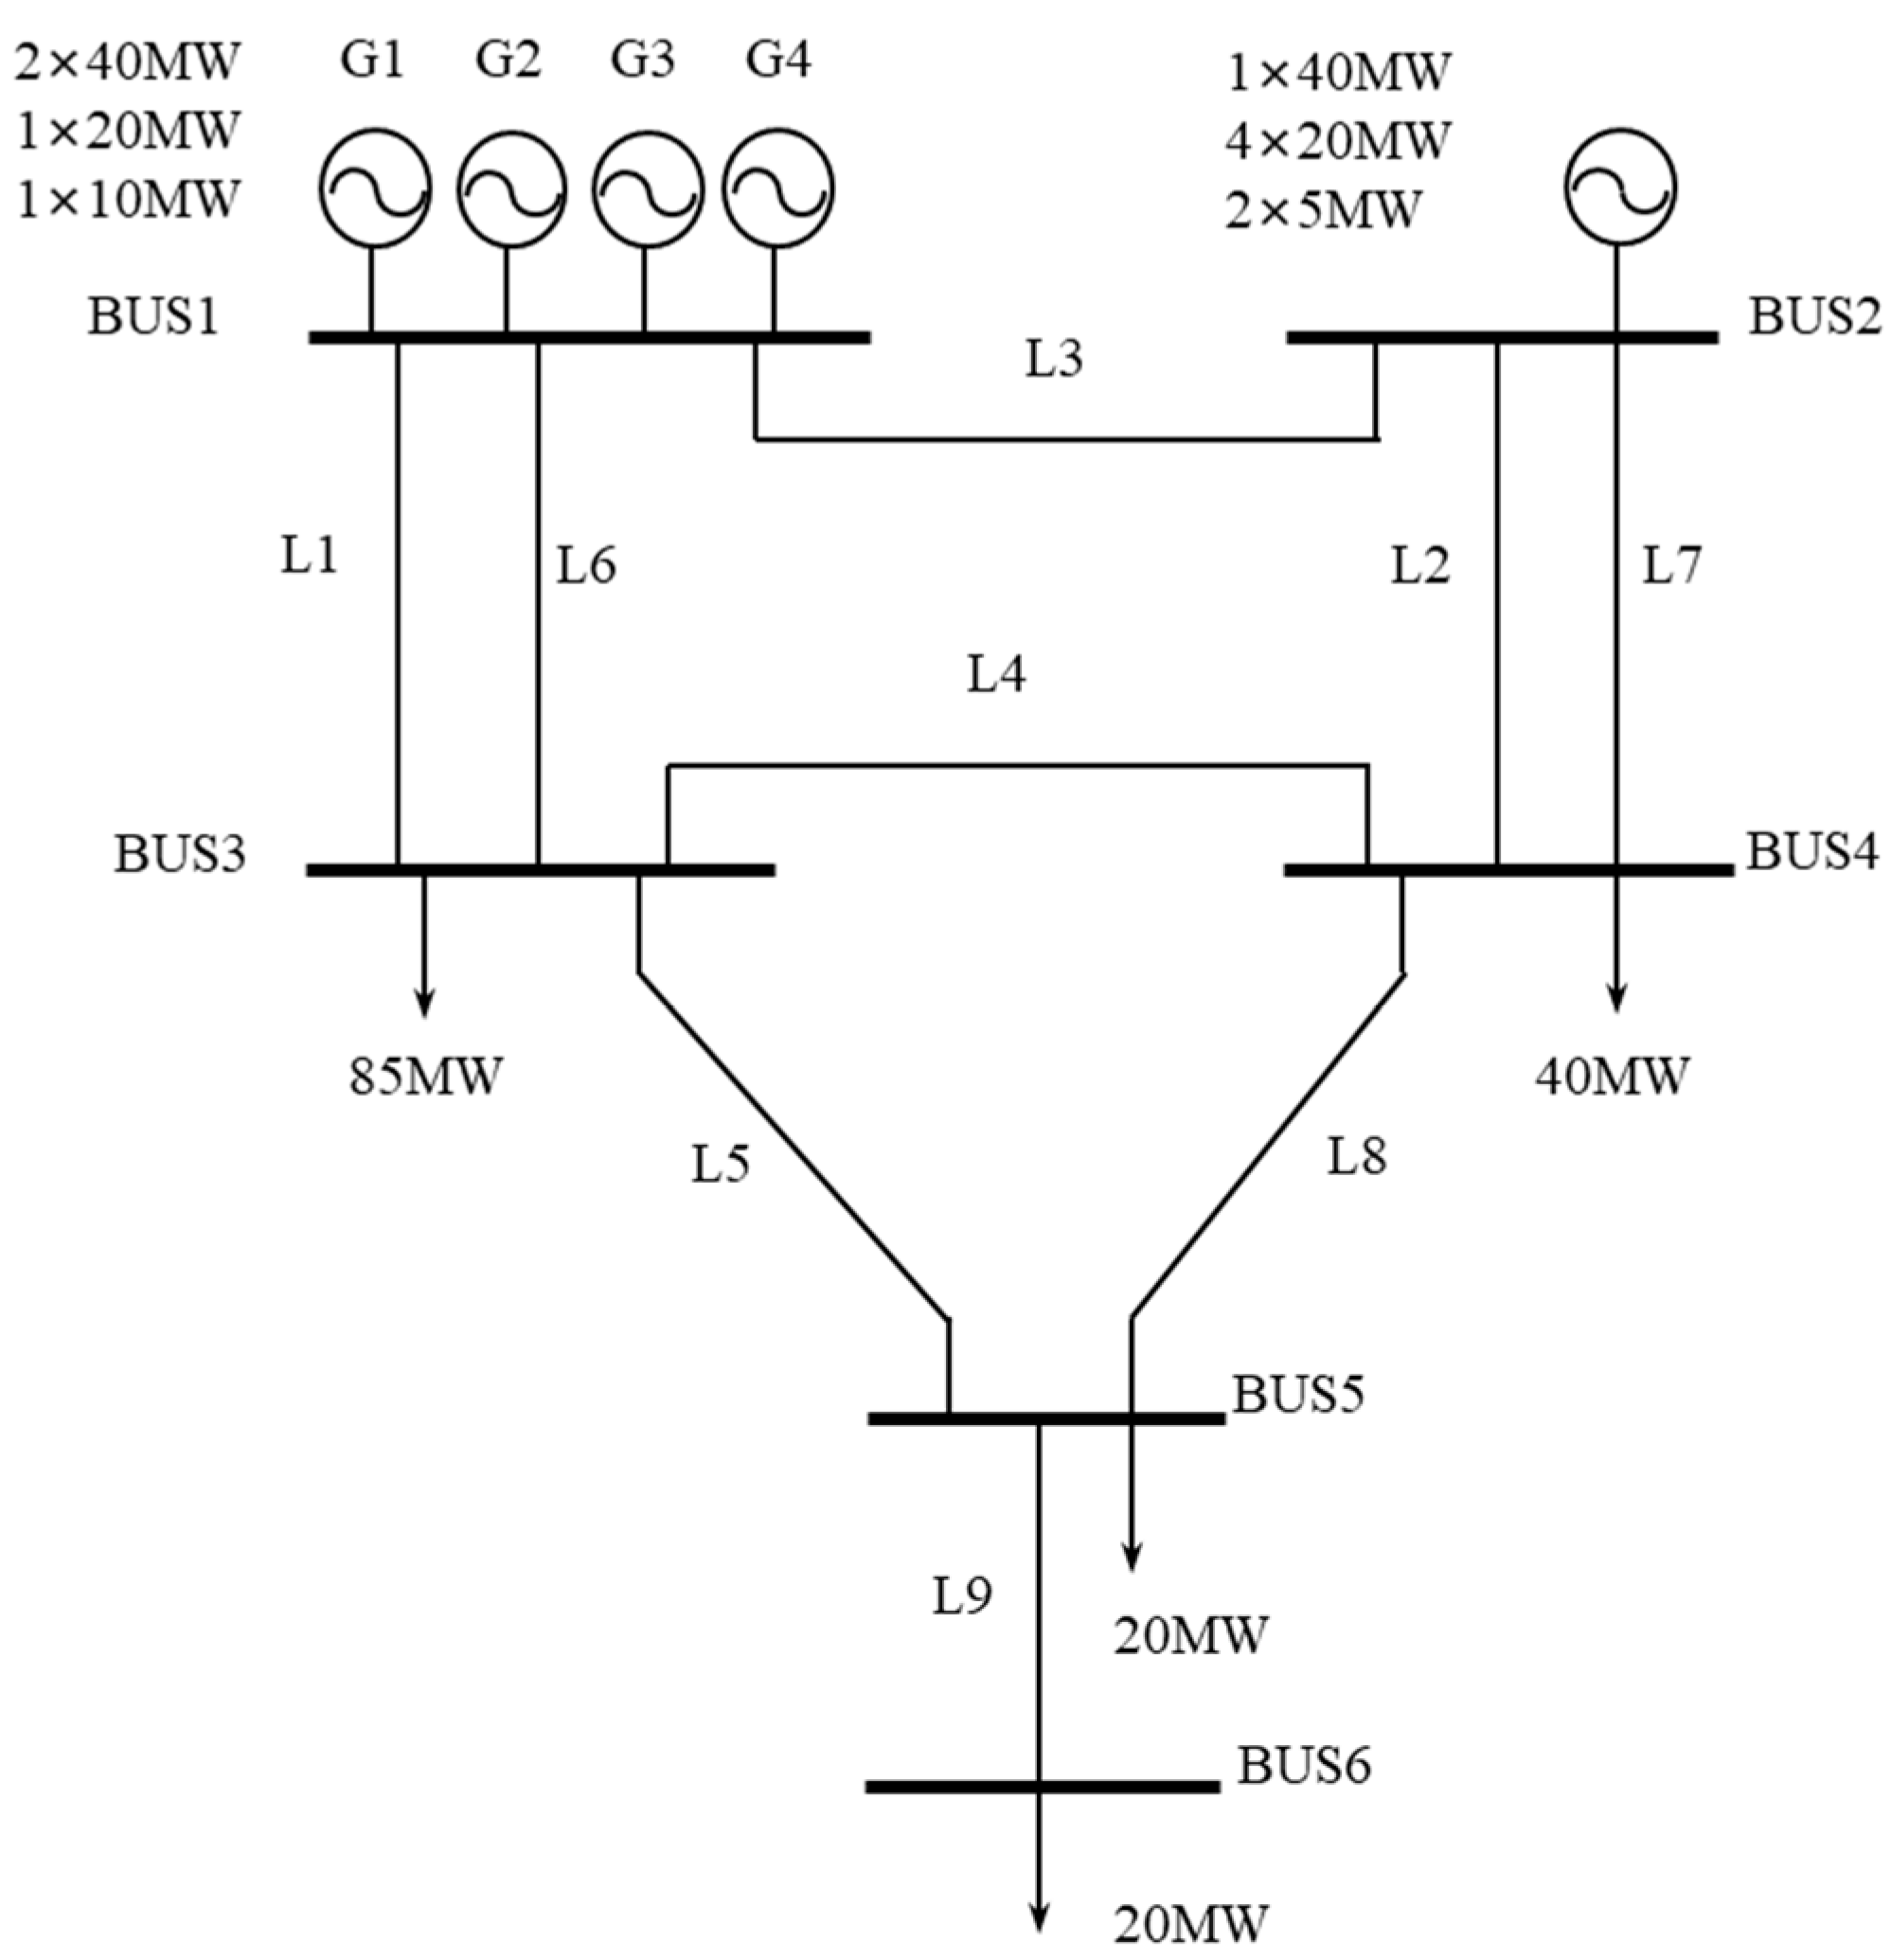
5.1. Case I: RBTS
5.2. Case ΙΙ: IEEE-RTS 79 System
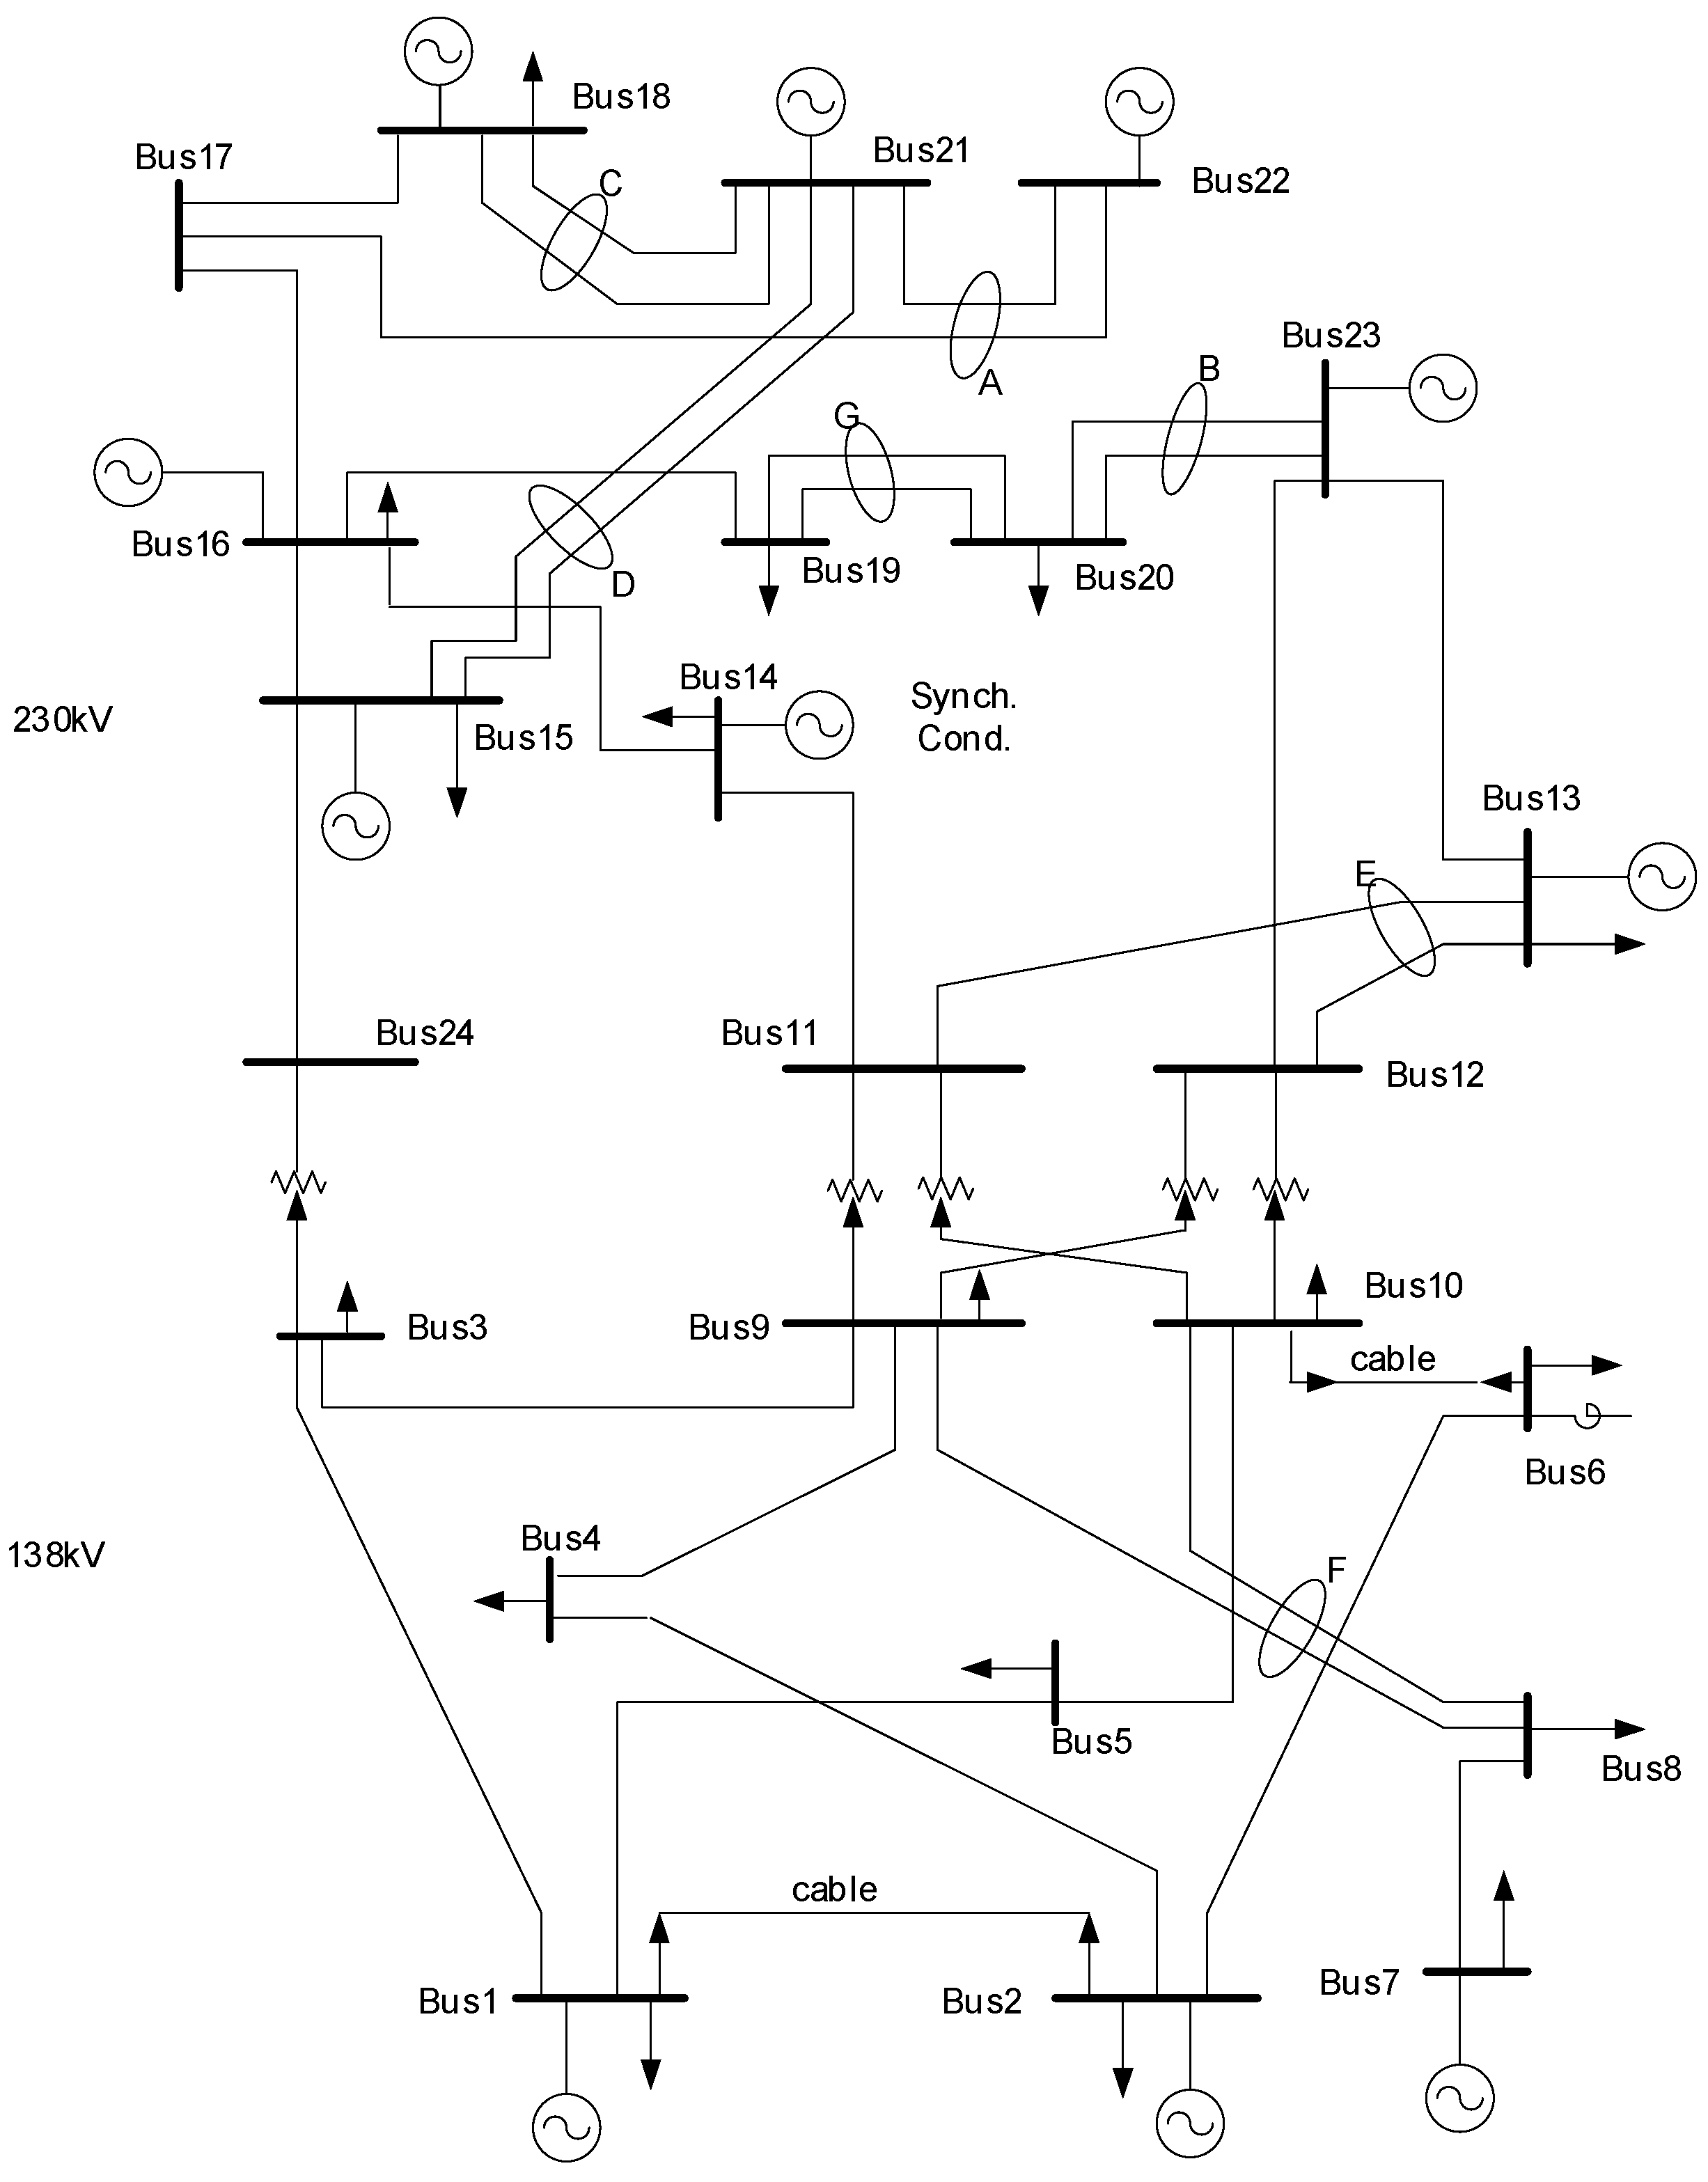
5.3. Case ΙΙΙ: IEEE-RTS 96 System
5.4. Case ΙV: Scalability Test
6. Conclusions
Author Contributions
Funding
Data Availability Statement
Acknowledgments
Conflicts of Interest
Nomenclature
| OPF | Optimal power flow |
| MPLP | Multiparameter linear programming |
| RBTS | Roy Billinton test system |
| LOLP | Loss of load probability |
| EENS | Expected energy not supplied |
| Itra | Traditional importance index of transmission lines |
| Ipro | Fault probability importance index of transmission lines |
| Fi | Actual active power flow of line i |
| Fimax | Upper limit of the active power capacity of line i |
| wi | Weighting factor of line i |
| Nl | Number of transmission lines in the system |
| Nd | Number of fault transmission lines in the system |
| m | Integer index of Itra |
| Pc | Probability of failure of the Nd transmission line |
| Ui | Forced outage rate of the transmission lines with failures |
| Uj | Forced outage rate of the transmission lines without failures |
| Mij | Initial clustering center |
| NL | Number of clusters |
| Dki | Euclidean distance from the kth point to the ith cluster center |
| Gkj | Value of the kth point on curve j |
| Nc | Number of curves |
| Ni | Number of points in the ith cluster |
| Lki | Value of the kth point in the ith cluster on curve j |
| Pl | Probability of the lth operating scenario |
| Nc | Number of points clustered in the lth operating scenario |
| N | Total number of points on the curve |
| R | Comprehensive importance index of the system state |
| Il | Importance index of operation scenario l |
| NS | Number of system operation scenarios selected after clustering |
| z | Objective function |
| x | Decision variable |
| c | Constant coefficient |
| θ | Parameter vector |
| Θ | Critical region |
| Φ | Critical region set |
| Dd | Bus cutting load |
| P | Net active power injected into the bus |
| F | Active power of each branch |
| G | Substitution distribution factor matrix |
| C | Generator-bus connection matrix |
| D | Load demand of each bus |
| Pg | Output power of the generators |
| Pgmax | Rated power of the generators |
| Fmin | Lower limits of the active power flow on each transmission line |
| Fmax | Upper limits of the active power flow on each transmission line |
| Sg | Generator state vector |
References
- Lin, C.; Hu, B. Event-triggered load frequency control based on age-of-information. IEEE Trans. Power Syst. 2022, 1–13. [Google Scholar] [CrossRef]
- Širá, E.; Kotulič, R.; Kravčáková Vozárová, I.; Daňová, M. Sustainable development in EU countries in the framework of the europe 2020 strategy. Processes 2021, 9, 443. [Google Scholar] [CrossRef]
- Yang, L.; Huang, W.; Guo, C.; Zhang, D.; Xiang, C.; Yang, L.; Wang, Q. Multi-objective optimal scheduling for multi-renewable energy power system considering flexibility constraints. Processes 2022, 10, 1401. [Google Scholar] [CrossRef]
- Zhironkin, S.; Rybár, R. Sustainable development processes for renewable energy technology. Processes 2022, 10, 1363. [Google Scholar] [CrossRef]
- Naik, J.; Bisoi, R.; Dash, P. Prediction interval forecasting of wind speed and wind power using modes decomposition based low rank multi-kernel ridge regression. Renew. Energy 2018, 129, 357–383. [Google Scholar] [CrossRef]
- Ericsson, G.N. Information security for electric power utilities (EPUs)—CIGRE developments on frameworks, risk assessment, and technology. IEEE Trans. Power Delivery 2009, 24, 1174–1181. [Google Scholar] [CrossRef]
- Aghaei, J.; Barani, M.; Shafie-Khah, M.; De La Nieta, A.A.S.; Catalão, J.P. Risk-constrained offering strategy for aggregated hybrid power plant including wind power producer and demand response provider. IEEE Trans. Sustain. Energy 2015, 7, 513–525. [Google Scholar] [CrossRef]
- Prajapati, V.K.; Mahajan, V. Reliability assessment and congestion management of power system with energy storage system and uncertain renewable resources. Energy 2021, 215, 119134. [Google Scholar] [CrossRef]
- Liu, H.; Sun, Y.; Wang, P.; Cheng, L.; Goel, L. A novel state selection technique for power system reliability evaluation. Electr. Power Syst. Res. 2008, 78, 1019–1027. [Google Scholar] [CrossRef]
- Jia, Y.; Wang, P.; Han, X.; Tian, J.; Singh, C. A fast contingency screening technique for generation system reliability evaluation. IEEE Trans. Power Syst. 2013, 28, 4127–4133. [Google Scholar] [CrossRef]
- Thompson, D.R.; Green, R.O.; Keymeulen, D.; Lundeen, S.K.; Mouradi, Y.; Nunes, D.C.; Castaño, R.; Chien, S.A. Rapid spectral cloud screening onboard aircraft and spacecraft. IEEE Trans. Geosci. Remote Sens. 2014, 52, 6779–6792. [Google Scholar] [CrossRef]
- Dai, H.; Zhang, H.; Wang, W. A support vector density-based importance sampling for reliability assessment. Reliab. Eng. Syst. Saf. 2012, 106, 86–93. [Google Scholar] [CrossRef]
- Guo, Y.; Chen, Z.; Zhang, X.; Pan, E. Reliability modeling and maintenance optimization of manufacturing system based on stochastic flow network and markov process. J. Shanghai Jiaotong Univ. 2021, 55, 229. [Google Scholar]
- Schweitzer, E.O.; Whitehead, D.; Zweigle, G.; Ravikumar, K.G. Synchrophasor-based power system protection and control applications. In Proceedings of the 63rd Annual Conference for Protective Relay Engineers, College Station, TX, USA, 29 March–1 April 2010; pp. 1–10. [Google Scholar]
- He, J.; Sun, Y.; Kirschen, D.; Singh, C.; Cheng, L. State-space partitioning method for composite power system reliability assessment. IET Gener. Transm. Distrib. 2010, 4, 780–792. [Google Scholar] [CrossRef]
- Huang, W.; Du, E.; Capuder, T.; Zhang, X.; Zhang, N.; Strbac, G.; Kang, C. Reliability and vulnerability assessment of multi-energy systems: An energy hub based method. IEEE Trans. Power Syst. 2021, 36, 3948–3959. [Google Scholar] [CrossRef]
- Wang, Y.; Guo, C.; Wu, Q. A cross-entropy-based three-stage sequential importance sampling for composite power system short-term reliability evaluation. IEEE Trans. Power Syst. 2013, 28, 4254–4263. [Google Scholar] [CrossRef]
- Da Silva, A.M.L.; González-Fernández, R.A.; Flávio, S.A.; Manso, L.A. Composite reliability evaluation with renewable sources based on quasi-sequential monte carlo and cross entropy methods. In Proceedings of the 2014 International Conference on Probabilistic Methods Applied to Power Systems (PMAPS), Durham, UK, 7–10 July 2014; pp. 1–6. [Google Scholar]
- Bao, M.; Ding, Y.; Singh, C.; Shao, C. A multi-state model for reliability assessment of integrated gas and power systems utilizing universal generating function techniques. IEEE Trans. Smart Grid. 2019, 10, 6271–6283. [Google Scholar] [CrossRef]
- Song, G.; Chen, H.; Guo, B. A layered fault tree model for reliability evaluation of smart grids. Energies 2014, 7, 4835–4857. [Google Scholar] [CrossRef] [Green Version]
- Shu, Z.; Jirutitijaroen, P.; da Silva, A.M.L.; Singh, C. Accelerated state evaluation and latin hypercube sequential sampling for composite system reliability assessment. IEEE Trans. Power Syst. 2014, 29, 1692–1700. [Google Scholar] [CrossRef]
- Anghel, M.; Werley, K.A.; Motter, A.E. Stochastic model for power grid dynamics. In Proceedings of the 2007 40th Annual Hawaii International Conference on System Sciences (HICSS’07), Big Island, HI, USA, 3–6 January 2007; p. 113. [Google Scholar]
- Lin, C.; Hu, B.; Shao, C.; Li, W.; Li, C.; Xie, K. Delay-dependent optimal load frequency control for sampling systems with demand response. IEEE Trans. Power Syst. 2022, 37, 4310–4324. [Google Scholar] [CrossRef]
- Xu, Q.; Yang, Y.; Liu, Y.; Wang, X. An improved latin hypercube sampling method to enhance numerical stability considering the correlation of input variables. IEEE Access 2017, 5, 15197–15205. [Google Scholar] [CrossRef]
- Xu, C.; Yonggang, G.; Wenpeng, Z.; Cheng, T. Diagnosis method on the mechanical failure of high voltage circuit breakers based on factor analysis and SVM. Trans. China Electro Tech. Soc. 2005, 27, 26–32. [Google Scholar]
- Zhao, Y.; Kuang, J.; Xie, K.; Li, W.; Yu, J. Dimension reduction based non-parametric disaggregation for dependence modeling in composite system reliability evaluation. IEEE Trans. Power Syst. 2020, 36, 159–168. [Google Scholar] [CrossRef]
- Urgun, D.; Singh, C. A hybrid Monte Carlo simulation and multi label classification method for composite system reliability evaluation. IEEE Trans. Power Syst. 2018, 34, 908–917. [Google Scholar] [CrossRef]
- Lin, C.; Hu, B.; Shao, C.; Niu, T.; Cheng, Q.; Li, C.; Xie, K. An analysis of delay-constrained consensus-based optimal algorithms in virtual power plants. ISA Trans. 2015, 125, 189–197. [Google Scholar] [CrossRef]
- Sildir, H.; Sarrafi, S.; Aydin, E. Uncertainty Propagation Based MINLP approach for artificial neural network structure reduction. Processes 2022, 10, 1716. [Google Scholar] [CrossRef]
- Guo, J.; Han, M.; Zhan, G.; Liu, S. A Spatio-Temporal Deep Learning Network for the Short-Term Energy Consumption Prediction of Multiple Nodes in Manufacturing Systems. Processes 2022, 10, 476. [Google Scholar] [CrossRef]
- Liu, Z.; Hou, K.; Jia, H.; Zhao, J.; Wang, D.; Mu, Y.; Zhu, L. A Lagrange multiplier based state enumeration reliability assessment for power systems with multiple types of loads and renewable generations. IEEE Trans. Power Syst. 2020, 36, 3260–3270. [Google Scholar] [CrossRef]
- Lukashevich, A.; Maximov, Y. Power Grid Reliability Estimation via Adaptive Importance Sampling. IEEE Control Syst. Lett. 2021, 6, 1010–1015. [Google Scholar] [CrossRef]
- Zhu, T. A New Methodology of Analytical Formula Deduction and Sensitivity Analysis of EENS in Bulk Power System Reliability Assessment. In Proceedings of the 2006 IEEE PES Power Systems Conference and Exposition, Atlanta, GA, USA, 29 October–1 November 2006; pp. 825–831. [Google Scholar]
- Silva, P.R.D.; Aragão, M.E.; Trierweiler, J.O.; Trierweiler, L.F. MILP Formulation for Solving and Initializing MINLP Problems Applied to Retrofit and Synthesis of Hydrogen Networks. Processes 2022, 8, 1102. [Google Scholar] [CrossRef]
- Ji, Y.; Thomas, R.J.; Tong, L. Probabilistic forecasting of real-time LMP and network congestion. IEEE Trans. Power Syst. 2016, 32, 831–841. [Google Scholar] [CrossRef]
- Billinton, R.; Kumar, S.; Chowdhury, N.; Chu, K.; Debnath, K.; Goel, L.; Khan, E.; Kos, P.; Nourbakhsh, G.; Oteng-Adjei, J. A reliability test system for educational purposes-basic data. IEEE Trans. Power Syst. 1989, 4, 1238–1244. [Google Scholar] [CrossRef]
- Subcommittee, P.M. IEEE reliability test system. IEEE Trans. Power Appar. Syst. 1979, PAS-98, 2047–2054. [Google Scholar] [CrossRef]
- Grigg, C.; Wong, P.; Albrecht, P.; Allan, R.; Bhavaraju, M.; Billinton, R.; Chen, Q.; Fong, C.; Haddad, S.; Kuruganty, S. The IEEE reliability test system-1996. A report prepared by the reliability test system task force of the application of probability methods subcommittee. IEEE Trans. Power Syst. 1999, 14, 1010–1020. [Google Scholar] [CrossRef]


| Methods | Sample Number | LOLP | EENS (MWh/a) | Calculation Time (s) |
|---|---|---|---|---|
| Enumeration | 30,160 | 0.0104 | 1167.8 | 125.02 |
| Nonsequential Monte Carlo | 1,011,999 | 0.0098 | 1056.0 | 4194.82 |
| Conventional MPLP | 913,414 | 0.0107 | 1254.3 | 3578.45 |
| Proposed method | 5336 | 0.0103 | 1164.2 | 11.47 |
| Methods | Sample Number | LOLP | EENS (MWh/a) | Calculation Time/(s) |
|---|---|---|---|---|
| Enumeration | 392,518 | 0.0853 | 129,561 | 2355.11 |
| Nonsequential Monte Carlo | 108,222 | 0.0846 | 127,549 | 649.33 |
| Conventional MPLP | 127,612 | 0.0937 | 148,921 | 607.49 |
| Proposed method | 10,580 | 0.0852 | 128,590 | 25.81 |
| Methods | Sample Number | LOLP | EENS (MWh/a) | Calculation Time(h) |
|---|---|---|---|---|
| Enumeration | 35,949,211 | 0.0144 | 24,876 | 9374.42 |
| Nonsequential Monte Carlo | 709,173 | 0.0139 | 24,704 | 145.33 |
| Conventional MPLP | 849,610 | 0.0160 | 27,521 | 123.68 |
| Proposed method | 99,020 | 0.0142 | 24,848 | 3.67 |
| Methods | Sample Number | LOLP | EENS (MWh/a) | Calculation Time/(h) |
|---|---|---|---|---|
| Enumeration | 449,514 | 0.0017 | 93.73 | 26.85 |
| Nonsequential Monte Carlo | 93,928 | 0.0016 | 92.97 | 5.67 |
| Conventional MPLP | 101,756 | 0.0018 | 94.02 | 4.99 |
| Proposed method | 4420 | 0.0017 | 93.33 | 0.14 |
Publisher’s Note: MDPI stays neutral with regard to jurisdictional claims in published maps and institutional affiliations. |
© 2022 by the authors. Licensee MDPI, Basel, Switzerland. This article is an open access article distributed under the terms and conditions of the Creative Commons Attribution (CC BY) license (https://creativecommons.org/licenses/by/4.0/).
Share and Cite
Zuo, J.; Peng, S.; Yang, Y.; Li, Z.; Zuo, Z.; Yu, H.; Lin, Y. A Modified Multiparameter Linear Programming Method for Efficient Power System Reliability Assessment. Processes 2022, 10, 2188. https://doi.org/10.3390/pr10112188
Zuo J, Peng S, Yang Y, Li Z, Zuo Z, Yu H, Lin Y. A Modified Multiparameter Linear Programming Method for Efficient Power System Reliability Assessment. Processes. 2022; 10(11):2188. https://doi.org/10.3390/pr10112188
Chicago/Turabian StyleZuo, Jing, Sui Peng, Yan Yang, Zuohong Li, Zhengmin Zuo, Hao Yu, and Yong Lin. 2022. "A Modified Multiparameter Linear Programming Method for Efficient Power System Reliability Assessment" Processes 10, no. 11: 2188. https://doi.org/10.3390/pr10112188