
High-Temperature Pyrolysis for Elimination of Per- and Polyfluoroalkyl Substances (PFAS) from Biosolids
Abstract
: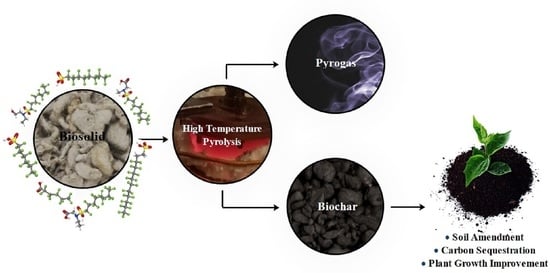
1. Introduction
2. Materials and Methods
2.1. Biosolids
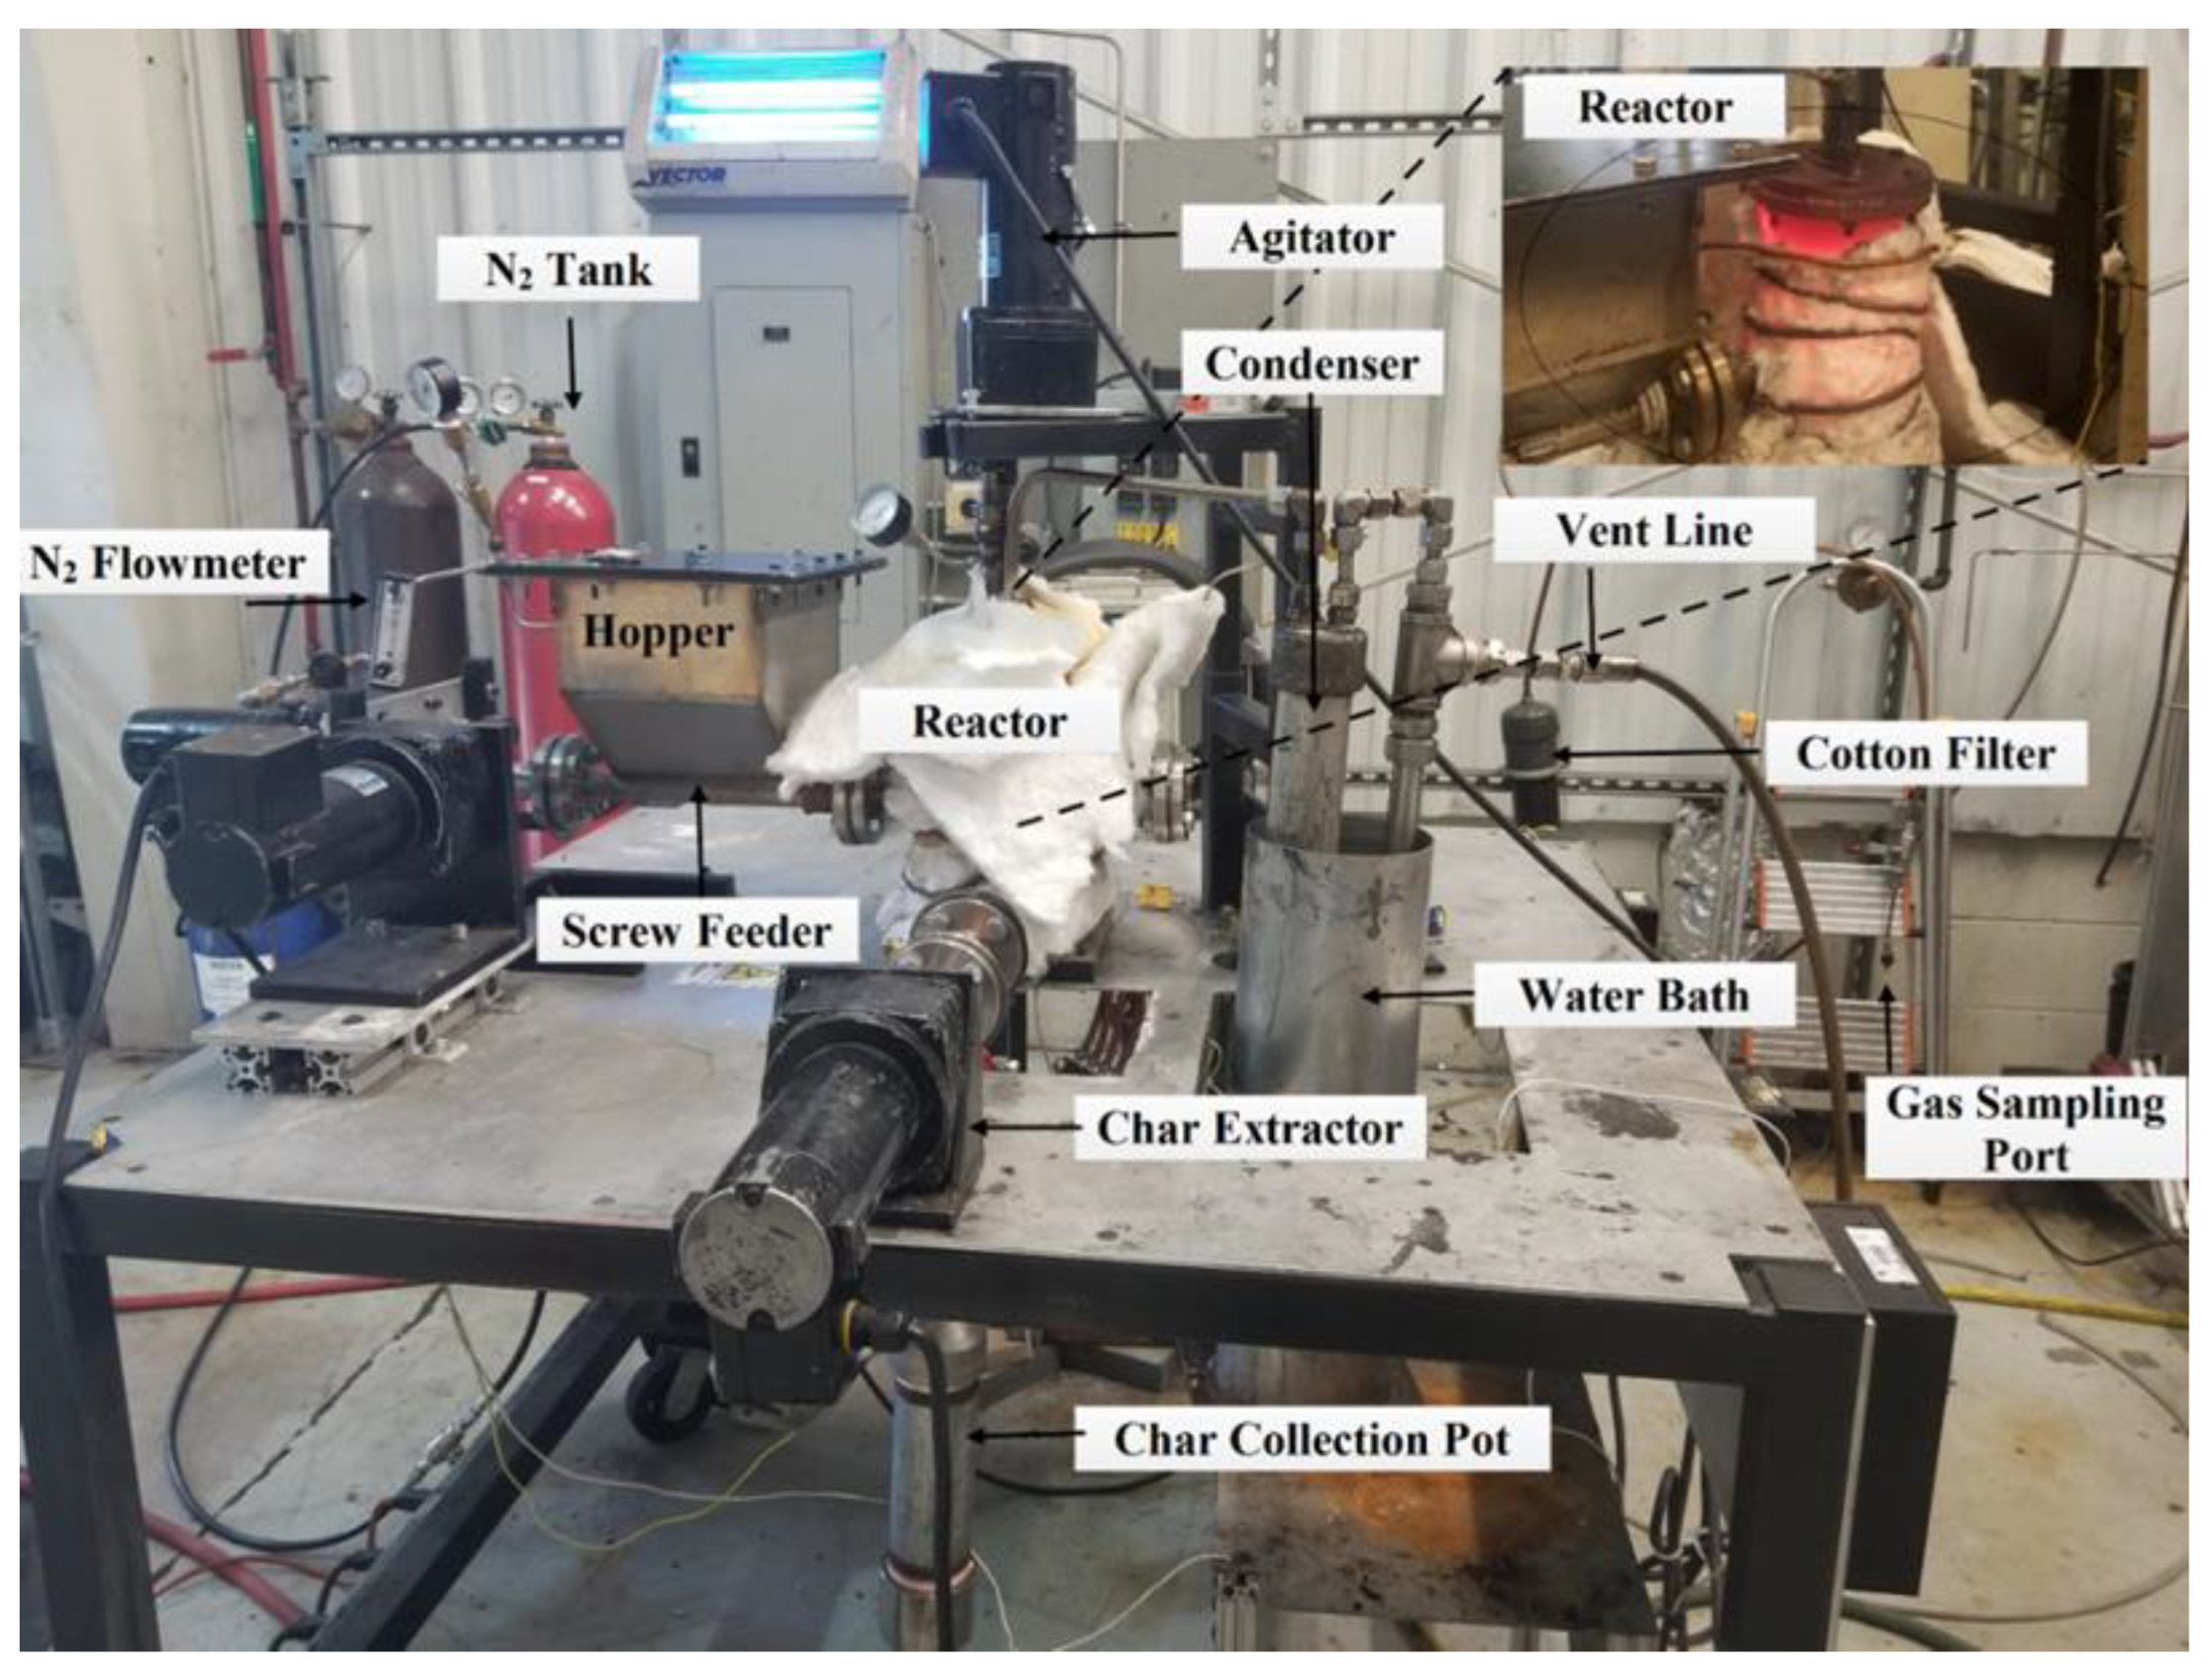
2.2. Pyrolysis Reactor
2.3. Biosolid and Biochar Sampling and Analysis
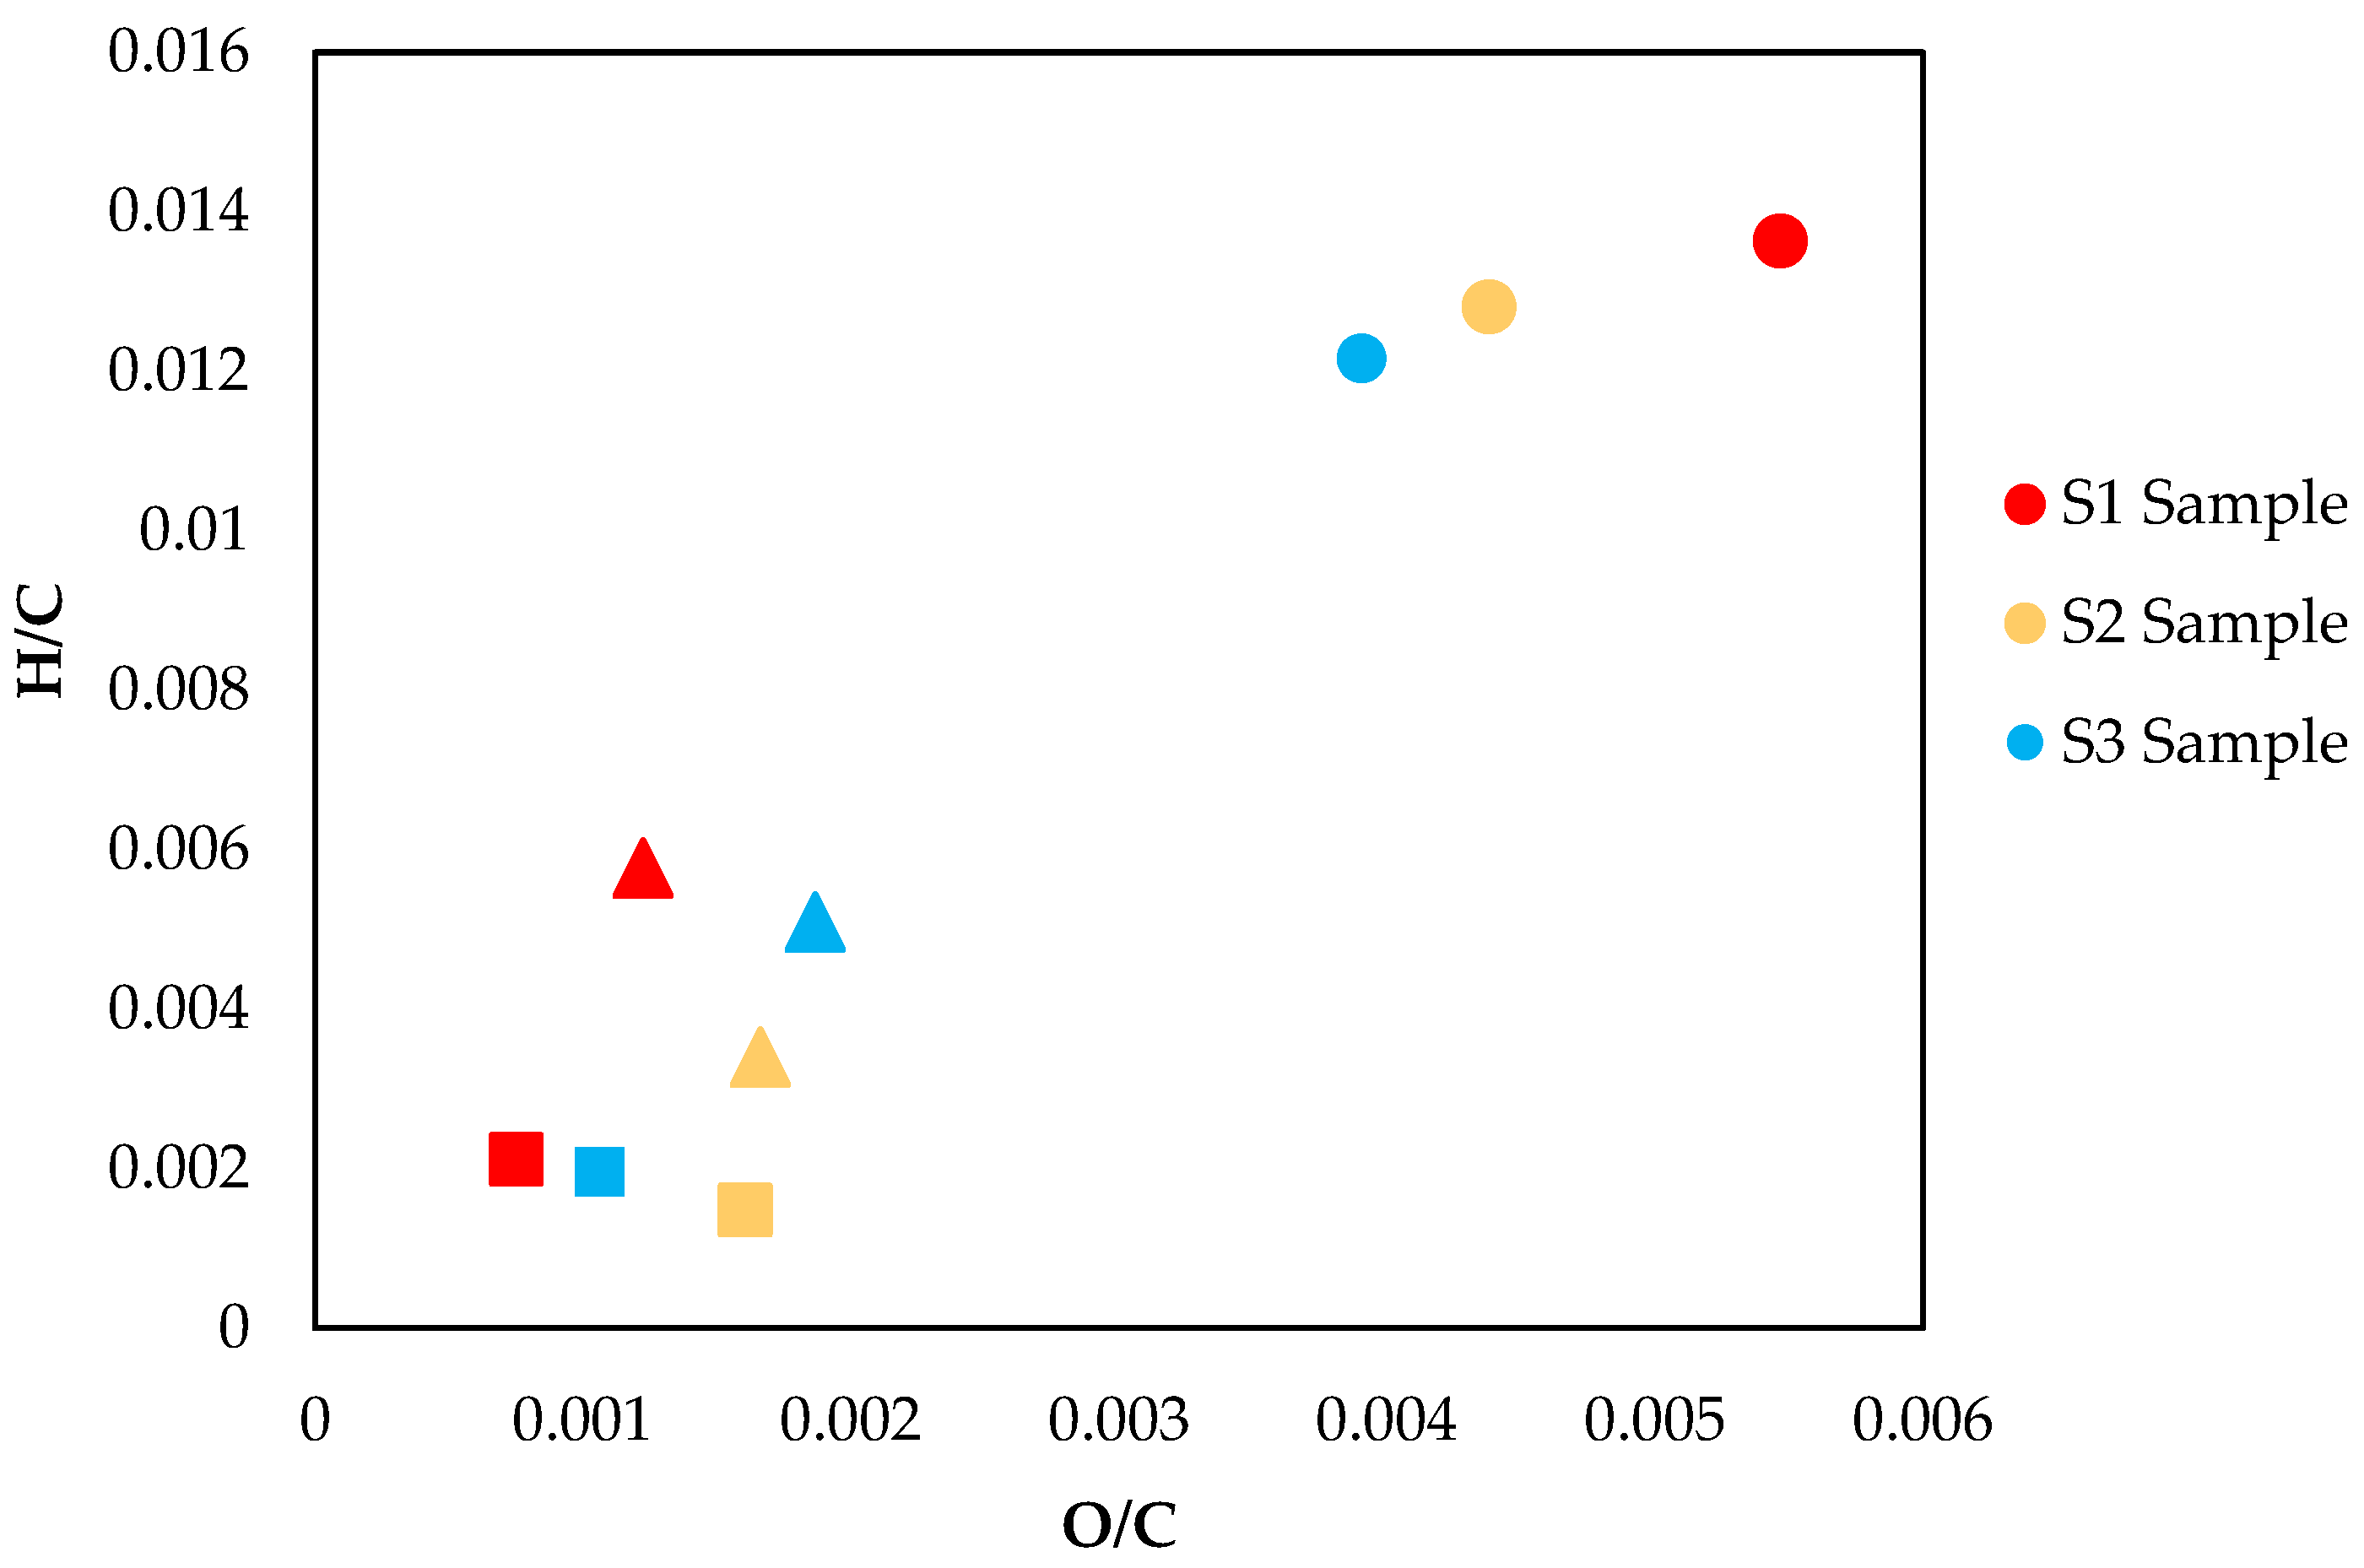
2.3.1. Ultimate Analyses
2.3.2. Calorific Value
2.3.3. Ash Characterization
2.3.4. Proximate Analysis
2.3.5. Material Balance
2.4. Gas Sampling and PFAS Analysis
2.5. Pyrolysis Gas Characterization
3. Results
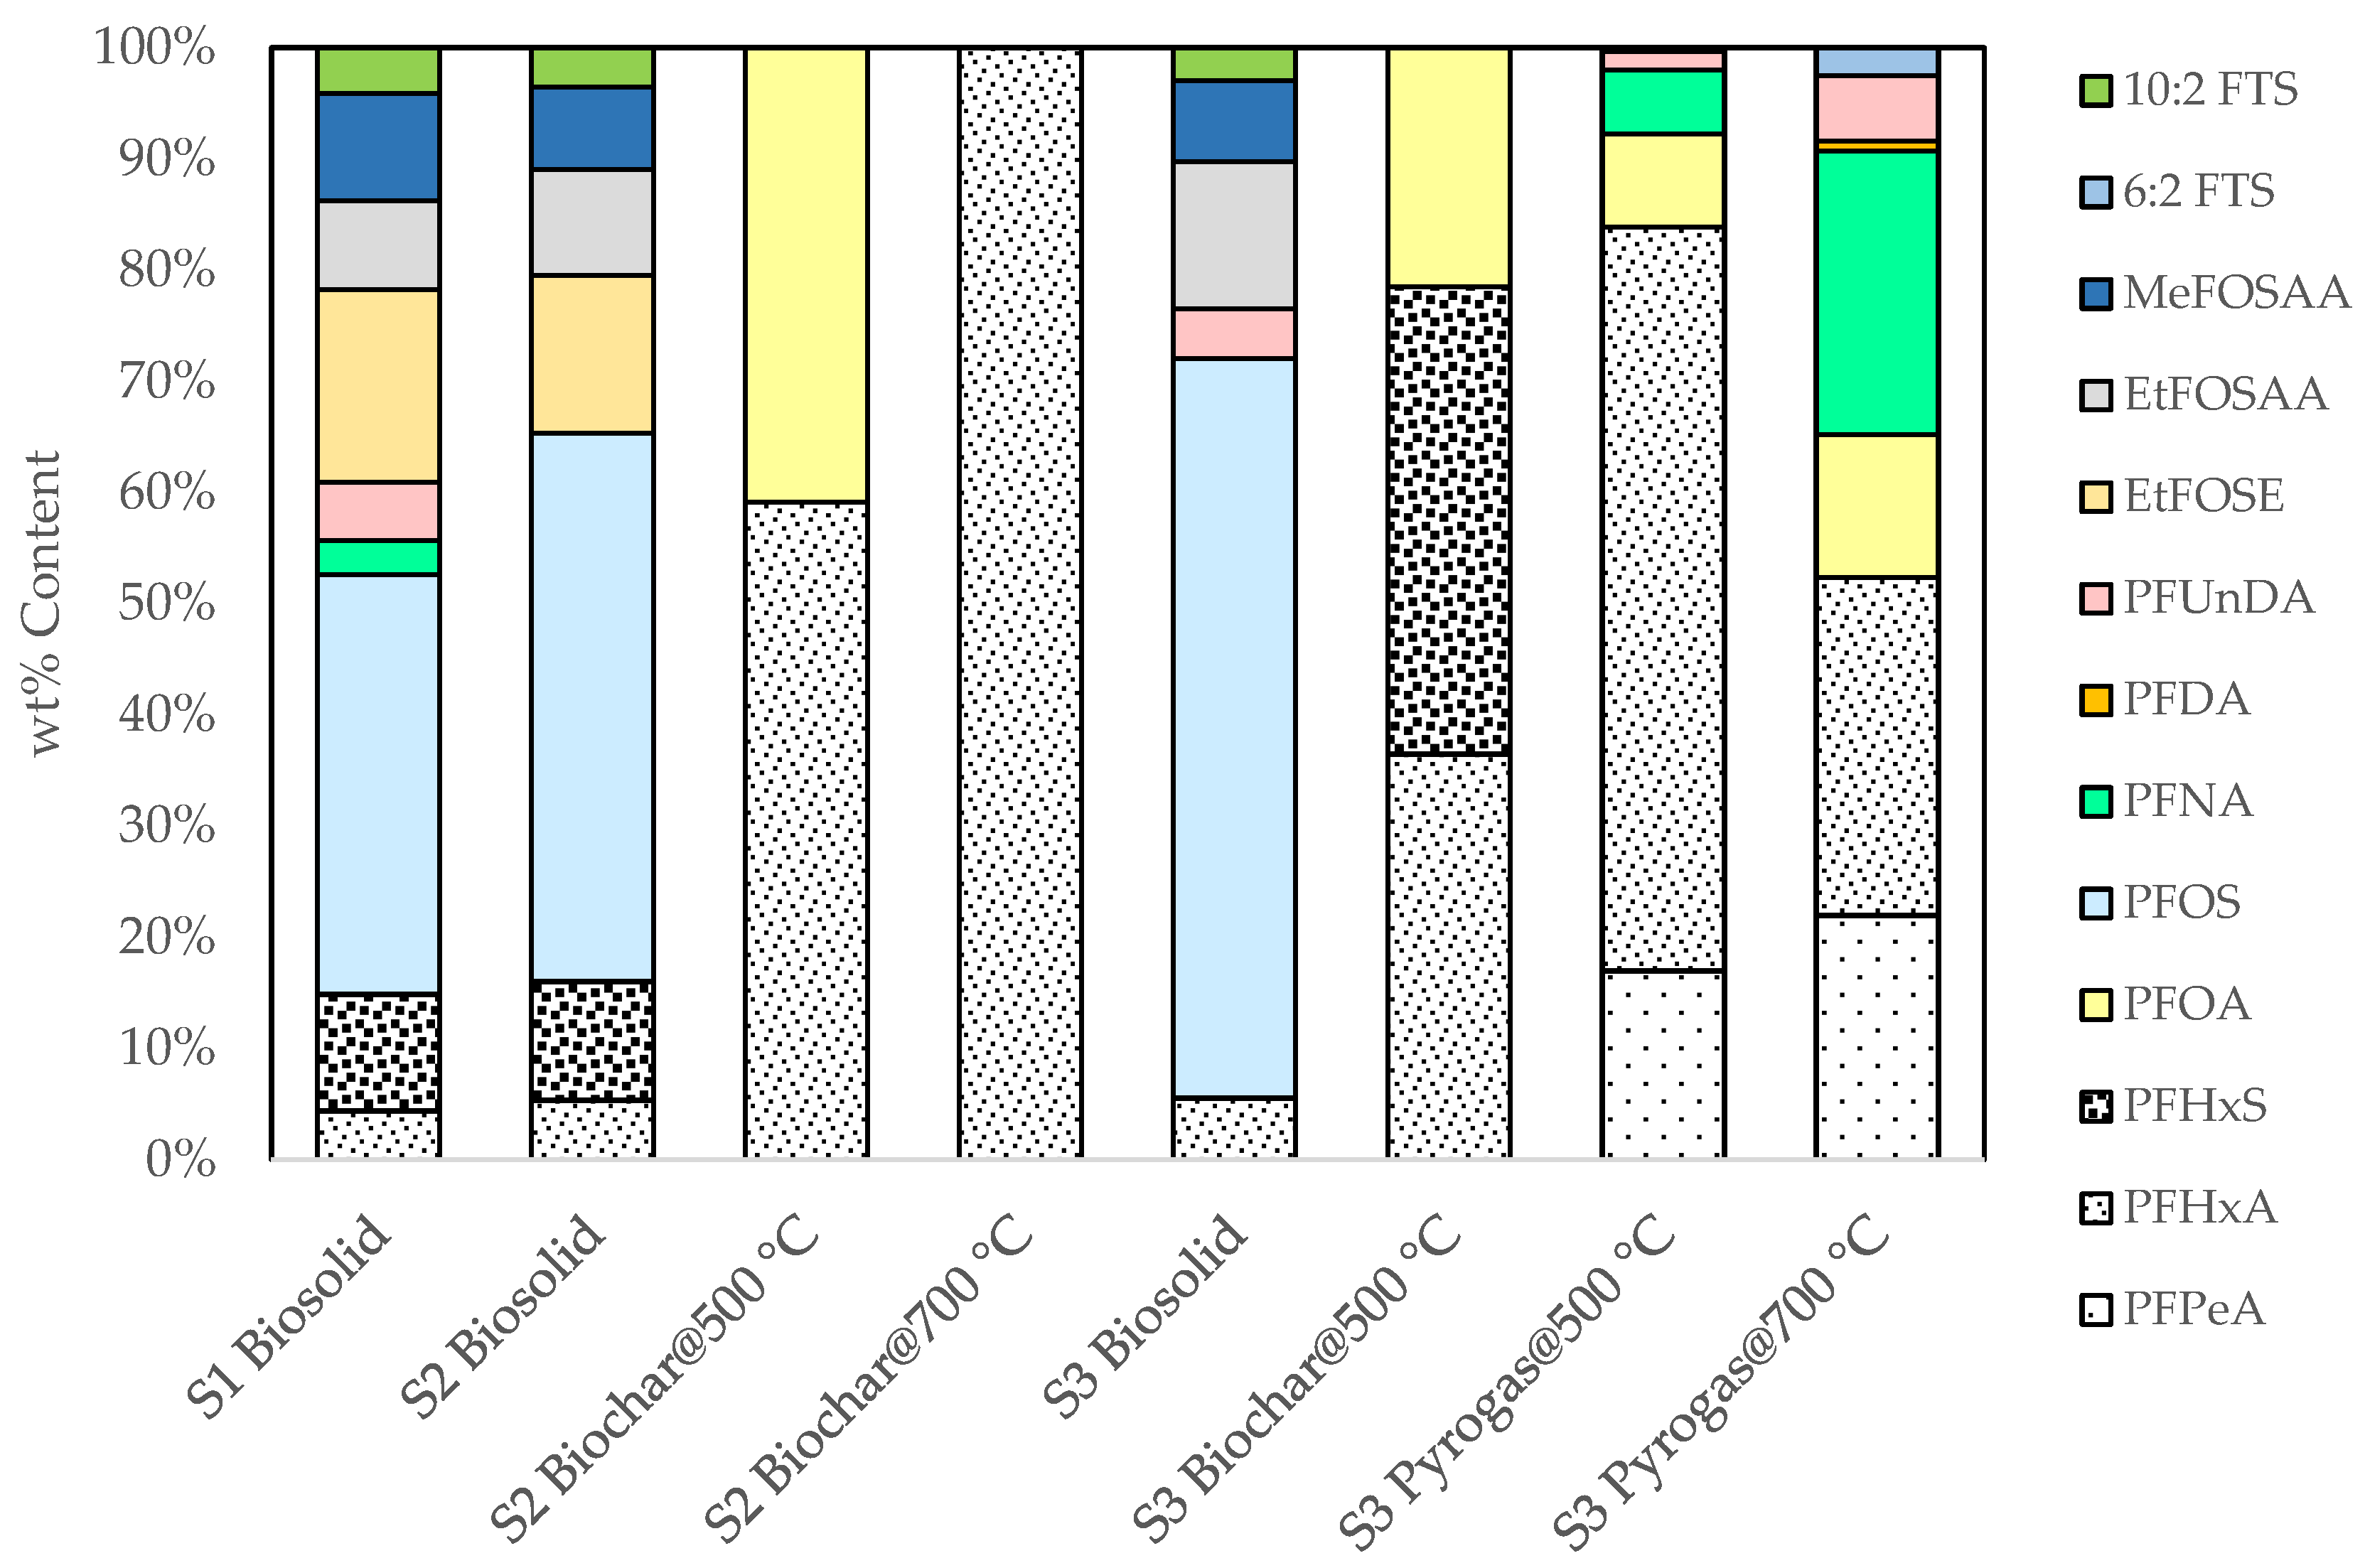
3.1. PFAS Analytical Results
Impact of Pyrolysis on PFAS Destruction
3.2. Material Balances
3.3. Solids Ash and Energy Analysis
- (a)
- Yield and ash concentration. As the total amount of solid product decreases during pyrolysis, the inert ash concentrates in the solid biochar. While the total mass of ash did not change, its concentration increased from 17.9 wt% in the S3 biosolids to 61.4 wt% in the biochar produced at 500 °C, and to 69.7 wt% in the biochar produced at 700 °C. From an energy point of view, ash is an inert constituent and, hence, drastically increasing its concentration will decrease the heating value [45].
- (b)
- Volatile matter reduction. As the pyrolysis reactor temperature increased, the volatile compounds are vaporized, resulting in less energy-rich volatile matter in the biocarbon, which, in turn, decreases that contribution toward its calorific value. This devolatilization is consistent with what is typically expected in pyrolysis processes [46]. The decrease in volatile matter in the solid fraction is a benefit from an overall pyrolysis system perspective, as the volatile matter is transferred to the pyrogas stream, based on the overall mass balance. Therefore, as the temperature increases, the energy balance increasingly favors the pyrogas stream, allowing for sufficient energy becoming available to allow the system to not only operate autothermally, exclusively from the energy produced by the pyrogas it generates, but also the opportunity for excess pyrogas being available for other energy uses.
4. Conclusions
Author Contributions
Funding
Informed Consent Statement
Data Availability Statement
Conflicts of Interest
References
- Hutchinson, S.; Rieck, T.; Wu, X. Advanced PFAS precursor digestion methods for biosolids. Environ. Chem. 2020, 17, 558. [Google Scholar] [CrossRef]
- Armstrong, D.L.; Lozano, N.; Rice, C.P.; Ramirez, M.; Torrents, A. Temporal trends of perfluoroalkyl substances in limed biosolids from a large municipal water resource recovery facility. J. Environ. Manag. 2016, 165, 88–95. [Google Scholar] [CrossRef] [PubMed]
- Chambers, B.J.; Nicholson, F.A.; Aitken, M.; Cartmell, E.; Rowlands, C. Benefits of biosolids to soil quality and fertility. Water Environ. J. 2003, 17, 162–167. [Google Scholar] [CrossRef]
- Letcher, R.J.; Chu, S.; Smyth, S.-A. Side-chain fluorinated polymer surfactants in biosolids from wastewater treatment plants. J. Hazard. Mater. 2020, 388, 122044. [Google Scholar] [CrossRef]
- Ebrahimi, F.; Lewis, A.J.; Sales, C.M.; Suri, R.; McKenzie, E.R. Linking PFAS partitioning behavior in sewage solids to the solid characteristics, solution chemistry, and treatment processes. Chemosphere 2021, 271, 129530. [Google Scholar] [CrossRef]
- Gallen, C.; Eaglesham, G.; Drage, D.; Nguyen, T.H.; Mueller, J. A mass estimate of perfluoroalkyl substance (PFAS) release from Australian wastewater treatment plants. Chemosphere 2018, 208, 975–983. [Google Scholar] [CrossRef]
- Venkatesan, A.K.; Halden, R.U. National inventory of perfluoroalkyl substances in archived U.S. biosolids from the 2001 EPA National Sewage Sludge Survey. J. Hazard. Mater. 2013, 252–253, 413–418. [Google Scholar] [CrossRef] [Green Version]
- Lee, H.; Tevlin, A.G.; Mabury, S.A. Fate of Polyfluoroalkyl Phosphate Diesters and Their Metabolites in Biosolids-Applied Soil: Biodegradation and Plant Uptake in Greenhouse and Field Experiments. Environ. Sci. Technol. 2013, 48, 340–349. [Google Scholar] [CrossRef] [PubMed]
- Schulz, K.; Silva, M.R.; Klaper, R. Distribution and effects of branched versus linear isomers of PFOA, PFOS, and PFHxS: A review of recent literature. Sci. Total Environ. 2020, 733, 139186. [Google Scholar] [CrossRef]
- Buck, R.C.; Franklin, J.; Berger, U.; Conder, J.M.; Cousins, I.T.; De Voogt, P.; Jensen, A.A.; Kannan, K.; Mabury, S.A.; Van Leeuwen, S.P. Perfluoroalkyl and polyfluoroalkyl substances in the environment: Terminology, classification, and origins. Integr. Environ. Assess. Manag. 2011, 7, 513–541. [Google Scholar] [CrossRef] [PubMed]
- OECD. Synthesis Paper on Per- and Polyfluorinated Chemicals (PFCs), Environment, Health and Safety, Environment Direc-Torate; OECD: Paris, France, 2013. [Google Scholar]
- Crone, B.C.; Speth, T.F.; Wahman, D.G.; Smith, S.J.; Abulikemu, G.; Kleiner, E.J.; Pressman, J.G. Occurrence of per- and polyfluoroalkyl substances (PFAS) in source water and their treatment in drinking water. Crit. Rev. Environ. Sci. Technol. 2019, 49, 2359–2396. [Google Scholar] [CrossRef]
- Rodowa, A.; Christie, E.; Sedlak, J.; Peaslee, G.; Bogdan, D.; DiGuiseppi, B.; Field, J.A. Field Sampling Materials Unlikely Source of Contamination for Perfluoroalkyl and Polyfluoroalkyl Substances in Field Samples. Environ. Sci. Technol. Lett. 2020, 7, 156–163. [Google Scholar] [CrossRef]
- Goldenman, G.; Fernandes, M.; Holland, M.; Tugran, T.; Nordin, A.; Schoumacher, C.; McNeill, A. The Cost of Inaction: A Socioec-Onomic Analysis of Environmental and Health Impacts Linked to Exposure to PFAS; Nordic Council of Ministers: Copenhagen, Denmark, 2019. [Google Scholar]
- Garg, S.; Wang, J.; Kumar, P.; Mishra, V.; Arafat, H.; Sharma, R.S.; Dumée, L.F. Remediation of water from per-/poly-fluoroalkyl substances (PFAS)—Challenges and perspectives. J. Environ. Chem. Eng. 2021, 9, 105784. [Google Scholar] [CrossRef]
- Liu, C.J.; McKay, G.; Jiang, D.; Tenorio, R.; Cath, J.T.; Amador, C.; Murray, C.C.; Brown, J.B.; Wright, H.B.; Schaefer, C.; et al. Pilot-scale field demonstration of a hybrid nanofiltration and UV-sulfite treatment train for groundwater contaminated by per- and polyfluoroalkyl substances (PFASs). Water Res. 2021, 205, 117677. [Google Scholar] [CrossRef] [PubMed]
- Ensch, M.; Rusinek, C.A.; Becker, M.F.; Schuelke, T. A combined current density technique for the electrochemical oxidation of perfluorooctanoic acid (PFOA) with boron-doped diamond. Water Environ. J. 2020, 35, 158–165. [Google Scholar] [CrossRef]
- Berg, C.; Crone, B.; Gullett, B.; Higuchi, M.; Krause, M.J.; Lemieux, P.M.; Martin, T.; Shields, E.P.; Struble, E.; Thoma, E.; et al. Developing innovative treatment technologies for PFAS-containing wastes. J. Air Waste Manag. Assoc. 2022, 72, 540–555. [Google Scholar] [CrossRef]
- Tran, T.; Abrell, L.; Brusseau, M.L.; Chorover, J. Iron-activated persulfate oxidation degrades aqueous Perfluorooctanoic acid (PFOA) at ambient temperature. Chemosphere 2021, 281, 130824. [Google Scholar] [CrossRef]
- Cao, H.; Zhang, W.; Wang, C.; Liang, Y. Sonochemical degradation of poly- and perfluoroalkyl substances—A review. Ultrason. Sonochem. 2020, 69, 105245. [Google Scholar] [CrossRef]
- Wanninayake, D.M. Comparison of currently available PFAS remediation technologies in water: A review. J. Environ. Manag. 2021, 283, 111977. [Google Scholar] [CrossRef]
- Mohamed, B.A.; Li, L.Y.; Hamid, H.; Jeronimo, M. Sludge-based activated carbon and its application in the removal of perfluoroalkyl substances: A feasible approach towards a circular economy. Chemosphere 2022, 294, 133707. [Google Scholar] [CrossRef]
- ITRC. Remediation Technologies and Methods for Per- and Polyfluoroalkyl Substances (PFAS); Interstate Technology Regu Count Sheets: Arlington, TX, USA, 2018. [Google Scholar]
- Winchell, L.J.; Ross, J.J.; Wells, M.J.M.; Fonoll, X.; Norton, J.W., Jr.; Bell, K.Y. Per- and polyfluoroalkyl substances thermal destruction at water resource recovery facilities: A state of the science review. Water Environ. Res. 2020, 93, 826–843. [Google Scholar] [CrossRef]
- Longendyke, G.K.; Katel, S.; Wang, Y. PFAS fate and destruction mechanisms during thermal treatment: A comprehensive review. Environ. Sci. Process. Impacts 2021, 24, 196–208. [Google Scholar] [CrossRef] [PubMed]
- Bolan, N.; Sarkar, B.; Yan, Y.; Li, Q.; Wijesekara, H.; Kannan, K.; Tsang, D.C.; Schauerte, M.; Bosch, J.; Noll, H.; et al. Remediation of poly- and perfluoroalkyl substances (PFAS) contaminated soils—To mobilize or to immobilize or to degrade? J. Hazard. Mater. 2020, 401, 123892. [Google Scholar] [CrossRef] [PubMed]
- Sharma, R.; Sharma, M.; Sharma, R.; Sharma, V. The impact of incinerators on human health and environment. Rev. Environ. Heal. 2013, 28, 67–72. [Google Scholar] [CrossRef]
- Liu, C.J.; Werner, D.; Bellona, C. Removal of per- and polyfluoroalkyl substances (PFASs) from contaminated groundwater using granular activated carbon: A pilot-scale study with breakthrough modeling. Environ. Sci. Water Res. Technol. 2019, 5, 1844–1853. [Google Scholar] [CrossRef]
- Fernandez, N.A.; Rodriguez-Freire, L.; Keswani, M.; Sierra-Alvarez, R. Effect of chemical structure on the sonochemical degradation of perfluoroalkyl and polyfluoroalkyl substances (PFASs). Environ. Sci. Water Res. Technol. 2016, 2, 975–983. [Google Scholar] [CrossRef] [Green Version]
- Brendel, S.; Fetter, E.; Staude, C.; Vierke, L.; Biegel-Engler, A. Short-chain perfluoroalkyl acids: Environmental concerns and a regulatory strategy under REACH. Environ. Sci. Eur. 2018, 30, 9. [Google Scholar] [CrossRef] [Green Version]
- Sepulvado, J.G.; Blaine, A.C.; Hundal, L.S.; Higgins, C.P. Occurrence and Fate of Perfluorochemicals in Soil Following the Land Application of Municipal Biosolids. Environ. Sci. Technol. 2011, 45, 8106–8112. [Google Scholar] [CrossRef]
- Navarro, I.; de la Torre, A.; Sanz, P.; Porcel, M.; Pro, J.; Carbonell, G.; Martínez, M.D.L. Uptake of perfluoroalkyl substances and halogenated flame retardants by crop plants grown in biosolids-amended soils. Environ. Res. 2017, 152, 199–206. [Google Scholar] [CrossRef]
- Ghisi, R.; Vamerali, T.; Manzetti, S. Accumulation of perfluorinated alkyl substances (PFAS) in agricultural plants: A review. Environ. Res. 2018, 169, 326–341. [Google Scholar] [CrossRef]
- Mahinroosta, R.; Senevirathna, L. A review of the emerging treatment technologies for PFAS contaminated soils. J. Environ. Manag. 2019, 255, 109896. [Google Scholar] [CrossRef] [PubMed]
- Bhhatarai, B.; Gramatica, P. Correction to Prediction of Aqueous Solubility, Vapor Pressure and Critical Micelle Concentration for Aquatic Partitioning of Perfluorinated Chemicals. Environ. Sci. Technol. 2011, 46, 566. [Google Scholar] [CrossRef]
- Rahman, M.F.; Peldszus, S.; Anderson, W.B. Behaviour and fate of perfluoroalkyl and polyfluoroalkyl substances (PFASs) in drinking water treatment: A review. Water Res. 2014, 50, 318–340. [Google Scholar] [CrossRef]
- Thoma, E.D.; Wright, R.S.; George, I.; Krause, M.; Presezzi, D.; Villa, V.; Preston, W.; Deshmukh, P.; Kauppi, P.; Zemek, P.G. Pyrolysis processing of PFAS-impacted biosolids, a pilot study. J. Air Waste Manag. Assoc. 2022, 72, 309–318. [Google Scholar] [CrossRef] [PubMed]
- Winchell, L.J.; Wells, M.J.M.; Ross, J.J.; Fonoll, X.; Norton, J.W., Jr.; Kuplicki, S.; Khan, M.; Bell, K.Y. Per- and Polyfluoroalkyl Substances Presence, Pathways, and Cycling through Drinking Water and Wastewater Treatment. J. Environ. Eng. 2022, 148, 03121003. [Google Scholar] [CrossRef]
- Winchell, L.J.; Ross, J.J.; Brose, D.A.; Pluth, T.B.; Fonoll, X.; Norton, J.W.; Bell, K.Y. Pyrolysis and gasification at water resource recovery facilities: Status of the industry. Water Environ. Res. 2022, 94, e10701. [Google Scholar] [CrossRef]
- Johansson, N.; Fredriksson, A.; Eriksson, P. Neonatal exposure to perfluorooctane sulfonate (PFOS) and perfluorooctanoic acid (PFOA) causes neurobehavioural defects in adult mice. NeuroToxicology 2008, 29, 160–169. [Google Scholar] [CrossRef]
- Baran, J.R. Fluorinated Surfactants and Repellents: Second Edition, Revised and Expanded Surfactant Science Series. Volume 97. By Erik Kissa (Consultant, Wilmington, DE). Marcel Dekker: New York. 2001. xiv + 616 pp. $195.00. ISBN 0-8247-0472-X. J. Am. Chem. Soc. 2001, 123, 8882. [Google Scholar] [CrossRef]
- OECD. Preliminary Lists of PFOS, PFAS, PFOA and Related Compounds and Chemicals that May Degrade to PFCA. OECD Pap. 2006, 6, 1–194. [Google Scholar] [CrossRef]
- US Environmental Protection Agency (EPA). A Plain English Guide to the EPA Part 503 Biosolids Rule Excellence in Compliance Through; EPA-832/R-93/003; EPA: Washington, DC, USA, 1994.
- Rathnayake, N.; Patel, S.; Halder, P.; Aktar, S.; Pazferreiro, J.; Sharma, A.; Surapaneni, A.; Shah, K. Co-pyrolysis of biosolids with alum sludge: Effect of temperature and mixing ratio on product properties. J. Anal. Appl. Pyrolysis 2022, 163, 105488. [Google Scholar] [CrossRef]
- Hytönen, J.; Nurmi, J. Heating Value and Ash Content of Intensively Managed Stands; Wood Research: Kannus, Finland, 2015. [Google Scholar]
- Kung, K.S.; Thengane, S.K.; Shanbhogue, S.; Ghoniem, A.F. Parametric analysis of torrefaction reactor operating under oxygen-lean conditions. Energy 2019, 181, 603–614. [Google Scholar] [CrossRef]
- Bamdad, H.; Hawboldt, K.; MacQuarrie, S.; Papari, S. Application of biochar for acid gas removal: Experimental and statistical analysis using CO2. Environ. Sci. Pollut. Res. 2019, 26, 10902–10915. [Google Scholar] [CrossRef]
- Bamdad, H.; Hawboldt, K.; MacQuarrie, S. A review on common adsorbents for acid gases removal: Focus on biochar. Renew. Sustain. Energy Rev. 2018, 81, 1705–1720. [Google Scholar] [CrossRef]
- Kundu, S.; Patel, S.; Halder, P.; Patel, T.; Marzbali, M.H.; Pramanik, B.K.; Paz-Ferreiro, J.; de Figueiredo, C.C.; Bergmann, D.; Surapaneni, A.; et al. Removal of PFASs from biosolids using a semi-pilot scale pyrolysis reactor and the application of biosolids derived biochar for the removal of PFASs from contaminated water. Environ. Sci. Water Res. Technol. 2020, 7, 638–649. [Google Scholar] [CrossRef]
- Leng, L.; Huang, H.; Li, H.; Li, J.; Zhou, W. Biochar stability assessment methods: A review. Sci. Total Environ. 2018, 647, 210–222. [Google Scholar] [CrossRef]
- Bamdad, H.; Papari, S.; Lazarovits, G.; Berruti, F. Soil amendments for sustainable agriculture: Microbial organic fertilizers. Soil Use Manag. 2021, 38, 94–120. [Google Scholar] [CrossRef]


| PFAS (ppb) | S1 | 500 °C | 700 °C | S2 | 500 °C | 700 °C | S3 | Test at 500 °C | Test at 700 °C | ||||
|---|---|---|---|---|---|---|---|---|---|---|---|---|---|
| Biosolid | Char | Char | Biosolid | Char | Char | Biosolid | Char | Gas | Oil | Char | Gas | Oil | |
| 8:2 Fluorotelomer sulfonic acid (8:2 FTS) | BDL | BDL | BDL | BDL | BDL | BDL | BDL * | BDL | BDL | BDL | BDL | BDL | BDL |
| 6:2 Fluorotelomer sulfonic acid (6:2 FTS) | BDL | BDL | BDL | BDL | BDL | BDL | BDL | BDL | 0.11 | BDL | BDL | 0.12 | BDL |
| 4:2 Fluorotelomer sulfonic acid (4:2 FTS) | BDL | BDL | BDL | BDL | BDL | BDL | BDL | BDL | BDL | BDL | BDL | BDL | BDL |
| 10:2 Fluorotelomer sulfonic acid (10:2 F) | 1.5 | BDL | BDL | 1.2 | BDL | BDL | 1.2 | BDL | BDL | BDL | BDL | BDL | BDL |
| Perfluorobutane sulfonic acid (PFBS) | BDL | BDL | BDL | BDL | BDL | BDL | BDL | BDL | BDL | BDL | BDL | BDL | BDL |
| Perfluorohexane sulfonic acid (PFHxS) | 3.8 | BDL | BDL | 3.6 | BDL | BDL | BDL | 0.45 | BDL | BDL | BDL | BDL | BDL |
| Perfluorotridecanoic acid (PFTrDA) | BDL | BDL | BDL | BDL | BDL | BDL | BDL | BDL | BDL | BDL | BDL | BDL | BDL |
| Perfluorooctane sulfonic acid (PFOS) | 13.7 | BDL | BDL | 16.6 | BDL | BDL | 26.6 | BDL | BDL | BDL | BDL | BDL | BDL |
| Perfluoropentane sulfonic acid (PFPeS) | BDL | BDL | BDL | BDL | BDL | BDL | BDL | BDL | BDL | BDL | BDL | BDL | BDL |
| N-Et PFO sulfonamide (EtFOSA) | BDL | BDL | BDL | BDL | BDL | BDL | BDL | BDL | BDL | BDL | BDL | BDL | BDL |
| N-Et PFO sulfonamidoethanol (EtFOSE) | 6.3 | BDL | BDL | 4.8 | BDL | BDL | BDL | BDL | BDL | BDL | BDL | BDL | BDL |
| N-Et PFO sulfonamidoacetic acid (EtFOSAA) | 2.9 | BDL | BDL | 3.2 | BDL | BDL | 5.3 | BDL | BDL | BDL | BDL | BDL | BDL |
| N-Me PFO sulfonamide (MeFOSA) | BDL | BDL | BDL | BDL | BDL | BDL | BDL | BDL | BDL | BDL | BDL | BDL | BDL |
| N-Me PFO sulfonamidoacetic acid (MeFOSAA) | 3.5 | BDL | BDL | 2.5 | BDL | BDL | 2.9 | BDL | BDL | BDL | BDL | BDL | BDL |
| N-Me PFO sulfonamidoethanol (MeFOSE) | BDL | BDL | BDL | BDL | BDL | BDL | BDL | BDL | BDL | BDL | BDL | BDL | BDL |
| Perfluoroheptane sulfonic acid (PFHpS) | BDL | BDL | BDL | BDL | BDL | BDL | BDL | BDL | BDL | BDL | BDL | BDL | BDL |
| Perfluorooctane sulfonamide (FOSA) | BDL | BDL | BDL | BDL | BDL | BDL | BDL | BDL | BDL | BDL | BDL | BDL | BDL |
| Perfluorodecane sulfonic acid (PFDS) | BDL | BDL | BDL | BDL | BDL | BDL | BDL | BDL | BDL | BDL | BDL | BDL | BDL |
| Perfluorobutanoic acid (PFBA) | BDL | BDL | BDL | BDL | BDL | BDL | BDL | BDL | N/A | BDL | BDL | N/A | BDL |
| Perfluorodecanoic acid (PFDA) | BDL | BDL | BDL | BDL | BDL | BDL | BDL | BDL | BDL | BDL | BDL | 0.04 | BDL |
| Perfluorododecanoic acid (PFDoDA) | BDL | BDL | BDL | BDL | BDL | BDL | BDL | BDL | BDL | BDL | BDL | BDL | BDL |
| Perfluoroheptanoic acid (PFHpA) | BDL | BDL | BDL | BDL | BDL | BDL | BDL | BDL | BDL | BDL | BDL | BDL | BDL |
| Perfluorohexanoic acid (PFHxA) | 1.6 | BDL | BDL | 1.8 | 0.26 | 0.15 | 2.2 | 0.39 | 19.49 | BDL | BDL | 1.44 | BDL |
| Perfluorononanoic acid (PFNA) | 1.1 | BDL | BDL | BDL | BDL | BDL | BDL | BDL | 1.68 | BDL | BDL | 1.21 | BDL |
| Perfluorooctanoic acid (PFOA) | BDL | BDL | BDL | BDL | 0.18 | BDL | BDL | 0.23 | 2.45 | BDL | BDL | 0.61 | BDL |
| Perfluoropentanoic acid (PFPeA) | BDL | BDL | BDL | BDL | BDL | BDL | BDL | BDL | 4.94 | BDL | BDL | 1.04 | BDL |
| Perfluorotetradecanoic acid (PFTeDA) | BDL | BDL | BDL | BDL | BDL | BDL | BDL | BDL | BDL | BDL | BDL | BDL | BDL |
| Perfluoroundecanoic acid (PFUnDA) | 1.9 | BDL | BDL | BDL | BDL | BDL | 1.8 | BDL | 0.47 | BDL | BDL | 0.28 | BDL |
| Perfluorononane sulfonic acid (PFNS) | N/A | N/A | N/A | N/A | N/A | N/A | N/A | N/A | BDL | N/A | N/A | BDL | N/A |
| Class | Group | PFAS Acronym | Molecular Formula | Molecular Weight (g/mol) | Chain Length | Molecular Structure | Density (g/cm3) | Melting Point Tm (°C) | Boiling Point Tb (°C) | Water Solubility (g/L) | Vapor Pressure (Pa) |
|---|---|---|---|---|---|---|---|---|---|---|---|
| Perfluoroalkyl acids (PFAAs) | PFCA (Perfluoroalkyl carboxylic acids) | PFBA | C4HF7O2 | 214.04 | SC * |  | 1.61 | −17.5 | 121 | N/A | 1307 |
| PFPeA | C5HF9O2 | 264.05 | SC |  | 1.67 | N/A | 124.4 | 112.6 | 1057 | ||
| PFHxA | C6HF11O2 | 314.05 | SC |  | 1.69 | 14 | 143 | 21.7 | 457 | ||
| PFHpA | C7HF13O2 | 364.06 | SC |  | 1.71 | 30 | 175 | 4.2 | 158 | ||
| PFOA | C8HF15O2 | 414.07 | LC ** |  | 1.80 | 37–60 | 188–192 | 3.4–9.5 | 4–1300 | ||
| PFNA | C9HF17O2 | 464.08 | LC |  | 1.78 | 56–59 | 218 | 9.5 | 1.3 | ||
| PFDA | C10HF19O2 | 514.09 | LC |  | 1.79 | 77–88 | 218 | 9.5 | 0.2 | ||
| PFUnDA | C11HF21O2 | 564.09 | LC |  | 1.81 | 83–101 | 160–230 | 0.004 | 0.1 | ||
| PFDoDA | C12HF23O2 | 614.10 | LC |  | 1.82 | 107–109 | 245 | 0.0007 | 0.01 | ||
| PFTrDA | C13HF25O2 | 664.11 | LC |  | 1.85 | N/A | N/A | 0.0002 | 0.3 | ||
| PFTeDA | C14HF27O2 | 714.12 | LC |  | 1.86 | N/A | 276 | 0.00003 | 0.1 | ||
| PFSAs (Perfluoroalkane sulfonic acids) | PFBS | C4HF9SO3 | 300.09 | SC |  | 1.81 | 76–84 | 211 | 46.2–56.6 | 631 | |
| PFPeS | C5HF11SO3 | 350.11 | SC |  | N/A | N/A | 225 | N/A | N/A | ||
| PFHxS | C6HF13SO3 | 400.11 | LC |  | N/A | 86 | 226 | 2.3 | 58.9 | ||
| PFHpS | C7HF15SO3 | 450.12 | LC |  | N/A | N/A | N/A | N/A | N/A | ||
| PFOS | C8HF17SO3 | 500.13 | LC |  | 1.84 | N/A | >400 | 1.52–1.57 | 6.7 | ||
| PFNS | C9HF19SO3 | 549.13 | LC |  | 1.84 | 183 | N/A | N/A | N/A | ||
| PFDS | C10HF21SO3 | 600.14 | LC |  | N/A | N/A | N/A | 0.002 | 0.71 | ||
| Perfluoroalkane Sulfonamides (FASAs) | FASAs | FOSA | C8H2F17NS O2 | 499.14 | LC |  | 1.79 | 154–155 | N/A | N/A | N/A |
| Perfluoroalkane sulfonamido substances | N-alkyl Perfluoroalkane sulfonamides (N-alkyl FASAs) | MeFOSA | C9H4F17N SO2 | 513.17 | LC |  | N/A | N/A | N/A | 0.0002 | 0.3 |
| EtFOSA | C10H6F17NSO2 | 527.2 | LC |  | N/A | N/A | N/A | 0.0001 | 0.12 | ||
| Nalkyl perfluoroalkane sulfonamido ethanols (N-alkyl FASEs) | MeFOSE | C11H8F17NSO3 | 557.22 | LC |  | N/A | N/A | N/A | 0.0003 | 0.0004 | |
| EtFOSE | C12H10F17NSO3 | 571.25 | LC |  | N/A | 55–60 | N/A | 0.0001 | 0.002 | ||
| N-alkyl perfluoroalkane sulfonamido acetic acids (N-alkyl FASAAs) | MeFOSAA | C11H6F17N SO4 | 571.21 | LC |  | N/A | N/A | N/A | N/A | N/A | |
| EtFOSAA | C12H8F17N SO4 | 585.24 | LC |  | N/A | N/A | N/A | N/A | N/A | ||
| Fluorotelomer substances | n:2 Fluorotelomer sulfonic acids (n:2 FTSAs) | 4:2 FTS | C6H5F9SO3 | 328.15 | LC |  | 1.68 | N/A | 216 | 27.9 | 0.33 |
| 6:2 FTS | C8H5F13SO3 | 428.16 | LC |  | 1.68 | 69.2 | 238 | 1.3 | 0.11 | ||
| 8:2 FTS | C10H5F17SO3 | 528.18 | LC |  | 1.71 | 83.8 | 250 | 0.06 | 0.01 | ||
| 10:2 FTS | C12H5F21SO3 | 628.2 | LC |  | 1.75 | 173 | N/A | 0.002 | 0.001 |
| Parameter | S1 Biosolid | S1 Biochar 500 °C | S1 Biochar 700 °C | S2 Biosolid | S2 Biochar 500 °C | S2 Biochar 700 °C | S3 Biosolid | S3 Biochar 500 °C | S3 Biochar 700 °C | Other work Biosolid [44] | Other work Biochar 500 °C [44] | Other work Biochar 700 °C [44] |
|---|---|---|---|---|---|---|---|---|---|---|---|---|
| HHV (MJ/kg) | 10.4 | 7.8 | 6.3 | 15.1 | 10.5 | 8.1 | 18.5 | 11.6 | 10.3 | 14.68 | 9.9 | 9.2 |
| Carbon (wt%) | 24.02 | 18.2 | 15.02 | 33.03 | 25.75 | 22.6 | 39.95 | 26.69 | 23.95 | 36.71 | 29.3 | 26.5 |
| Nitrogen (wt%) | 1.29 | 0.62 | 0.53 | 2.83 | 0.55 | 0.53 | 5.87 | 0.15 | 0.08 | 5.42 | 3.6 | 3.3 |
| Hydrogen (wt%) | 3.93 | 1.26 | 0.38 | 5.08 | 1.05 | 0.4 | 5.83 | 1.63 | 0.56 | 4.24 | 1.33 | 1.03 |
| Sulfur (wt%) | 0.94 | 1.24 | 1.6 | 1.28 | 0.92 | 1 | 0.54 | 0.54 | 0.86 | 0.92 | 0.24 | 0.52 |
| Oxygen (wt%) | 25.22 | 4.28 | 2.17 | 27.78 | 8.23 | 6.97 | 29.94 | 9.57 | 4.89 | 23.70 | 11.47 | 8.35 |
| Moisture (wt%) | 8.9 | 0.8 | 0.3 | 5.3 | 0.7 | 0.5 | 4.48 | 0.12 | 2.12 | 55.7 | 17.74 | 12.11 |
| Volatile Matter (wt%) | 40.9 | 11.4 | 1.3 | 53.6 | 14.4 | 7.2 | 65.01 | 10.8 | 1.66 | |||
| Ash (wt%) | 44.6 | 74.4 | 80.3 | 30 | 63.5 | 68.5 | 17.88 | 61.43 | 69.66 | 28.43 | 54.08 | 60.3 |
| Parameter (mg/kg) | S1 Biosolid | S1 Biochar 500 °C | S1 Biochar 700 °C | S2 Biosolid | S2 Biochar 500 °C | S2 Biochar 700 °C | S3 Biosolids | Test at 500 °C | Test at 700 °C | EPA Limits * (mg/kg) | ||
|---|---|---|---|---|---|---|---|---|---|---|---|---|
| Biochar | Biooil | Biochar | Biooil | |||||||||
| Arsenic | 6.00 | 6.51 | 9.89 | 5.22 | 2.41 | 4.35 | 4 | BDL | 6.18 | BDL | 7.81 | 41 |
| Cadmium | 2.4 | 4.0 | 2.0 | 2.0 | 4.1 | 0.8 | 2.2 | 4.0 | 0.419 | 3.2 | 0.079 | 39 |
| Chromium | 59.2 | 94.9 | 102 | 44.0 | 81.4 | 74.6 | 51.6 | 82.1 | 2.47 | 69.00 | 0.36 | - |
| Cobalt | 5.55 | 8.58 | 9.54 | 3.94 | 5.31 | 8.14 | 3.62 | 6.10 | BDL | 6.96 | BDL | - |
| Copper | 453 | 733 | 816 | 425 | 883 | 850 | 493 | 853 | 18.8 | 886 | 2.5 | 1500 |
| Lead | 81.1 | 130 | 145 | 74.5 | 163 | 136 | 77.1 | 137 | 2.78 | 146 | 0.47 | 300 |
| Mercury | 0.61 | <0.15 | <0.15 | 0.75 | <0.15 | <0.15 | 0.88 | 0.19 | 0.634 | BDL | 0.330 | 17 |
| Molybdenum | 8.09 | 13.1 | 14.2 | 10.8 | 29.4 | 18.7 | 14.6 | 24.2 | 0.558 | 23.3 | 0.113 | - |
| Nickel | 21.2 | 34.3 | 44.5 | 18.0 | 37.5 | 43.8 | 24.1 | 40.8 | 2.16 | 43.9 | 0.51 | 420 |
| Potassium | 1330 | 2080 | 3480 | 1580 | 3650 | 4080 | N/A | N/A | N/A | N/A | N/A | - |
| Phosphorus | N/A | N/A | N/A | 42 | 44 | 55.5 | N/A | N/A | N/A | N/A | N/A | - |
| Selenium | <1 | <1 | <1 | <1 | <1 | <1 | 1 | BDL | 5.53 | BDL | 4.13 | 100 |
| Zinc | 862 | 1270 | 1390 | 791 | 1490 | 1410 | 872 | 1430 | 37.7 | 1510 | 7.4 | 2800 |
Publisher’s Note: MDPI stays neutral with regard to jurisdictional claims in published maps and institutional affiliations. |
© 2022 by the authors. Licensee MDPI, Basel, Switzerland. This article is an open access article distributed under the terms and conditions of the Creative Commons Attribution (CC BY) license (https://creativecommons.org/licenses/by/4.0/).
Share and Cite
Bamdad, H.; Papari, S.; Moreside, E.; Berruti, F. High-Temperature Pyrolysis for Elimination of Per- and Polyfluoroalkyl Substances (PFAS) from Biosolids. Processes 2022, 10, 2187. https://doi.org/10.3390/pr10112187
Bamdad H, Papari S, Moreside E, Berruti F. High-Temperature Pyrolysis for Elimination of Per- and Polyfluoroalkyl Substances (PFAS) from Biosolids. Processes. 2022; 10(11):2187. https://doi.org/10.3390/pr10112187
Chicago/Turabian StyleBamdad, Hanieh, Sadegh Papari, Emma Moreside, and Franco Berruti. 2022. "High-Temperature Pyrolysis for Elimination of Per- and Polyfluoroalkyl Substances (PFAS) from Biosolids" Processes 10, no. 11: 2187. https://doi.org/10.3390/pr10112187