Article

An Intensified Green Process for the Coproduction of DMC and DMO by the Oxidative Carbonylation of Methanol

by
Abdulrahman A. Al-Rabiah
1,*,
Abdulaziz M. Almutlaq
1,
Omar S. Bashth
2,
Taher M. Alyasser
1,
Fayez A. Alshehri
1,
Mohammed S. Alofai
1 and
Abdulelah S. Alshehri
1,3
1
Chemical Engineering Department, College of Engineering, King Saud University, Riyadh 11421, Saudi Arabia
2
School of Biomedical Engineering, University of British Columbia, Vancouver, BC V6T 1Z3, Canada
3
Robert Frederick Smith School of Chemical and Biomolecular Engineering, Cornell University, Ithaca, NY 14853, USA
*
Author to whom correspondence should be addressed.
Processes 2022, 10(10), 2094; https://doi.org/10.3390/pr10102094
Submission received: 20 September 2022 / Revised: 12 October 2022 / Accepted: 13 October 2022 / Published: 16 October 2022

Abstract

:
Dimethyl carbonate (DMC) is an eco-friendly and sustainable compound with widespread industrial applications. Various extensive routes have been exploited in the chemical industry to produce DMC. However, these routes have several environmental and energy drawbacks. In this study, a promising novel industrial scheme for the synthesis of DMC via the oxidative carbonylation of vaporized methanol with dimethyl oxalate (DMO) as a byproduct is investigated. A methanol conversion of 81.86% and a DMC selectivity of 83.47% were achieved using an isothermal fixed-bed reactor at 130 °C. The DMC is withdrawn at a purity of >99 mol% via pressure-swing azeotropic distillations. Heat integration was performed to optimize energy consumption, reducing the energy requirements by 28%. An economic evaluation was performed for estimating the profitability via cash-flow diagrams, predicting a payback period of 3.7 years. The proposed green process exhibits several benefits, including high profitability and being environmentally friendly. It also eliminates the use or production of hazardous materials, and it enhances safety characteristics.

1. Introduction

Increasing attention has been paid to the sustainable development of new environmentally benign chemicals for replacing widely used toxic reagents to alleviate the complications of harmful exposure and waste [1,2]. Dimethyl carbonate (DMC) is a promising eco-friendly chemical with a wide range of industrial applications [3]. With flammability as its sole hazard, the use of DMC eliminates the complications and precautions associated with the highly toxic phosgene and dimethyl sulfate and the carcinogenic methyl halides [4,5].
Given the eco-friendly properties and extensive applications of DMC, its demand has led to rapid annual growth, and the industry failed to satisfy the market needs. Much of the demand for DMC originates from the production of polycarbonate, a polymer that is mainly consumed in the medical-equipment and automotive industries [6]. Furthermore, owing to its nontoxicity, biodegradability, and physicochemical properties, DMC is viewed as a potential eco-friendly fuel additive that minimizes combustion-generated pollutants by inhibiting soot formation in engines [7]. Despite the commercial unavailability of DMC as a fuel additive, it exhibited similar effects to those of the oxygenate methyl tert-butyl ether (MTBE) for improving the octane performance while reducing the harmful emissions by >50% [6]. Additionally, the projected growth in demand extends to the use of DMC as a chemical reagent in methylation or carbonylation processes and as an ecofriendly electrolyte solvent in different energy-storage devices, such as high-power density double-layer capacitors and lithium batteries [8,9].
Various viable routes have been commercially exploited for synthesizing DMC using a wide range of technologies and raw materials. Traditionally, DMC was produced via the phosgenation of methanol (MeOH), which involves phosgene—a hypertoxic raw material. Phosgene is used industrially as a reagent and an intermediate for producing various materials, such as polyurethane12. However, its toxicological effects, mainly on the lungs and pulmonary system, led to its classification as a class (A) poison by the US Department of Transportation [10,11]. In spite of the high yield of the phosgene route, researchers have been working to develop inherently safer alternative routes, such as the methanolysis of urea, to mitigate the risks associated with the phosgenation production method [12]. The transesterification of both urea and ethylene carbonate (EC), along with the carbonylation of MeOH, has also been established as alternative pathways to produce DMC [13]. At present, the transesterification routes are the main industrial production methods for DMC. However, the high cost of feedstock for such routes limits the use of DMC as an eco-friendly fuel additive. Hence, the development of a profitable, sustainable, and safe route is paramount for unlocking the potential of the green compound for widespread applications [6].
Homogeneous catalysts such as cuprous chloride can be used to produce DMC in a slurry phase. However, such a route renders the separation of the catalyst and product difficult and energy-intensive [14]. To overcome the problems of homogeneous catalysts, a gas-phase oxidative carbonylation route was introduced by Curnutt and Mich [15]. A carbon-supported cupric chloride heterogeneous catalyst was used for this one-step gas-phase route to produce the DMC. The gas phase one-step process is economically more attractive when compared with the slurry phase process. There are many heterogeneous catalysts that have been investigated in the literature, and most of them are cu-based catalysts. For instance, Cu2O, Cu/SAC, and Cu/Y-zeolite catalysts were tested in the lab for the DMC synthesis [16,17,18].
Herein, a novel process scheme for the synthesis of DMC via the oxidative carbonylation of vapor-phase MeOH in the presence of a CuCl2 catalyst is presented. Fang and Cao established the adequacy of the intrinsic double-rate kinetic scheme through experiments, variance tests, and residue analysis [14]. Although the use of Cu-based catalysts increases the complexity of the carbonylation reaction and introduces byproducts, such catalysts are favorable owing to their heterogeneity, which allows for the bypassing of the difficult separation of homogenous catalysts and the liquid-phase batch operation [14]. The byproduct formed by the foregoing catalytic route is dimethyl oxalate (DMO), which is a versatile feedstock to produce numerous chemicals [19]. DMO can be catalytically hydrogenated to produce a vast array of essential chemicals, such as ethylene glycol (EG) that is widely consumed in the manufacturing of polyester and coolant products as well as an organic solvent [20,21,22]. Furthermore, this novel process has the advantage of creating an industrial carbon cycle, as the feedstock can be directly derived from sustainable resources such as carbon dioxide and biomass. MeOH and carbon monoxide (CO) can be produced from carbon dioxide via the hydrogenation of formates and carbonates and the reaction with manganese, respectively [23,24].
The objective of this study is to develop a novel process for the production of DMC and DMO via the oxidative carbonylation of vaporized MeOH and CO. The technical assessment is built on experimental kinetics to prepare a conceptual design for modeling the process. The technical assessment is coupled with economic analysis for optimizing the separation sequence and energy requirements of the process. The process safety of this highly exothermic oxidative process is investigated.

2. Thermodynamics and Physical Properties

Valid thermodynamic properties are paramount in the process system. Their importance is increased by the presence of the DMC-H2O and DMO-H2O azeotropes in the separation section, which depends heavily on the prediction of reliable thermodynamic data [25]. The vapor–liquid equilibrium (VLE) can be accurately estimated via the group-contribution thermodynamic method (Universal Functional Activity Coefficient, UNIFAC). This method can handle the strongly non-ideal interactions between components in the system [26]. For the computation of such interactions, CHEMCAD was used to implement the UNIFAC model in this study.
The ternary diagram in Figure 1 shows the UNIFAC predictions of two binary azeotropes together with a map of the residue curves to the azeotropic nodes. The residue-curve map represents a collection of the liquid residue curves for a one-stage batch starting from different initial points. Combining the knowledge of the thermodynamic properties and the residue-curve map is essential for the flowsheet development and the synthesis of the separation train [27].

3. Reaction Kinetics and Reactor Design

3.1. Reactions and Kinetic Model

Two reactions occur on the surface of the CuCl2 catalyst: the main reaction is for the production of DMC and H2O, and the side reaction is for the production of the byproduct, i.e., DMO, and H2O. Both reactions consume reactants, i.e., methanol (MeOH), CO, and O2, with different stoichiometric ratios. The two reactions are expressed as follows [14]:
2 CH 3 OH + 1 2 O 2 + CO ( CH 3 O ) 2 CO + H 2 O
2 CH 3 OH + 1 2 O 2 + 2 CO ( CH 3 COO ) 2 + H 2 O
The kinetic model for these two reactions was developed by Fang et al. with the help of a modified Gauss–Newton method to construct the intrinsic kinetic reaction given in Equations (3) and (4). The kinetic parameters are presented in Table 1. Variance tests and residue analysis were performed to validate the model [14].
r 1 = k 1 . e ( E 1 RT ) . p 1 MeOH a , 1 . p 1 CO b , 1 . p 1 O 2 c , 1
r 2 = k 2 . e ( E 2 RT ) . p 2 MeOH a , 2 . p 2 CO b , 2 . p 2 O 2 c , 2
An investigation of the thermodynamics of the two reactions revealed their equilibrium constants to be extremely large. Consequently, backward reactions can be safely neglected, together with any side reactions under the specified conditions. The above intrinsic reaction rates were modified in this study by introducing the effectiveness factor, which accounts for the mass transfer effect of the material inside the pores of the catalyst. Fang et al. recommended the use of a copper chloride (CuCl2)-based catalyst with activated carbon (AC1) as the first support and heteropoly acid as the second support [13]. The DMC selectivity was maximized when the reaction was conducted at a temperature of 130 °C and a pressure of 2 MPa [14].

3.2. Fixed-Bed Reactor Design

As shown in Figure 2, a fixed-bed reactor (FBR) was modeled under the assumptions of steady-state continuous, isothermal, and non-isobaric operation. The oxidative carbonylation main and side reactions are highly exothermic, with reaction enthalpies of −123.6 kJ/mol for reaction (1) and −379.2 kJ/mol for reaction (2). The reactor is operated isothermally at a temperature of 130 °C and a pressure of 2 MPa. Hence, a boiler feed water coolant inside a jacket is needed to achieve the isothermal operation at 130 °C. The actual rate of reaction (ract) was modified using the effectiveness factor to consider the diffusion of reactants and products inside the pores of the catalyst, as shown in Equations (5) and (6).
r 1 act = r 1 . η 1
r 2 act = r 2 . η 2
where η is the overall effectiveness factor, and r 1 and r 2 are the intrinsic reaction rates in Equations (3) and (4), respectively. The material balance equations for each component are given as follows:
d F CO dV = ( r 1 2 r 2 ) ( 1 Φ ) ( 1 ε ) ρ c
d F O 2 dV = ( 1 2   r 1 1 2   r 2 ) ( 1 Φ ) ( 1 ε ) ρ c
dF MeOH dV = ( 2 r 1 2 r 2 ) ( 1 Φ ) ( 1 ε ) ρ c
dF H 2 O dV = ( r 1 + r 2 ) ( 1 Φ ) ( 1 ε ) ρ c
dF DMC dV = ( r 1 ) ( 1 Φ ) ( 1 ε ) ρ c
dF DMO dV = ( r 2 ) ( 1 Φ ) ( 1 ε ) ρ c
where (Φ) is the porosity of the catalyst, which was assumed to be 0.65, and (ε) is the reactor’s voidage, which is estimated to be 0.85 owing to the rapid reaction inside the packed bed. A further assumption is made that the catalyst particles have spherical shapes in order to approximate the overall effectiveness. The obtained equation is as follows [25]:
η i = 1 φ i [ 1 tan 3 φ i 1 3 φ i 1 + φ i β i ( 1 tan 3 φ i 1 3 φ i ) ]
where φi is the Thiele modulus, and βi is the Biot number. These terms are calculated using the following formulas [25]:
β i = k c , i D p 6 D e , i
φ i = D p 6 k i D e , i
where D p is the diameter of the particles, which is taken here to be 0.0007 m [14]. For the Thiele modulus evaluation and simplification, the constant rate of the reaction (ki) in Equation (15) is assumed to be first order in CO and MeOH for both reactions. k c , i and D e , i are the mass transfer coefficient and the effective diffusivity, respectively. The mass transfer coefficient is approximated using the following Thoenes–Kramers correlation [26]:
k c , i = D ab Ree 1 2 Sc 1 3 γ   ( 1 ε ) D pp ε
Here, Sc is the Schmidt number, γ is the shape factor, and Ree is given by Equation (17), where Re is the Reynolds number. The effective diffusivity, D e , i , is estimated using the following Knudsen diffusion equation [27]:
R e e = R e γ   ( 1 ε )
D e , i = Φ D ab , i τ
The tortuosity ( τ ) is assumed to be 3, and the mass diffusivity ( D ab ) is calculated as a function of the pore diameter ( D por ), Reynolds number, temperature, and molecular weight (MW), as follows [27]:
D ab , i = D por 3 8 RT π M w , j
Since the process is non-isobaric, the momentum balance is applied for the calculation of the pressure drop inside the FBR using the following Ergun equation [28]:
dP dV = B o ( 1 Φ ) A c . P o P . F T F T O
where Bo is a constant that depends on the particle diameter and the reactor voidage. It is given by the following equation [28]:
B o = G ( 1 ε ) ρ o g c D p [ 150 ( 1 ε ) μ D p + 1.75 G ]
Equations (5)–(21) were solved and validated using simulation software to determine the reactor volume and effluent composition. The pressure drop through the FBR was estimated to be 80 kPa. After the data points were validated using the kinetic model, the volume of the reactor needed to allow the limiting reactant, i.e., O2, to be almost completely consumed was identified as approximately 1.3 m3. Figure 3 displays the mole fraction of the components with respect to the reactor volume used in the process flowsheet, indicating a complete conversion of O2. Under these conditions, the per-pass MeOH conversion and DMC selectivity were approximately 81.86% and 83.47%, respectively. The MeOH conversion and DMC selectivity were calculated as follows:
X M = F i n ,   M e O H F o u t ,   M e O H F i n ,   M e O H
S D M C = F o u t ,   D M C F i n ,   D M C ( F o u t ,   D M C F i n ,   D M C ) + ( F o u t ,   D M O F i n ,   D M O )

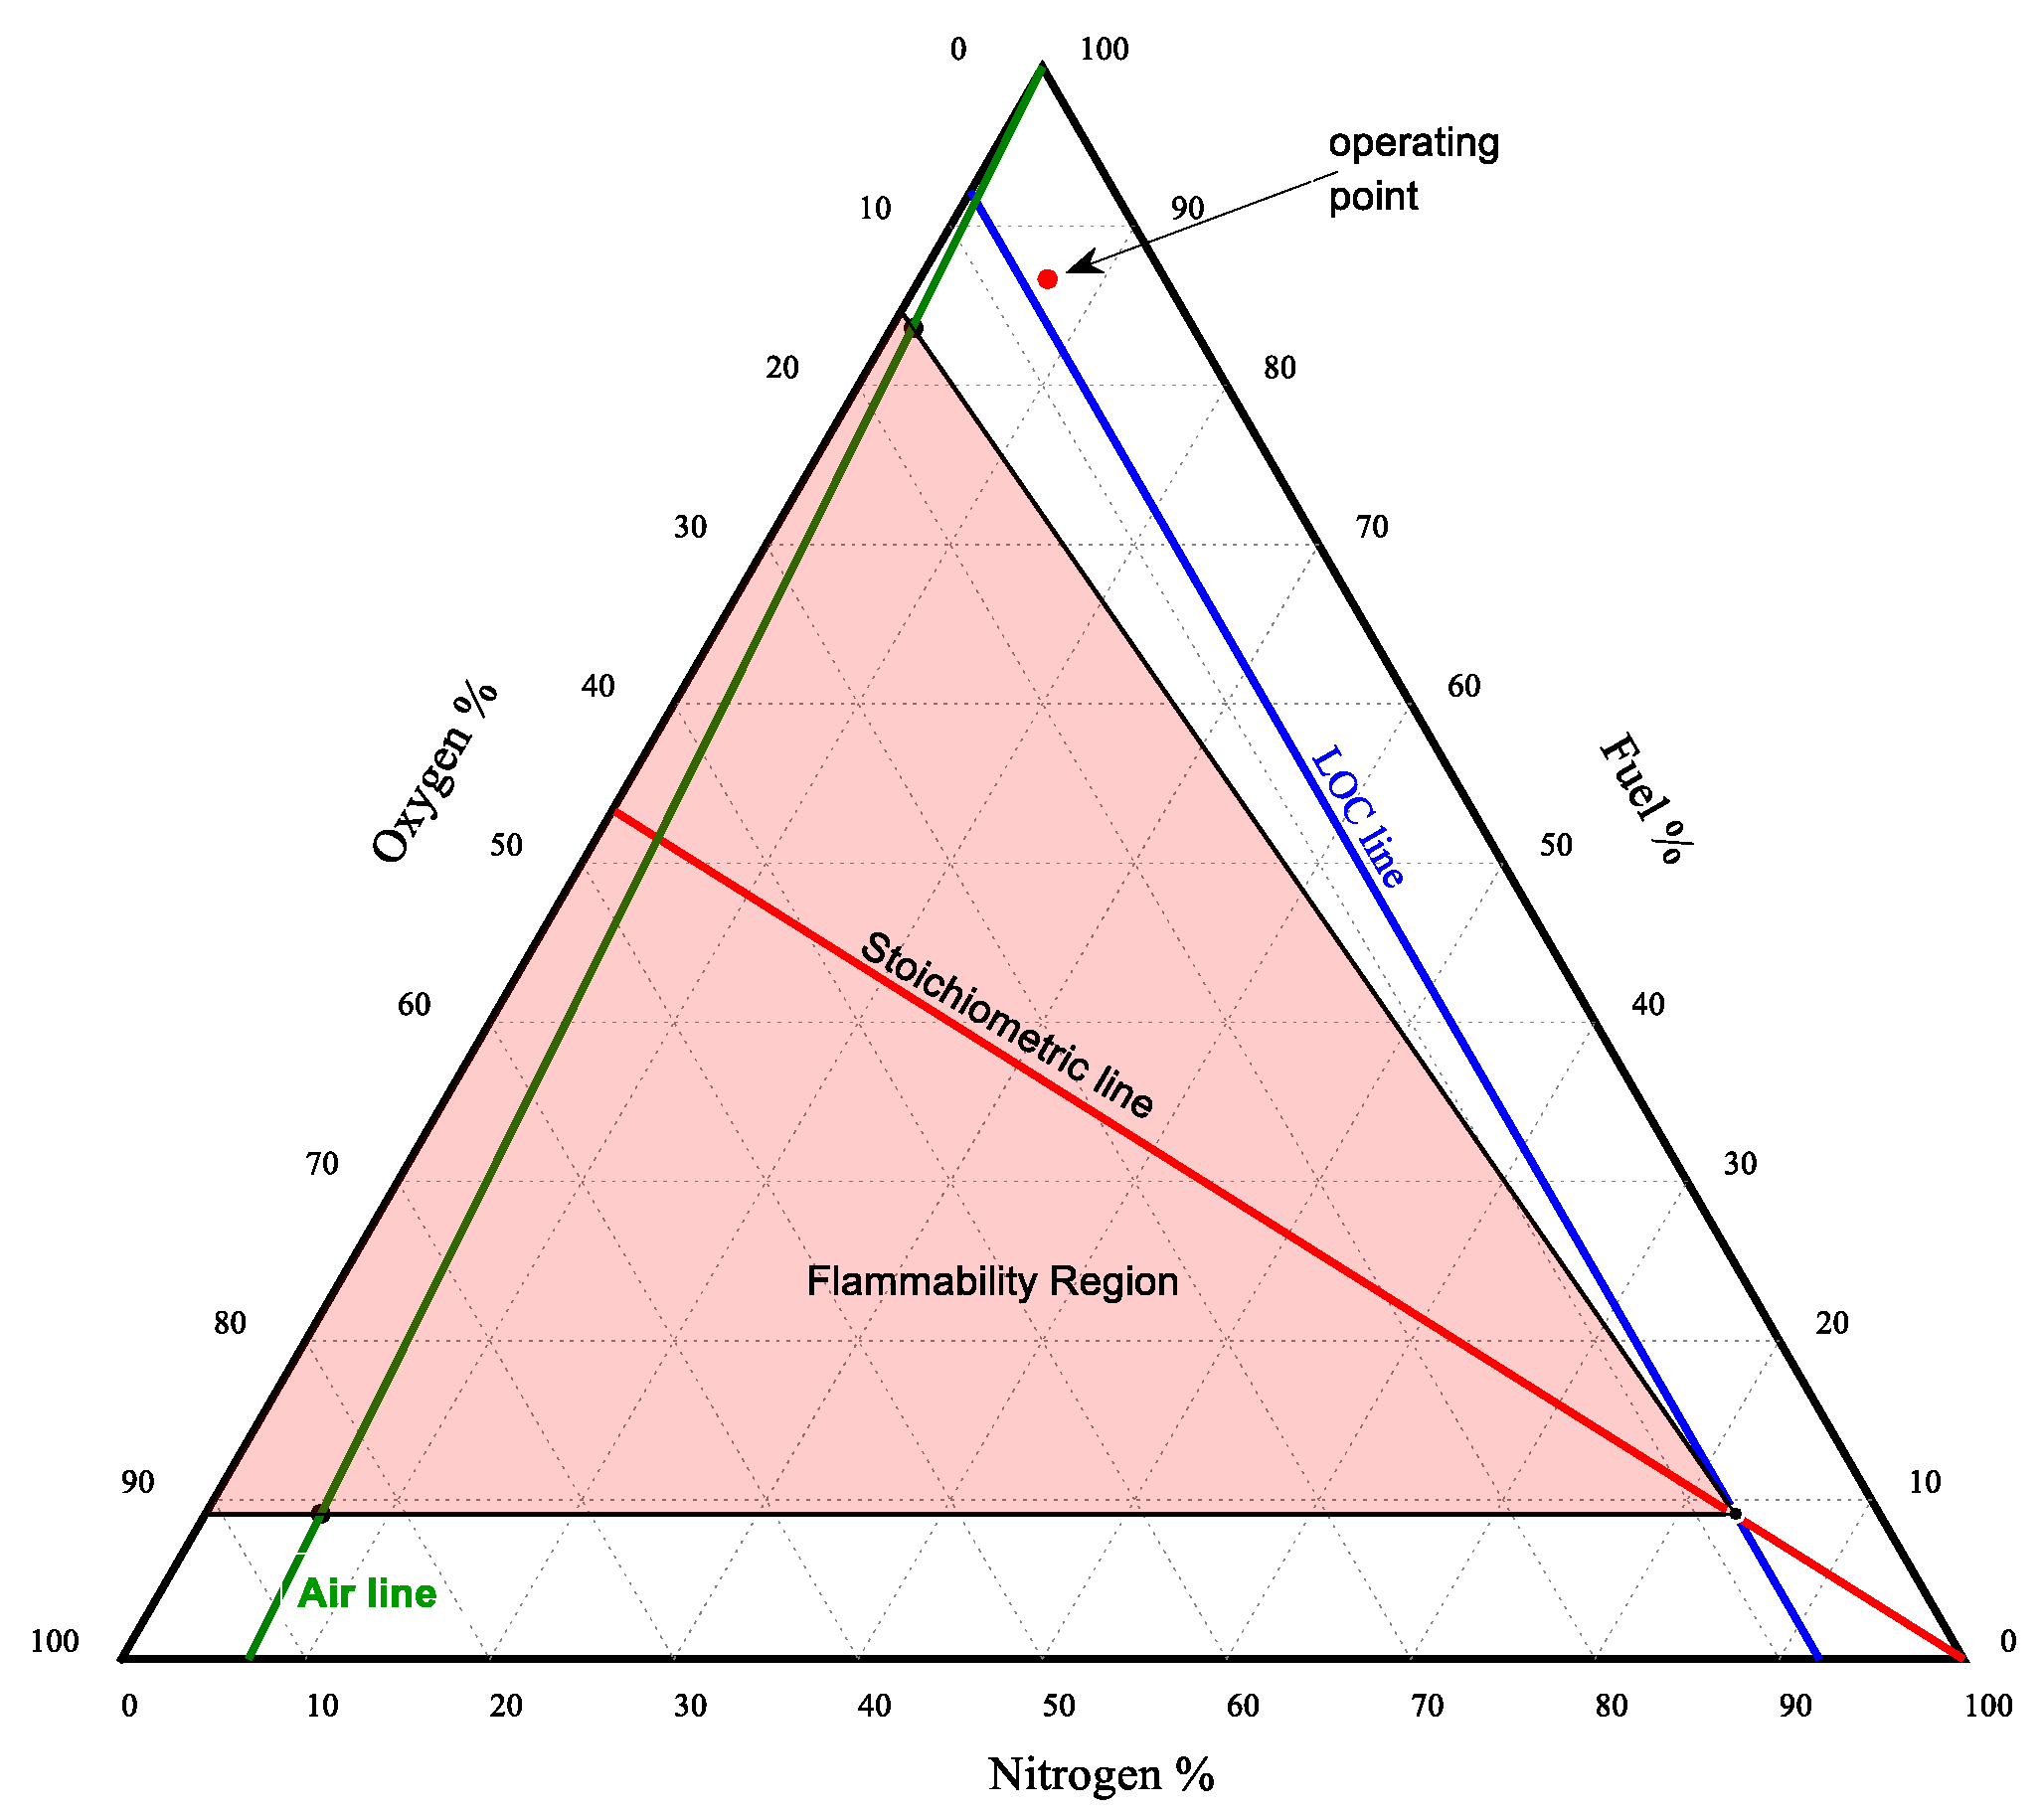
4. Flammability Analysis

A flammability study was performed on the reactor influent due to the reduction in flammability hazard as the reactions consume oxygen to produce DMC and DMO, leaving only traces of oxygen in the reactor outlet stream. The fuel mixture in the diagram solely consists of MeOH and CO, as shown in Table 2. The table also provides the lower and upper flammability levels at the standard temperature and pressure (25 °C and 0.101 MPa, respectively) and at 130 °C and 2 MPa for each component and the fuel mixture. The analysis was conducted using the empirical equations (Equations (24)–(26)), which provide estimates of the effects of the temperature and pressure on the flammability limits [29]:
LFL ( T ) = LFL ( 25   ° C ) 0.75 Δ H c ( T 25 )
UFL ( T ) = UFL ( 25   ° C ) 0.75 Δ H c ( T 25 )
UFL ( P ) = UFL ( 25   ° C ) + 20.5   ( log P + 1 )
where LFL(T) is the lower flammability limit (vol. %), UFL(T) is the upper flammability limit (vol. %), T is the temperature (K), Δ H c is the net heat of combustion (kcal/mol), and P is P is the pressure (MPa).
After the predictions of the flammability limits for the different components were calculated, a correlation for approximating the flammability levels of mixtures was applied, as follows [30]:
LFL m i x = 1 i = 1 n ( Y i L F L i )
UFL m i x = 1 i = 1 n ( Y i U F L i )
where Y i is the mole fraction of component i on a combustible basis, and n is the number of species.
Figure 4 shows the flammability diagram for the fuel/oxygen/nitrogen mixture that flows into the reactor at a temperature of 130 °C and 2 MPa, with the flammability zone indicated by red. In Figure 4, the top point on the right side, i.e., the operating point, represents the composition of the reactor feed, which is well above both the flammability region and the limiting oxygen concentration (LOC) line. Combustion is not possible for any fuel concentration above the LOC line. The dilution of oxygen with an inert gas (in this case, nitrogen) not only improves the reaction yield of the DMC but also affords a lean mixture by maintaining the reactor influent composition outside the flammability region.

5. Process Development

Under the adopted reaction route, the DMC process comprises three key sections: oxidative carbonylation, conventional distillation, and pressure-swing azeotropic distillation. The block flow diagram (BFD) represents the compilation of the three sections, as shown in Figure 5. In the first section, the reaction is conducted in the presence of a heterogeneous catalyst.
The process feed consists of vaporized MeOH, CO, O2, and N2, and general plant support requires power generation and cooling water. In the conventional distillation section, MeOH and DMO are separated in the two columns from the reactor effluent stream. MeOH is recycled back to the reactor, and the DMO is purified as a byproduct. The following section describes the azeotropic separation between DMC and H2O for satisfying the target purity of DMC. The desired purities of both products—DMC and DMO—were set as > 99 mol%.

5.1. Process Flowsheet Simulation

The flowsheet of the process shown in Figure 6 was developed and simulated using CHEMCAD with UNIFAC as the thermodynamic model. UNIFAC is a widely utilized thermodynamic model that exploits structural groups for estimating component interactions [31].
The fresh feed streams are mixed with recycled MeOH and recycled gases (CO and N2) and combined in stream 6. Prior to heating the feed, the pressure of both the liquid and gases is increased to 2 MPa using the pump (P-101) and compressor (C-101), respectively. A heat exchanger (E-101) is used to heat the feed to the desired temperature of 130 °C (403 K), in accordance with the experiment performed by Fang et al. [14].
An inert gas N2 is essential for diluting the gaseous components, as indicated [14]. If N2 is fed with the raw materials, a purge is needed to avoid the buildup in the vessel as the inert is not consumed in the process. However, a purge stream would consist of toxic CO. Therefore, N2 is introduced to the reactor only once (in the beginning) and is then recycled within the process to avoid purging.
Subsequently, the reactor effluent is cooled and sent to a flash drum (V-101), where non-condensable gases are separated from products and MeOH. The non-condensable gases are recycled back and mixed with the fresh gaseous stream. The condensate stream, which contains DMC, MeOH, H2O, and DMO, is sent to the first distillation column. MeOH is separated as an overhead product in the first distillation column (T-101) and recycled back to be mixed with the fresh feed. The bottom stream is sent to a heat exchanger (E-105) before entering the second distillation. In the second distillation column (T-102), DMO is separated in the bottom stream with a purity of 99.9 mol%. The DMO is then cooled to be sent to a storage tank.

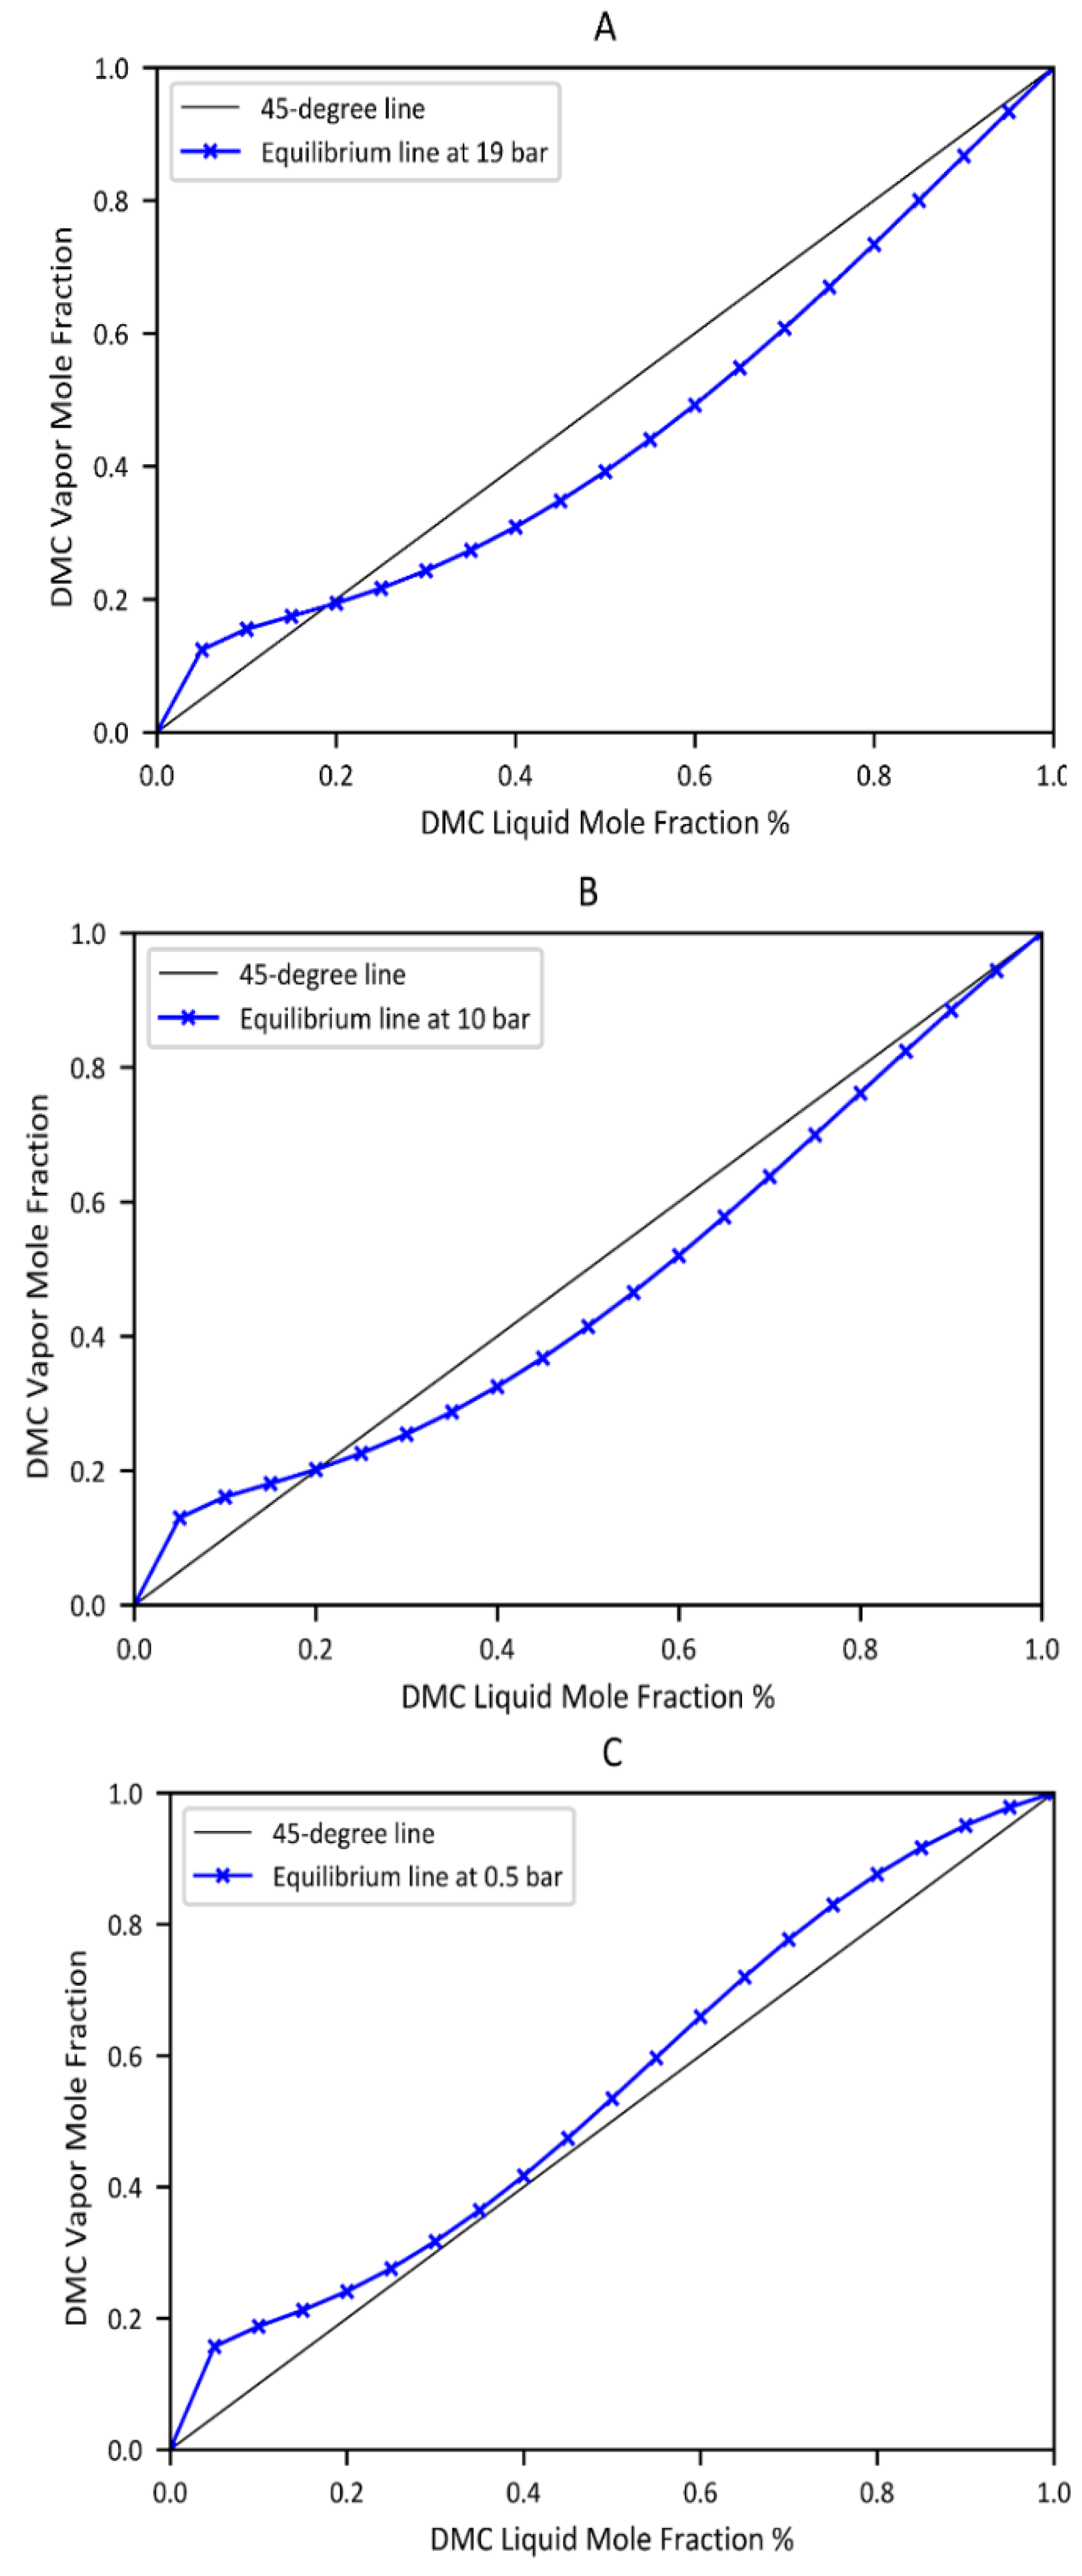
5.2. Separation of Azeotropic Mixture
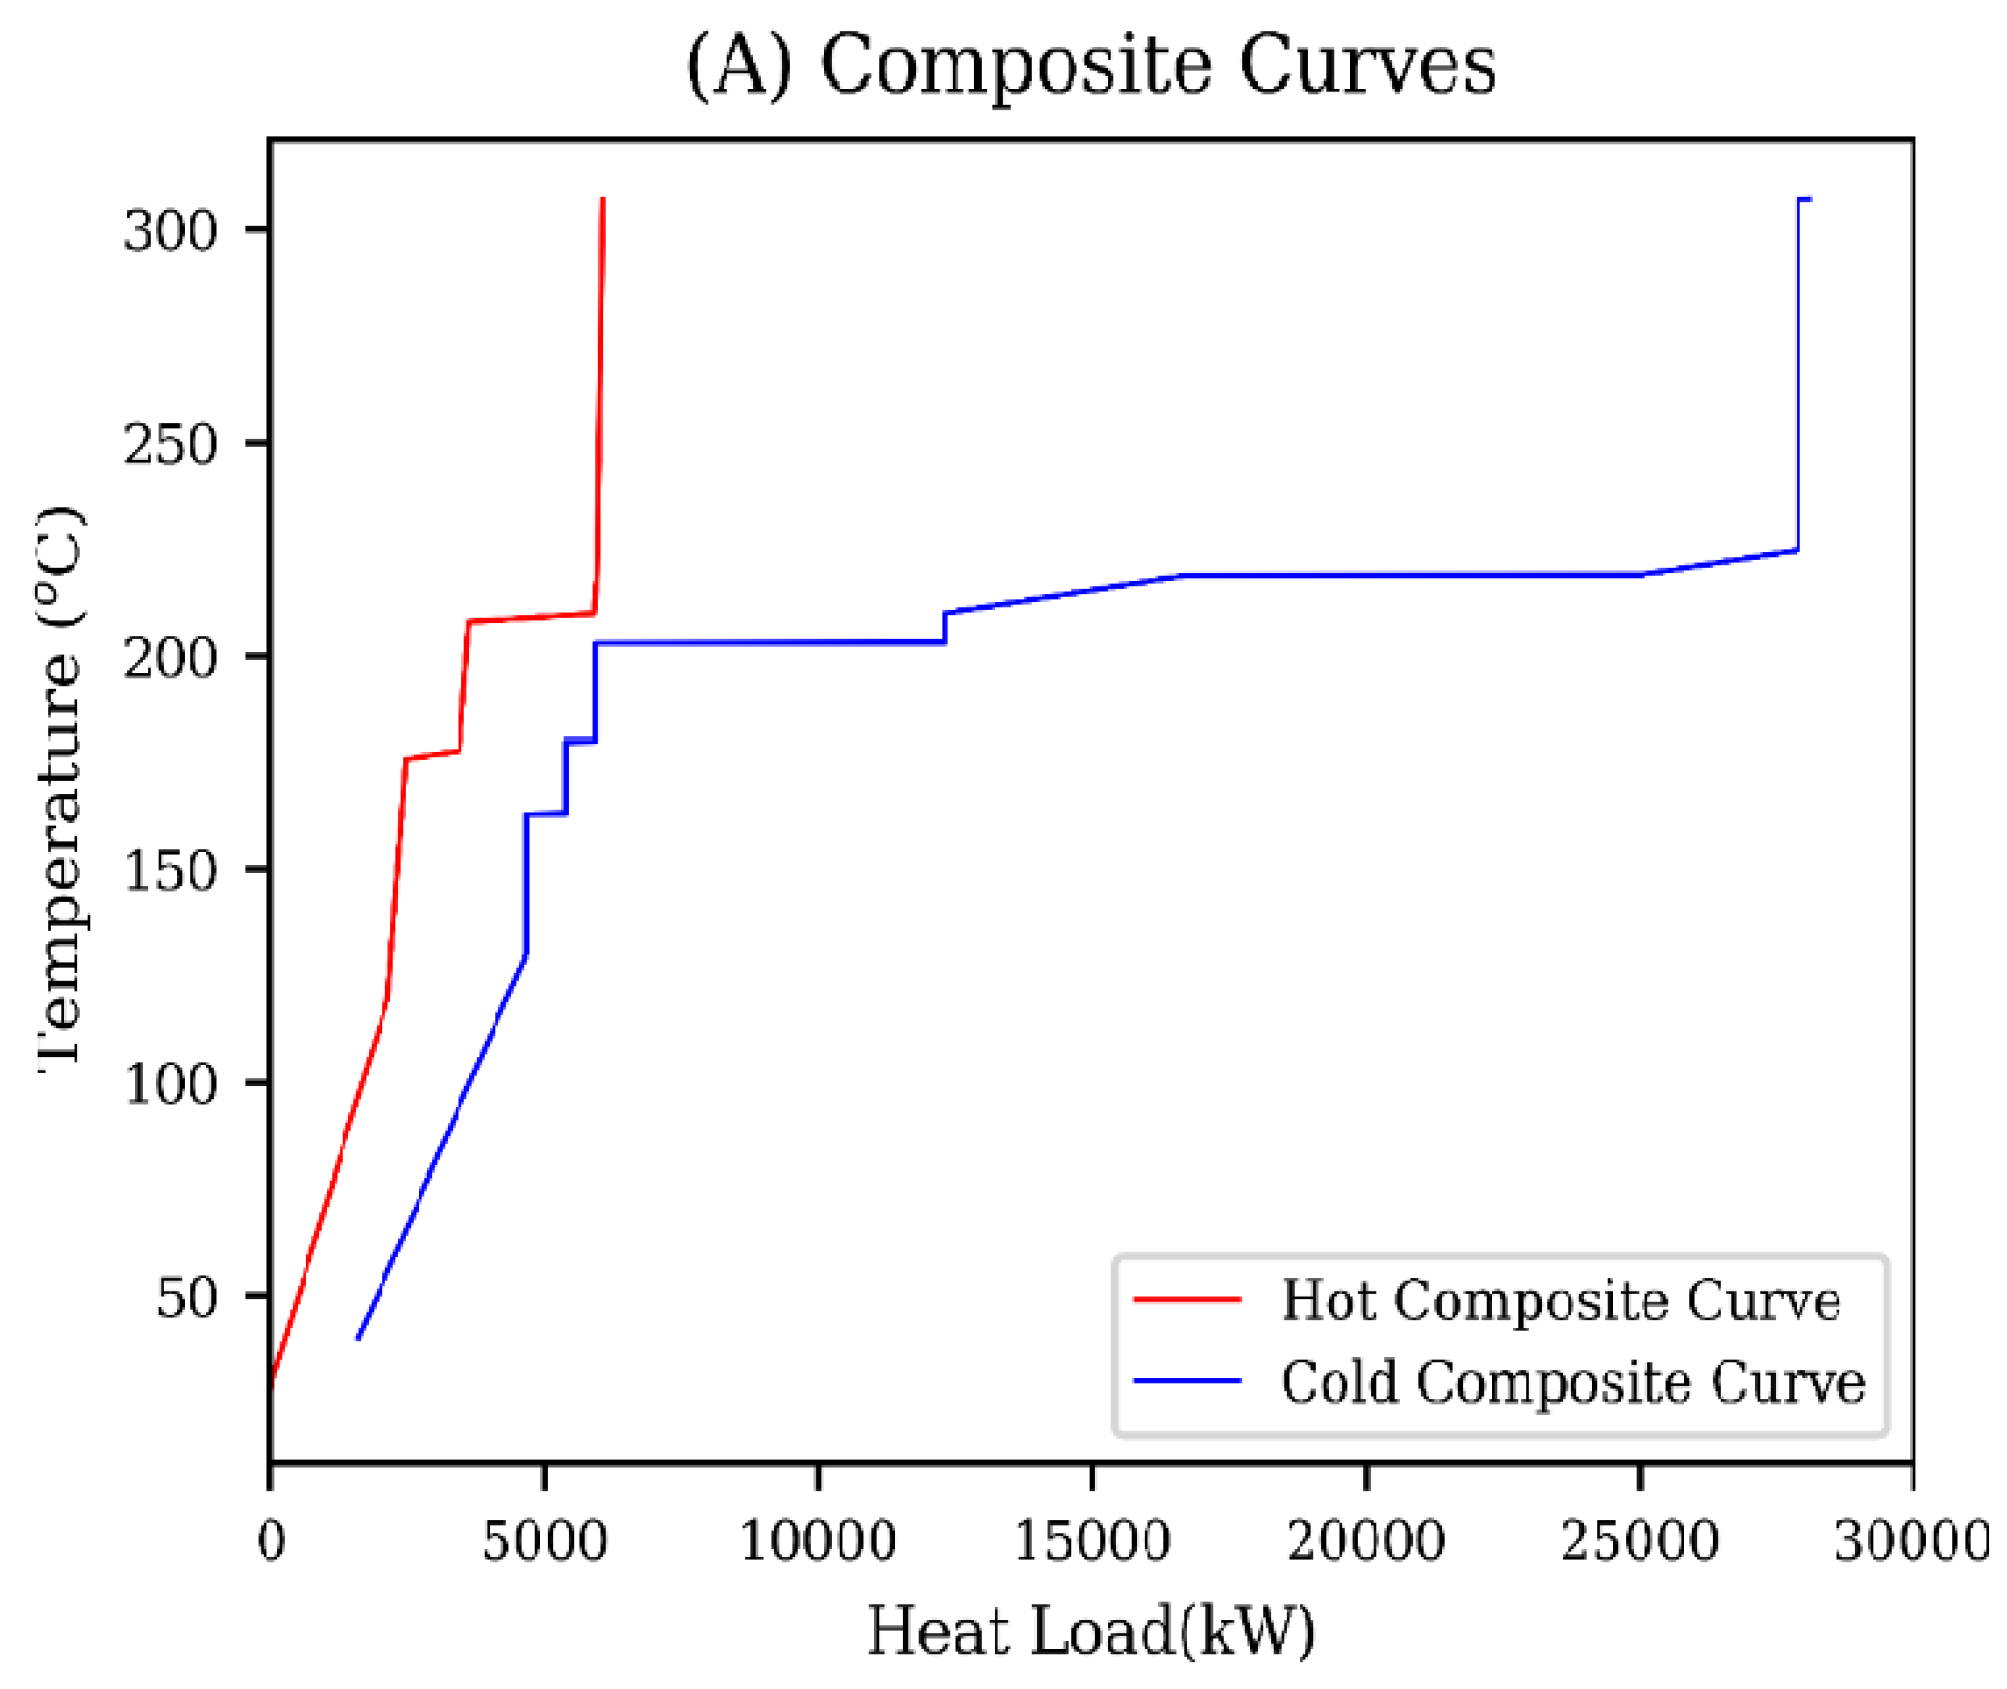
As shown in Figure 6, the pressure-swing technique is employed for the separation of the azeotropic mixture of DMC and H2O. DMC is separated as a bottom product in the distillation column (T-103), with a purity of approximately 99.78 mol%, while H2O is purified in the distillation column (T-104) in the bottom stream, with a purity of 99.96 mol%. The high purity of both streams eliminates the need for further purifications. The water stream is then sent to a wastewater treatment unit. The presence of azeotropes complicates the separation of mixtures by narrowing the feasible operation region of the vapor–liquid envelope.
In the first distillation column (T-101), an azeotropic mixture is formed between DMC and MeOH posing a common difficult and energy-intensive separation problem [32]. However, the availability of DMO and H2O in the stream entering the distillation column breaks the distillation boundaries restricted by the DMC-MeOH azeotrope and allows for extractive distillation. Additionally, DMC and H2O form an azeotropic mixture that requires the application of unconventional distillation techniques, such as pressure swing, to attain the desired separation [33].
In this process, the azeotrope between DMC and H2O occurs at 19 bar at a DMC composition of 19 mol%, as shown in Figure 7A. To perform the separation of DMC from H2O, the pressure must be reduced significantly (to <0.6 bar) for avoiding azeotropic separation, as illustrated in Figure 7C. However, this is impractical, as it would require vacuum distillation, which is mostly expensive to operate. The implementation of the pressure-swing technique is depicted in Figure 7. The technique allows for achieving a DMC purity of >99 mol% at the bottom of the distillation column (T-103), which is operated at 19 bar. The remaining DMC in the distillate stream (stream 22) has a mole fraction of approximately 19.3 mol%, which is slightly above the azeotropic point located around 19 mol% at 19 bar. This requires the distillation column to be followed by a valve for reducing the pressure of the mixture to a 10 bar, shifting the azeotropic point to a new composition of DMC at 20.50 mol%, as shown in Figure 7B. By shifting the azeotropic point, this pressure swing causes the DMC to act as the heavy component in column (T-103), and as the light key in the following column (T-104). The DMC- H2O mixture is then sent to another distillation column (T-104), which separates water in the bottom stream with a high purity of approximately 99.96 mol%. The overhead of the distillation column (T-104) is recycled back to the distillation column (T-103) after its pressure is increased back to 19 bar. A full stream table of the process is provided in Table 3. The main design variables and specifications for each of the DMC plant components are presented in Table 4.

6. Heat Integration

To address a new avenue for cost savings in this study, a preliminary heat integration study using the online pinch analysis tool developed by Umbach and Nitsche was investigated [34]. The pinch method involves a thermodynamic analysis of the process that determines the temperature above or below the degree of which heating and cooling utilities should be avoided in the process. The pinch temperature depends on the temperature difference between streams, as well as the flow rate of utilities and the process configuration [35].
The analysis is employed to build a network for exchanging heat between streams for minimizing the overall utility costs [36]. The underlying considerations for identifying the pinch temperature include the following: no heat passes over the pinch point, external heating input is only allowed above the pinch point, and external heating output is only permissible below the pinch point [37].
Using the online pinch analysis tool [34], the pinch temperature of the system was determined to be 213 °C (486.15 K). An allowable temperature difference (∆Tmin) of 10 °C. (∆Tmin) was measured to determine the minimum driving force allowed for the heat transfer; hence, this criterion defines the energy requirement of the process [38]. Figure 8A,B present composite curves of cold and hot streams with ∆Tmin = 10 °C. Both curves were shifted by ±5 °C to generate the pinch point. The grand composite curve in Figure 8C indicates the minimum required heating utilities (QHmin) and the minimum required cooling utilities (QCmin). The implementation of heat integration delivers energy savings of up to 28%. Further optimization of ∆Tmin can be applied to enhance the overall process integration. The utility cost can be further reduced if each stream is used more than once in stream-matching. Additionally, this preliminary heat integration does not incorporate the capital cost for the piping and heat exchanges required for the heat integration.

7. Profitability Analysis

In examining the viability of this new DMC production process, the capital cost was combined with the operating cost to determine the overall process cost and to evaluate the financial performance over a 10-year plant lifetime. Most methods for estimating the purchase cost ( C p ° ) are for the ambient operating pressure, with carbon steel as the construction material. For correcting the purchase cost in this scheme, two factors (FM and FP) were considered for the construction materials and operating pressures. Both factors were approximated using multiple established correlations [39].
Operating-cost calculations based on 330 working days per year with 35 days of shut down for maintenance and service (yearly working hours) were performed. To include the effect of economic inflation, the Chemical Engineering Plant Cost Index (CEPCI) was applied to scale the cost with respect to time. CEPCIs of approximately 607.5 for 2019 were assumed to account for inflation [40]. The fixed capital investment of this process is about USD 10.8 million and the cost of manufacturing is about USD 51.59 million.
A 10-year profitability analysis of the proposed process was performed, with the assumption of two years of construction before the plant is operated. The fixed capital investment (FCI) was divided equally between the first and second years of construction. By the end of the construction period, the working capital cost, which was assumed to be 15% of the FCI, was added. Starting from the third year, a five-year period of depreciation of the equipment was considered using the modified accelerated cost recovery system.
For an interest rate of 7%, a discounted cumulative cash flow (DCCF) diagram with respect to time was constructed, as shown in Figure 9. The plot also shows a comparison of the profitability of the process before and after the heat integration. The discounted payback period (DPP) represents the time when the initial investment will be recovered [39]. The implementation of heat integration caused the DPP to decrease significantly from 7 years to three years and seven months, as shown in Figure 9.
Furthermore, the net present value (NPV) increased from USD 5.48 million to USD 35.46 million by the end of the 10th year. An analysis of the profitability before and after the heat integration is presented in Table 5.
This includes the discounted cash flow rate of return (DCFROR), which represents the interest rate at which the project would break even. Table 5 also shows the present value ratio (PVR), which is the ratio between the positive and negative discounted cash flows. The economic evaluations indicate that the DMC production process is a profitable venture, and it highlights the impact of heat integration in optimizing the process through the minimization of the operating costs.

8. Conclusions

A novel configuration for the production of DMC via the oxidative carbonylation of MeOH with DMO as byproducts is proposed. A techno-economic evaluation of the process was performed to assess its applicability and feasibility. The analysis results suggest that this process achieves the target purities of the final products while generating high returns on the invested capital. A process flowsheet was developed and simulated using UNIFAC as the thermodynamic model. DMC and DMO were produced on a copper chloride catalyst in an isothermal FBR, reaching a MeOH conversion rate of 81.86% and a DMC selectivity of 83.47%. DMO was purified through conventional distillation at 99.9 mol%, and a 99.78 mol% pure DMC product was obtained via the pressure-swing technique, which was employed to separate the DMC-H2O azeotropic mixture. A profitability analysis for a 10-year plant lifetime indicated an NPV of USD 5.48 million and a payback period of seven years. To optimize the utility consumption, a preliminary heat integration was implemented, resulting in a 28% energy savings in the utilities and a reduction in the payback period to three years and seven months. The new process is considered green since it is environmentally friendly, produces a green byproduct in addition to the main product, and avoids the use of hazardous materials, as in the case of the phosgenation production method.

Author Contributions

Conceptualization, A.A.A.-R.; methodology, A.A.A.-R. and A.M.A.; software, A.A.A.-R., O.S.B., T.M.A., F.A.A. and M.S.A.; validation, A.A.A.-R., A.M.A., O.S.B., T.M.A., F.A.A. and M.S.A.; formal analysis, A.A.A.-R., A.M.A., O.S.B., T.M.A., F.A.A. and M.S.A.; investigation, A.A.A.-R., A.M.A., O.S.B., T.M.A., F.A.A. and M.S.A.; visualization, A.S.A., re-sources, A.A.A.-R.; data curation, A.A.A.-R.; writing—original draft preparation, A.A.A.-R., A.M.A., O.S.B., T.M.A., F.A.A. and M.S.A.; writing—review and editing, A.A.A.-R. and O.S.B.; visualization, A.A.A.-R. and A.S.A.; supervision, A.A.A.-R. and A.M.A.; project administration, A.A.A.-R.; funding acquisition, A.A.A.-R. All authors have read and agreed to the published version of the manuscript.

Funding

There is no external funding.

Data Availability Statement

Not applicable.

Acknowledgments

This project was supported by King Saud University, Deanship of Scientific Research, College of Engineering Research Center.

Conflicts of Interest

The authors declare no conflict of interest.

Nomenclature

AcCross-sectional area of the reactor (m2)
BoConstant that depends on the properties of the fixed bed (MPa/m)
CBMBare module cost
DpDiameter of particles in the bed (m)
D e , i Effective diffusivity (m2/s)
EActivation energy (J/mol)
FiMolar flow rate for each component (kmol/h)
F T O Total inlet flow rates (kmol/h)
FTTotal outlet flow rate (kmol/h)
G Superficial mass velocity ( kg / m 2 . s )
knConstant rate of reaction
k c , i Mass transfer coefficient (m/s)
PFinal pressure (MPa)
pi,nPartial pressure of components (MPa)
PoInitial pressure (2 MPa)
r n Reaction rate (mol∙g−1 h−1)
r n act Actual rates of reaction (mol∙g−1 h−1)
RUniversal gas constant (8.314 J∙mol−1 K−1)
TReaction temperature (403.15 K)
VVolume of the reactor (m3)
Greek letters
η Overall effectiveness factor
Φ Porosity of the catalyst
β i Biot number
ε Voidage of the reactor
μ Viscosity of the mixture (Pa∙s)
ρ c Inlet mixture density
Indices
iComponent
a, b, cPower exponents of the reaction rate equations
n Reaction number

References

  1. Varma, R.S. Greener and Sustainable Chemistry. Appl. Sci. 2014, 4, 493–497. [Google Scholar] [CrossRef] [Green Version]
  2. Crawford, S.E.; Hartung, T.; Hollert, H.; Mathes, B.; van Ravenzwaay, B.; Steger-Hartmann, T.; Studer, C.; Krug, H.F. Green Toxicology: A strategy for sustainable chemical and material development. Environ. Sci. Eur. 2017, 29, 16. [Google Scholar] [CrossRef] [PubMed] [Green Version]
  3. Wang, F.; Pu, Y.; Yang, J.; Wang, T.; Chen, L.; Zhao, N.; Xiao, F. Process design and economic optimization for the indirect synthesis of dimethyl carbonate from urea and methanol. Chin. J. Chem. Eng. 2018, 27, 1879–1887. [Google Scholar] [CrossRef]
  4. Tundo, P.; Selva, M. The Chemistry of Dimethyl Carbonate. Accounts Chem. Res. 2002, 35, 706–716. [Google Scholar] [CrossRef] [PubMed]
  5. Fiorani, G.; Perosa, A.; Selva, M. Dimethyl carbonate: A versatile reagent for a sustainable valorization of renewables. Green Chem. 2018, 20, 288–322. [Google Scholar] [CrossRef]
  6. Tan, H.-Z.; Wang, Z.-Q.; Xu, Z.-N.; Sun, J.; Xu, Y.-P.; Chen, Q.-S.; Chen, Y.; Guo, G.-C. Review on the synthesis of dimethyl carbonate. Catal. Today 2018, 316, 2–12. [Google Scholar] [CrossRef]
  7. Saada, R.; Aboelazayem, O.; Kellici, S.; Heil, T.; Morgan, D.; Lampronti, G.I.; Saha, B. Greener synthesis of dimethyl carbonate using a novel tin-zirconia/graphene nanocomposite catalyst. Appl. Catal. B Environ. 2018, 226, 451–462. [Google Scholar] [CrossRef] [Green Version]
  8. Ferrer, B.; Alvaro, M.; Garcia, H. Application of Dimethyl Carbonate as Solvent and Reagent; Springer: Cham, The Netherlands, 2012. [Google Scholar] [CrossRef]
  9. Park, J.H.; Jeon, J.Y.; Lee, J.J.; Jang, Y.; Varghese, J.K.; Lee, B.Y. Preparation of High-Molecular-Weight Aliphatic Polycarbonates by Condensation Polymerization of Diols and Dimethyl Carbonate. Macromolecules 2013, 46, 3301–3308. [Google Scholar] [CrossRef]
  10. Gift, J.S.; McGaughy, R.; Singh, D.V.; Sonawane, B. Health assessment of phosgene: Approaches for derivation of reference concentration. Regul. Toxicol. Pharmacol. 2008, 51, 98–107. [Google Scholar] [CrossRef] [PubMed]
  11. Kongpanna, P.; Pavarajarn, V.; Gani, R.; Assabumrungrat, S. Techno-economic evaluation of different CO2-based processes for dimethyl carbonate production. Chem. Eng. Res. Des. 2015, 93, 496–510. [Google Scholar] [CrossRef]
  12. Esan, A.O.; Adeyemi, A.D.; Ganesan, S. A review on the recent application of dimethyl carbonate in sustainable biodiesel production. J. Clean. Prod. 2020, 257, 120561. [Google Scholar] [CrossRef]
  13. Garcia-Herrero, I.; Cuéllar-Franca, R.M.; Enríquez-Gutiérrez, V.M.; Alvarez-Guerra, M.; Irabien, A.; Azapagic, A. Environmental Assessment of Dimethyl Carbonate Production: Comparison of a Novel Electrosynthesis Route Utilizing CO2 with a Commercial Oxidative Carbonylation Process. ACS Sustain. Chem. Eng. 2016, 4, 2088–2097. [Google Scholar] [CrossRef] [Green Version]
  14. Fang, D.; Cao, F. Intrinsic kinetics of direct oxidative carbonylation of vapour phase methanol to dimethyl carbonate over Cu-based catalysts. Chem. Eng. J. 2000, 78, 237–241. [Google Scholar] [CrossRef]
  15. Curnutt, G.L. Catalytic vapor phase process for producing dihydrocarbyl carbonates. U.S. Patent 5004827, 2 April 1991. [Google Scholar]
  16. Wang, J.; Fu, T.; Meng, F.; Zhao, D.; Chuang, S.S.; Li, Z. Highly active catalysis of methanol oxidative carbonylation over nano Cu2O supported on micropore-rich mesoporous carbon. Appl. Catal. B Environ. 2021, 303, 120890. [Google Scholar] [CrossRef]
  17. Ren, X.; Quan, Y.; Yang, W.; Zhao, J.; Shi, R.; Ren, J. Highly efficient super activated carbon supported ultra-low loading copper catalyst for the oxidative carbonylation of methanol to dimethyl carbonate. Mol. Catal. 2022, 531, 112694. [Google Scholar] [CrossRef]
  18. Lee, D.-H.; You, J.; Woo, J.-M.; Seo, J.Y.; Park, Y.C.; Lee, J.-S.; Kim, H.; Moon, J.-H.; Bin Park, S. Influence of dehydrating agents on the oxidative carbonylation of methanol for dimethyl carbonate synthesis over a Cu/Y-zeolite catalyst. Chin. J. Chem. Eng. 2018, 26, 1059–1063. [Google Scholar] [CrossRef]
  19. Li, Q.; Zhou, Z.; Chen, R.; Sun, B.; Qiao, L.; Yao, Y.; Wu, K. Insights into the reaction mechanism of CO oxidative coupling to dimethyl oxalate over palladium: A combined DFT and IR study. Phys. Chem. Chem. Phys. 2015, 17, 9126–9134. [Google Scholar] [CrossRef] [PubMed]
  20. Song, Y.; Zhang, J.; Lv, J.; Zhao, Y.; Ma, X. Hydrogenation of Dimethyl Oxalate over Copper-Based Catalysts: Acid–Base Properties and Reaction Paths. Ind. Eng. Chem. Res. 2015, 54, 9699–9707. [Google Scholar] [CrossRef]
  21. Zhu, Y.; Wang, S. Hydrogenation of dimethyl oxalate to ethylene glycol over Cu/SiO2 catalysts. In Proceedings of the 2011 International Conference on Electronics, Communications and Control (ICECC), Ningbo, China, 9–11 September 2011; pp. 4344–4347. [Google Scholar] [CrossRef]
  22. Niu, Y.; Li, C.; Shen, J.; Wei, X. Absorption of dilute sulfur dioxide in ethanediamine with ethylene glycol or polyethylene glycol 400 plus water system. J. Clean. Prod. 2018, 171, 506–511. [Google Scholar] [CrossRef]
  23. Kim, S.H.; Hong, S.H. Transfer Hydrogenation of Organic Formates and Cyclic Carbonates: An Alternative Route to Methanol from Carbon Dioxide. ACS Catal. 2014, 4, 3630–3636. [Google Scholar] [CrossRef]
  24. Lee, W.; Lee, J.W. Concurrent Production of Carbon Monoxide and Manganese(II) Oxide through the Reaction of Carbon Dioxide with Manganese. ACS Sustain. Chem. Eng. 2014, 2, 1503–1509. [Google Scholar] [CrossRef]
  25. Gmehling, J.; Möllmann, C. Synthesis of Distillation Processes Using Thermodynamic Models and the Dortmund Data Bank. Ind. Eng. Chem. Res. 1998, 37, 3112–3123. [Google Scholar] [CrossRef]
  26. Fredenslund, A.; Jones, R.L.; Prausnitz, J.M. Group-contribution estimation of activity coefficients in nonideal liquid mixtures. AIChE J. 1975, 21, 1086–1099. [Google Scholar] [CrossRef]
  27. Shen, W.F.; Benyounes, H.; Song, J. A review of ternary azeotropic mixtures advanced separation strategies. Theor. Found. Chem. Eng. 2016, 50, 28–40. [Google Scholar] [CrossRef] [Green Version]
  28. Fogler, H.S. Essentials of Chemical Reaction Engineering; Prentice-Hall: Upper Saddle River, NJ, USA, 2017. [Google Scholar]
  29. Zabetakis, M.G.; Scott, G.S.; Jones, G.W. Limits of Flammability of Paraffin Hydrocarbons in Air. Ind. Eng. Chem. 1951, 43, 2120–2124. [Google Scholar] [CrossRef]
  30. Chang, Y.-M.; Tseng, J.-M.; Shu, C.-M.; Hu, K.-H. Flammability studies of benzene and methanol with various vapor mixing ratios at 150 °C. Korean J. Chem. Eng. 2005, 22, 803–812. [Google Scholar] [CrossRef]
  31. Carlson, E.C. Don’t gamble with physical properties. Chem. Eng. Prog. 1996, 92, 35. [Google Scholar]
  32. Wei, H.-M.; Wang, F.; Zhang, J.-L.; Liao, B.; Zhao, N.; Xiao, F.-K.; Wei, W.; Sun, Y.-H. Design and Control of Dimethyl Carbonate–Methanol Separation via Pressure-Swing Distillation. Ind. Eng. Chem. Res. 2013, 52, 11463–11478. [Google Scholar] [CrossRef]
  33. Li, M.; Xu, X.; Li, X.; Ma, K.; Qin, B.; Zhu, Z.; Wang, Y. Phase Behavior and Thermodynamic Model Parameters in Simulations of Extractive Distillation for Azeotrope Separation. Sci. Rep. 2017, 7, 9497. [Google Scholar] [CrossRef] [PubMed]
  34. Umbach, J.S.; Nitsche, L.S. Online Pinch Analysis Tool Pinch Analysis. Available online: http://www.uic-che.org/pinch/ (accessed on 12 December 2021).
  35. Holtbruegge, J.; Kuhlmann, H.; Lutze, P. Process analysis and economic optimization of intensified process alternatives for simultaneous industrial scale production of dimethyl carbonate and propylene glycol. Chem. Eng. Res. Des. 2015, 93, 411–431. [Google Scholar] [CrossRef]
  36. El-Halwagi, M.M. Process Integration, 1st ed.; Elsevier: Oxford, UK, 2006; Volume 7. [Google Scholar]
  37. Olsen, D.; Abdelouadoud, Y.; Liem, P.; Wellig, B. The Role of Pinch Analysis for Industrial ORC Integration. Energy Procedia 2017, 129, 74–81. [Google Scholar] [CrossRef]
  38. Ebrada, L.C.; De Luna, M.D.G.; Manegdeg, F.G.; Grisdanurak, N. The effect of minimum temperature difference in the design and optimization of heat exchanger networks of a brewery based on Pinch Methodology. Lect. Notes Eng. Comput. Sci. 2014, 2, 952–957. [Google Scholar]
  39. Turton, R.; Bailie, R.C.; Whiting, W.B.; Shaeiwitz, J.A.; Bhattacharyya, D. Analysis, Synthesis, and Design of Chemical Processes; Pearson: Upper Saddle River, NJ, USA, 2012. [Google Scholar]
  40. Jenkins, S. 2019 Chemical Engineering Plant Cost Index Annual Average. 2020. Available online: https://www.chemengonline.com/2020-annual-cepci-average-value/ (accessed on 20 February 2022).
Figure 1. Ternary diagram showing the DMC-H2O and DMO-H2O azeotropes, along with the residue-curve map, for the distillation from the azeotropic points. The UNIFAC method was used for this calculation.
Processes 10 02094 g001
Figure 2. Schematic of the FBR and its specifications.
Processes 10 02094 g002
Figure 3. Molar composition of reactants and products along the reactor volume.
Processes 10 02094 g003
Figure 4. Fuel flammability diagram for the fuel/oxygen/nitrogen mixture at 130 °C and 2 MPa. The fuel mixture is solely composed of MeOH and CO.
Processes 10 02094 g004
Figure 5. Block flow diagram (BFD) for the production of DMC and DMO via the oxidative carbonylation of MeOH.
Processes 10 02094 g005
Figure 6. Process flow diagram (PFD) for the production of DMC and DMO via the oxidative carbonylation of MeOH.
Processes 10 02094 g006
Figure 7. VLE curves of DMC with H2O at constant pressures, obtained using the UNIFAC model. (AC) presents the equilibrium at 19, 10, and 0.5 bar, respectively.
Processes 10 02094 g007
Figure 8. Heat integration curves (A) cold and hot composite curves showing ∆Tmin and the process pinch temperature. (B) composite curves shifted by ±5 K. (C) grand composite curve, showing the minimum required heating utility (QHmin) and the minimum required cooling utility (QCmin).
Processes 10 02094 g008aProcesses 10 02094 g008b
Figure 9. DCCF with respect to time in a 10-year profitability analysis.
Processes 10 02094 g009
Table 1. Parameters of reaction kinetic models [14].
Reaction No.Constant Rate of Reaction
k   ( mol   g 1 h 1 )
Activation Energy,
E (J∙mol−1)
Power Exponents
a
b
c
10.3674 × 1070.1589 × 1051.402
0.953
0.005
20.1613 × 1050.4038 × 1040.728
1.031
0.172
Table 2. Results of flammability analysis for reactor influent.
ComponentVol.%YiLFL%
at 25 °C
UFL%
at 25 °C
LFL%
at 130 °C
UFL%
at 130 °C
LFL%
mix.
UFL%
mix.
MeOH31.210.367.336.006.7436.56--
CO55.520.6412.574.0011.3475.16--
O26.37-------
N26.90-------
Total100-----9.1083.62
Table 3. Stream information of the DMC and DMO coproduction process.
Stream No.1237911
Temperature (°C)2525251303038.4
Pressure (bar)1112019.220.3
Vapor mole fraction11010.60591
Total flow (kg/h)3830.41878.87525.127,20827,208.112,346.6
Total flow (kmol/h)136.858.7234.9920.5725439.4
Component flow rates (kmol/h)
O2058.7058.700
N2 00063.663.663.6
H2O0000.51180.4
CO136.800510.2373.4373.4
DMC0000.698.60.6
DMO000019.40
MeOH00234.9286.9521.4
Stream No.121314171820
Temperature (°C)55.3164.230225.2208.31.5
Pressure (bar)20.320.319.219.719.720
Vapor mole fraction0000.94800
Total flow (kg/h)9150.61625.514,861.513,23610,948.42287.6
Total flow (kmol/h)285.650.8285.6234.9215.519.4
Component flow rates (kmol/h)
O2000000
N2 000000
H2O0.10.1117.5117.4117.40
CO000000
DMC009898980
DMO0019.419.4019.4
MeOH285.550.750.7000
Stream No.2122242729
Temperature (°C)81.9201.130170.930
Pressure (bar)19191.5191.5
Vapor mole fraction00000
Total flow (kg/h)16,895.48065.58829.85949.22116.3
Total flow (kmol/h)348249.898.2132.6117.3
Component flow rates (kmol/h)
O200000
N2 00000
H2O195.6195.40.278.2117.3
CO00000
DMC146.248.39848.20
DMO00000
MeOH6.26.206.20
Table 4. Process main equipment design specifications.
ComponentsVariablesSpecifications
Reactor (R-101)TypeFBR
Volume 1.3 m3
Length1.5 m
Diameter0.53 m
Distillation column (T-101)Reflux ratio4.709
Number of stages44
Condenser duty−7508 MJ/h
Column diameter1.18 m
Distillation column (T-102)Reflux ratio0.4794
Number of stages28
Condenser duty−9326 MJ/h
Column diameter0.82 m
Distillation column (T-103)Reflux ratio6.18
Number of stages73
Condenser duty−57,863 MJ/h
Column diameter0.95 m
Distillation column (T-104)Reflux ratio0.52
Number of stages24
Condenser duty−6684 MJ/h
Column diameter0.6 m
Table 5. Process profitability analysis.
IndexBefore Process IntegrationAfter Process Integration
NPVUSD 5.48 millionUSD 35.46 million
Payback period7 years3.7 years
DCFROR17%56.4%
PVR1.44
Publisher’s Note: MDPI stays neutral with regard to jurisdictional claims in published maps and institutional affiliations.

